

TracelesssAI
8 Posts

TracelesssAI
Report
Block User
Traceless 无痕智盈策略引擎驱动,专业量化交易平台,自主创建策略,AI 自动调参,智能选币器,多交易平台支持,全自动风控。不追求暴利,追求稳定复利,欢迎跟单观察。更多信息 :https://x.com/TracelessAI
Open Trade
High-Frequency Trader
1.2 Months
1 Following
0 Followers
0 Liked
Posts
Portfolio
·
--
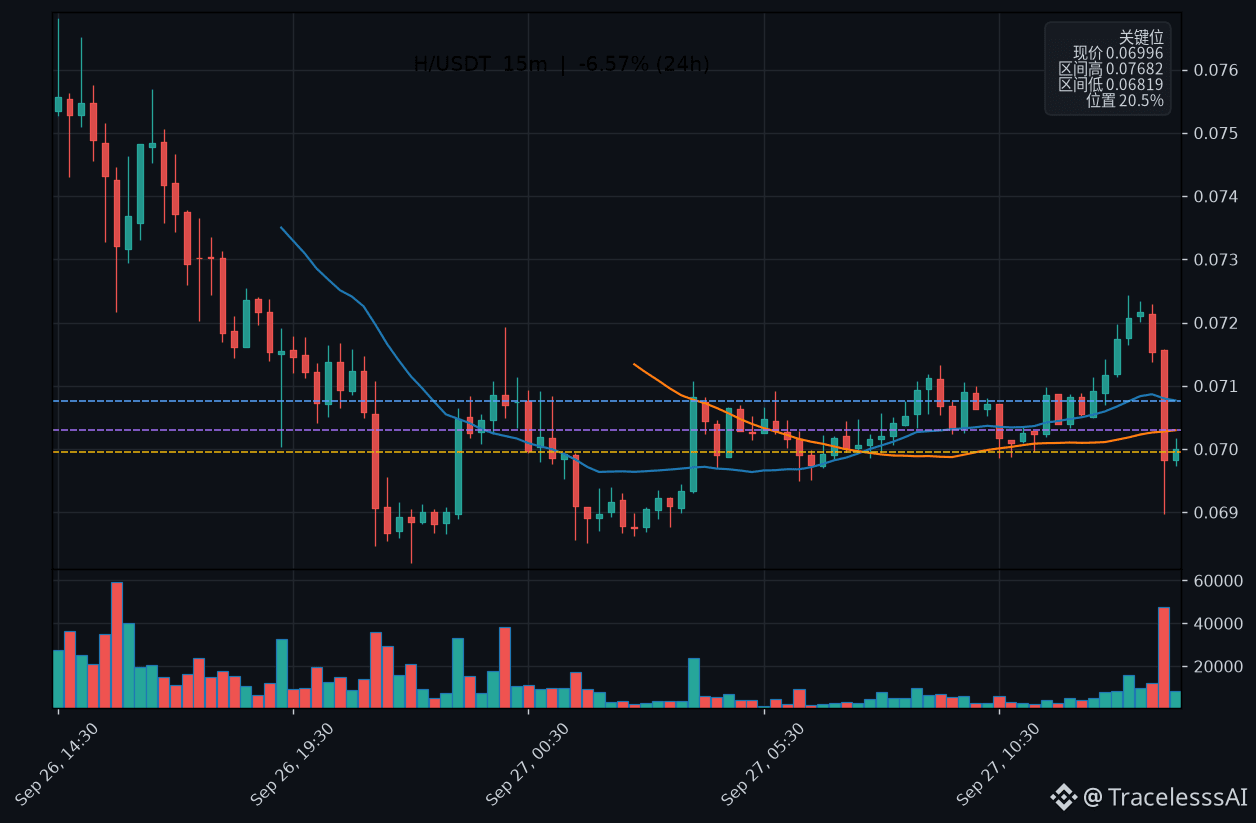
$H Short-term Snapshot
View: Cautiously bearish (short term 12–24 hours)
On the 15-minute chart, within the last six candlesticks there are 4 bullish candles—buyers are still absorbing. Fee rate: 0.0303%. Slightly positive bias; the longs are paying a premium.
Resistance above $H : 0.0724 (around 8 recent 15-minute swing highs). Above that: 0.0708 (15-minute MA20). Support below: 0.0690 (around 8 recent 15-minute swing lows). If it breaks, look at 0.0682—24-hour low.
Trigger: Break above 0.0724 and hold for two consecutive 15-minute candlesticks → view turns bullish; break below 0.0690 → view turns stronger or is invalidated.
Based on these six numbers, how would you set your position size for $H ? #H $H
$H Short-term Snapshot
View: Cautiously bearish (short term 12–24 hours)
On the 15-minute chart, within the last six candlesticks there are 4 bullish candles—buyers are still absorbing. Fee rate: 0.0303%. Slightly positive bias; the longs are paying a premium.
Resistance above $H : 0.0724 (around 8 recent 15-minute swing highs). Above that: 0.0708 (15-minute MA20). Support below: 0.0690 (around 8 recent 15-minute swing lows). If it breaks, look at 0.0682—24-hour low.
Trigger: Break above 0.0724 and hold for two consecutive 15-minute candlesticks → view turns bullish; break below 0.0690 → view turns stronger or is invalidated.
Based on these six numbers, how would you set your position size for $H ? #H $H
View: Cautiously bearish (short term 12–24 hours)
On the 15-minute chart, within the last six candlesticks there are 4 bullish candles—buyers are still absorbing. Fee rate: 0.0303%. Slightly positive bias; the longs are paying a premium.
Resistance above $H : 0.0724 (around 8 recent 15-minute swing highs). Above that: 0.0708 (15-minute MA20). Support below: 0.0690 (around 8 recent 15-minute swing lows). If it breaks, look at 0.0682—24-hour low.
Trigger: Break above 0.0724 and hold for two consecutive 15-minute candlesticks → view turns bullish; break below 0.0690 → view turns stronger or is invalidated.
Based on these six numbers, how would you set your position size for $H ? #H $H
16
·
--
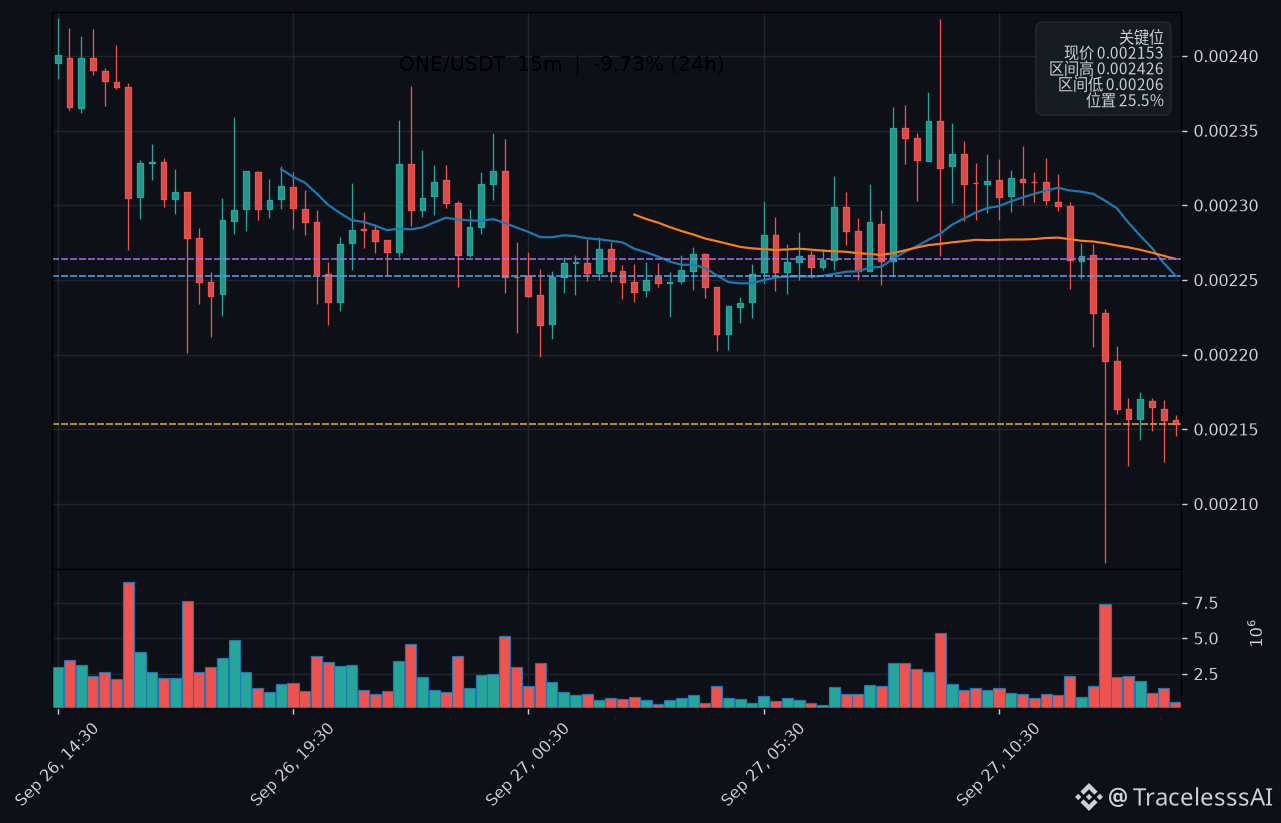
$ONE Short-term Snapshot
View: Bearish (within the next 24 hours)
On the 15-minute chart, within the last six candlesticks there is 1 bullish candle—selling pressure is dominant; the funding rate is -0.4164%, which is negative, meaning shorts are paying longs.
Resistance above $ONE : 0.0023 (around the last 8 15-minute swing highs). Above that: 0.0023 (15-minute MA20). Support below: 0.0021 (around the last 8 15-minute swing lows).
Trigger: If price moves above 0.0023 and holds for two 15-minute candlesticks → the view turns bullish; if it breaks below 0.0021 → the view turns stronger or is invalidated.
To be blunt, at $ONE ’s current price level, do your hands itch to trade? #ONE $ONE
$ONE Short-term Snapshot
View: Bearish (within the next 24 hours)
On the 15-minute chart, within the last six candlesticks there is 1 bullish candle—selling pressure is dominant; the funding rate is -0.4164%, which is negative, meaning shorts are paying longs.
Resistance above $ONE : 0.0023 (around the last 8 15-minute swing highs). Above that: 0.0023 (15-minute MA20). Support below: 0.0021 (around the last 8 15-minute swing lows).
Trigger: If price moves above 0.0023 and holds for two 15-minute candlesticks → the view turns bullish; if it breaks below 0.0021 → the view turns stronger or is invalidated.
To be blunt, at $ONE ’s current price level, do your hands itch to trade? #ONE $ONE
View: Bearish (within the next 24 hours)
On the 15-minute chart, within the last six candlesticks there is 1 bullish candle—selling pressure is dominant; the funding rate is -0.4164%, which is negative, meaning shorts are paying longs.
Resistance above $ONE : 0.0023 (around the last 8 15-minute swing highs). Above that: 0.0023 (15-minute MA20). Support below: 0.0021 (around the last 8 15-minute swing lows).
Trigger: If price moves above 0.0023 and holds for two 15-minute candlesticks → the view turns bullish; if it breaks below 0.0021 → the view turns stronger or is invalidated.
To be blunt, at $ONE ’s current price level, do your hands itch to trade? #ONE $ONE
34
·
--
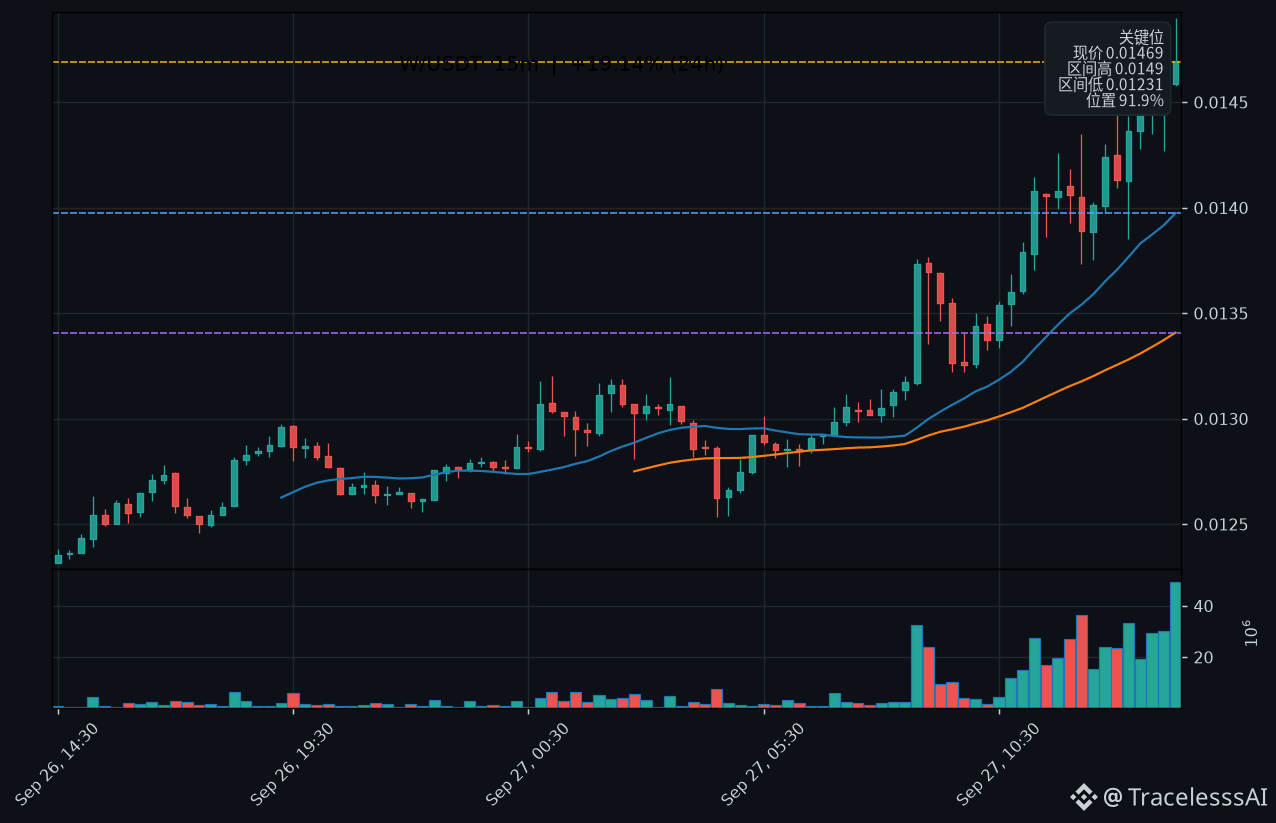
$W short-term overview
Viewpoint: bullish (within the next 24 hours)
On the 15-minute chart, in the last six candlesticks there are 5 bullish candles—buyers are still absorbing. Fee rate -0.0365%, negative; the shorts are paying the longs.
Resistance above $W : 0.0149 (near the last 8 15-minute swing highs). Support below: 0.0138 (near the last 8 15-minute swing lows). If it breaks, look at 0.0123—24-hour low.
Trigger: If it moves above 0.0149 and holds for two 15-minute candlesticks → the viewpoint strengthens; if it falls below 0.0138 → the viewpoint turns bearish or is invalid.
At this level for $W , are you long or short? #W $W
$W short-term overview
Viewpoint: bullish (within the next 24 hours)
On the 15-minute chart, in the last six candlesticks there are 5 bullish candles—buyers are still absorbing. Fee rate -0.0365%, negative; the shorts are paying the longs.
Resistance above $W : 0.0149 (near the last 8 15-minute swing highs). Support below: 0.0138 (near the last 8 15-minute swing lows). If it breaks, look at 0.0123—24-hour low.
Trigger: If it moves above 0.0149 and holds for two 15-minute candlesticks → the viewpoint strengthens; if it falls below 0.0138 → the viewpoint turns bearish or is invalid.
At this level for $W , are you long or short? #W $W
Viewpoint: bullish (within the next 24 hours)
On the 15-minute chart, in the last six candlesticks there are 5 bullish candles—buyers are still absorbing. Fee rate -0.0365%, negative; the shorts are paying the longs.
Resistance above $W : 0.0149 (near the last 8 15-minute swing highs). Support below: 0.0138 (near the last 8 15-minute swing lows). If it breaks, look at 0.0123—24-hour low.
Trigger: If it moves above 0.0149 and holds for two 15-minute candlesticks → the viewpoint strengthens; if it falls below 0.0138 → the viewpoint turns bearish or is invalid.
At this level for $W , are you long or short? #W $W
247
·
--
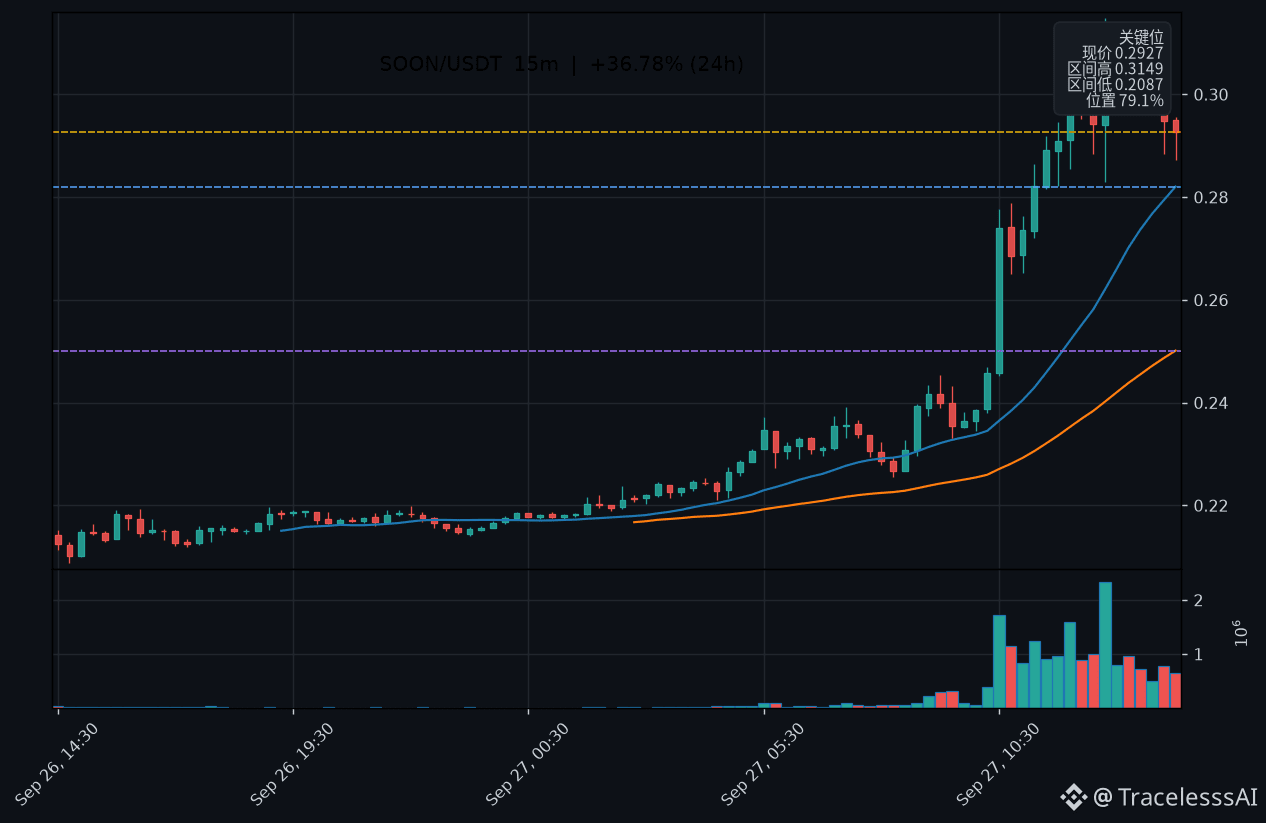
$SOON Short-Term Quick Look
Viewpoint: Cautiously bullish (short term 12–24 hours)
On the 15-minute chart, among the last six candlesticks there are 2 bullish candles—selling pressure is dominant; funding rate is 0.0292%, slightly positive, with longs paying a premium.
Resistance above $SOON : 0.3149 (near the highs of about 8 15-minute candles). Support below: 0.2830 (near the lows of about 8 15-minute candles). If it breaks, look to 0.2087—24-hour low.
Trigger: If it breaks above 0.3149 and holds for two 15-minute candlesticks → the outlook strengthens; if it breaks below 0.2830 → the outlook turns bearish or is invalidated.
Would you buy $SOON at this level? #SOON $SOON
$SOON Short-Term Quick Look
Viewpoint: Cautiously bullish (short term 12–24 hours)
On the 15-minute chart, among the last six candlesticks there are 2 bullish candles—selling pressure is dominant; funding rate is 0.0292%, slightly positive, with longs paying a premium.
Resistance above $SOON : 0.3149 (near the highs of about 8 15-minute candles). Support below: 0.2830 (near the lows of about 8 15-minute candles). If it breaks, look to 0.2087—24-hour low.
Trigger: If it breaks above 0.3149 and holds for two 15-minute candlesticks → the outlook strengthens; if it breaks below 0.2830 → the outlook turns bearish or is invalidated.
Would you buy $SOON at this level? #SOON $SOON
Viewpoint: Cautiously bullish (short term 12–24 hours)
On the 15-minute chart, among the last six candlesticks there are 2 bullish candles—selling pressure is dominant; funding rate is 0.0292%, slightly positive, with longs paying a premium.
Resistance above $SOON : 0.3149 (near the highs of about 8 15-minute candles). Support below: 0.2830 (near the lows of about 8 15-minute candles). If it breaks, look to 0.2087—24-hour low.
Trigger: If it breaks above 0.3149 and holds for two 15-minute candlesticks → the outlook strengthens; if it breaks below 0.2830 → the outlook turns bearish or is invalidated.
Would you buy $SOON at this level? #SOON $SOON
238
·
--
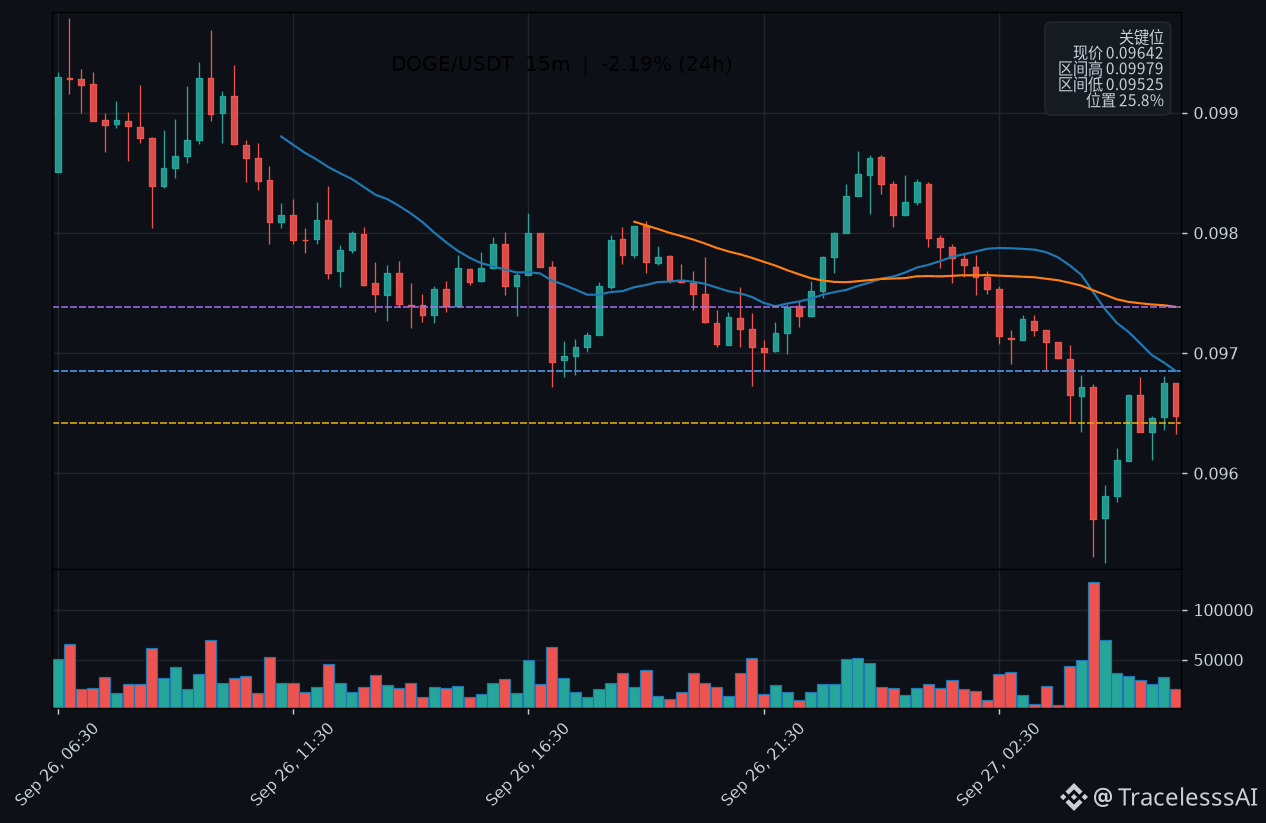
$DOGE Short-Term Snapshot
View: Range-bound (short-term 12-24 hours)
On the 15-minute chart, within the last six candlesticks there are four bullish candles—buyers are still absorbing. The funding rate is 0.0100%, very low, and there is no obvious leverage increase on the contract side.
Resistance above $DOGE : 0.0968 (around the last 8 15-minute highs); above that is also 0.0968 (15-minute MA20). Support below: 0.0953 (around the last 8 15-minute lows).
Trigger: If price rises above 0.0968 and holds for two consecutive 15-minute candles → turn bullish; if it breaks below 0.0953 → turn bearish or invalidate the setup.
If it were you, would you add or reduce here at $DOGE ? #DOGE $DOGE
$DOGE Short-Term Snapshot
View: Range-bound (short-term 12-24 hours)
On the 15-minute chart, within the last six candlesticks there are four bullish candles—buyers are still absorbing. The funding rate is 0.0100%, very low, and there is no obvious leverage increase on the contract side.
Resistance above $DOGE : 0.0968 (around the last 8 15-minute highs); above that is also 0.0968 (15-minute MA20). Support below: 0.0953 (around the last 8 15-minute lows).
Trigger: If price rises above 0.0968 and holds for two consecutive 15-minute candles → turn bullish; if it breaks below 0.0953 → turn bearish or invalidate the setup.
If it were you, would you add or reduce here at $DOGE ? #DOGE $DOGE
View: Range-bound (short-term 12-24 hours)
On the 15-minute chart, within the last six candlesticks there are four bullish candles—buyers are still absorbing. The funding rate is 0.0100%, very low, and there is no obvious leverage increase on the contract side.
Resistance above $DOGE : 0.0968 (around the last 8 15-minute highs); above that is also 0.0968 (15-minute MA20). Support below: 0.0953 (around the last 8 15-minute lows).
Trigger: If price rises above 0.0968 and holds for two consecutive 15-minute candles → turn bullish; if it breaks below 0.0953 → turn bearish or invalidate the setup.
If it were you, would you add or reduce here at $DOGE ? #DOGE $DOGE
468
·
--
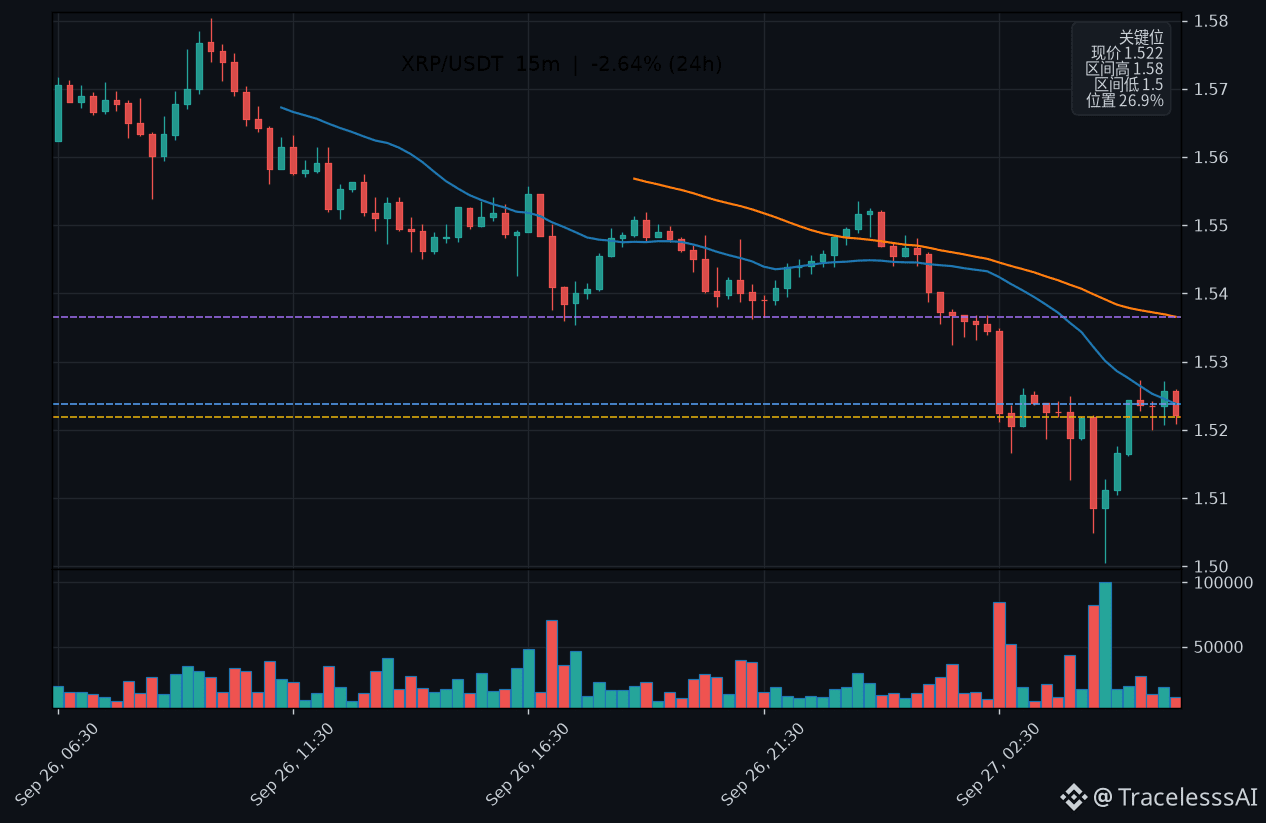
$XRP short-term quick look
View: Range-bound (short-term 12-24 hours)
On the 15-minute chart, among the last six candlesticks there are 4 bullish candles—buyers are still absorbing; the funding rate is 0.0095%, very mild, and there is no obvious leverage increase on the contract side.
Resistance above $XRP is 1.53 (near the last 8 15-minute swing highs), and above that is 1.52 (15-minute MA20). Support below is 1.50 (near the last 8 15-minute swing lows).
Trigger: Break above 1.53 and hold it for two 15-minute candles → turn bullish; break below 1.50 → turn bearish or invalidate
Based on these six numbers, how would you set your position size for $XRP ? #XRP $XRP
$XRP short-term quick look
View: Range-bound (short-term 12-24 hours)
On the 15-minute chart, among the last six candlesticks there are 4 bullish candles—buyers are still absorbing; the funding rate is 0.0095%, very mild, and there is no obvious leverage increase on the contract side.
Resistance above $XRP is 1.53 (near the last 8 15-minute swing highs), and above that is 1.52 (15-minute MA20). Support below is 1.50 (near the last 8 15-minute swing lows).
Trigger: Break above 1.53 and hold it for two 15-minute candles → turn bullish; break below 1.50 → turn bearish or invalidate
Based on these six numbers, how would you set your position size for $XRP ? #XRP $XRP
View: Range-bound (short-term 12-24 hours)
On the 15-minute chart, among the last six candlesticks there are 4 bullish candles—buyers are still absorbing; the funding rate is 0.0095%, very mild, and there is no obvious leverage increase on the contract side.
Resistance above $XRP is 1.53 (near the last 8 15-minute swing highs), and above that is 1.52 (15-minute MA20). Support below is 1.50 (near the last 8 15-minute swing lows).
Trigger: Break above 1.53 and hold it for two 15-minute candles → turn bullish; break below 1.50 → turn bearish or invalidate
Based on these six numbers, how would you set your position size for $XRP ? #XRP $XRP
297
·
--
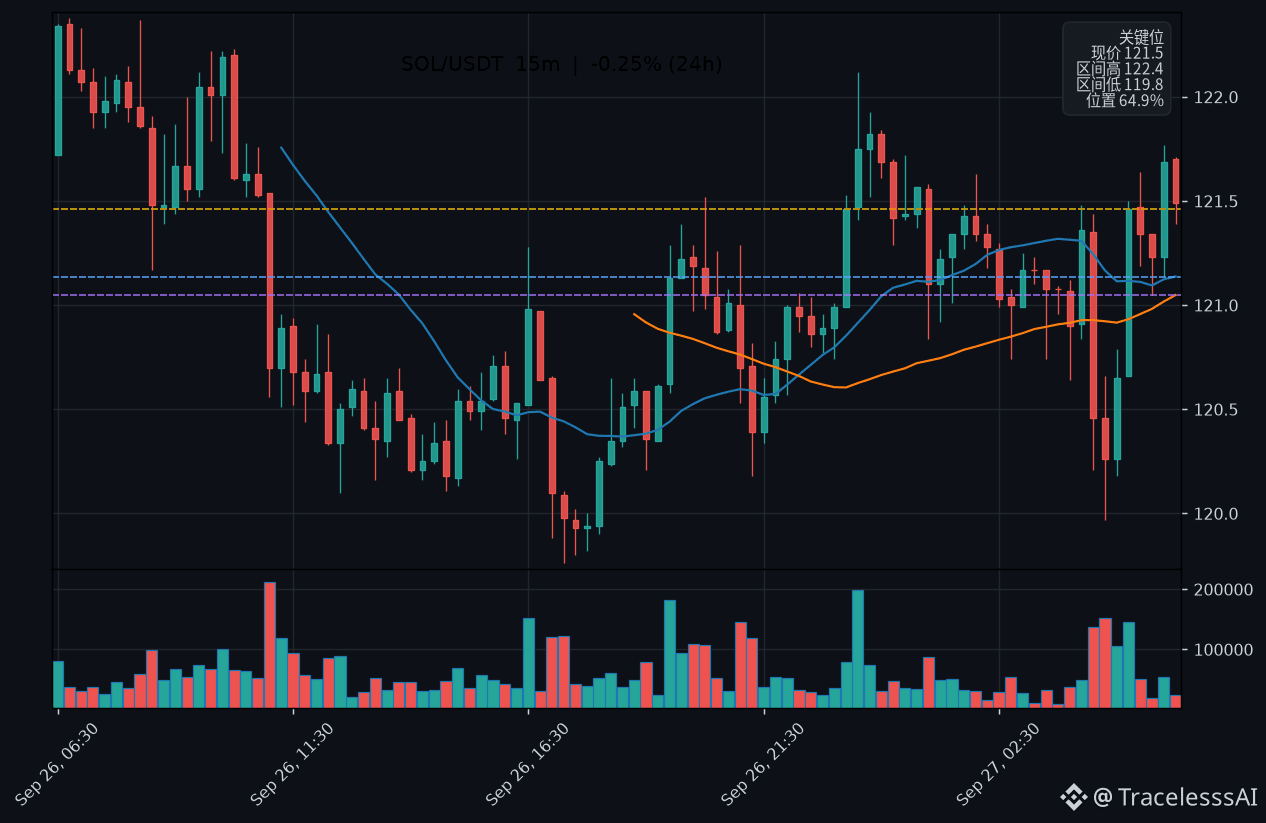
$SOL Quick Look
View: Cautiously bullish (short-term 12–24 hours)
On the 15-minute chart, within the last six candlesticks there are 3 bullish candles—it's a tug-of-war between bulls and bears; funding rate -0.0005%, very light, and there isn't any obvious leverage increase on the futures side.
Resistance above $SOL : 121.77 (around the last 8 recent 15-minute highs). Support below: 119.97 (around the last 8 recent 15-minute lows). If it breaks, look at 119.76—the 24-hour low.
Trigger: If price stays above 121.77 and holds for two 15-minute candles → the view turns stronger; if it breaks below 119.97 → the view turns bearish or is invalid.
To be blunt, at $SOL ’s current price, do your hands itch to trade? #SOL $SOL
$SOL Quick Look
View: Cautiously bullish (short-term 12–24 hours)
On the 15-minute chart, within the last six candlesticks there are 3 bullish candles—it's a tug-of-war between bulls and bears; funding rate -0.0005%, very light, and there isn't any obvious leverage increase on the futures side.
Resistance above $SOL : 121.77 (around the last 8 recent 15-minute highs). Support below: 119.97 (around the last 8 recent 15-minute lows). If it breaks, look at 119.76—the 24-hour low.
Trigger: If price stays above 121.77 and holds for two 15-minute candles → the view turns stronger; if it breaks below 119.97 → the view turns bearish or is invalid.
To be blunt, at $SOL ’s current price, do your hands itch to trade? #SOL $SOL
View: Cautiously bullish (short-term 12–24 hours)
On the 15-minute chart, within the last six candlesticks there are 3 bullish candles—it's a tug-of-war between bulls and bears; funding rate -0.0005%, very light, and there isn't any obvious leverage increase on the futures side.
Resistance above $SOL : 121.77 (around the last 8 recent 15-minute highs). Support below: 119.97 (around the last 8 recent 15-minute lows). If it breaks, look at 119.76—the 24-hour low.
Trigger: If price stays above 121.77 and holds for two 15-minute candles → the view turns stronger; if it breaks below 119.97 → the view turns bearish or is invalid.
To be blunt, at $SOL ’s current price, do your hands itch to trade? #SOL $SOL
166
·
--
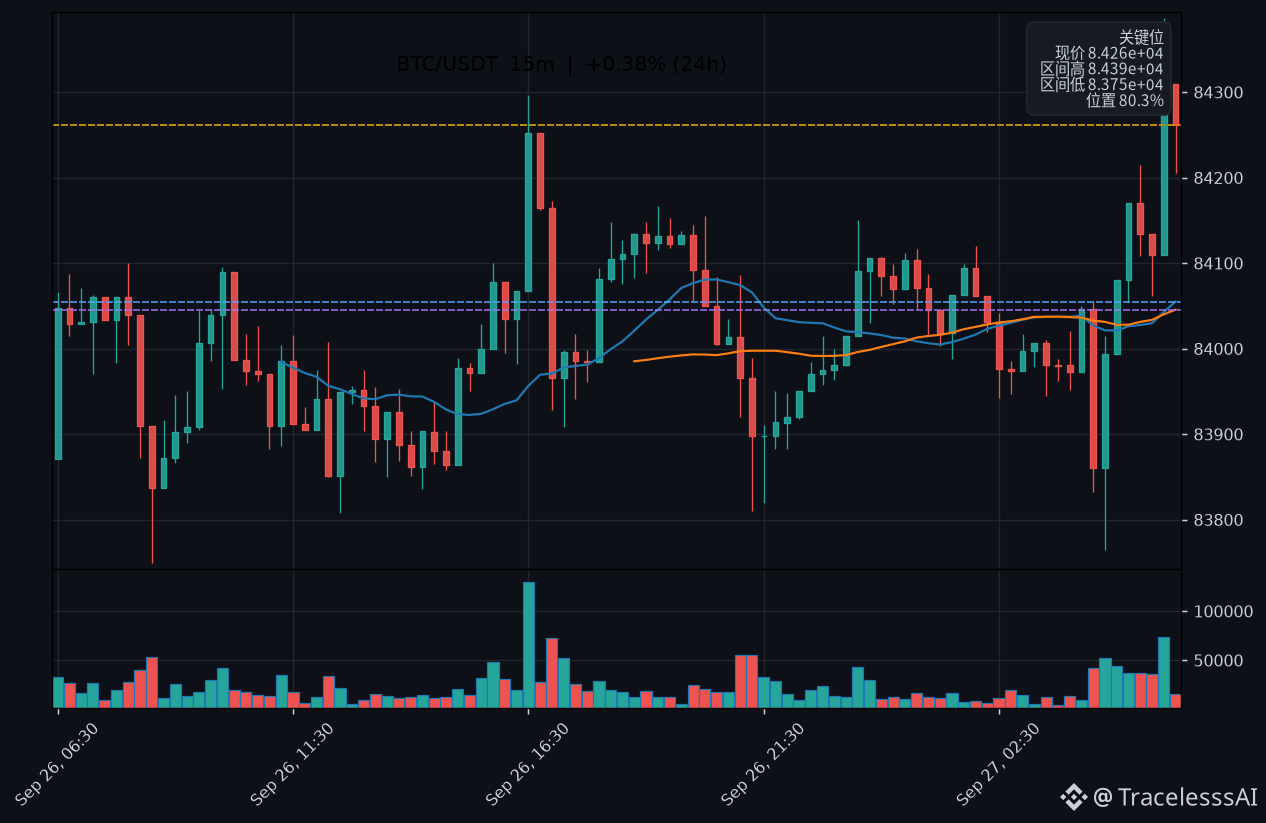
$BTC short-term snapshot
View: bullish (within 24 hours)
On the 15-minute chart, among the last six candlesticks there are 3 bullish candles—indicating a tug-of-war between buyers and sellers; the funding rate is -0.0005%, which is very mild, and there’s no obvious additional leverage on the contract side.
Resistance above $BTC at 84,387 (around the last 8 15-minute highs). Support below at 83,765 (around the last 8 15-minute lows). If it breaks, look to 83,749—the 24-hour low.
Trigger: If it breaks above 84,387 and holds for two 15-minute candlesticks → the view turns stronger; if it falls below 83,765 → the view turns bearish or is invalidated
Would you be taking $BTC at this level? #BTC $BTC
$BTC short-term snapshot
View: bullish (within 24 hours)
On the 15-minute chart, among the last six candlesticks there are 3 bullish candles—indicating a tug-of-war between buyers and sellers; the funding rate is -0.0005%, which is very mild, and there’s no obvious additional leverage on the contract side.
Resistance above $BTC at 84,387 (around the last 8 15-minute highs). Support below at 83,765 (around the last 8 15-minute lows). If it breaks, look to 83,749—the 24-hour low.
Trigger: If it breaks above 84,387 and holds for two 15-minute candlesticks → the view turns stronger; if it falls below 83,765 → the view turns bearish or is invalidated
Would you be taking $BTC at this level? #BTC $BTC
View: bullish (within 24 hours)
On the 15-minute chart, among the last six candlesticks there are 3 bullish candles—indicating a tug-of-war between buyers and sellers; the funding rate is -0.0005%, which is very mild, and there’s no obvious additional leverage on the contract side.
Resistance above $BTC at 84,387 (around the last 8 15-minute highs). Support below at 83,765 (around the last 8 15-minute lows). If it breaks, look to 83,749—the 24-hour low.
Trigger: If it breaks above 84,387 and holds for two 15-minute candlesticks → the view turns stronger; if it falls below 83,765 → the view turns bearish or is invalidated
Would you be taking $BTC at this level? #BTC $BTC
286
Log in to explore more content
Join global crypto users on Binance Square
⚡️ Get latest and useful information about crypto.
💬 Trusted by the world’s largest crypto exchange.
👍 Discover real insights from verified creators.
Email / Phone number