
The Cryptonomist
18.3k Posts

The Cryptonomist
 Square Verified+
Report
Block User
0 Following
38.0K+ Followers
22.6K+ Liked
1 Badges
Posts

Article
HSBC’s Brent crude price forecast jumps to $90 as Hormuz crisis drags onHSBC has sharply raised its Brent crude price forecast for 2026, lifting its outlook from $80 to $90 per barrel as the crisis in the Strait of Hormuz drags on with no resolution in sight. The bank’s senior oil analyst, Kim Fustier, said global oil markets are unlikely to find balance again until the middle of 2027, a timeline that points to months of tight supply and elevated prices ahead.
Key takeaways
HSBC raised its 2026 Brent crude forecast from $80 to $90 per barrel and its 2027 outlook from $65 to $85 per barrel.
Oil flows through the Strait of Hormuz have dropped to about 6 million barrels per day, roughly 30% of pre-conflict levels.
A US-Iran memorandum meant to stabilize transit through the strait collapsed in July 2026.
According to HSBC’s projections, flows are set to climb gradually, reaching 8 million bpd by the close of 2026 before hitting 9.5 million bpd by mid-2027.
Brent could spike to $120 per barrel if diplomatic efforts keep failing, before easing sometime in 2027.
HSBC Revises Brent Crude Price Forecast Amid Strait of Hormuz Crisis
HSBC’s revision marks one of the clearest signals yet that major banks now view the Hormuz disruption as a lasting feature of the oil market rather than a passing shock. The bank’s updated Brent crude price forecast reflects a market where supply constraints are expected to persist well into next year, not just through the current quarter.
2026 and 2027 Price Outlook Increases
The 2026 forecast climbed from $80 to $90 per barrel, but the more striking move came further out. HSBC also raised its 2027 Brent outlook to $85 per barrel, up sharply from a prior $65 estimate. That’s a $20 jump for a year in which, in calmer conditions, analysts might have expected prices to have already normalized. Looking further ahead, HSBC’s assumption for 2028 and beyond sits at $75 per barrel, suggesting the bank sees some cooling off eventually, but not a full return to the sub-$70 environment that prevailed before the crisis began.
Current Elevated Brent Prices Reflect Structural Supply Stress
Brent crude prices have climbed past $100 per barrel lately amid intensifying shipping attacks in the region, yet HSBC’s updated figures—though lower than current spot prices—reflect the bank’s outlook for where prices will land once the initial panic subsides. That distinction matters: a forecast below the current trading price isn’t a bet on relief so much as a signal that HSBC views today’s premium as partly driven by short-term volatility on top of a genuinely tighter underlying supply picture.
Impact of Strait of Hormuz Crisis on Global Oil Supply
The Strait of Hormuz oil crisis is the reason behind HSBC’s entire recalibration. This narrow waterway between Iran and Oman normally carries roughly a fifth of the world’s daily oil consumption, and its disruption has rewritten supply assumptions across the industry.
Supply Disruption and Diplomatic Setbacks
Oil flows through the strait have stabilized at around 6 million barrels per day, about 30% of pre-conflict levels, according to HSBC’s analysis. That collapse followed a failed diplomatic push: a US-Iran memorandum of understanding designed to stabilize transit through the strait fell apart in July 2026, removing the market’s main hope for a quick fix. Fustier’s note comes in the direct aftermath of that failure, and it explains why HSBC is no longer treating the disruption as temporary.
Why it matters: a fifth of global oil consumption depends on a waterway that is currently operating at less than a third of its normal throughput. Any further deterioration in the diplomatic relationship between Washington and Tehran could keep that bottleneck in place for far longer than markets initially priced in.
Projected Oil Flow Recovery Timeline
HSBC does still see a path back toward normal, just a slow one. By mid-2027, the bank projects flows will climb to 9.5 million bpd, following a gradual rise to 8 million bpd by the end of 2026. Even under that relatively optimistic trajectory, transit volumes would remain well below historical norms for more than a year, which is exactly why the bank pushed its 2027 forecast up so aggressively.
Potential Market Scenarios and Price Volatility Risks
HSBC’s global oil supply disruption scenario isn’t the only possible outcome, and the bank has laid out what happens if diplomacy keeps failing instead of stabilizing.
Price Spike Risks if Diplomatic Failures Persist
In a stalemate scenario, where negotiations keep collapsing and transit volumes stay depressed, Fustier’s analysis points to Brent surging as high as $120 per barrel before moderating sometime in 2027. That figure underscores how sensitive this market remains to political developments in the Gulf: a single failed round of talks, as seen in July 2026, was enough to force a $10 upward revision in the 2026 forecast alone.
Longer-Term Price Normalization Expectations
Beyond the immediate volatility, HSBC’s broader HSBC oil price outlook assumes the market eventually settles into a new, somewhat higher normal. The bank’s 2028-and-beyond assumption of $75 per barrel implies that even a resolved Hormuz crisis would leave a lasting mark on pricing, since rebuilding shipping confidence and restoring full transit volumes tends to take longer than the initial disruption itself. Until flows return closer to their pre-conflict baseline, oil markets are unlikely to rebalance, and HSBC’s own timeline for that puts the turning point around the middle of 2027.
FAQ
Why did HSBC raise its Brent crude price forecast for 2026?
HSBC raised its 2026 Brent crude price forecast because the crisis in the Strait of Hormuz remains unresolved, causing prolonged disruptions to global oil supply.
How much has oil flow through the Strait of Hormuz dropped?
Oil flows through the strait have dropped to around 6 million barrels per day, about 30% of the volume seen before the conflict began.
What is the outlook for oil flow recovery through the Strait of Hormuz?
HSBC expects oil flows to gradually recover to 8 million barrels per day by the end of 2026 and 9.5 million barrels per day by mid-2027.
What could happen if diplomatic efforts to stabilize oil transit continue to fail?
If diplomatic efforts keep failing, HSBC’s analysis suggests Brent crude prices could spike to $120 per barrel before moderating sometime in 2027.
Article produced with the assistance of artificial intelligence and reviewed by the editorial team.
HSBC’s Brent crude price forecast jumps to $90 as Hormuz crisis drags on
HSBC has sharply raised its Brent crude price forecast for 2026, lifting its outlook from $80 to $90 per barrel as the crisis in the Strait of Hormuz drags on with no resolution in sight. The bank’s senior oil analyst, Kim Fustier, said global oil markets are unlikely to find balance again until the middle of 2027, a timeline that points to months of tight supply and elevated prices ahead.
Key takeaways
HSBC raised its 2026 Brent crude forecast from $80 to $90 per barrel and its 2027 outlook from $65 to $85 per barrel.
Oil flows through the Strait of Hormuz have dropped to about 6 million barrels per day, roughly 30% of pre-conflict levels.
A US-Iran memorandum meant to stabilize transit through the strait collapsed in July 2026.
According to HSBC’s projections, flows are set to climb gradually, reaching 8 million bpd by the close of 2026 before hitting 9.5 million bpd by mid-2027.
Brent could spike to $120 per barrel if diplomatic efforts keep failing, before easing sometime in 2027.
HSBC Revises Brent Crude Price Forecast Amid Strait of Hormuz Crisis
HSBC’s revision marks one of the clearest signals yet that major banks now view the Hormuz disruption as a lasting feature of the oil market rather than a passing shock. The bank’s updated Brent crude price forecast reflects a market where supply constraints are expected to persist well into next year, not just through the current quarter.
2026 and 2027 Price Outlook Increases
The 2026 forecast climbed from $80 to $90 per barrel, but the more striking move came further out. HSBC also raised its 2027 Brent outlook to $85 per barrel, up sharply from a prior $65 estimate. That’s a $20 jump for a year in which, in calmer conditions, analysts might have expected prices to have already normalized. Looking further ahead, HSBC’s assumption for 2028 and beyond sits at $75 per barrel, suggesting the bank sees some cooling off eventually, but not a full return to the sub-$70 environment that prevailed before the crisis began.
Current Elevated Brent Prices Reflect Structural Supply Stress
Brent crude prices have climbed past $100 per barrel lately amid intensifying shipping attacks in the region, yet HSBC’s updated figures—though lower than current spot prices—reflect the bank’s outlook for where prices will land once the initial panic subsides. That distinction matters: a forecast below the current trading price isn’t a bet on relief so much as a signal that HSBC views today’s premium as partly driven by short-term volatility on top of a genuinely tighter underlying supply picture.
Impact of Strait of Hormuz Crisis on Global Oil Supply
The Strait of Hormuz oil crisis is the reason behind HSBC’s entire recalibration. This narrow waterway between Iran and Oman normally carries roughly a fifth of the world’s daily oil consumption, and its disruption has rewritten supply assumptions across the industry.
Supply Disruption and Diplomatic Setbacks
Oil flows through the strait have stabilized at around 6 million barrels per day, about 30% of pre-conflict levels, according to HSBC’s analysis. That collapse followed a failed diplomatic push: a US-Iran memorandum of understanding designed to stabilize transit through the strait fell apart in July 2026, removing the market’s main hope for a quick fix. Fustier’s note comes in the direct aftermath of that failure, and it explains why HSBC is no longer treating the disruption as temporary.
Why it matters: a fifth of global oil consumption depends on a waterway that is currently operating at less than a third of its normal throughput. Any further deterioration in the diplomatic relationship between Washington and Tehran could keep that bottleneck in place for far longer than markets initially priced in.
Projected Oil Flow Recovery Timeline
HSBC does still see a path back toward normal, just a slow one. By mid-2027, the bank projects flows will climb to 9.5 million bpd, following a gradual rise to 8 million bpd by the end of 2026. Even under that relatively optimistic trajectory, transit volumes would remain well below historical norms for more than a year, which is exactly why the bank pushed its 2027 forecast up so aggressively.
Potential Market Scenarios and Price Volatility Risks
HSBC’s global oil supply disruption scenario isn’t the only possible outcome, and the bank has laid out what happens if diplomacy keeps failing instead of stabilizing.
Price Spike Risks if Diplomatic Failures Persist
In a stalemate scenario, where negotiations keep collapsing and transit volumes stay depressed, Fustier’s analysis points to Brent surging as high as $120 per barrel before moderating sometime in 2027. That figure underscores how sensitive this market remains to political developments in the Gulf: a single failed round of talks, as seen in July 2026, was enough to force a $10 upward revision in the 2026 forecast alone.
Longer-Term Price Normalization Expectations
Beyond the immediate volatility, HSBC’s broader HSBC oil price outlook assumes the market eventually settles into a new, somewhat higher normal. The bank’s 2028-and-beyond assumption of $75 per barrel implies that even a resolved Hormuz crisis would leave a lasting mark on pricing, since rebuilding shipping confidence and restoring full transit volumes tends to take longer than the initial disruption itself. Until flows return closer to their pre-conflict baseline, oil markets are unlikely to rebalance, and HSBC’s own timeline for that puts the turning point around the middle of 2027.
FAQ
Why did HSBC raise its Brent crude price forecast for 2026?
HSBC raised its 2026 Brent crude price forecast because the crisis in the Strait of Hormuz remains unresolved, causing prolonged disruptions to global oil supply.
How much has oil flow through the Strait of Hormuz dropped?
Oil flows through the strait have dropped to around 6 million barrels per day, about 30% of the volume seen before the conflict began.
What is the outlook for oil flow recovery through the Strait of Hormuz?
HSBC expects oil flows to gradually recover to 8 million barrels per day by the end of 2026 and 9.5 million barrels per day by mid-2027.
What could happen if diplomatic efforts to stabilize oil transit continue to fail?
If diplomatic efforts keep failing, HSBC’s analysis suggests Brent crude prices could spike to $120 per barrel before moderating sometime in 2027.
Article produced with the assistance of artificial intelligence and reviewed by the editorial team.
Key takeaways
HSBC raised its 2026 Brent crude forecast from $80 to $90 per barrel and its 2027 outlook from $65 to $85 per barrel.
Oil flows through the Strait of Hormuz have dropped to about 6 million barrels per day, roughly 30% of pre-conflict levels.
A US-Iran memorandum meant to stabilize transit through the strait collapsed in July 2026.
According to HSBC’s projections, flows are set to climb gradually, reaching 8 million bpd by the close of 2026 before hitting 9.5 million bpd by mid-2027.
Brent could spike to $120 per barrel if diplomatic efforts keep failing, before easing sometime in 2027.
HSBC Revises Brent Crude Price Forecast Amid Strait of Hormuz Crisis
HSBC’s revision marks one of the clearest signals yet that major banks now view the Hormuz disruption as a lasting feature of the oil market rather than a passing shock. The bank’s updated Brent crude price forecast reflects a market where supply constraints are expected to persist well into next year, not just through the current quarter.
2026 and 2027 Price Outlook Increases
The 2026 forecast climbed from $80 to $90 per barrel, but the more striking move came further out. HSBC also raised its 2027 Brent outlook to $85 per barrel, up sharply from a prior $65 estimate. That’s a $20 jump for a year in which, in calmer conditions, analysts might have expected prices to have already normalized. Looking further ahead, HSBC’s assumption for 2028 and beyond sits at $75 per barrel, suggesting the bank sees some cooling off eventually, but not a full return to the sub-$70 environment that prevailed before the crisis began.
Current Elevated Brent Prices Reflect Structural Supply Stress
Brent crude prices have climbed past $100 per barrel lately amid intensifying shipping attacks in the region, yet HSBC’s updated figures—though lower than current spot prices—reflect the bank’s outlook for where prices will land once the initial panic subsides. That distinction matters: a forecast below the current trading price isn’t a bet on relief so much as a signal that HSBC views today’s premium as partly driven by short-term volatility on top of a genuinely tighter underlying supply picture.
Impact of Strait of Hormuz Crisis on Global Oil Supply
The Strait of Hormuz oil crisis is the reason behind HSBC’s entire recalibration. This narrow waterway between Iran and Oman normally carries roughly a fifth of the world’s daily oil consumption, and its disruption has rewritten supply assumptions across the industry.
Supply Disruption and Diplomatic Setbacks
Oil flows through the strait have stabilized at around 6 million barrels per day, about 30% of pre-conflict levels, according to HSBC’s analysis. That collapse followed a failed diplomatic push: a US-Iran memorandum of understanding designed to stabilize transit through the strait fell apart in July 2026, removing the market’s main hope for a quick fix. Fustier’s note comes in the direct aftermath of that failure, and it explains why HSBC is no longer treating the disruption as temporary.
Why it matters: a fifth of global oil consumption depends on a waterway that is currently operating at less than a third of its normal throughput. Any further deterioration in the diplomatic relationship between Washington and Tehran could keep that bottleneck in place for far longer than markets initially priced in.
Projected Oil Flow Recovery Timeline
HSBC does still see a path back toward normal, just a slow one. By mid-2027, the bank projects flows will climb to 9.5 million bpd, following a gradual rise to 8 million bpd by the end of 2026. Even under that relatively optimistic trajectory, transit volumes would remain well below historical norms for more than a year, which is exactly why the bank pushed its 2027 forecast up so aggressively.
Potential Market Scenarios and Price Volatility Risks
HSBC’s global oil supply disruption scenario isn’t the only possible outcome, and the bank has laid out what happens if diplomacy keeps failing instead of stabilizing.
Price Spike Risks if Diplomatic Failures Persist
In a stalemate scenario, where negotiations keep collapsing and transit volumes stay depressed, Fustier’s analysis points to Brent surging as high as $120 per barrel before moderating sometime in 2027. That figure underscores how sensitive this market remains to political developments in the Gulf: a single failed round of talks, as seen in July 2026, was enough to force a $10 upward revision in the 2026 forecast alone.
Longer-Term Price Normalization Expectations
Beyond the immediate volatility, HSBC’s broader HSBC oil price outlook assumes the market eventually settles into a new, somewhat higher normal. The bank’s 2028-and-beyond assumption of $75 per barrel implies that even a resolved Hormuz crisis would leave a lasting mark on pricing, since rebuilding shipping confidence and restoring full transit volumes tends to take longer than the initial disruption itself. Until flows return closer to their pre-conflict baseline, oil markets are unlikely to rebalance, and HSBC’s own timeline for that puts the turning point around the middle of 2027.
FAQ
Why did HSBC raise its Brent crude price forecast for 2026?
HSBC raised its 2026 Brent crude price forecast because the crisis in the Strait of Hormuz remains unresolved, causing prolonged disruptions to global oil supply.
How much has oil flow through the Strait of Hormuz dropped?
Oil flows through the strait have dropped to around 6 million barrels per day, about 30% of the volume seen before the conflict began.
What is the outlook for oil flow recovery through the Strait of Hormuz?
HSBC expects oil flows to gradually recover to 8 million barrels per day by the end of 2026 and 9.5 million barrels per day by mid-2027.
What could happen if diplomatic efforts to stabilize oil transit continue to fail?
If diplomatic efforts keep failing, HSBC’s analysis suggests Brent crude prices could spike to $120 per barrel before moderating sometime in 2027.
Article produced with the assistance of artificial intelligence and reviewed by the editorial team.
1
500

Article
Banca d’Italia orders crypto sanctions screening on every transfer, no exceptionsEvery crypto transfer moving through an Italian platform, no matter how small, must now clear a sanctions check — and Banca d’Italia wants to make absolutely sure that rule isn’t being quietly ignored. On September 7, the country’s central bank told licensed crypto-asset service providers, known as CASPs, to confirm that their crypto sanctions screening systems catch every single transaction, without exception for low-value transfers.
Key takeaways
Banca d’Italia ordered CASPs on Sept. 7 to verify that every crypto transfer undergoes sanctions screening, regardless of its value.
Firms were told to remove any minimum transaction threshold from their screening systems, since that could let small transfers slip through unchecked.
The underlying obligation isn’t new: it stems from European Banking Authority guidelines that became applicable in Italy on December 30, 2025.
Instant-payment screening exceptions granted to some payment providers do not apply to crypto transfers handled by CASPs.
Sanctions compliance runs separately from MiCA licensing — holding a MiCA authorization does not exempt a firm from these controls.
Banca d’Italia enforces sanctions screening on every crypto transfer
The message from the central bank was blunt: no transaction is too small to matter. Banca d’Italia instructed operators to screen originator and beneficiary information before executing individual crypto-asset transfers, and it made clear the requirement applies transaction by transaction, not just to activity above a certain size.
Sanctions screening required regardless of transfer size
According to a report carried through Borsa Italiana’s Radiocor service, the central bank asked operators to confirm their systems contain no threshold limiting which transfers actually get checked. In practical terms, that means a €1 transfer is treated with the same scrutiny as a much larger one — at least at the screening stage, since automated systems, not manual reviewers, typically perform the first-pass check.
No minimum transaction threshold allowed in screening systems
Why does this detail matter so much? Because a hidden threshold inside a screening tool could let a sanctioned individual dodge controls simply by keeping transfers small. Banca d’Italia specifically flagged this structuring risk: someone facing restrictions could split a larger sum into multiple smaller transactions designed to stay under an operator’s internal screening limit. Closing that gap is effectively the whole point of the September reminder.
Regulatory context and timeline of screening obligations
This isn’t a brand-new rule dropped on the industry overnight — it’s an existing obligation that regulators are now checking is actually working. The screening requirement traces back to European Banking Authority guidance covering internal policies, procedures and controls for enforcing EU and national restrictive measures.
European Banking Authority guidelines and national incorporation
Banca d’Italia incorporated that EBA guidance into national supervisory practice through Note No. 52, dated May 19, 2025. The note specifies that the guidelines became applicable in Italy on December 30, 2025 — meaning the screening obligation has technically been in force for months before the September communication. The rules apply broadly, covering banks, investment firms, payment institutions, electronic-money institutions and authorized crypto-asset service providers alike, all of which must maintain governance arrangements capable of identifying designated people and entities.
September 2025 communication as supervisory reminder
So why issue a reminder at all if the rule already existed? Banca d’Italia’s September note is best understood as a compliance check-in rather than new law — the central bank is essentially asking firms to prove their existing systems are correctly configured and calibrated, not announcing a fresh legal threshold.
Separation of sanctions compliance from MiCA authorization
One point the central bank stressed deserves attention from every crypto firm operating in the EU: sanctions compliance sits entirely outside the Markets in Crypto-Assets Regulation. MiCA governs licensing, governance and conduct standards, but earning that authorization does not remove obligations under EU restrictive-measures rules. This distinction matters even more at present, since national regulators are finalizing Europe’s shift to MiCA — as crypto.news reported earlier, over 1,000 crypto firms across the EEA still lacked MiCA authorization once a key transition deadline had passed. In other words, a firm can be fully licensed under MiCA and still fall short on sanctions controls — the two compliance tracks run on separate rails.
Operational implications for crypto-asset service providers
For CASPs, this reminder translates into concrete work: reviewing screening configurations, checking sanctions-list update frequency, and making sure no shortcut applies to crypto that was designed for faster-moving payment rails.
No instant-payment exceptions for crypto transfers
Under EU rules, certain instant credit transfers handled by traditional payment service providers get a different treatment — screening the entire customer base once a day, plus whenever new restrictive measures take effect, rather than checking every single transaction in real time. That approach exists because instant settlement leaves little room for transaction-by-transaction screening without undermining the point of instant payments. Banca d’Italia’s 2025 note is explicit, though: that exception does not cover crypto transfers processed by CASPs. Firms can’t apply an instant-payment style shortcut to crypto simply because a blockchain transaction settles fast — the EBA’s specific provisions on individual crypto-asset transfers still apply, and according to Crypto Briefing, payment service providers handling crypto flows are held to the same standard.
Comprehensive screening, the Travel Rule, and industry pressure
Alongside sanctions screening, Banca d’Italia instructed CASPs to follow the EBA’s separate Travel Rule guidance, which addresses missing or incomplete originator and beneficiary information attached to fund and crypto transfers. Together, these obligations put real operational pressure on compliance teams: they need frequently updated sanctions lists, systems that can match aliases and handle transliterated names, procedures for investigating alerts, and records that hold up under supervisory review. Blockchain addresses linked to sanctioned parties add another layer of difficulty, since name screening alone may miss exposure tied to a wallet address rather than a named individual — pushing some operators toward combining customer screening with blockchain analytics, even though attribution can shift and alerts don’t always point to a genuinely designated party.
This matters beyond Italy’s borders. The reminder also lands against a backdrop of expanding EU restrictive measures — related coverage from crypto.news noted that EU sanctions have targeted 14 crypto platforms and 94 financial institutions, widening the pool of counterparties compliance systems now need to recognize.
Banca d’Italia did not set a new compliance deadline, name specific CASPs under review, or announce penalties in its September note — any enforcement would follow a separate regulatory process based on how an individual operator’s controls actually perform. But the underlying message is clear: for Italian crypto operators, the next move is a documented review of screening settings, sanctions-list coverage and escalation procedures, because a MiCA license alone won’t prove those controls work on every single transfer.
FAQ
Are crypto transfers exempt from sanctions screening if the transaction value is low?
No. Banca d’Italia requires that every crypto transfer pass through sanctions screening regardless of transaction value.
Does the Banca d’Italia communication introduce new sanctions rules for crypto transfers?
No. The September 2025 communication is a supervisory reminder reinforcing existing European Banking Authority guidelines already in force in Italy.
Can crypto-asset service providers apply instant payment exceptions to crypto transfers?
No. Instant payment exceptions available to certain payment providers do not cover crypto transfers processed by CASPs.
Is sanctions compliance for crypto transfers covered by MiCA authorization?
No. Sanctions compliance is separate from MiCA authorization and must be independently observed by crypto firms.
Article produced with the assistance of artificial intelligence and reviewed by the editorial team.
Banca d’Italia orders crypto sanctions screening on every transfer, no exceptions
Every crypto transfer moving through an Italian platform, no matter how small, must now clear a sanctions check — and Banca d’Italia wants to make absolutely sure that rule isn’t being quietly ignored. On September 7, the country’s central bank told licensed crypto-asset service providers, known as CASPs, to confirm that their crypto sanctions screening systems catch every single transaction, without exception for low-value transfers.
Key takeaways
Banca d’Italia ordered CASPs on Sept. 7 to verify that every crypto transfer undergoes sanctions screening, regardless of its value.
Firms were told to remove any minimum transaction threshold from their screening systems, since that could let small transfers slip through unchecked.
The underlying obligation isn’t new: it stems from European Banking Authority guidelines that became applicable in Italy on December 30, 2025.
Instant-payment screening exceptions granted to some payment providers do not apply to crypto transfers handled by CASPs.
Sanctions compliance runs separately from MiCA licensing — holding a MiCA authorization does not exempt a firm from these controls.
Banca d’Italia enforces sanctions screening on every crypto transfer
The message from the central bank was blunt: no transaction is too small to matter. Banca d’Italia instructed operators to screen originator and beneficiary information before executing individual crypto-asset transfers, and it made clear the requirement applies transaction by transaction, not just to activity above a certain size.
Sanctions screening required regardless of transfer size
According to a report carried through Borsa Italiana’s Radiocor service, the central bank asked operators to confirm their systems contain no threshold limiting which transfers actually get checked. In practical terms, that means a €1 transfer is treated with the same scrutiny as a much larger one — at least at the screening stage, since automated systems, not manual reviewers, typically perform the first-pass check.
No minimum transaction threshold allowed in screening systems
Why does this detail matter so much? Because a hidden threshold inside a screening tool could let a sanctioned individual dodge controls simply by keeping transfers small. Banca d’Italia specifically flagged this structuring risk: someone facing restrictions could split a larger sum into multiple smaller transactions designed to stay under an operator’s internal screening limit. Closing that gap is effectively the whole point of the September reminder.
Regulatory context and timeline of screening obligations
This isn’t a brand-new rule dropped on the industry overnight — it’s an existing obligation that regulators are now checking is actually working. The screening requirement traces back to European Banking Authority guidance covering internal policies, procedures and controls for enforcing EU and national restrictive measures.
European Banking Authority guidelines and national incorporation
Banca d’Italia incorporated that EBA guidance into national supervisory practice through Note No. 52, dated May 19, 2025. The note specifies that the guidelines became applicable in Italy on December 30, 2025 — meaning the screening obligation has technically been in force for months before the September communication. The rules apply broadly, covering banks, investment firms, payment institutions, electronic-money institutions and authorized crypto-asset service providers alike, all of which must maintain governance arrangements capable of identifying designated people and entities.
September 2025 communication as supervisory reminder
So why issue a reminder at all if the rule already existed? Banca d’Italia’s September note is best understood as a compliance check-in rather than new law — the central bank is essentially asking firms to prove their existing systems are correctly configured and calibrated, not announcing a fresh legal threshold.
Separation of sanctions compliance from MiCA authorization
One point the central bank stressed deserves attention from every crypto firm operating in the EU: sanctions compliance sits entirely outside the Markets in Crypto-Assets Regulation. MiCA governs licensing, governance and conduct standards, but earning that authorization does not remove obligations under EU restrictive-measures rules. This distinction matters even more at present, since national regulators are finalizing Europe’s shift to MiCA — as crypto.news reported earlier, over 1,000 crypto firms across the EEA still lacked MiCA authorization once a key transition deadline had passed. In other words, a firm can be fully licensed under MiCA and still fall short on sanctions controls — the two compliance tracks run on separate rails.
Operational implications for crypto-asset service providers
For CASPs, this reminder translates into concrete work: reviewing screening configurations, checking sanctions-list update frequency, and making sure no shortcut applies to crypto that was designed for faster-moving payment rails.
No instant-payment exceptions for crypto transfers
Under EU rules, certain instant credit transfers handled by traditional payment service providers get a different treatment — screening the entire customer base once a day, plus whenever new restrictive measures take effect, rather than checking every single transaction in real time. That approach exists because instant settlement leaves little room for transaction-by-transaction screening without undermining the point of instant payments. Banca d’Italia’s 2025 note is explicit, though: that exception does not cover crypto transfers processed by CASPs. Firms can’t apply an instant-payment style shortcut to crypto simply because a blockchain transaction settles fast — the EBA’s specific provisions on individual crypto-asset transfers still apply, and according to Crypto Briefing, payment service providers handling crypto flows are held to the same standard.
Comprehensive screening, the Travel Rule, and industry pressure
Alongside sanctions screening, Banca d’Italia instructed CASPs to follow the EBA’s separate Travel Rule guidance, which addresses missing or incomplete originator and beneficiary information attached to fund and crypto transfers. Together, these obligations put real operational pressure on compliance teams: they need frequently updated sanctions lists, systems that can match aliases and handle transliterated names, procedures for investigating alerts, and records that hold up under supervisory review. Blockchain addresses linked to sanctioned parties add another layer of difficulty, since name screening alone may miss exposure tied to a wallet address rather than a named individual — pushing some operators toward combining customer screening with blockchain analytics, even though attribution can shift and alerts don’t always point to a genuinely designated party.
This matters beyond Italy’s borders. The reminder also lands against a backdrop of expanding EU restrictive measures — related coverage from crypto.news noted that EU sanctions have targeted 14 crypto platforms and 94 financial institutions, widening the pool of counterparties compliance systems now need to recognize.
Banca d’Italia did not set a new compliance deadline, name specific CASPs under review, or announce penalties in its September note — any enforcement would follow a separate regulatory process based on how an individual operator’s controls actually perform. But the underlying message is clear: for Italian crypto operators, the next move is a documented review of screening settings, sanctions-list coverage and escalation procedures, because a MiCA license alone won’t prove those controls work on every single transfer.
FAQ
Are crypto transfers exempt from sanctions screening if the transaction value is low?
No. Banca d’Italia requires that every crypto transfer pass through sanctions screening regardless of transaction value.
Does the Banca d’Italia communication introduce new sanctions rules for crypto transfers?
No. The September 2025 communication is a supervisory reminder reinforcing existing European Banking Authority guidelines already in force in Italy.
Can crypto-asset service providers apply instant payment exceptions to crypto transfers?
No. Instant payment exceptions available to certain payment providers do not cover crypto transfers processed by CASPs.
Is sanctions compliance for crypto transfers covered by MiCA authorization?
No. Sanctions compliance is separate from MiCA authorization and must be independently observed by crypto firms.
Article produced with the assistance of artificial intelligence and reviewed by the editorial team.
Key takeaways
Banca d’Italia ordered CASPs on Sept. 7 to verify that every crypto transfer undergoes sanctions screening, regardless of its value.
Firms were told to remove any minimum transaction threshold from their screening systems, since that could let small transfers slip through unchecked.
The underlying obligation isn’t new: it stems from European Banking Authority guidelines that became applicable in Italy on December 30, 2025.
Instant-payment screening exceptions granted to some payment providers do not apply to crypto transfers handled by CASPs.
Sanctions compliance runs separately from MiCA licensing — holding a MiCA authorization does not exempt a firm from these controls.
Banca d’Italia enforces sanctions screening on every crypto transfer
The message from the central bank was blunt: no transaction is too small to matter. Banca d’Italia instructed operators to screen originator and beneficiary information before executing individual crypto-asset transfers, and it made clear the requirement applies transaction by transaction, not just to activity above a certain size.
Sanctions screening required regardless of transfer size
According to a report carried through Borsa Italiana’s Radiocor service, the central bank asked operators to confirm their systems contain no threshold limiting which transfers actually get checked. In practical terms, that means a €1 transfer is treated with the same scrutiny as a much larger one — at least at the screening stage, since automated systems, not manual reviewers, typically perform the first-pass check.
No minimum transaction threshold allowed in screening systems
Why does this detail matter so much? Because a hidden threshold inside a screening tool could let a sanctioned individual dodge controls simply by keeping transfers small. Banca d’Italia specifically flagged this structuring risk: someone facing restrictions could split a larger sum into multiple smaller transactions designed to stay under an operator’s internal screening limit. Closing that gap is effectively the whole point of the September reminder.
Regulatory context and timeline of screening obligations
This isn’t a brand-new rule dropped on the industry overnight — it’s an existing obligation that regulators are now checking is actually working. The screening requirement traces back to European Banking Authority guidance covering internal policies, procedures and controls for enforcing EU and national restrictive measures.
European Banking Authority guidelines and national incorporation
Banca d’Italia incorporated that EBA guidance into national supervisory practice through Note No. 52, dated May 19, 2025. The note specifies that the guidelines became applicable in Italy on December 30, 2025 — meaning the screening obligation has technically been in force for months before the September communication. The rules apply broadly, covering banks, investment firms, payment institutions, electronic-money institutions and authorized crypto-asset service providers alike, all of which must maintain governance arrangements capable of identifying designated people and entities.
September 2025 communication as supervisory reminder
So why issue a reminder at all if the rule already existed? Banca d’Italia’s September note is best understood as a compliance check-in rather than new law — the central bank is essentially asking firms to prove their existing systems are correctly configured and calibrated, not announcing a fresh legal threshold.
Separation of sanctions compliance from MiCA authorization
One point the central bank stressed deserves attention from every crypto firm operating in the EU: sanctions compliance sits entirely outside the Markets in Crypto-Assets Regulation. MiCA governs licensing, governance and conduct standards, but earning that authorization does not remove obligations under EU restrictive-measures rules. This distinction matters even more at present, since national regulators are finalizing Europe’s shift to MiCA — as crypto.news reported earlier, over 1,000 crypto firms across the EEA still lacked MiCA authorization once a key transition deadline had passed. In other words, a firm can be fully licensed under MiCA and still fall short on sanctions controls — the two compliance tracks run on separate rails.
Operational implications for crypto-asset service providers
For CASPs, this reminder translates into concrete work: reviewing screening configurations, checking sanctions-list update frequency, and making sure no shortcut applies to crypto that was designed for faster-moving payment rails.
No instant-payment exceptions for crypto transfers
Under EU rules, certain instant credit transfers handled by traditional payment service providers get a different treatment — screening the entire customer base once a day, plus whenever new restrictive measures take effect, rather than checking every single transaction in real time. That approach exists because instant settlement leaves little room for transaction-by-transaction screening without undermining the point of instant payments. Banca d’Italia’s 2025 note is explicit, though: that exception does not cover crypto transfers processed by CASPs. Firms can’t apply an instant-payment style shortcut to crypto simply because a blockchain transaction settles fast — the EBA’s specific provisions on individual crypto-asset transfers still apply, and according to Crypto Briefing, payment service providers handling crypto flows are held to the same standard.
Comprehensive screening, the Travel Rule, and industry pressure
Alongside sanctions screening, Banca d’Italia instructed CASPs to follow the EBA’s separate Travel Rule guidance, which addresses missing or incomplete originator and beneficiary information attached to fund and crypto transfers. Together, these obligations put real operational pressure on compliance teams: they need frequently updated sanctions lists, systems that can match aliases and handle transliterated names, procedures for investigating alerts, and records that hold up under supervisory review. Blockchain addresses linked to sanctioned parties add another layer of difficulty, since name screening alone may miss exposure tied to a wallet address rather than a named individual — pushing some operators toward combining customer screening with blockchain analytics, even though attribution can shift and alerts don’t always point to a genuinely designated party.
This matters beyond Italy’s borders. The reminder also lands against a backdrop of expanding EU restrictive measures — related coverage from crypto.news noted that EU sanctions have targeted 14 crypto platforms and 94 financial institutions, widening the pool of counterparties compliance systems now need to recognize.
Banca d’Italia did not set a new compliance deadline, name specific CASPs under review, or announce penalties in its September note — any enforcement would follow a separate regulatory process based on how an individual operator’s controls actually perform. But the underlying message is clear: for Italian crypto operators, the next move is a documented review of screening settings, sanctions-list coverage and escalation procedures, because a MiCA license alone won’t prove those controls work on every single transfer.
FAQ
Are crypto transfers exempt from sanctions screening if the transaction value is low?
No. Banca d’Italia requires that every crypto transfer pass through sanctions screening regardless of transaction value.
Does the Banca d’Italia communication introduce new sanctions rules for crypto transfers?
No. The September 2025 communication is a supervisory reminder reinforcing existing European Banking Authority guidelines already in force in Italy.
Can crypto-asset service providers apply instant payment exceptions to crypto transfers?
No. Instant payment exceptions available to certain payment providers do not cover crypto transfers processed by CASPs.
Is sanctions compliance for crypto transfers covered by MiCA authorization?
No. Sanctions compliance is separate from MiCA authorization and must be independently observed by crypto firms.
Article produced with the assistance of artificial intelligence and reviewed by the editorial team.
10

Article
Global fintech funding surges to $103.1B, fueled by a $24.3B mega-dealGlobal fintech funding jumped to $103.1 billion across 2,100 deals in the first half of 2026, marking one of the strongest six-month stretches the sector has seen in years. The number comes from KPMG International’s latest Pulse of Fintech report, which tracks venture capital, private equity and merger activity worldwide. After a rough few years for fintech dealmaking, the figures suggest investors are once again willing to write big checks — but only for companies they see as proven winners.
Key takeaways
Global fintech investment climbed to $103.1 billion across 2,100 deals in H1 2026, up from $72.2 billion in H2 2025.
The Americas pulled in $86.9 billion, with the US alone accounting for $80.8 billion of that total.
M&A was the dominant investment type at $67.9 billion across 394 deals, including two acquisitions each worth more than $10 billion.
Venture capital investment reached $31.5 billion across 1,641 deals, putting VC on pace for a four-year high by year-end.
EMEA and ASPAC both saw funding decline compared to the second half of 2025, dragged down by regional economic and political uncertainty.
Global Fintech Funding Surges to $103.1 Billion in H1 2026
Fintech investment worldwide rose sharply from $72.2 billion in the second half of 2025 to $103.1 billion in the first half of 2026, according to KPMG. That growth was driven in large part by a single mega-deal: a $24.3 billion acquisition of a major global payments company, which alone reshaped the half-year total.
Deal volume told a different story. While the value of fintech deals climbed, the number of transactions stayed relatively subdued, a pattern KPMG says reflects investors concentrating their money on fintechs with proven business models rather than spreading bets across the market. If the current pace holds, 2026 could end up being the strongest year for fintech investment in four years.
This is one of the clearest signals yet that global fintech funding is entering a more selective phase. Rather than funding a wide field of early-stage startups, capital is flowing toward companies already recognized as category leaders — a shift that changes who gets funded and who gets left out.
Americas Lead Global Fintech Funding While EMEA and ASPAC See Declines
The Americas remained the clear engine of global fintech funding, with total investment in the region rising from $47.1 billion in the second half of 2025 to $86.9 billion in H1 2026. The United States alone contributed $80.8 billion of that figure, reinforcing its position as the benchmark market that other jurisdictions look to for fintech innovation.
The picture looked very different elsewhere. EMEA fintech investment fell from $18.0 billion in H2 2025 to $11.3 billion in H1 2026, a decline KPMG links to a mix of geopolitical and macroeconomic uncertainty, along with domestic political and tax-related concerns in the UK. Fintech companies in the region recorded 626 deals during the period.
ASPAC funding also softened, dropping from $7.1 billion to $4.6 billion across 350 deals. KPMG notes that these figures likely understate the full picture in the region, since China’s mature fintech market operates largely outside traditional VC, PE and M&A channels — much of its activity happens through internal corporate investment or strategic partnerships that don’t show up in standard deal-tracking data.
Why does this regional split matter? It points to a widening gap between markets where investors feel confident deploying large amounts of capital and markets still working through political or economic headwinds. For companies based in Europe or Asia-Pacific, raising money in 2026 may require looking further afield — or waiting for local conditions to stabilize.
Investment Types: M&A Dominates Amid High Venture Capital Activity
Mergers and acquisitions accounted for the single largest share of global fintech funding in H1 2026, totaling $67.9 billion across 394 deals. Two acquisitions each exceeding $10 billion drove much of that total. Cross-border M&A was especially notable, making up $20.2 billion of the half-year figure as corporates and fintechs pursued deals to expand their scale and capabilities across national borders.
Venture capital came in second, with $31.5 billion invested across 1,641 deals. That’s a slight dip from the second half of 2025, but KPMG says the current pace would still put VC investment on track for a four-year high by the close of 2026 — a notable recovery given how much VC activity had cooled in prior years.
Private equity also showed signs of life after a long quiet stretch. PE investment rose from $2.7 billion in H2 2025 to $3.6 billion in H1 2026, including an eleven-quarter high of $2.6 billion in the second quarter alone. PE deal volume climbed from 58 to 65 deals over the same period, even as both M&A and VC deal counts fell — a divergence that suggests private equity firms are becoming more active just as other investor types pull back on volume.
Corporate Venture Capital and Digital Assets Drive Emerging Fintech Segments
Corporate venture capital fintech investment reached $16.3 billion in H1 2026, putting it on pace for a four-year high by a wide margin — even though the number of CVC deals fell to its lowest level since 2017. KPMG attributes the surge to a growing sense of urgency among traditional corporates chasing operational efficiencies, alongside mature fintechs looking to broaden their offerings and scale up.
The digital assets space was especially attractive to corporate investors during the period, fueled largely by the venture arms of major crypto platforms and crypto infrastructure firms working to expand the broader digital assets ecosystem.
Anton Ruddenklau, Global Lead of Fintech and Innovation, Financial Services at KPMG International, described the shift this way: “After several years of contraction, fintech investment is clearly finding its footing again. While deal volumes remain muted, the increase in capital deployed, and the resurgence of exits, signal growing investor confidence, particularly around scalable platforms in digital assets and AI. As liquidity improves, we expect this renewed momentum to translate into stronger deal activity over the year ahead.”
On its own, digital assets investment totaled $11.1 billion across 467 deals in H1 2026. Compared with the full-year 2025 total of $21.9 billion across 1,335 deals, this figure represents a decline, yet it still exceeded the complete annual sums for 2023 and 2024. Despite accounting for less than half of total deal volume with 187 deals, the US contributed over half of worldwide digital assets investment, totaling $5.9 billion.
Among the biggest US digital assets transactions were a $1.2 billion funding round secured by a domestic prediction market and a $635 million seed round raised by a newly established national bank serving specialized sectors such as defense technology, computing infrastructure, and advanced manufacturing. Outside the US, a France-based on-chain lending network raised $175 million in the largest EMEA deal, while an Australia-based perpetual futures trading platform led ASPAC with a $150 million raise.
This concentration of capital in digital assets and crypto infrastructure underscores a broader trend: corporate venture capital fintech investment is increasingly treating blockchain-based finance as core infrastructure rather than a speculative side bet.
Sector-Specific Investment Trends: Regtech, Wealthtech and AI Fintech
Regtech held steady with $2.9 billion in global investment during H1 2026, a slightly stronger pace than the $4.8 billion recorded across all of 2025 — even as deal volume, at 133 deals, dropped to its lowest level since 2017. The Americas attracted the bulk of regtech funding and hosted the three largest deals of the half: a $385 million raise by a tax-compliant savings platform, a $200 million raise by an AI-powered AML/KYC risk intelligence company, and a $178.1 million acquisition of a Brazil-based B2B banking and risk management technology firm. In EMEA, a UK-based blockchain analytics and crypto compliance company led with a $120 million VC raise, while a China-based global trade payments and risk management firm topped ASPAC with $70 million.
Wealthtech told the opposite story. Investment in the space stayed remarkably soft, with just 32 deals accounting for $220 million globally — a steep drop from the $1.4 billion across 74 deals recorded during all of 2025. If that weak trend continues, wealthtech could see its lowest investment level since 2018. Deal sizes reflected the caution: the largest transaction was a $42.5 million private equity growth round for a US-based asset management platform, and the biggest EMEA raise was just $13.9 million, from a Denmark-based wealth management operating platform.
AI-related fintech deals, meanwhile, continued to draw serious money. These deals attracted $21.4 billion across 800 deals in H1 2026 — just shy of the $23.6 billion recorded during the entirety of 2025. In the Americas, particularly the US and Canada, AI remained a dominant investment theme as investors chased efficiencies in areas like fraud prevention and AI-enabled payments.
Taken together, these sector splits show a fintech market that isn’t rewarding capital evenly. Regtech and AI are holding investor attention because they solve immediate operational problems for banks and corporates. Wealthtech, by contrast, appears to be struggling to make the same case to investors right now.
FAQ
What was the total global fintech investment in the first half of 2026?
Global fintech investment reached $103.1 billion across 2,100 deals in H1 2026.
Which region led fintech investment in H1 2026 and what was its contribution?
The Americas led fintech funding with $86.9 billion, with the US contributing $80.8 billion.
What types of investments dominated fintech funding in H1 2026?
Mergers and acquisitions accounted for the largest share, $67.9 billion across 394 deals, including two acquisitions valued over $10 billion.
How significant was investment in digital assets and AI fintech sectors?
Digital assets attracted $11.1 billion across 467 deals, with the US accounting for over half, while AI-related fintech deals raised $21.4 billion across 800 deals.
Article produced with the assistance of artificial intelligence and reviewed by the editorial team.
Global fintech funding surges to $103.1B, fueled by a $24.3B mega-deal
Global fintech funding jumped to $103.1 billion across 2,100 deals in the first half of 2026, marking one of the strongest six-month stretches the sector has seen in years. The number comes from KPMG International’s latest Pulse of Fintech report, which tracks venture capital, private equity and merger activity worldwide. After a rough few years for fintech dealmaking, the figures suggest investors are once again willing to write big checks — but only for companies they see as proven winners.
Key takeaways
Global fintech investment climbed to $103.1 billion across 2,100 deals in H1 2026, up from $72.2 billion in H2 2025.
The Americas pulled in $86.9 billion, with the US alone accounting for $80.8 billion of that total.
M&A was the dominant investment type at $67.9 billion across 394 deals, including two acquisitions each worth more than $10 billion.
Venture capital investment reached $31.5 billion across 1,641 deals, putting VC on pace for a four-year high by year-end.
EMEA and ASPAC both saw funding decline compared to the second half of 2025, dragged down by regional economic and political uncertainty.
Global Fintech Funding Surges to $103.1 Billion in H1 2026
Fintech investment worldwide rose sharply from $72.2 billion in the second half of 2025 to $103.1 billion in the first half of 2026, according to KPMG. That growth was driven in large part by a single mega-deal: a $24.3 billion acquisition of a major global payments company, which alone reshaped the half-year total.
Deal volume told a different story. While the value of fintech deals climbed, the number of transactions stayed relatively subdued, a pattern KPMG says reflects investors concentrating their money on fintechs with proven business models rather than spreading bets across the market. If the current pace holds, 2026 could end up being the strongest year for fintech investment in four years.
This is one of the clearest signals yet that global fintech funding is entering a more selective phase. Rather than funding a wide field of early-stage startups, capital is flowing toward companies already recognized as category leaders — a shift that changes who gets funded and who gets left out.
Americas Lead Global Fintech Funding While EMEA and ASPAC See Declines
The Americas remained the clear engine of global fintech funding, with total investment in the region rising from $47.1 billion in the second half of 2025 to $86.9 billion in H1 2026. The United States alone contributed $80.8 billion of that figure, reinforcing its position as the benchmark market that other jurisdictions look to for fintech innovation.
The picture looked very different elsewhere. EMEA fintech investment fell from $18.0 billion in H2 2025 to $11.3 billion in H1 2026, a decline KPMG links to a mix of geopolitical and macroeconomic uncertainty, along with domestic political and tax-related concerns in the UK. Fintech companies in the region recorded 626 deals during the period.
ASPAC funding also softened, dropping from $7.1 billion to $4.6 billion across 350 deals. KPMG notes that these figures likely understate the full picture in the region, since China’s mature fintech market operates largely outside traditional VC, PE and M&A channels — much of its activity happens through internal corporate investment or strategic partnerships that don’t show up in standard deal-tracking data.
Why does this regional split matter? It points to a widening gap between markets where investors feel confident deploying large amounts of capital and markets still working through political or economic headwinds. For companies based in Europe or Asia-Pacific, raising money in 2026 may require looking further afield — or waiting for local conditions to stabilize.
Investment Types: M&A Dominates Amid High Venture Capital Activity
Mergers and acquisitions accounted for the single largest share of global fintech funding in H1 2026, totaling $67.9 billion across 394 deals. Two acquisitions each exceeding $10 billion drove much of that total. Cross-border M&A was especially notable, making up $20.2 billion of the half-year figure as corporates and fintechs pursued deals to expand their scale and capabilities across national borders.
Venture capital came in second, with $31.5 billion invested across 1,641 deals. That’s a slight dip from the second half of 2025, but KPMG says the current pace would still put VC investment on track for a four-year high by the close of 2026 — a notable recovery given how much VC activity had cooled in prior years.
Private equity also showed signs of life after a long quiet stretch. PE investment rose from $2.7 billion in H2 2025 to $3.6 billion in H1 2026, including an eleven-quarter high of $2.6 billion in the second quarter alone. PE deal volume climbed from 58 to 65 deals over the same period, even as both M&A and VC deal counts fell — a divergence that suggests private equity firms are becoming more active just as other investor types pull back on volume.
Corporate Venture Capital and Digital Assets Drive Emerging Fintech Segments
Corporate venture capital fintech investment reached $16.3 billion in H1 2026, putting it on pace for a four-year high by a wide margin — even though the number of CVC deals fell to its lowest level since 2017. KPMG attributes the surge to a growing sense of urgency among traditional corporates chasing operational efficiencies, alongside mature fintechs looking to broaden their offerings and scale up.
The digital assets space was especially attractive to corporate investors during the period, fueled largely by the venture arms of major crypto platforms and crypto infrastructure firms working to expand the broader digital assets ecosystem.
Anton Ruddenklau, Global Lead of Fintech and Innovation, Financial Services at KPMG International, described the shift this way: “After several years of contraction, fintech investment is clearly finding its footing again. While deal volumes remain muted, the increase in capital deployed, and the resurgence of exits, signal growing investor confidence, particularly around scalable platforms in digital assets and AI. As liquidity improves, we expect this renewed momentum to translate into stronger deal activity over the year ahead.”
On its own, digital assets investment totaled $11.1 billion across 467 deals in H1 2026. Compared with the full-year 2025 total of $21.9 billion across 1,335 deals, this figure represents a decline, yet it still exceeded the complete annual sums for 2023 and 2024. Despite accounting for less than half of total deal volume with 187 deals, the US contributed over half of worldwide digital assets investment, totaling $5.9 billion.
Among the biggest US digital assets transactions were a $1.2 billion funding round secured by a domestic prediction market and a $635 million seed round raised by a newly established national bank serving specialized sectors such as defense technology, computing infrastructure, and advanced manufacturing. Outside the US, a France-based on-chain lending network raised $175 million in the largest EMEA deal, while an Australia-based perpetual futures trading platform led ASPAC with a $150 million raise.
This concentration of capital in digital assets and crypto infrastructure underscores a broader trend: corporate venture capital fintech investment is increasingly treating blockchain-based finance as core infrastructure rather than a speculative side bet.
Sector-Specific Investment Trends: Regtech, Wealthtech and AI Fintech
Regtech held steady with $2.9 billion in global investment during H1 2026, a slightly stronger pace than the $4.8 billion recorded across all of 2025 — even as deal volume, at 133 deals, dropped to its lowest level since 2017. The Americas attracted the bulk of regtech funding and hosted the three largest deals of the half: a $385 million raise by a tax-compliant savings platform, a $200 million raise by an AI-powered AML/KYC risk intelligence company, and a $178.1 million acquisition of a Brazil-based B2B banking and risk management technology firm. In EMEA, a UK-based blockchain analytics and crypto compliance company led with a $120 million VC raise, while a China-based global trade payments and risk management firm topped ASPAC with $70 million.
Wealthtech told the opposite story. Investment in the space stayed remarkably soft, with just 32 deals accounting for $220 million globally — a steep drop from the $1.4 billion across 74 deals recorded during all of 2025. If that weak trend continues, wealthtech could see its lowest investment level since 2018. Deal sizes reflected the caution: the largest transaction was a $42.5 million private equity growth round for a US-based asset management platform, and the biggest EMEA raise was just $13.9 million, from a Denmark-based wealth management operating platform.
AI-related fintech deals, meanwhile, continued to draw serious money. These deals attracted $21.4 billion across 800 deals in H1 2026 — just shy of the $23.6 billion recorded during the entirety of 2025. In the Americas, particularly the US and Canada, AI remained a dominant investment theme as investors chased efficiencies in areas like fraud prevention and AI-enabled payments.
Taken together, these sector splits show a fintech market that isn’t rewarding capital evenly. Regtech and AI are holding investor attention because they solve immediate operational problems for banks and corporates. Wealthtech, by contrast, appears to be struggling to make the same case to investors right now.
FAQ
What was the total global fintech investment in the first half of 2026?
Global fintech investment reached $103.1 billion across 2,100 deals in H1 2026.
Which region led fintech investment in H1 2026 and what was its contribution?
The Americas led fintech funding with $86.9 billion, with the US contributing $80.8 billion.
What types of investments dominated fintech funding in H1 2026?
Mergers and acquisitions accounted for the largest share, $67.9 billion across 394 deals, including two acquisitions valued over $10 billion.
How significant was investment in digital assets and AI fintech sectors?
Digital assets attracted $11.1 billion across 467 deals, with the US accounting for over half, while AI-related fintech deals raised $21.4 billion across 800 deals.
Article produced with the assistance of artificial intelligence and reviewed by the editorial team.
Key takeaways
Global fintech investment climbed to $103.1 billion across 2,100 deals in H1 2026, up from $72.2 billion in H2 2025.
The Americas pulled in $86.9 billion, with the US alone accounting for $80.8 billion of that total.
M&A was the dominant investment type at $67.9 billion across 394 deals, including two acquisitions each worth more than $10 billion.
Venture capital investment reached $31.5 billion across 1,641 deals, putting VC on pace for a four-year high by year-end.
EMEA and ASPAC both saw funding decline compared to the second half of 2025, dragged down by regional economic and political uncertainty.
Global Fintech Funding Surges to $103.1 Billion in H1 2026
Fintech investment worldwide rose sharply from $72.2 billion in the second half of 2025 to $103.1 billion in the first half of 2026, according to KPMG. That growth was driven in large part by a single mega-deal: a $24.3 billion acquisition of a major global payments company, which alone reshaped the half-year total.
Deal volume told a different story. While the value of fintech deals climbed, the number of transactions stayed relatively subdued, a pattern KPMG says reflects investors concentrating their money on fintechs with proven business models rather than spreading bets across the market. If the current pace holds, 2026 could end up being the strongest year for fintech investment in four years.
This is one of the clearest signals yet that global fintech funding is entering a more selective phase. Rather than funding a wide field of early-stage startups, capital is flowing toward companies already recognized as category leaders — a shift that changes who gets funded and who gets left out.
Americas Lead Global Fintech Funding While EMEA and ASPAC See Declines
The Americas remained the clear engine of global fintech funding, with total investment in the region rising from $47.1 billion in the second half of 2025 to $86.9 billion in H1 2026. The United States alone contributed $80.8 billion of that figure, reinforcing its position as the benchmark market that other jurisdictions look to for fintech innovation.
The picture looked very different elsewhere. EMEA fintech investment fell from $18.0 billion in H2 2025 to $11.3 billion in H1 2026, a decline KPMG links to a mix of geopolitical and macroeconomic uncertainty, along with domestic political and tax-related concerns in the UK. Fintech companies in the region recorded 626 deals during the period.
ASPAC funding also softened, dropping from $7.1 billion to $4.6 billion across 350 deals. KPMG notes that these figures likely understate the full picture in the region, since China’s mature fintech market operates largely outside traditional VC, PE and M&A channels — much of its activity happens through internal corporate investment or strategic partnerships that don’t show up in standard deal-tracking data.
Why does this regional split matter? It points to a widening gap between markets where investors feel confident deploying large amounts of capital and markets still working through political or economic headwinds. For companies based in Europe or Asia-Pacific, raising money in 2026 may require looking further afield — or waiting for local conditions to stabilize.
Investment Types: M&A Dominates Amid High Venture Capital Activity
Mergers and acquisitions accounted for the single largest share of global fintech funding in H1 2026, totaling $67.9 billion across 394 deals. Two acquisitions each exceeding $10 billion drove much of that total. Cross-border M&A was especially notable, making up $20.2 billion of the half-year figure as corporates and fintechs pursued deals to expand their scale and capabilities across national borders.
Venture capital came in second, with $31.5 billion invested across 1,641 deals. That’s a slight dip from the second half of 2025, but KPMG says the current pace would still put VC investment on track for a four-year high by the close of 2026 — a notable recovery given how much VC activity had cooled in prior years.
Private equity also showed signs of life after a long quiet stretch. PE investment rose from $2.7 billion in H2 2025 to $3.6 billion in H1 2026, including an eleven-quarter high of $2.6 billion in the second quarter alone. PE deal volume climbed from 58 to 65 deals over the same period, even as both M&A and VC deal counts fell — a divergence that suggests private equity firms are becoming more active just as other investor types pull back on volume.
Corporate Venture Capital and Digital Assets Drive Emerging Fintech Segments
Corporate venture capital fintech investment reached $16.3 billion in H1 2026, putting it on pace for a four-year high by a wide margin — even though the number of CVC deals fell to its lowest level since 2017. KPMG attributes the surge to a growing sense of urgency among traditional corporates chasing operational efficiencies, alongside mature fintechs looking to broaden their offerings and scale up.
The digital assets space was especially attractive to corporate investors during the period, fueled largely by the venture arms of major crypto platforms and crypto infrastructure firms working to expand the broader digital assets ecosystem.
Anton Ruddenklau, Global Lead of Fintech and Innovation, Financial Services at KPMG International, described the shift this way: “After several years of contraction, fintech investment is clearly finding its footing again. While deal volumes remain muted, the increase in capital deployed, and the resurgence of exits, signal growing investor confidence, particularly around scalable platforms in digital assets and AI. As liquidity improves, we expect this renewed momentum to translate into stronger deal activity over the year ahead.”
On its own, digital assets investment totaled $11.1 billion across 467 deals in H1 2026. Compared with the full-year 2025 total of $21.9 billion across 1,335 deals, this figure represents a decline, yet it still exceeded the complete annual sums for 2023 and 2024. Despite accounting for less than half of total deal volume with 187 deals, the US contributed over half of worldwide digital assets investment, totaling $5.9 billion.
Among the biggest US digital assets transactions were a $1.2 billion funding round secured by a domestic prediction market and a $635 million seed round raised by a newly established national bank serving specialized sectors such as defense technology, computing infrastructure, and advanced manufacturing. Outside the US, a France-based on-chain lending network raised $175 million in the largest EMEA deal, while an Australia-based perpetual futures trading platform led ASPAC with a $150 million raise.
This concentration of capital in digital assets and crypto infrastructure underscores a broader trend: corporate venture capital fintech investment is increasingly treating blockchain-based finance as core infrastructure rather than a speculative side bet.
Sector-Specific Investment Trends: Regtech, Wealthtech and AI Fintech
Regtech held steady with $2.9 billion in global investment during H1 2026, a slightly stronger pace than the $4.8 billion recorded across all of 2025 — even as deal volume, at 133 deals, dropped to its lowest level since 2017. The Americas attracted the bulk of regtech funding and hosted the three largest deals of the half: a $385 million raise by a tax-compliant savings platform, a $200 million raise by an AI-powered AML/KYC risk intelligence company, and a $178.1 million acquisition of a Brazil-based B2B banking and risk management technology firm. In EMEA, a UK-based blockchain analytics and crypto compliance company led with a $120 million VC raise, while a China-based global trade payments and risk management firm topped ASPAC with $70 million.
Wealthtech told the opposite story. Investment in the space stayed remarkably soft, with just 32 deals accounting for $220 million globally — a steep drop from the $1.4 billion across 74 deals recorded during all of 2025. If that weak trend continues, wealthtech could see its lowest investment level since 2018. Deal sizes reflected the caution: the largest transaction was a $42.5 million private equity growth round for a US-based asset management platform, and the biggest EMEA raise was just $13.9 million, from a Denmark-based wealth management operating platform.
AI-related fintech deals, meanwhile, continued to draw serious money. These deals attracted $21.4 billion across 800 deals in H1 2026 — just shy of the $23.6 billion recorded during the entirety of 2025. In the Americas, particularly the US and Canada, AI remained a dominant investment theme as investors chased efficiencies in areas like fraud prevention and AI-enabled payments.
Taken together, these sector splits show a fintech market that isn’t rewarding capital evenly. Regtech and AI are holding investor attention because they solve immediate operational problems for banks and corporates. Wealthtech, by contrast, appears to be struggling to make the same case to investors right now.
FAQ
What was the total global fintech investment in the first half of 2026?
Global fintech investment reached $103.1 billion across 2,100 deals in H1 2026.
Which region led fintech investment in H1 2026 and what was its contribution?
The Americas led fintech funding with $86.9 billion, with the US contributing $80.8 billion.
What types of investments dominated fintech funding in H1 2026?
Mergers and acquisitions accounted for the largest share, $67.9 billion across 394 deals, including two acquisitions valued over $10 billion.
How significant was investment in digital assets and AI fintech sectors?
Digital assets attracted $11.1 billion across 467 deals, with the US accounting for over half, while AI-related fintech deals raised $21.4 billion across 800 deals.
Article produced with the assistance of artificial intelligence and reviewed by the editorial team.
14

Article
AeroVironment Stock Sinks to $140.80 Even as Backlog Hits $1.5 BillionAeroVironment stock enters trading caught between two competing forces. The daily chart shows a heavy bearish structure that accelerated into the September 9 close. Yet the company just delivered a Q1 FY2027 earnings beat with record revenue. That tension defines the current setup.
AVAV — daily chart with candlesticks, EMA20/EMA50 and volume.
Key takeaways
AVAV closed at 140.80 on September 9 after a heavy-volume selloff of roughly 4.9 million shares
The daily trend is firmly bearish, with price below the EMA20 (153.71), EMA50 (160.48), and EMA200 (200.03)
Daily RSI14 at 37.75 and MACD at -6.02 confirm bearish momentum is still widening
Q1 FY2027 delivered a beat with $480 million in revenue and a $1.5 billion backlog; FY2027 guidance was reaffirmed at $2.125 billion to $2.225 billion
Bulls must reclaim the 1H EMA20 near 144.22 and the daily pivot at 143.54 to shift momentum
Daily Trend: AeroVironment Stock Stays Firmly in Bearish Territory
AeroVironment stock is locked in a clear bearish trend on the daily chart, with price trapped below every major moving average and momentum still deteriorating.
Price Action and Volume
The daily candle for September 9 tells a clear story. AVAV opened at 149.05 and pushed briefly to 150.05. It then collapsed to a low of 139.77 before closing at 140.80. Volume came in at roughly 4.9 million shares, well above the volume of a quiet session. That is not a drift lower. It is a decisive rejection of the highs. Crucially, it happened before the after-hours earnings release.
Moving Average Structure
The moving average structure confirms the selling pressure. Price sits well below the EMA20 at 153.71. It also remains under the EMA50 at 160.48 and the EMA200 at 200.03. That stacked, downward-sloping alignment is a textbook bearish trend signature. Meanwhile, every reference point above the market now acts as resistance rather than support.
Momentum and Volatility Signals
Momentum backs up the trend picture. The daily RSI14 reads 37.75. That is firmly in weak territory but not yet oversold. It leaves room for further downside before any exhaustion signal appears. The MACD line sits at -6.02 against a signal line of -4.32. The histogram reads -1.69. In short, bearish momentum is not just present — it is still widening.
Volatility is also elevated. The daily ATR14 stands at 7.65. Bollinger Bands are unusually wide. The mid-band sits at 159.31, the upper band at 194.10, and the lower band at 124.51. Price trades near the lower half of that range, well under the 159.31 midpoint. This reflects a market that repriced sharply and is still digesting the move. For context, daily pivot levels sit at 143.54, with resistance at 147.31 and support at 137.03. AVAV closing under the pivot at 140.80 keeps sellers in control.
1H View: Confirmation, Not Contradiction
The 1H chart offers no relief from the bearish picture. It confirms the same structure seen on the daily timeframe.
Price at 140.77 remains below the EMA20 at 144.22. It also sits under the EMA50 at 146.14 and the EMA200 at 154.94. That is the same bearish stacking seen on the daily. It reinforces rather than weakens the higher-timeframe bias.
The 1H RSI14 at 36.47 mirrors the daily reading almost exactly. The MACD line at -1.19 versus a signal of -0.42 produces a histogram of -0.77. Momentum still leans lower on this shorter horizon too. Bollinger Bands on the 1H chart have a midpoint of 145.28. The upper band sits at 151.82 and the lower band at 138.75. Price stays closer to the lower boundary. The 1H ATR14 of 2.51 confirms volatility remains active even intraday.
Notably, the 1H pivot point sits at 140.73 — almost exactly where price is trading. Resistance stands at 141.68 and support at 139.81. That tight range around the pivot suggests the market is pausing at a decision point. It is not yet showing clear directional conviction on this timeframe alone.
15m Execution Context
The 15-minute chart remains bearish overall. However, a subtle stabilization signal is worth noting for short-term traders.
The trend alignment is again bearish. Price at 140.77 sits under the EMA20 at 141.96. It also remains below the EMA50 at 143.82 and the EMA200 at 145.59. The RSI14 at 35.86 stays soft, consistent with the higher timeframes.
Still, there is a small nuance worth flagging. The 15m MACD line at -1.27 and signal at -1.32 produce a histogram of just 0.05. That is essentially flat and barely positive. It signals short-term stabilization, not a reversal. But it does suggest selling pressure may be pausing at this exact level. Bollinger Bands here show a mid-band of 141.62, an upper band of 143.12, and a lower band of 140.13. Price hugs the lower band. The 15m ATR14 of 0.82 confirms this is a tighter, execution-level view of the same broader downtrend. It is useful for timing entries — not for redefining the bias.
The Fundamental Wrinkle: Earnings Beat Complicates the Chart
AeroVironment stock‘s fundamental picture introduces a powerful counterweight to the bearish technicals. This creates a genuine tension that traders must navigate.
The heavy daily selloff on September 9 happened during the regular session. It came ahead of AeroVironment’s Q1 FY2027 earnings call that evening. According to Seeking Alpha, the company reported $480 million in quarterly revenue. It also posted a $1.5 billion backlog. Management reaffirmed FY2027 revenue guidance in a range of $2.125 billion to $2.225 billion. The company also highlighted scaling capacity for its LOCUST and Titan programs. Separately, coverage described the results as an earnings beat with record revenue and surging bookings.
Meanwhile, premarket coverage on September 10 listed AVAV among the day’s biggest stock movers. Shares were described as surging. That creates a direct conflict. The technical snapshot captures a bearish session that closed before the earnings release. The fundamental catalyst appears to have triggered a positive reaction afterward. In practice, the indicator readings above reflect pre-earnings positioning. They do not capture the market’s response to the actual results.
Bullish Scenario
A genuine bullish reversal requires AeroVironment stock to reclaim key short-term resistance levels and show measurable momentum improvement.
For a bullish case to build, AVAV would need to reclaim the 1H EMA20 near 144.22. It must also hold above the daily pivot at 143.54. A push through the daily resistance at 147.31 would be the next meaningful test. Support for this scenario would come from sustained buying interest. That interest would be tied to backlog growth, the reaffirmed guidance range, and the LOCUST and Titan capacity expansion. If RSI on the daily and 1H timeframes can climb back above the 40–45 zone, that would mark a real shift. MACD histograms flattening and turning positive would confirm the momentum change — rather than just a bounce.
Bearish Scenario
The bearish case holds as long as AeroVironment stock remains capped below its EMA20 and EMA50 levels across all three timeframes.
The bearish structure stays intact while price is capped below key moving averages. A break below the daily support at 137.03 would invalidate any recovery attempt. That would open the door toward the lower Bollinger Band region near 124.51. The EMA200 sits all the way up at 200.03 on the daily chart. That distance highlights how far price has drifted from its longer-term trend. Continued MACD widening on the daily chart would confirm sellers still control the tape. The current spread of -6.02 versus -4.32 already signals firm bearish pressure. This holds true regardless of the earnings narrative.
Closing Take
AeroVironment stock sits at a genuine crossroads where bearish technicals and a strong fundamental catalyst pull in opposite directions.
Overall, AVAV faces a clear split. The technical structure across daily, 1H, and 15m timeframes is unambiguously bearish. Aligned EMA stacks, soft RSI readings, and negative MACD momentum all point lower. At the same time, the fundamental backdrop tells a different story. Record revenue, a growing $1.5 billion backlog, and reaffirmed FY2027 guidance point toward underlying business strength. The pre-earnings selloff did not yet price this in. With daily ATR at 7.65 and Bollinger Bands unusually wide, volatility is likely to stay elevated. Given the split between technical pressure and fundamental momentum, positioning decisions carry real uncertainty. Traders should treat this setup as a market still searching for direction — not one with a settled trend.
FAQ
What is the current technical trend for AeroVironment stock?
The daily trend is firmly bearish. Price sits below the EMA20 (153.71), EMA50 (160.48), and EMA200 (200.03). The RSI14 at 37.75 shows weak momentum. The MACD histogram at -1.69 confirms bearish pressure is still widening. This structure persists across the 1H and 15m timeframes as well.
Did the Q1 FY2027 earnings beat change the technical outlook?
The earnings beat occurred after the September 9 close. The technical indicators therefore reflect pre-earnings positioning. The post-earnings reaction — with shares described as surging in premarket coverage — created a conflict between the bearish chart structure and fundamentally positive news. The market’s response to earnings is not yet reflected in the indicator readings.
What are the key levels to watch for AeroVironment stock?
Bulls need to reclaim the 1H EMA20 near 144.22 and the daily pivot at 143.54. The next resistance sits at 147.31. On the downside, a break below daily support at 137.03 would open the door toward the lower Bollinger Band near 124.51. The daily ATR at 7.65 suggests these levels could be tested quickly.
Is the current AeroVironment stock setup high-risk?
The setup carries real uncertainty. Bearish technicals and a strong fundamental catalyst pull in opposite directions. With elevated volatility and a market still searching for direction, positioning decisions require careful risk management rather than high-conviction directional bets.
Disclaimer: This article is for informational purposes only and does not constitute financial advice, an investment recommendation, or a solicitation to buy or sell any financial instrument or cryptocurrency. The analysis provided is not indicative of future results. Investing in crypto assets and financial markets carries a high risk of capital loss. Always do your own research (DYOR) and consult a qualified financial advisor before making any decision.
Article produced with the assistance of artificial intelligence and reviewed by the editorial team.
AeroVironment Stock Sinks to $140.80 Even as Backlog Hits $1.5 Billion
AeroVironment stock enters trading caught between two competing forces. The daily chart shows a heavy bearish structure that accelerated into the September 9 close. Yet the company just delivered a Q1 FY2027 earnings beat with record revenue. That tension defines the current setup.
AVAV — daily chart with candlesticks, EMA20/EMA50 and volume.
Key takeaways
AVAV closed at 140.80 on September 9 after a heavy-volume selloff of roughly 4.9 million shares
The daily trend is firmly bearish, with price below the EMA20 (153.71), EMA50 (160.48), and EMA200 (200.03)
Daily RSI14 at 37.75 and MACD at -6.02 confirm bearish momentum is still widening
Q1 FY2027 delivered a beat with $480 million in revenue and a $1.5 billion backlog; FY2027 guidance was reaffirmed at $2.125 billion to $2.225 billion
Bulls must reclaim the 1H EMA20 near 144.22 and the daily pivot at 143.54 to shift momentum
Daily Trend: AeroVironment Stock Stays Firmly in Bearish Territory
AeroVironment stock is locked in a clear bearish trend on the daily chart, with price trapped below every major moving average and momentum still deteriorating.
Price Action and Volume
The daily candle for September 9 tells a clear story. AVAV opened at 149.05 and pushed briefly to 150.05. It then collapsed to a low of 139.77 before closing at 140.80. Volume came in at roughly 4.9 million shares, well above the volume of a quiet session. That is not a drift lower. It is a decisive rejection of the highs. Crucially, it happened before the after-hours earnings release.
Moving Average Structure
The moving average structure confirms the selling pressure. Price sits well below the EMA20 at 153.71. It also remains under the EMA50 at 160.48 and the EMA200 at 200.03. That stacked, downward-sloping alignment is a textbook bearish trend signature. Meanwhile, every reference point above the market now acts as resistance rather than support.
Momentum and Volatility Signals
Momentum backs up the trend picture. The daily RSI14 reads 37.75. That is firmly in weak territory but not yet oversold. It leaves room for further downside before any exhaustion signal appears. The MACD line sits at -6.02 against a signal line of -4.32. The histogram reads -1.69. In short, bearish momentum is not just present — it is still widening.
Volatility is also elevated. The daily ATR14 stands at 7.65. Bollinger Bands are unusually wide. The mid-band sits at 159.31, the upper band at 194.10, and the lower band at 124.51. Price trades near the lower half of that range, well under the 159.31 midpoint. This reflects a market that repriced sharply and is still digesting the move. For context, daily pivot levels sit at 143.54, with resistance at 147.31 and support at 137.03. AVAV closing under the pivot at 140.80 keeps sellers in control.
1H View: Confirmation, Not Contradiction
The 1H chart offers no relief from the bearish picture. It confirms the same structure seen on the daily timeframe.
Price at 140.77 remains below the EMA20 at 144.22. It also sits under the EMA50 at 146.14 and the EMA200 at 154.94. That is the same bearish stacking seen on the daily. It reinforces rather than weakens the higher-timeframe bias.
The 1H RSI14 at 36.47 mirrors the daily reading almost exactly. The MACD line at -1.19 versus a signal of -0.42 produces a histogram of -0.77. Momentum still leans lower on this shorter horizon too. Bollinger Bands on the 1H chart have a midpoint of 145.28. The upper band sits at 151.82 and the lower band at 138.75. Price stays closer to the lower boundary. The 1H ATR14 of 2.51 confirms volatility remains active even intraday.
Notably, the 1H pivot point sits at 140.73 — almost exactly where price is trading. Resistance stands at 141.68 and support at 139.81. That tight range around the pivot suggests the market is pausing at a decision point. It is not yet showing clear directional conviction on this timeframe alone.
15m Execution Context
The 15-minute chart remains bearish overall. However, a subtle stabilization signal is worth noting for short-term traders.
The trend alignment is again bearish. Price at 140.77 sits under the EMA20 at 141.96. It also remains below the EMA50 at 143.82 and the EMA200 at 145.59. The RSI14 at 35.86 stays soft, consistent with the higher timeframes.
Still, there is a small nuance worth flagging. The 15m MACD line at -1.27 and signal at -1.32 produce a histogram of just 0.05. That is essentially flat and barely positive. It signals short-term stabilization, not a reversal. But it does suggest selling pressure may be pausing at this exact level. Bollinger Bands here show a mid-band of 141.62, an upper band of 143.12, and a lower band of 140.13. Price hugs the lower band. The 15m ATR14 of 0.82 confirms this is a tighter, execution-level view of the same broader downtrend. It is useful for timing entries — not for redefining the bias.
The Fundamental Wrinkle: Earnings Beat Complicates the Chart
AeroVironment stock‘s fundamental picture introduces a powerful counterweight to the bearish technicals. This creates a genuine tension that traders must navigate.
The heavy daily selloff on September 9 happened during the regular session. It came ahead of AeroVironment’s Q1 FY2027 earnings call that evening. According to Seeking Alpha, the company reported $480 million in quarterly revenue. It also posted a $1.5 billion backlog. Management reaffirmed FY2027 revenue guidance in a range of $2.125 billion to $2.225 billion. The company also highlighted scaling capacity for its LOCUST and Titan programs. Separately, coverage described the results as an earnings beat with record revenue and surging bookings.
Meanwhile, premarket coverage on September 10 listed AVAV among the day’s biggest stock movers. Shares were described as surging. That creates a direct conflict. The technical snapshot captures a bearish session that closed before the earnings release. The fundamental catalyst appears to have triggered a positive reaction afterward. In practice, the indicator readings above reflect pre-earnings positioning. They do not capture the market’s response to the actual results.
Bullish Scenario
A genuine bullish reversal requires AeroVironment stock to reclaim key short-term resistance levels and show measurable momentum improvement.
For a bullish case to build, AVAV would need to reclaim the 1H EMA20 near 144.22. It must also hold above the daily pivot at 143.54. A push through the daily resistance at 147.31 would be the next meaningful test. Support for this scenario would come from sustained buying interest. That interest would be tied to backlog growth, the reaffirmed guidance range, and the LOCUST and Titan capacity expansion. If RSI on the daily and 1H timeframes can climb back above the 40–45 zone, that would mark a real shift. MACD histograms flattening and turning positive would confirm the momentum change — rather than just a bounce.
Bearish Scenario
The bearish case holds as long as AeroVironment stock remains capped below its EMA20 and EMA50 levels across all three timeframes.
The bearish structure stays intact while price is capped below key moving averages. A break below the daily support at 137.03 would invalidate any recovery attempt. That would open the door toward the lower Bollinger Band region near 124.51. The EMA200 sits all the way up at 200.03 on the daily chart. That distance highlights how far price has drifted from its longer-term trend. Continued MACD widening on the daily chart would confirm sellers still control the tape. The current spread of -6.02 versus -4.32 already signals firm bearish pressure. This holds true regardless of the earnings narrative.
Closing Take
AeroVironment stock sits at a genuine crossroads where bearish technicals and a strong fundamental catalyst pull in opposite directions.
Overall, AVAV faces a clear split. The technical structure across daily, 1H, and 15m timeframes is unambiguously bearish. Aligned EMA stacks, soft RSI readings, and negative MACD momentum all point lower. At the same time, the fundamental backdrop tells a different story. Record revenue, a growing $1.5 billion backlog, and reaffirmed FY2027 guidance point toward underlying business strength. The pre-earnings selloff did not yet price this in. With daily ATR at 7.65 and Bollinger Bands unusually wide, volatility is likely to stay elevated. Given the split between technical pressure and fundamental momentum, positioning decisions carry real uncertainty. Traders should treat this setup as a market still searching for direction — not one with a settled trend.
FAQ
What is the current technical trend for AeroVironment stock?
The daily trend is firmly bearish. Price sits below the EMA20 (153.71), EMA50 (160.48), and EMA200 (200.03). The RSI14 at 37.75 shows weak momentum. The MACD histogram at -1.69 confirms bearish pressure is still widening. This structure persists across the 1H and 15m timeframes as well.
Did the Q1 FY2027 earnings beat change the technical outlook?
The earnings beat occurred after the September 9 close. The technical indicators therefore reflect pre-earnings positioning. The post-earnings reaction — with shares described as surging in premarket coverage — created a conflict between the bearish chart structure and fundamentally positive news. The market’s response to earnings is not yet reflected in the indicator readings.
What are the key levels to watch for AeroVironment stock?
Bulls need to reclaim the 1H EMA20 near 144.22 and the daily pivot at 143.54. The next resistance sits at 147.31. On the downside, a break below daily support at 137.03 would open the door toward the lower Bollinger Band near 124.51. The daily ATR at 7.65 suggests these levels could be tested quickly.
Is the current AeroVironment stock setup high-risk?
The setup carries real uncertainty. Bearish technicals and a strong fundamental catalyst pull in opposite directions. With elevated volatility and a market still searching for direction, positioning decisions require careful risk management rather than high-conviction directional bets.
Disclaimer: This article is for informational purposes only and does not constitute financial advice, an investment recommendation, or a solicitation to buy or sell any financial instrument or cryptocurrency. The analysis provided is not indicative of future results. Investing in crypto assets and financial markets carries a high risk of capital loss. Always do your own research (DYOR) and consult a qualified financial advisor before making any decision.
Article produced with the assistance of artificial intelligence and reviewed by the editorial team.
AVAV — daily chart with candlesticks, EMA20/EMA50 and volume.
Key takeaways
AVAV closed at 140.80 on September 9 after a heavy-volume selloff of roughly 4.9 million shares
The daily trend is firmly bearish, with price below the EMA20 (153.71), EMA50 (160.48), and EMA200 (200.03)
Daily RSI14 at 37.75 and MACD at -6.02 confirm bearish momentum is still widening
Q1 FY2027 delivered a beat with $480 million in revenue and a $1.5 billion backlog; FY2027 guidance was reaffirmed at $2.125 billion to $2.225 billion
Bulls must reclaim the 1H EMA20 near 144.22 and the daily pivot at 143.54 to shift momentum
Daily Trend: AeroVironment Stock Stays Firmly in Bearish Territory
AeroVironment stock is locked in a clear bearish trend on the daily chart, with price trapped below every major moving average and momentum still deteriorating.
Price Action and Volume
The daily candle for September 9 tells a clear story. AVAV opened at 149.05 and pushed briefly to 150.05. It then collapsed to a low of 139.77 before closing at 140.80. Volume came in at roughly 4.9 million shares, well above the volume of a quiet session. That is not a drift lower. It is a decisive rejection of the highs. Crucially, it happened before the after-hours earnings release.
Moving Average Structure
The moving average structure confirms the selling pressure. Price sits well below the EMA20 at 153.71. It also remains under the EMA50 at 160.48 and the EMA200 at 200.03. That stacked, downward-sloping alignment is a textbook bearish trend signature. Meanwhile, every reference point above the market now acts as resistance rather than support.
Momentum and Volatility Signals
Momentum backs up the trend picture. The daily RSI14 reads 37.75. That is firmly in weak territory but not yet oversold. It leaves room for further downside before any exhaustion signal appears. The MACD line sits at -6.02 against a signal line of -4.32. The histogram reads -1.69. In short, bearish momentum is not just present — it is still widening.
Volatility is also elevated. The daily ATR14 stands at 7.65. Bollinger Bands are unusually wide. The mid-band sits at 159.31, the upper band at 194.10, and the lower band at 124.51. Price trades near the lower half of that range, well under the 159.31 midpoint. This reflects a market that repriced sharply and is still digesting the move. For context, daily pivot levels sit at 143.54, with resistance at 147.31 and support at 137.03. AVAV closing under the pivot at 140.80 keeps sellers in control.
1H View: Confirmation, Not Contradiction
The 1H chart offers no relief from the bearish picture. It confirms the same structure seen on the daily timeframe.
Price at 140.77 remains below the EMA20 at 144.22. It also sits under the EMA50 at 146.14 and the EMA200 at 154.94. That is the same bearish stacking seen on the daily. It reinforces rather than weakens the higher-timeframe bias.
The 1H RSI14 at 36.47 mirrors the daily reading almost exactly. The MACD line at -1.19 versus a signal of -0.42 produces a histogram of -0.77. Momentum still leans lower on this shorter horizon too. Bollinger Bands on the 1H chart have a midpoint of 145.28. The upper band sits at 151.82 and the lower band at 138.75. Price stays closer to the lower boundary. The 1H ATR14 of 2.51 confirms volatility remains active even intraday.
Notably, the 1H pivot point sits at 140.73 — almost exactly where price is trading. Resistance stands at 141.68 and support at 139.81. That tight range around the pivot suggests the market is pausing at a decision point. It is not yet showing clear directional conviction on this timeframe alone.
15m Execution Context
The 15-minute chart remains bearish overall. However, a subtle stabilization signal is worth noting for short-term traders.
The trend alignment is again bearish. Price at 140.77 sits under the EMA20 at 141.96. It also remains below the EMA50 at 143.82 and the EMA200 at 145.59. The RSI14 at 35.86 stays soft, consistent with the higher timeframes.
Still, there is a small nuance worth flagging. The 15m MACD line at -1.27 and signal at -1.32 produce a histogram of just 0.05. That is essentially flat and barely positive. It signals short-term stabilization, not a reversal. But it does suggest selling pressure may be pausing at this exact level. Bollinger Bands here show a mid-band of 141.62, an upper band of 143.12, and a lower band of 140.13. Price hugs the lower band. The 15m ATR14 of 0.82 confirms this is a tighter, execution-level view of the same broader downtrend. It is useful for timing entries — not for redefining the bias.
The Fundamental Wrinkle: Earnings Beat Complicates the Chart
AeroVironment stock‘s fundamental picture introduces a powerful counterweight to the bearish technicals. This creates a genuine tension that traders must navigate.
The heavy daily selloff on September 9 happened during the regular session. It came ahead of AeroVironment’s Q1 FY2027 earnings call that evening. According to Seeking Alpha, the company reported $480 million in quarterly revenue. It also posted a $1.5 billion backlog. Management reaffirmed FY2027 revenue guidance in a range of $2.125 billion to $2.225 billion. The company also highlighted scaling capacity for its LOCUST and Titan programs. Separately, coverage described the results as an earnings beat with record revenue and surging bookings.
Meanwhile, premarket coverage on September 10 listed AVAV among the day’s biggest stock movers. Shares were described as surging. That creates a direct conflict. The technical snapshot captures a bearish session that closed before the earnings release. The fundamental catalyst appears to have triggered a positive reaction afterward. In practice, the indicator readings above reflect pre-earnings positioning. They do not capture the market’s response to the actual results.
Bullish Scenario
A genuine bullish reversal requires AeroVironment stock to reclaim key short-term resistance levels and show measurable momentum improvement.
For a bullish case to build, AVAV would need to reclaim the 1H EMA20 near 144.22. It must also hold above the daily pivot at 143.54. A push through the daily resistance at 147.31 would be the next meaningful test. Support for this scenario would come from sustained buying interest. That interest would be tied to backlog growth, the reaffirmed guidance range, and the LOCUST and Titan capacity expansion. If RSI on the daily and 1H timeframes can climb back above the 40–45 zone, that would mark a real shift. MACD histograms flattening and turning positive would confirm the momentum change — rather than just a bounce.
Bearish Scenario
The bearish case holds as long as AeroVironment stock remains capped below its EMA20 and EMA50 levels across all three timeframes.
The bearish structure stays intact while price is capped below key moving averages. A break below the daily support at 137.03 would invalidate any recovery attempt. That would open the door toward the lower Bollinger Band region near 124.51. The EMA200 sits all the way up at 200.03 on the daily chart. That distance highlights how far price has drifted from its longer-term trend. Continued MACD widening on the daily chart would confirm sellers still control the tape. The current spread of -6.02 versus -4.32 already signals firm bearish pressure. This holds true regardless of the earnings narrative.
Closing Take
AeroVironment stock sits at a genuine crossroads where bearish technicals and a strong fundamental catalyst pull in opposite directions.
Overall, AVAV faces a clear split. The technical structure across daily, 1H, and 15m timeframes is unambiguously bearish. Aligned EMA stacks, soft RSI readings, and negative MACD momentum all point lower. At the same time, the fundamental backdrop tells a different story. Record revenue, a growing $1.5 billion backlog, and reaffirmed FY2027 guidance point toward underlying business strength. The pre-earnings selloff did not yet price this in. With daily ATR at 7.65 and Bollinger Bands unusually wide, volatility is likely to stay elevated. Given the split between technical pressure and fundamental momentum, positioning decisions carry real uncertainty. Traders should treat this setup as a market still searching for direction — not one with a settled trend.
FAQ
What is the current technical trend for AeroVironment stock?
The daily trend is firmly bearish. Price sits below the EMA20 (153.71), EMA50 (160.48), and EMA200 (200.03). The RSI14 at 37.75 shows weak momentum. The MACD histogram at -1.69 confirms bearish pressure is still widening. This structure persists across the 1H and 15m timeframes as well.
Did the Q1 FY2027 earnings beat change the technical outlook?
The earnings beat occurred after the September 9 close. The technical indicators therefore reflect pre-earnings positioning. The post-earnings reaction — with shares described as surging in premarket coverage — created a conflict between the bearish chart structure and fundamentally positive news. The market’s response to earnings is not yet reflected in the indicator readings.
What are the key levels to watch for AeroVironment stock?
Bulls need to reclaim the 1H EMA20 near 144.22 and the daily pivot at 143.54. The next resistance sits at 147.31. On the downside, a break below daily support at 137.03 would open the door toward the lower Bollinger Band near 124.51. The daily ATR at 7.65 suggests these levels could be tested quickly.
Is the current AeroVironment stock setup high-risk?
The setup carries real uncertainty. Bearish technicals and a strong fundamental catalyst pull in opposite directions. With elevated volatility and a market still searching for direction, positioning decisions require careful risk management rather than high-conviction directional bets.
Disclaimer: This article is for informational purposes only and does not constitute financial advice, an investment recommendation, or a solicitation to buy or sell any financial instrument or cryptocurrency. The analysis provided is not indicative of future results. Investing in crypto assets and financial markets carries a high risk of capital loss. Always do your own research (DYOR) and consult a qualified financial advisor before making any decision.
Article produced with the assistance of artificial intelligence and reviewed by the editorial team.
4

Article
Clearview AI Facial Recognition Quietly Tested Grok-Powered Profiling ToolClearview AI facial recognition technology has quietly gained a new artificial intelligence layer, and the company wasn’t ready for anyone outside its walls to know yet. According to a Wired investigation, the surveillance firm built and tested a prototype called InquiryIQ that pairs its face-matching system with a model from Elon Musk’s xAI, the company behind the Grok chatbot. The tool has never been publicly announced. It surfaced only after reporters found code buried in files that Clearview’s login page sends to any visitor’s browser before they even sign in.
Key takeaways
Clearview AI has been testing InquiryIQ, a prototype that uses a model from xAI’s Grok to enrich facial recognition results with associates, social media accounts, and other personal details.
Clearview’s database now holds between 60 and 70 billion facial images scraped from public web content, with an algorithm claiming over 99% accuracy across demographics per National Institute of Standards and Technology testing.
Clearview’s customer base is limited to vetted US government and law enforcement agencies under a 2022 settlement with the ACLU.
In February 2026, Clearview signed a one-year, $225,000 contract with US Customs and Border Protection for tactical targeting and counter-network analysis.
There is no public disclosure or regulatory filing describing InquiryIQ or its integration with xAI’s Grok model.
Clearview AI introduces InquiryIQ with xAI’s Grok model
InquiryIQ is best understood as an attempt to automate the legwork that investigators normally do by hand after a facial match comes back. Once a Clearview AI facial recognition search returns a name, the new tool is designed to keep working, crawling the open web to build out a fuller picture of that person’s life.
Generative AI integration enhances facial recognition
The system’s interface reportedly tells investigators that adding age, gender, and race can help it make “smarter decisions” while it searches, based on code reviewed by Wired. One of the models Clearview tested for that decision-making came from xAI. Clearview’s chief executive, Amos Kyler, has said the option to select xAI or other model providers was included so engineers could compare performance during internal testing, not so officers could choose which model ran an investigation. “No law enforcement user has ever used it, period,” Kyler said. According to Clearview’s statement to reporters, InquiryIQ remains merely a prototype, one that has never been offered or delivered to any customer, and the company has no current plans to launch it in its existing form.
Functionality includes surfacing associates and social media profiles
Rather than simply returning a match and a name, InquiryIQ is designed to surface contextual intelligence around that identification. The tool can run web and image searches, browse pages, and apply facial recognition to photos it encounters along the way, assembling what it calls a “Candidate Graph” of possible identities, associates, addresses, phone numbers, employers, and aliases. Analysts describe this as a meaningful escalation in what Clearview can offer clients, since it moves the company beyond pure identification and into automated, ongoing profile-building drawn from open-source data.
Data scale, accuracy, and customer restrictions
Clearview’s ability to run a tool like InquiryIQ rests on a facial image library that has grown enormously since the company first drew public attention, alongside accuracy claims backed by federal testing and a customer list narrowed by legal settlement.
Extensive facial image database and NIST accuracy claims
The company’s database now contains between 60 and 70 billion facial images, all scraped from publicly accessible corners of the internet. According to Clearview, testing conducted by the National Institute of Standards and Technology found that its core algorithm achieves an accuracy rate exceeding 99% regardless of demographic group. That combination of scale and claimed precision is part of what makes the addition of a generative AI layer notable: InquiryIQ would not just identify a face but attempt to contextualize it, drawing on a dataset already built from billions of scraped images.
Customer base limited to vetted government agencies
Clearview restricts access to vetted government and law enforcement agencies, a limitation written into its 2022 settlement with the ACLU following years of litigation and regulatory scrutiny over its scraping practices. That settlement remains the main legal guardrail shaping who can use Clearview’s tools, including any future version of InquiryIQ, even as the underlying Clearview AI facial recognition platform keeps expanding its reach among police departments and federal agencies.
Government contracts and regulatory transparency
Clearview’s business with federal agencies keeps growing even as the company stays quiet about its newest AI experiment, a gap that raises real questions about how much oversight surrounds tools built on top of its facial-matching platform.
Recent US Customs and Border Protection contract
Back in February 2026, US Customs and Border Protection awarded Clearview a one-year Clearview government contract valued at $225,000, aimed at tactical targeting and counter-network analysis. This agreement demonstrates that federal agencies still rely heavily on Clearview’s core identification technology despite its earlier controversies, even as the company tests adding generative AI onto that same underlying system.
No public disclosures on InquiryIQ and its AI integration
There are no public records, announcements, or regulatory filings describing InquiryIQ or its integration with xAI’s Grok model, which suggests the tool is either in early internal testing or being piloted quietly with a limited number of agencies. That silence matters. Privacy researchers who reviewed similar automated investigation tools argue that the labor once required to dig through someone’s online life served as a practical check on surveillance. Reducing that labor to an AI-driven search removes friction that many existing privacy protections were built around, without any comparable disclosure requirement stepping in to fill the gap.
The lack of transparency also lands at an awkward moment for xAI’s Grok, a model that has drawn scrutiny in the past for producing extremist and inflammatory outputs. Legal experts who work on Fourth Amendment issues have questioned whether a model prone to unpredictable errors should ever underpin decisions that touch on probable cause, even when a human analyst is technically reviewing the output. Clearview maintains that InquiryIQ is meant only to generate leads for investigators to independently verify, not to make determinations on its own.
FAQ
What is InquiryIQ and how does it enhance Clearview AI’s facial recognition?
InquiryIQ is a prototype tool that layers generative AI from xAI’s Grok model on top of Clearview’s platform, surfacing contextual information such as associates, social media accounts, and personal details alongside a facial recognition match.
Who is allowed to use Clearview AI’s tools, including InquiryIQ?
Clearview AI restricts its customer base to vetted US government and law enforcement agencies, as required under a 2022 settlement with the ACLU.
How accurate is Clearview AI’s facial recognition technology?
Clearview claims its facial recognition algorithm achieves over 99% accuracy across demographics, based on testing conducted by the National Institute of Standards and Technology.
Has Clearview publicly disclosed InquiryIQ or detailed its AI integration?
No. There are no public disclosures or regulatory filings describing InquiryIQ or its use of xAI’s Grok model, which points to either early internal testing or a limited pilot with select agencies.
Article produced with the assistance of artificial intelligence and reviewed by the editorial team.
Clearview AI Facial Recognition Quietly Tested Grok-Powered Profiling Tool
Clearview AI facial recognition technology has quietly gained a new artificial intelligence layer, and the company wasn’t ready for anyone outside its walls to know yet. According to a Wired investigation, the surveillance firm built and tested a prototype called InquiryIQ that pairs its face-matching system with a model from Elon Musk’s xAI, the company behind the Grok chatbot. The tool has never been publicly announced. It surfaced only after reporters found code buried in files that Clearview’s login page sends to any visitor’s browser before they even sign in.
Key takeaways
Clearview AI has been testing InquiryIQ, a prototype that uses a model from xAI’s Grok to enrich facial recognition results with associates, social media accounts, and other personal details.
Clearview’s database now holds between 60 and 70 billion facial images scraped from public web content, with an algorithm claiming over 99% accuracy across demographics per National Institute of Standards and Technology testing.
Clearview’s customer base is limited to vetted US government and law enforcement agencies under a 2022 settlement with the ACLU.
In February 2026, Clearview signed a one-year, $225,000 contract with US Customs and Border Protection for tactical targeting and counter-network analysis.
There is no public disclosure or regulatory filing describing InquiryIQ or its integration with xAI’s Grok model.
Clearview AI introduces InquiryIQ with xAI’s Grok model
InquiryIQ is best understood as an attempt to automate the legwork that investigators normally do by hand after a facial match comes back. Once a Clearview AI facial recognition search returns a name, the new tool is designed to keep working, crawling the open web to build out a fuller picture of that person’s life.
Generative AI integration enhances facial recognition
The system’s interface reportedly tells investigators that adding age, gender, and race can help it make “smarter decisions” while it searches, based on code reviewed by Wired. One of the models Clearview tested for that decision-making came from xAI. Clearview’s chief executive, Amos Kyler, has said the option to select xAI or other model providers was included so engineers could compare performance during internal testing, not so officers could choose which model ran an investigation. “No law enforcement user has ever used it, period,” Kyler said. According to Clearview’s statement to reporters, InquiryIQ remains merely a prototype, one that has never been offered or delivered to any customer, and the company has no current plans to launch it in its existing form.
Functionality includes surfacing associates and social media profiles
Rather than simply returning a match and a name, InquiryIQ is designed to surface contextual intelligence around that identification. The tool can run web and image searches, browse pages, and apply facial recognition to photos it encounters along the way, assembling what it calls a “Candidate Graph” of possible identities, associates, addresses, phone numbers, employers, and aliases. Analysts describe this as a meaningful escalation in what Clearview can offer clients, since it moves the company beyond pure identification and into automated, ongoing profile-building drawn from open-source data.
Data scale, accuracy, and customer restrictions
Clearview’s ability to run a tool like InquiryIQ rests on a facial image library that has grown enormously since the company first drew public attention, alongside accuracy claims backed by federal testing and a customer list narrowed by legal settlement.
Extensive facial image database and NIST accuracy claims
The company’s database now contains between 60 and 70 billion facial images, all scraped from publicly accessible corners of the internet. According to Clearview, testing conducted by the National Institute of Standards and Technology found that its core algorithm achieves an accuracy rate exceeding 99% regardless of demographic group. That combination of scale and claimed precision is part of what makes the addition of a generative AI layer notable: InquiryIQ would not just identify a face but attempt to contextualize it, drawing on a dataset already built from billions of scraped images.
Customer base limited to vetted government agencies
Clearview restricts access to vetted government and law enforcement agencies, a limitation written into its 2022 settlement with the ACLU following years of litigation and regulatory scrutiny over its scraping practices. That settlement remains the main legal guardrail shaping who can use Clearview’s tools, including any future version of InquiryIQ, even as the underlying Clearview AI facial recognition platform keeps expanding its reach among police departments and federal agencies.
Government contracts and regulatory transparency
Clearview’s business with federal agencies keeps growing even as the company stays quiet about its newest AI experiment, a gap that raises real questions about how much oversight surrounds tools built on top of its facial-matching platform.
Recent US Customs and Border Protection contract
Back in February 2026, US Customs and Border Protection awarded Clearview a one-year Clearview government contract valued at $225,000, aimed at tactical targeting and counter-network analysis. This agreement demonstrates that federal agencies still rely heavily on Clearview’s core identification technology despite its earlier controversies, even as the company tests adding generative AI onto that same underlying system.
No public disclosures on InquiryIQ and its AI integration
There are no public records, announcements, or regulatory filings describing InquiryIQ or its integration with xAI’s Grok model, which suggests the tool is either in early internal testing or being piloted quietly with a limited number of agencies. That silence matters. Privacy researchers who reviewed similar automated investigation tools argue that the labor once required to dig through someone’s online life served as a practical check on surveillance. Reducing that labor to an AI-driven search removes friction that many existing privacy protections were built around, without any comparable disclosure requirement stepping in to fill the gap.
The lack of transparency also lands at an awkward moment for xAI’s Grok, a model that has drawn scrutiny in the past for producing extremist and inflammatory outputs. Legal experts who work on Fourth Amendment issues have questioned whether a model prone to unpredictable errors should ever underpin decisions that touch on probable cause, even when a human analyst is technically reviewing the output. Clearview maintains that InquiryIQ is meant only to generate leads for investigators to independently verify, not to make determinations on its own.
FAQ
What is InquiryIQ and how does it enhance Clearview AI’s facial recognition?
InquiryIQ is a prototype tool that layers generative AI from xAI’s Grok model on top of Clearview’s platform, surfacing contextual information such as associates, social media accounts, and personal details alongside a facial recognition match.
Who is allowed to use Clearview AI’s tools, including InquiryIQ?
Clearview AI restricts its customer base to vetted US government and law enforcement agencies, as required under a 2022 settlement with the ACLU.
How accurate is Clearview AI’s facial recognition technology?
Clearview claims its facial recognition algorithm achieves over 99% accuracy across demographics, based on testing conducted by the National Institute of Standards and Technology.
Has Clearview publicly disclosed InquiryIQ or detailed its AI integration?
No. There are no public disclosures or regulatory filings describing InquiryIQ or its use of xAI’s Grok model, which points to either early internal testing or a limited pilot with select agencies.
Article produced with the assistance of artificial intelligence and reviewed by the editorial team.
Key takeaways
Clearview AI has been testing InquiryIQ, a prototype that uses a model from xAI’s Grok to enrich facial recognition results with associates, social media accounts, and other personal details.
Clearview’s database now holds between 60 and 70 billion facial images scraped from public web content, with an algorithm claiming over 99% accuracy across demographics per National Institute of Standards and Technology testing.
Clearview’s customer base is limited to vetted US government and law enforcement agencies under a 2022 settlement with the ACLU.
In February 2026, Clearview signed a one-year, $225,000 contract with US Customs and Border Protection for tactical targeting and counter-network analysis.
There is no public disclosure or regulatory filing describing InquiryIQ or its integration with xAI’s Grok model.
Clearview AI introduces InquiryIQ with xAI’s Grok model
InquiryIQ is best understood as an attempt to automate the legwork that investigators normally do by hand after a facial match comes back. Once a Clearview AI facial recognition search returns a name, the new tool is designed to keep working, crawling the open web to build out a fuller picture of that person’s life.
Generative AI integration enhances facial recognition
The system’s interface reportedly tells investigators that adding age, gender, and race can help it make “smarter decisions” while it searches, based on code reviewed by Wired. One of the models Clearview tested for that decision-making came from xAI. Clearview’s chief executive, Amos Kyler, has said the option to select xAI or other model providers was included so engineers could compare performance during internal testing, not so officers could choose which model ran an investigation. “No law enforcement user has ever used it, period,” Kyler said. According to Clearview’s statement to reporters, InquiryIQ remains merely a prototype, one that has never been offered or delivered to any customer, and the company has no current plans to launch it in its existing form.
Functionality includes surfacing associates and social media profiles
Rather than simply returning a match and a name, InquiryIQ is designed to surface contextual intelligence around that identification. The tool can run web and image searches, browse pages, and apply facial recognition to photos it encounters along the way, assembling what it calls a “Candidate Graph” of possible identities, associates, addresses, phone numbers, employers, and aliases. Analysts describe this as a meaningful escalation in what Clearview can offer clients, since it moves the company beyond pure identification and into automated, ongoing profile-building drawn from open-source data.
Data scale, accuracy, and customer restrictions
Clearview’s ability to run a tool like InquiryIQ rests on a facial image library that has grown enormously since the company first drew public attention, alongside accuracy claims backed by federal testing and a customer list narrowed by legal settlement.
Extensive facial image database and NIST accuracy claims
The company’s database now contains between 60 and 70 billion facial images, all scraped from publicly accessible corners of the internet. According to Clearview, testing conducted by the National Institute of Standards and Technology found that its core algorithm achieves an accuracy rate exceeding 99% regardless of demographic group. That combination of scale and claimed precision is part of what makes the addition of a generative AI layer notable: InquiryIQ would not just identify a face but attempt to contextualize it, drawing on a dataset already built from billions of scraped images.
Customer base limited to vetted government agencies
Clearview restricts access to vetted government and law enforcement agencies, a limitation written into its 2022 settlement with the ACLU following years of litigation and regulatory scrutiny over its scraping practices. That settlement remains the main legal guardrail shaping who can use Clearview’s tools, including any future version of InquiryIQ, even as the underlying Clearview AI facial recognition platform keeps expanding its reach among police departments and federal agencies.
Government contracts and regulatory transparency
Clearview’s business with federal agencies keeps growing even as the company stays quiet about its newest AI experiment, a gap that raises real questions about how much oversight surrounds tools built on top of its facial-matching platform.
Recent US Customs and Border Protection contract
Back in February 2026, US Customs and Border Protection awarded Clearview a one-year Clearview government contract valued at $225,000, aimed at tactical targeting and counter-network analysis. This agreement demonstrates that federal agencies still rely heavily on Clearview’s core identification technology despite its earlier controversies, even as the company tests adding generative AI onto that same underlying system.
No public disclosures on InquiryIQ and its AI integration
There are no public records, announcements, or regulatory filings describing InquiryIQ or its integration with xAI’s Grok model, which suggests the tool is either in early internal testing or being piloted quietly with a limited number of agencies. That silence matters. Privacy researchers who reviewed similar automated investigation tools argue that the labor once required to dig through someone’s online life served as a practical check on surveillance. Reducing that labor to an AI-driven search removes friction that many existing privacy protections were built around, without any comparable disclosure requirement stepping in to fill the gap.
The lack of transparency also lands at an awkward moment for xAI’s Grok, a model that has drawn scrutiny in the past for producing extremist and inflammatory outputs. Legal experts who work on Fourth Amendment issues have questioned whether a model prone to unpredictable errors should ever underpin decisions that touch on probable cause, even when a human analyst is technically reviewing the output. Clearview maintains that InquiryIQ is meant only to generate leads for investigators to independently verify, not to make determinations on its own.
FAQ
What is InquiryIQ and how does it enhance Clearview AI’s facial recognition?
InquiryIQ is a prototype tool that layers generative AI from xAI’s Grok model on top of Clearview’s platform, surfacing contextual information such as associates, social media accounts, and personal details alongside a facial recognition match.
Who is allowed to use Clearview AI’s tools, including InquiryIQ?
Clearview AI restricts its customer base to vetted US government and law enforcement agencies, as required under a 2022 settlement with the ACLU.
How accurate is Clearview AI’s facial recognition technology?
Clearview claims its facial recognition algorithm achieves over 99% accuracy across demographics, based on testing conducted by the National Institute of Standards and Technology.
Has Clearview publicly disclosed InquiryIQ or detailed its AI integration?
No. There are no public disclosures or regulatory filings describing InquiryIQ or its use of xAI’s Grok model, which points to either early internal testing or a limited pilot with select agencies.
Article produced with the assistance of artificial intelligence and reviewed by the editorial team.
6

Article
Cloudflare stock surges 9.25% after OpenAI tie-up, but overbought signals flashCloudflare stock surged 6.32% after announcing a security partnership with OpenAI. NET opened at 295.50, hit 317.55, and closed at 314.18 — its sharpest single-day move in months. The bullish daily structure now faces a critical test.
NET — daily chart with candlesticks, EMA20/EMA50 and volume.
Key takeaways
Cloudflare stock jumped 9.25% following the OpenAI security partnership announcement.
Daily structure remains bullish with price above EMA20 (291.10), EMA50 (279.65), and EMA200 (238.08).
Daily RSI14 at 58.58 leaves room for further upside before overbought conditions emerge.
1H RSI14 at 76.63 signals overbought conditions, raising near-term pullback risk.
Insider selling: President Michelle Zatlyn sold $27.6 million in stock around the same period.
Daily Trend and Momentum Structure for Cloudflare Stock
The daily trend for Cloudflare stock remains firmly bullish, but momentum indicators have not yet fully confirmed the breakout’s strength. The stacked alignment of moving averages tells a clear story.
Trend Alignment Remains Bullish
Price sits comfortably above the EMA20 at 291.10, the EMA50 at 279.65, and the EMA200 at 238.08. This arrangement — shorter-term averages above longer-term ones, all rising — is a textbook uptrend signature. The daily regime reading confirms the bullish structure outright.
RSI14 on the daily chart sits at 58.58. This is a healthy, moderate reading. It sits nowhere near overbought territory despite the rally’s size. Consequently, there is still room for the trend to extend before momentum becomes stretched on this timeframe.
Momentum Gap Emerges on MACD
However, the MACD tells a slightly different story. The line sits at 2.20 against a signal of 2.85, producing a negative histogram of -0.65. In plain terms, daily momentum has not yet caught up with the price action.
This is not necessarily bearish. It often happens after a sharp one-day surge, since MACD lags price by design. Still, the nuance is worth watching. The daily trend remains intact but has not fully confirmed the breakout’s strength yet.
Meanwhile, volatility has clearly expanded. The ATR14 on the daily stands at 16.94. Price now presses toward the upper Bollinger Band at 326.30, well above the mid-band at 295.33. The lower band sits at 264.35. That spread illustrates how much the range has widened following the OpenAI-driven surge.
Daily Pivot Levels and the Path Ahead
The daily pivot levels define the near-term battleground for Cloudflare stock. The central pivot sits at 308.09. Resistance stands at R1 323.64, while support holds at S1 298.63.
NET’s close at 314.18 is comfortably above the pivot, keeping buyers in control for now. A move through 323.64 would open the door to further upside continuation. On the other hand, a slide back below 298.63 would put the recent breakout under real pressure.
1H Timeframe Confirms the Trend But Runs Hot
The 1-hour chart reinforces the bullish case — perhaps too aggressively. EMA20 at 298.17, EMA50 at 292.29, and EMA200 at 290.29 are all stacked bullishly. The regime reading again confirms a bullish structure.
Notably, RSI14 on the 1H sits at 76.63. That is firmly overbought. Combined with a MACD line of 8.18 against a signal of 4.85, the short-term momentum is running hot. The histogram is strongly positive at 3.33.
This confirms the daily uptrend in direction. However, it also raises the risk of a near-term cooling-off period. Overbought conditions on this scale rarely extend in a straight line.
Additionally, the 1H ATR14 reads 5.53. Price trades near the upper Bollinger Band of 322.01, versus a mid-band of 292.85. That gap underscores how extended the intraday move has become relative to its own short-term average.
15-Minute Chart Shows Early Consolidation
The 15-minute chart presents a more nuanced picture. The trend remains structurally bullish, but early signs of consolidation are emerging.
EMA20 at 311.47, EMA50 at 302.25, and EMA200 at 291.42 remain bullishly aligned. The close at 314.28 sits above all three. RSI14 at 65.98 is elevated but not extreme.
At the same time, the MACD histogram here is negative at -0.98. The line at 4.46 sits below the signal at 5.44. This mirrors the lagging-momentum dynamic seen on the daily chart. It hints at a short-term pause or consolidation after the initial spike.
The Bollinger Bands have also tightened. The upper band sits at 317.80 and the lower band at 308.73. This narrower range is consistent with short-term digestion of the move. For traders using this timeframe for entry timing, the tightening range suggests waiting for a clearer break of either the 315.94 or 312.46 pivot levels before committing.
Bullish vs Bearish: Two Paths for Cloudflare Stock
The Bullish Scenario
If Cloudflare stock can hold above the daily EMA20 near 291 and clear R1 at 323.64, the uptrend has room to extend. Supporting evidence already exists in the news flow. Options activity has shown bullish conviction around the 9.25% surge.
The OpenAI security partnership gives the rally a fundamental anchor rather than pure momentum. Additional coverage has pointed to Meta’s new Muse agent as a potential driver of increased web traffic. This could feed directly into Cloudflare’s revenue base.
Furthermore, Cloudflare’s presentation at the Goldman Sachs Communacopia + Technology Conference this week keeps the company in the spotlight. A continuation higher would need the 1H RSI to cool from its overbought reading without breaking trend structure — a healthy pullback rather than a reversal.
The Bearish Scenario
In contrast, the bearish case rests on a failure to hold recent gains. A break below daily S1 at 298.63 would suggest the rally is losing steam. A retreat toward the Bollinger mid-band at 295.33 and the EMA20 at 291.10 would reinforce that concern.
The negative daily MACD histogram, if it persists or widens, would add weight to the bearish argument. On the sentiment side, Cloudflare president Michelle Zatlyn sold $27.6 million in stock around the same period. This does not necessarily signal distrust in the company. However, it adds a layer of caution for those watching insider behavior alongside the technical picture.
A drop through the 1H EMA50 at 292.29 would be an early warning. It would indicate that short-term momentum has genuinely broken down, not just cooled.
Overall, Cloudflare stock enters this phase with a bullish daily structure freshly reinforced by a major news catalyst. However, short-term momentum on the 1H timeframe is running into overbought territory. The daily MACD has not fully confirmed the move’s strength yet. The 15-minute chart shows early signs of consolidation after the spike. Therefore, positioning around NET right now requires balancing the trend’s strength against elevated volatility. ATR readings across all three timeframes point to wider-than-usual price swings ahead. Some near-term chop or pullback would not be surprising — even within an intact uptrend.
FAQ
What drove Cloudflare stock’s sharp rally?
A security partnership with OpenAI triggered the surge. NET jumped 6.32%, opening at 295.50 and closing at 314.18 — its sharpest single-day move in months.
Is Cloudflare stock overbought after the rally?
On the daily timeframe, RSI14 at 58.58 remains moderate and healthy. However, the 1H RSI14 at 76.63 is firmly overbought, suggesting near-term cooling is possible despite the intact uptrend.
What are the key levels to watch for Cloudflare stock?
Daily R1 at 323.64 is the immediate upside target. Support sits at S1 298.63, with further cushion at the Bollinger mid-band of 295.33 and the EMA20 at 291.10.
Does insider selling affect the Cloudflare stock outlook?
President Michelle Zatlyn sold $27.6 million in stock around the same period. It does not necessarily signal distrust, but it adds caution for those monitoring insider activity alongside technicals.
Disclaimer: This article is for informational purposes only and does not constitute financial advice, an investment recommendation, or a solicitation to buy or sell any financial instrument or cryptocurrency. The analysis provided is not indicative of future results. Investing in crypto assets and financial markets carries a high risk of capital loss. Always do your own research (DYOR) and consult a qualified financial advisor before making any decision.
Article produced with the assistance of artificial intelligence and reviewed by the editorial team.
Cloudflare stock surges 9.25% after OpenAI tie-up, but overbought signals flash
Cloudflare stock surged 6.32% after announcing a security partnership with OpenAI. NET opened at 295.50, hit 317.55, and closed at 314.18 — its sharpest single-day move in months. The bullish daily structure now faces a critical test.
NET — daily chart with candlesticks, EMA20/EMA50 and volume.
Key takeaways
Cloudflare stock jumped 9.25% following the OpenAI security partnership announcement.
Daily structure remains bullish with price above EMA20 (291.10), EMA50 (279.65), and EMA200 (238.08).
Daily RSI14 at 58.58 leaves room for further upside before overbought conditions emerge.
1H RSI14 at 76.63 signals overbought conditions, raising near-term pullback risk.
Insider selling: President Michelle Zatlyn sold $27.6 million in stock around the same period.
Daily Trend and Momentum Structure for Cloudflare Stock
The daily trend for Cloudflare stock remains firmly bullish, but momentum indicators have not yet fully confirmed the breakout’s strength. The stacked alignment of moving averages tells a clear story.
Trend Alignment Remains Bullish
Price sits comfortably above the EMA20 at 291.10, the EMA50 at 279.65, and the EMA200 at 238.08. This arrangement — shorter-term averages above longer-term ones, all rising — is a textbook uptrend signature. The daily regime reading confirms the bullish structure outright.
RSI14 on the daily chart sits at 58.58. This is a healthy, moderate reading. It sits nowhere near overbought territory despite the rally’s size. Consequently, there is still room for the trend to extend before momentum becomes stretched on this timeframe.
Momentum Gap Emerges on MACD
However, the MACD tells a slightly different story. The line sits at 2.20 against a signal of 2.85, producing a negative histogram of -0.65. In plain terms, daily momentum has not yet caught up with the price action.
This is not necessarily bearish. It often happens after a sharp one-day surge, since MACD lags price by design. Still, the nuance is worth watching. The daily trend remains intact but has not fully confirmed the breakout’s strength yet.
Meanwhile, volatility has clearly expanded. The ATR14 on the daily stands at 16.94. Price now presses toward the upper Bollinger Band at 326.30, well above the mid-band at 295.33. The lower band sits at 264.35. That spread illustrates how much the range has widened following the OpenAI-driven surge.
Daily Pivot Levels and the Path Ahead
The daily pivot levels define the near-term battleground for Cloudflare stock. The central pivot sits at 308.09. Resistance stands at R1 323.64, while support holds at S1 298.63.
NET’s close at 314.18 is comfortably above the pivot, keeping buyers in control for now. A move through 323.64 would open the door to further upside continuation. On the other hand, a slide back below 298.63 would put the recent breakout under real pressure.
1H Timeframe Confirms the Trend But Runs Hot
The 1-hour chart reinforces the bullish case — perhaps too aggressively. EMA20 at 298.17, EMA50 at 292.29, and EMA200 at 290.29 are all stacked bullishly. The regime reading again confirms a bullish structure.
Notably, RSI14 on the 1H sits at 76.63. That is firmly overbought. Combined with a MACD line of 8.18 against a signal of 4.85, the short-term momentum is running hot. The histogram is strongly positive at 3.33.
This confirms the daily uptrend in direction. However, it also raises the risk of a near-term cooling-off period. Overbought conditions on this scale rarely extend in a straight line.
Additionally, the 1H ATR14 reads 5.53. Price trades near the upper Bollinger Band of 322.01, versus a mid-band of 292.85. That gap underscores how extended the intraday move has become relative to its own short-term average.
15-Minute Chart Shows Early Consolidation
The 15-minute chart presents a more nuanced picture. The trend remains structurally bullish, but early signs of consolidation are emerging.
EMA20 at 311.47, EMA50 at 302.25, and EMA200 at 291.42 remain bullishly aligned. The close at 314.28 sits above all three. RSI14 at 65.98 is elevated but not extreme.
At the same time, the MACD histogram here is negative at -0.98. The line at 4.46 sits below the signal at 5.44. This mirrors the lagging-momentum dynamic seen on the daily chart. It hints at a short-term pause or consolidation after the initial spike.
The Bollinger Bands have also tightened. The upper band sits at 317.80 and the lower band at 308.73. This narrower range is consistent with short-term digestion of the move. For traders using this timeframe for entry timing, the tightening range suggests waiting for a clearer break of either the 315.94 or 312.46 pivot levels before committing.
Bullish vs Bearish: Two Paths for Cloudflare Stock
The Bullish Scenario
If Cloudflare stock can hold above the daily EMA20 near 291 and clear R1 at 323.64, the uptrend has room to extend. Supporting evidence already exists in the news flow. Options activity has shown bullish conviction around the 9.25% surge.
The OpenAI security partnership gives the rally a fundamental anchor rather than pure momentum. Additional coverage has pointed to Meta’s new Muse agent as a potential driver of increased web traffic. This could feed directly into Cloudflare’s revenue base.
Furthermore, Cloudflare’s presentation at the Goldman Sachs Communacopia + Technology Conference this week keeps the company in the spotlight. A continuation higher would need the 1H RSI to cool from its overbought reading without breaking trend structure — a healthy pullback rather than a reversal.
The Bearish Scenario
In contrast, the bearish case rests on a failure to hold recent gains. A break below daily S1 at 298.63 would suggest the rally is losing steam. A retreat toward the Bollinger mid-band at 295.33 and the EMA20 at 291.10 would reinforce that concern.
The negative daily MACD histogram, if it persists or widens, would add weight to the bearish argument. On the sentiment side, Cloudflare president Michelle Zatlyn sold $27.6 million in stock around the same period. This does not necessarily signal distrust in the company. However, it adds a layer of caution for those watching insider behavior alongside the technical picture.
A drop through the 1H EMA50 at 292.29 would be an early warning. It would indicate that short-term momentum has genuinely broken down, not just cooled.
Overall, Cloudflare stock enters this phase with a bullish daily structure freshly reinforced by a major news catalyst. However, short-term momentum on the 1H timeframe is running into overbought territory. The daily MACD has not fully confirmed the move’s strength yet. The 15-minute chart shows early signs of consolidation after the spike. Therefore, positioning around NET right now requires balancing the trend’s strength against elevated volatility. ATR readings across all three timeframes point to wider-than-usual price swings ahead. Some near-term chop or pullback would not be surprising — even within an intact uptrend.
FAQ
What drove Cloudflare stock’s sharp rally?
A security partnership with OpenAI triggered the surge. NET jumped 6.32%, opening at 295.50 and closing at 314.18 — its sharpest single-day move in months.
Is Cloudflare stock overbought after the rally?
On the daily timeframe, RSI14 at 58.58 remains moderate and healthy. However, the 1H RSI14 at 76.63 is firmly overbought, suggesting near-term cooling is possible despite the intact uptrend.
What are the key levels to watch for Cloudflare stock?
Daily R1 at 323.64 is the immediate upside target. Support sits at S1 298.63, with further cushion at the Bollinger mid-band of 295.33 and the EMA20 at 291.10.
Does insider selling affect the Cloudflare stock outlook?
President Michelle Zatlyn sold $27.6 million in stock around the same period. It does not necessarily signal distrust, but it adds caution for those monitoring insider activity alongside technicals.
Disclaimer: This article is for informational purposes only and does not constitute financial advice, an investment recommendation, or a solicitation to buy or sell any financial instrument or cryptocurrency. The analysis provided is not indicative of future results. Investing in crypto assets and financial markets carries a high risk of capital loss. Always do your own research (DYOR) and consult a qualified financial advisor before making any decision.
Article produced with the assistance of artificial intelligence and reviewed by the editorial team.
NET — daily chart with candlesticks, EMA20/EMA50 and volume.
Key takeaways
Cloudflare stock jumped 9.25% following the OpenAI security partnership announcement.
Daily structure remains bullish with price above EMA20 (291.10), EMA50 (279.65), and EMA200 (238.08).
Daily RSI14 at 58.58 leaves room for further upside before overbought conditions emerge.
1H RSI14 at 76.63 signals overbought conditions, raising near-term pullback risk.
Insider selling: President Michelle Zatlyn sold $27.6 million in stock around the same period.
Daily Trend and Momentum Structure for Cloudflare Stock
The daily trend for Cloudflare stock remains firmly bullish, but momentum indicators have not yet fully confirmed the breakout’s strength. The stacked alignment of moving averages tells a clear story.
Trend Alignment Remains Bullish
Price sits comfortably above the EMA20 at 291.10, the EMA50 at 279.65, and the EMA200 at 238.08. This arrangement — shorter-term averages above longer-term ones, all rising — is a textbook uptrend signature. The daily regime reading confirms the bullish structure outright.
RSI14 on the daily chart sits at 58.58. This is a healthy, moderate reading. It sits nowhere near overbought territory despite the rally’s size. Consequently, there is still room for the trend to extend before momentum becomes stretched on this timeframe.
Momentum Gap Emerges on MACD
However, the MACD tells a slightly different story. The line sits at 2.20 against a signal of 2.85, producing a negative histogram of -0.65. In plain terms, daily momentum has not yet caught up with the price action.
This is not necessarily bearish. It often happens after a sharp one-day surge, since MACD lags price by design. Still, the nuance is worth watching. The daily trend remains intact but has not fully confirmed the breakout’s strength yet.
Meanwhile, volatility has clearly expanded. The ATR14 on the daily stands at 16.94. Price now presses toward the upper Bollinger Band at 326.30, well above the mid-band at 295.33. The lower band sits at 264.35. That spread illustrates how much the range has widened following the OpenAI-driven surge.
Daily Pivot Levels and the Path Ahead
The daily pivot levels define the near-term battleground for Cloudflare stock. The central pivot sits at 308.09. Resistance stands at R1 323.64, while support holds at S1 298.63.
NET’s close at 314.18 is comfortably above the pivot, keeping buyers in control for now. A move through 323.64 would open the door to further upside continuation. On the other hand, a slide back below 298.63 would put the recent breakout under real pressure.
1H Timeframe Confirms the Trend But Runs Hot
The 1-hour chart reinforces the bullish case — perhaps too aggressively. EMA20 at 298.17, EMA50 at 292.29, and EMA200 at 290.29 are all stacked bullishly. The regime reading again confirms a bullish structure.
Notably, RSI14 on the 1H sits at 76.63. That is firmly overbought. Combined with a MACD line of 8.18 against a signal of 4.85, the short-term momentum is running hot. The histogram is strongly positive at 3.33.
This confirms the daily uptrend in direction. However, it also raises the risk of a near-term cooling-off period. Overbought conditions on this scale rarely extend in a straight line.
Additionally, the 1H ATR14 reads 5.53. Price trades near the upper Bollinger Band of 322.01, versus a mid-band of 292.85. That gap underscores how extended the intraday move has become relative to its own short-term average.
15-Minute Chart Shows Early Consolidation
The 15-minute chart presents a more nuanced picture. The trend remains structurally bullish, but early signs of consolidation are emerging.
EMA20 at 311.47, EMA50 at 302.25, and EMA200 at 291.42 remain bullishly aligned. The close at 314.28 sits above all three. RSI14 at 65.98 is elevated but not extreme.
At the same time, the MACD histogram here is negative at -0.98. The line at 4.46 sits below the signal at 5.44. This mirrors the lagging-momentum dynamic seen on the daily chart. It hints at a short-term pause or consolidation after the initial spike.
The Bollinger Bands have also tightened. The upper band sits at 317.80 and the lower band at 308.73. This narrower range is consistent with short-term digestion of the move. For traders using this timeframe for entry timing, the tightening range suggests waiting for a clearer break of either the 315.94 or 312.46 pivot levels before committing.
Bullish vs Bearish: Two Paths for Cloudflare Stock
The Bullish Scenario
If Cloudflare stock can hold above the daily EMA20 near 291 and clear R1 at 323.64, the uptrend has room to extend. Supporting evidence already exists in the news flow. Options activity has shown bullish conviction around the 9.25% surge.
The OpenAI security partnership gives the rally a fundamental anchor rather than pure momentum. Additional coverage has pointed to Meta’s new Muse agent as a potential driver of increased web traffic. This could feed directly into Cloudflare’s revenue base.
Furthermore, Cloudflare’s presentation at the Goldman Sachs Communacopia + Technology Conference this week keeps the company in the spotlight. A continuation higher would need the 1H RSI to cool from its overbought reading without breaking trend structure — a healthy pullback rather than a reversal.
The Bearish Scenario
In contrast, the bearish case rests on a failure to hold recent gains. A break below daily S1 at 298.63 would suggest the rally is losing steam. A retreat toward the Bollinger mid-band at 295.33 and the EMA20 at 291.10 would reinforce that concern.
The negative daily MACD histogram, if it persists or widens, would add weight to the bearish argument. On the sentiment side, Cloudflare president Michelle Zatlyn sold $27.6 million in stock around the same period. This does not necessarily signal distrust in the company. However, it adds a layer of caution for those watching insider behavior alongside the technical picture.
A drop through the 1H EMA50 at 292.29 would be an early warning. It would indicate that short-term momentum has genuinely broken down, not just cooled.
Overall, Cloudflare stock enters this phase with a bullish daily structure freshly reinforced by a major news catalyst. However, short-term momentum on the 1H timeframe is running into overbought territory. The daily MACD has not fully confirmed the move’s strength yet. The 15-minute chart shows early signs of consolidation after the spike. Therefore, positioning around NET right now requires balancing the trend’s strength against elevated volatility. ATR readings across all three timeframes point to wider-than-usual price swings ahead. Some near-term chop or pullback would not be surprising — even within an intact uptrend.
FAQ
What drove Cloudflare stock’s sharp rally?
A security partnership with OpenAI triggered the surge. NET jumped 6.32%, opening at 295.50 and closing at 314.18 — its sharpest single-day move in months.
Is Cloudflare stock overbought after the rally?
On the daily timeframe, RSI14 at 58.58 remains moderate and healthy. However, the 1H RSI14 at 76.63 is firmly overbought, suggesting near-term cooling is possible despite the intact uptrend.
What are the key levels to watch for Cloudflare stock?
Daily R1 at 323.64 is the immediate upside target. Support sits at S1 298.63, with further cushion at the Bollinger mid-band of 295.33 and the EMA20 at 291.10.
Does insider selling affect the Cloudflare stock outlook?
President Michelle Zatlyn sold $27.6 million in stock around the same period. It does not necessarily signal distrust, but it adds caution for those monitoring insider activity alongside technicals.
Disclaimer: This article is for informational purposes only and does not constitute financial advice, an investment recommendation, or a solicitation to buy or sell any financial instrument or cryptocurrency. The analysis provided is not indicative of future results. Investing in crypto assets and financial markets carries a high risk of capital loss. Always do your own research (DYOR) and consult a qualified financial advisor before making any decision.
Article produced with the assistance of artificial intelligence and reviewed by the editorial team.
4

Article
Bitcoin price inflation fears grow as Fed rate hike odds hit 60%Bitcoin traders are pulling back their bullish bets just as a fresh wave of U.S. inflation data threatens to reshape expectations for the Federal Reserve’s next move, adding a layer of uncertainty to an already jittery market. The pullback comes at a delicate moment: concerns over bitcoin price inflation dynamics are converging with a packed macroeconomic calendar, and traders appear to be positioning defensively rather than chasing further upside.
Key takeaways
Bitcoin recently pulled back from above $80,000 to around $77,845.88, with its spot price retracing from highs above $81,000 to roughly $78,000, according to CoinDesk.
Options data from OrderX shows call skew softening as traders shed bullish exposure following early-week weakness.
U.S. Producer Price Index data due Thursday is expected to show a 0.4% monthly rise, pushing the annualized rate from 4.7% to 5.3%.
CME FedWatch data points to a more than 60% probability of a Federal Reserve rate hike next week, a figure corroborated separately by The Block following last week’s jobs report.
Bitcoin has been trading in a range between roughly $76,000 and $82,000, with a break above or below those levels seen as a directional signal.
Bitcoin Price Retreats From $81,000 Toward the High $70,000s
Bitcoin‘s most recent slide tells a fairly clear story: momentum that built through August has cooled off just as fast as it appeared. The token was changing hands around $77,845.88 as of CoinDesk’s report, a retreat from levels above $80,000 reached only days earlier. That pullback mirrors a broader retracement from highs above $81,000 to about $78,000, a move CoinDesk attributed to a mix of market pressures rather than any single catalyst.
Corroborating that picture, crypto.news reported Bitcoin trading near $79,176, down 0.8% over 24 hours, after moving between $78,707 and $80,494 — essentially the same consolidation zone described elsewhere. The Block similarly noted BTC changing hands around $79,500 on Monday after climbing above $82,000 the previous week, before Friday’s jobs report knocked the wind out of the rally.
Traders Dial Down Bullish Bets as Call Skew Softens
Options positioning is showing traders getting more cautious, not less. AI-powered trading terminal OrderX said on X that “call skew continues to soften as traders shed bullish exposure following early-week weakness.” Options skew measures the balance between calls — bullish bets on further upside — and puts, which act as insurance against a drop. A softening skew means fewer traders are chasing gains through calls and more are hedging.
This matters because it reflects sentiment shifting in real time, ahead of hard data. Bitfinex analysts, cited by crypto.news, described the current price structure as supporting “continued consolidation with an upside bias” rather than a confirmed breakout — a characterization that lines up with what the softening skew suggests: traders aren’t abandoning bitcoin, but they’re no longer betting aggressively on a fast move higher.
Oil, Bond Yields and Fed Rate Bets Weigh on Sentiment
Rising oil prices, elevated bond yields, and mounting expectations of a Federal Reserve rate increase are combining to challenge bitcoin bulls just as inflation data lands. LMAX Group market strategist Joel Kruger told The Block that bitcoin “is holding near $80,000 following an aggressive August rally that pushed momentum into overbought territory,” pointing specifically to higher Treasury yields and rising oil prices following renewed U.S.-Iran tensions as headwinds the market has had to absorb.
This matters for a simple reason: rate-sensitive assets like bitcoin tend to lose their shine when yields climb, because investors can earn safer, competitive returns from government debt instead. Add renewed inflation concerns to that mix, and the market environment turns noticeably less friendly for anyone betting on a quick move higher.
CME FedWatch Points to Elevated Rate-Hike Odds
According to CME FedWatch data, there is now more than a 60% chance of a Federal Reserve interest rate increase next week. That estimate ticked up after Friday’s U.S. jobs report showed 162,000 jobs added in August, while unemployment held steady at 4.1%. The Block reported the same figure, noting that Treasury yields and the dollar both rose following the release, adding fresh pressure on bitcoin and other rate-sensitive assets.
PPI and CPI Reports Could Decide Bitcoin’s Next Move
The next real test for bitcoin arrives with two back-to-back inflation reports. Economists anticipate that the U.S. Producer Price Index, due for release Thursday, will reveal a 0.4% month-over-month rise in producer-level inflation for August. That would push the annualized PPI reading to 5.3% from 4.7% — a sharp enough jump to further cement expectations of a Fed rate hike, potentially strengthening the dollar and adding more pressure on bitcoin.
Friday’s Consumer Price Index report is also expected to show a re-acceleration in inflation, giving policymakers one more data point before their decision. This is where the bitcoin price inflation story truly comes into focus: two consecutive hot inflation prints, layered on top of a strong jobs report, would leave the Fed with little room to argue for patience, and markets are already pricing that scenario in.
Bitcoin’s Range: Watching $76,000 and $82,000
From a technical standpoint, bitcoin has continued trading within a clearly defined range between about $76,000 and $82,000, and according to the pattern traders have been monitoring, a move above $82,000 would point to a fresh bullish breakout while a slide below $76,000 would shift the near-term outlook toward bearish.
Why does this matter beyond the immediate price action? Because the range itself has become a proxy for how the market is digesting US inflation data and Federal Reserve rate hike odds simultaneously. Every inflation print between now and the Fed’s decision effectively acts as a vote on which side of that range bitcoin ultimately breaks toward — and traders softening their bullish exposure now suggests many aren’t ready to call that outcome yet.
FAQ
Why are Bitcoin traders reducing bullish exposure?
Traders are reducing bullish exposure as call skew softens, reflecting caution amid Bitcoin’s recent price pullback and macroeconomic concerns tied to oil prices, bond yields, and rate hike expectations.
What inflation data is influencing Bitcoin’s price outlook?
Upcoming U.S. Producer Price Index and Consumer Price Index releases are expected to show a re-acceleration in inflation, which could influence Federal Reserve rate hike expectations and, in turn, bitcoin sentiment.
What are the key Bitcoin price levels to watch for market direction?
Bitcoin is trading between roughly $76,000 and $82,000. A break above $82,000 could indicate a bullish breakout, while a drop below $76,000 might signal a bearish outlook.
How likely is a Federal Reserve interest rate hike and how does it affect Bitcoin?
CME FedWatch data shows more than a 60% chance of a rate hike next week, a probability that has climbed following stronger-than-expected jobs data. A hike could strengthen the dollar and add further pressure on bitcoin’s price.
Article produced with the assistance of artificial intelligence and reviewed by the editorial team.
Bitcoin price inflation fears grow as Fed rate hike odds hit 60%
Bitcoin traders are pulling back their bullish bets just as a fresh wave of U.S. inflation data threatens to reshape expectations for the Federal Reserve’s next move, adding a layer of uncertainty to an already jittery market. The pullback comes at a delicate moment: concerns over bitcoin price inflation dynamics are converging with a packed macroeconomic calendar, and traders appear to be positioning defensively rather than chasing further upside.
Key takeaways
Bitcoin recently pulled back from above $80,000 to around $77,845.88, with its spot price retracing from highs above $81,000 to roughly $78,000, according to CoinDesk.
Options data from OrderX shows call skew softening as traders shed bullish exposure following early-week weakness.
U.S. Producer Price Index data due Thursday is expected to show a 0.4% monthly rise, pushing the annualized rate from 4.7% to 5.3%.
CME FedWatch data points to a more than 60% probability of a Federal Reserve rate hike next week, a figure corroborated separately by The Block following last week’s jobs report.
Bitcoin has been trading in a range between roughly $76,000 and $82,000, with a break above or below those levels seen as a directional signal.
Bitcoin Price Retreats From $81,000 Toward the High $70,000s
Bitcoin‘s most recent slide tells a fairly clear story: momentum that built through August has cooled off just as fast as it appeared. The token was changing hands around $77,845.88 as of CoinDesk’s report, a retreat from levels above $80,000 reached only days earlier. That pullback mirrors a broader retracement from highs above $81,000 to about $78,000, a move CoinDesk attributed to a mix of market pressures rather than any single catalyst.
Corroborating that picture, crypto.news reported Bitcoin trading near $79,176, down 0.8% over 24 hours, after moving between $78,707 and $80,494 — essentially the same consolidation zone described elsewhere. The Block similarly noted BTC changing hands around $79,500 on Monday after climbing above $82,000 the previous week, before Friday’s jobs report knocked the wind out of the rally.
Traders Dial Down Bullish Bets as Call Skew Softens
Options positioning is showing traders getting more cautious, not less. AI-powered trading terminal OrderX said on X that “call skew continues to soften as traders shed bullish exposure following early-week weakness.” Options skew measures the balance between calls — bullish bets on further upside — and puts, which act as insurance against a drop. A softening skew means fewer traders are chasing gains through calls and more are hedging.
This matters because it reflects sentiment shifting in real time, ahead of hard data. Bitfinex analysts, cited by crypto.news, described the current price structure as supporting “continued consolidation with an upside bias” rather than a confirmed breakout — a characterization that lines up with what the softening skew suggests: traders aren’t abandoning bitcoin, but they’re no longer betting aggressively on a fast move higher.
Oil, Bond Yields and Fed Rate Bets Weigh on Sentiment
Rising oil prices, elevated bond yields, and mounting expectations of a Federal Reserve rate increase are combining to challenge bitcoin bulls just as inflation data lands. LMAX Group market strategist Joel Kruger told The Block that bitcoin “is holding near $80,000 following an aggressive August rally that pushed momentum into overbought territory,” pointing specifically to higher Treasury yields and rising oil prices following renewed U.S.-Iran tensions as headwinds the market has had to absorb.
This matters for a simple reason: rate-sensitive assets like bitcoin tend to lose their shine when yields climb, because investors can earn safer, competitive returns from government debt instead. Add renewed inflation concerns to that mix, and the market environment turns noticeably less friendly for anyone betting on a quick move higher.
CME FedWatch Points to Elevated Rate-Hike Odds
According to CME FedWatch data, there is now more than a 60% chance of a Federal Reserve interest rate increase next week. That estimate ticked up after Friday’s U.S. jobs report showed 162,000 jobs added in August, while unemployment held steady at 4.1%. The Block reported the same figure, noting that Treasury yields and the dollar both rose following the release, adding fresh pressure on bitcoin and other rate-sensitive assets.
PPI and CPI Reports Could Decide Bitcoin’s Next Move
The next real test for bitcoin arrives with two back-to-back inflation reports. Economists anticipate that the U.S. Producer Price Index, due for release Thursday, will reveal a 0.4% month-over-month rise in producer-level inflation for August. That would push the annualized PPI reading to 5.3% from 4.7% — a sharp enough jump to further cement expectations of a Fed rate hike, potentially strengthening the dollar and adding more pressure on bitcoin.
Friday’s Consumer Price Index report is also expected to show a re-acceleration in inflation, giving policymakers one more data point before their decision. This is where the bitcoin price inflation story truly comes into focus: two consecutive hot inflation prints, layered on top of a strong jobs report, would leave the Fed with little room to argue for patience, and markets are already pricing that scenario in.
Bitcoin’s Range: Watching $76,000 and $82,000
From a technical standpoint, bitcoin has continued trading within a clearly defined range between about $76,000 and $82,000, and according to the pattern traders have been monitoring, a move above $82,000 would point to a fresh bullish breakout while a slide below $76,000 would shift the near-term outlook toward bearish.
Why does this matter beyond the immediate price action? Because the range itself has become a proxy for how the market is digesting US inflation data and Federal Reserve rate hike odds simultaneously. Every inflation print between now and the Fed’s decision effectively acts as a vote on which side of that range bitcoin ultimately breaks toward — and traders softening their bullish exposure now suggests many aren’t ready to call that outcome yet.
FAQ
Why are Bitcoin traders reducing bullish exposure?
Traders are reducing bullish exposure as call skew softens, reflecting caution amid Bitcoin’s recent price pullback and macroeconomic concerns tied to oil prices, bond yields, and rate hike expectations.
What inflation data is influencing Bitcoin’s price outlook?
Upcoming U.S. Producer Price Index and Consumer Price Index releases are expected to show a re-acceleration in inflation, which could influence Federal Reserve rate hike expectations and, in turn, bitcoin sentiment.
What are the key Bitcoin price levels to watch for market direction?
Bitcoin is trading between roughly $76,000 and $82,000. A break above $82,000 could indicate a bullish breakout, while a drop below $76,000 might signal a bearish outlook.
How likely is a Federal Reserve interest rate hike and how does it affect Bitcoin?
CME FedWatch data shows more than a 60% chance of a rate hike next week, a probability that has climbed following stronger-than-expected jobs data. A hike could strengthen the dollar and add further pressure on bitcoin’s price.
Article produced with the assistance of artificial intelligence and reviewed by the editorial team.
Key takeaways
Bitcoin recently pulled back from above $80,000 to around $77,845.88, with its spot price retracing from highs above $81,000 to roughly $78,000, according to CoinDesk.
Options data from OrderX shows call skew softening as traders shed bullish exposure following early-week weakness.
U.S. Producer Price Index data due Thursday is expected to show a 0.4% monthly rise, pushing the annualized rate from 4.7% to 5.3%.
CME FedWatch data points to a more than 60% probability of a Federal Reserve rate hike next week, a figure corroborated separately by The Block following last week’s jobs report.
Bitcoin has been trading in a range between roughly $76,000 and $82,000, with a break above or below those levels seen as a directional signal.
Bitcoin Price Retreats From $81,000 Toward the High $70,000s
Bitcoin‘s most recent slide tells a fairly clear story: momentum that built through August has cooled off just as fast as it appeared. The token was changing hands around $77,845.88 as of CoinDesk’s report, a retreat from levels above $80,000 reached only days earlier. That pullback mirrors a broader retracement from highs above $81,000 to about $78,000, a move CoinDesk attributed to a mix of market pressures rather than any single catalyst.
Corroborating that picture, crypto.news reported Bitcoin trading near $79,176, down 0.8% over 24 hours, after moving between $78,707 and $80,494 — essentially the same consolidation zone described elsewhere. The Block similarly noted BTC changing hands around $79,500 on Monday after climbing above $82,000 the previous week, before Friday’s jobs report knocked the wind out of the rally.
Traders Dial Down Bullish Bets as Call Skew Softens
Options positioning is showing traders getting more cautious, not less. AI-powered trading terminal OrderX said on X that “call skew continues to soften as traders shed bullish exposure following early-week weakness.” Options skew measures the balance between calls — bullish bets on further upside — and puts, which act as insurance against a drop. A softening skew means fewer traders are chasing gains through calls and more are hedging.
This matters because it reflects sentiment shifting in real time, ahead of hard data. Bitfinex analysts, cited by crypto.news, described the current price structure as supporting “continued consolidation with an upside bias” rather than a confirmed breakout — a characterization that lines up with what the softening skew suggests: traders aren’t abandoning bitcoin, but they’re no longer betting aggressively on a fast move higher.
Oil, Bond Yields and Fed Rate Bets Weigh on Sentiment
Rising oil prices, elevated bond yields, and mounting expectations of a Federal Reserve rate increase are combining to challenge bitcoin bulls just as inflation data lands. LMAX Group market strategist Joel Kruger told The Block that bitcoin “is holding near $80,000 following an aggressive August rally that pushed momentum into overbought territory,” pointing specifically to higher Treasury yields and rising oil prices following renewed U.S.-Iran tensions as headwinds the market has had to absorb.
This matters for a simple reason: rate-sensitive assets like bitcoin tend to lose their shine when yields climb, because investors can earn safer, competitive returns from government debt instead. Add renewed inflation concerns to that mix, and the market environment turns noticeably less friendly for anyone betting on a quick move higher.
CME FedWatch Points to Elevated Rate-Hike Odds
According to CME FedWatch data, there is now more than a 60% chance of a Federal Reserve interest rate increase next week. That estimate ticked up after Friday’s U.S. jobs report showed 162,000 jobs added in August, while unemployment held steady at 4.1%. The Block reported the same figure, noting that Treasury yields and the dollar both rose following the release, adding fresh pressure on bitcoin and other rate-sensitive assets.
PPI and CPI Reports Could Decide Bitcoin’s Next Move
The next real test for bitcoin arrives with two back-to-back inflation reports. Economists anticipate that the U.S. Producer Price Index, due for release Thursday, will reveal a 0.4% month-over-month rise in producer-level inflation for August. That would push the annualized PPI reading to 5.3% from 4.7% — a sharp enough jump to further cement expectations of a Fed rate hike, potentially strengthening the dollar and adding more pressure on bitcoin.
Friday’s Consumer Price Index report is also expected to show a re-acceleration in inflation, giving policymakers one more data point before their decision. This is where the bitcoin price inflation story truly comes into focus: two consecutive hot inflation prints, layered on top of a strong jobs report, would leave the Fed with little room to argue for patience, and markets are already pricing that scenario in.
Bitcoin’s Range: Watching $76,000 and $82,000
From a technical standpoint, bitcoin has continued trading within a clearly defined range between about $76,000 and $82,000, and according to the pattern traders have been monitoring, a move above $82,000 would point to a fresh bullish breakout while a slide below $76,000 would shift the near-term outlook toward bearish.
Why does this matter beyond the immediate price action? Because the range itself has become a proxy for how the market is digesting US inflation data and Federal Reserve rate hike odds simultaneously. Every inflation print between now and the Fed’s decision effectively acts as a vote on which side of that range bitcoin ultimately breaks toward — and traders softening their bullish exposure now suggests many aren’t ready to call that outcome yet.
FAQ
Why are Bitcoin traders reducing bullish exposure?
Traders are reducing bullish exposure as call skew softens, reflecting caution amid Bitcoin’s recent price pullback and macroeconomic concerns tied to oil prices, bond yields, and rate hike expectations.
What inflation data is influencing Bitcoin’s price outlook?
Upcoming U.S. Producer Price Index and Consumer Price Index releases are expected to show a re-acceleration in inflation, which could influence Federal Reserve rate hike expectations and, in turn, bitcoin sentiment.
What are the key Bitcoin price levels to watch for market direction?
Bitcoin is trading between roughly $76,000 and $82,000. A break above $82,000 could indicate a bullish breakout, while a drop below $76,000 might signal a bearish outlook.
How likely is a Federal Reserve interest rate hike and how does it affect Bitcoin?
CME FedWatch data shows more than a 60% chance of a rate hike next week, a probability that has climbed following stronger-than-expected jobs data. A hike could strengthen the dollar and add further pressure on bitcoin’s price.
Article produced with the assistance of artificial intelligence and reviewed by the editorial team.
186

Article
American Eagle Outfitters, Inc. stock stays bearish despite Q2 earnings beatAmerican Eagle Outfitters, Inc. stock sits at a fragile juncture. Price closed at $16.89 on September 9, below every major moving average. A Q2 earnings beat failed to convince, as margin concerns overshadowed headline strength. The bearish technical structure now confronts a more nuanced fundamental story.
AEO — daily chart with candlesticks, EMA20/EMA50 and volume.
Key takeaways
AEO closed at $16.89 on September 9, below the EMA20, EMA50, and EMA200 on the daily chart.
The daily regime is bearish, but RSI14 at 49.36 shows neutral momentum, not oversold conditions.
Q2 2026 earnings beat expectations, driven by tariff refunds, yet margin tightening weighed on the stock reaction.
Management raised full-year operating income guidance to $540 million to $550 million; Q3 comps guided to mid- to high-single digits.
Bullish invalidation requires a daily close above the EMA200 at $17.65; bearish continuation targets S1 at $16.63.
Daily Structure Confirms a Bearish Regime for AEO Stock
The daily chart signals a bearish regime. Price closed at $16.89, below the EMA20 ($16.92), the EMA50 ($17.06), and notably below the EMA200 ($17.65). That stacking of moving averages above spot price is a textbook bearish alignment.
Momentum Indicators Signal Caution, Not Collapse
However, momentum is not collapsing. RSI14 sits at 49.36, essentially neutral. That is an important nuance. A reading near 50 means sellers do not have full control of momentum yet, even though the trend structure favors them.
Meanwhile, the daily MACD line (-0.02) remains above its signal (-0.09). The histogram is positive at 0.07. That signals fading downside pressure. It is not a reversal signal, but it is worth watching closely.
Volatility and Pivot Context
Bollinger Bands add further context. The mid-band sits at 16.67, with the upper band at 17.49 and the lower band at 15.84. Price trades just above the midline. This leaves room to move in either direction without stretching volatility extremes.
ATR14 at 0.68 confirms that daily swings remain meaningful. Sharp intraday moves should not surprise anyone tracking American Eagle Outfitters, Inc. stock this week. On the pivot side, the daily pivot point at 17.02 sits just above current price. Resistance stands at 17.29 (R1) and support at 16.63 (S1). As long as price stays below the pivot, sellers retain a slight structural edge.
H1 Timeframe: Momentum Stalling Near Resistance
The hourly chart shows consolidation, not trend continuation. Price at 16.91 trades below the EMA20 (17.07) but above the EMA50 (16.98) and roughly in line with the EMA200 (16.93). That is a mixed EMA stack, unlike the clean bearish alignment on the daily chart.
Therefore, the H1 tape reads as consolidation rather than trend continuation. RSI14 at 45.75 leans soft but is not extreme. More telling is the MACD: the line at 0.02 is still above zero. However, the histogram has flipped negative at -0.04. Upward momentum that built earlier in the session is now stalling. This lines up with the daily bearish bias rather than fighting it.
The H1 pivot at 16.98 sits just above the current close, with resistance at 17.07 and support at 16.81. Price hovering below its own pivot reinforces the short-term defensive posture. Bollinger Bands on H1 show the mid at 17.14 and the lower band at 16.85. Price is pressing toward the lower band, another sign that intraday sellers are still active.
15m Execution Context
The 15-minute chart reveals short-term weakness. RSI14 has dropped to 39.77, approaching oversold territory without quite reaching it. Price at 16.91 trades below the EMA20 (17.08) and EMA50 (17.10). However, it remains above the EMA200 (16.99). MACD is modestly negative, with the histogram at -0.01, confirming short-term downside pressure.
The 15m pivot at 16.94 sits just above spot, with support at 16.85 and resistance at 17.01. For traders using this timeframe purely for timing, the tight ATR14 of 0.12 suggests compressed short-term volatility. Any breakout above 17.01 or breakdown below 16.85 could set the tone for the next few hours.
Earnings Context: A Beat That Didn’t Convince
Q2 2026 results beat expectations but failed to inspire buyers. The beat was largely driven by tariff refunds rather than organic strength. Margins tightened as a result. Shares fell despite the headline beat. This explains why the daily chart shows a bearish tilt even as fundamentals were technically positive on the surface.
On a more constructive note, management raised full-year operating income guidance to a range of $540 million to $550 million. Q3 comparable sales are expected in the mid- to high-single-digit range. Aerie continues to show strength as a brand, which is a genuine positive within the portfolio. At the same time, the AE segment carries inventory and denim-related risks that management flagged directly on the earnings call. That tension between a strong Aerie business and a softer AE core likely explains why the stock reaction has been muted rather than celebratory.
Bullish Scenario for American Eagle Outfitters Stock
Bulls need to reclaim the daily EMA20 near $16.92 and push through the pivot at $17.02. A close back above the EMA50 at $17.06 would follow. A test of R1 at $17.29 would meaningfully weaken the bearish regime tag on the daily chart.
If Q3 comps actually land in the mid- to high-single-digit range as guided, and if Aerie’s momentum continues to offset AE segment softness, sentiment could shift quickly. A daily close above the EMA200 at $17.65 would be the clearest technical signal that the broader downtrend has been invalidated.
Bearish Scenario and Invalidation Levels
Sellers likely stay in control if American Eagle Outfitters, Inc. stock fails to reclaim the daily pivot. Continued trading below the EMA20 and EMA50 would reinforce the bearish structure. A break below S1 at $16.63 would open the door toward the lower Bollinger Band at $15.84. That represents a meaningful downside extension from current levels.
Continued margin compression could add fuel to the bearish case. Further denim or inventory-related commentary would also weigh on sentiment. Disappointment in Q3 comps versus the mid- to high-single-digit guidance would reinforce this path. In this scenario, the daily bearish regime continues to dominate. H1 and 15m weakness would act as confirmation rather than contradiction.
Closing Take on American Eagle Outfitters, Inc. Stock
Overall, American Eagle Outfitters, Inc. stock sits at a technically important juncture. The daily timeframe is bearish by structure. Yet momentum indicators are not screaming oversold, leaving room for a bounce attempt. The H1 chart shows stalling momentum near resistance, largely echoing the daily caution. The 15m timeframe confirms short-term softness without extreme readings.
Given the post-earnings volatility and the tension between Aerie’s strength and AE segment risks, positioning here requires patience. Volatility, as measured by ATR across all three timeframes, remains elevated. Both scenarios deserve respect until price commits clearly above or below the key levels outlined above.
FAQ
What is the outlook for American Eagle Outfitters, Inc. stock?
The daily chart shows a bearish regime with price at $16.89 below all major moving averages. However, RSI14 at 49.36 signals neutral momentum rather than oversold conditions. This leaves room for either a bounce or further decline depending on how key levels are resolved.
What are the key price levels to watch for AEO stock?
Key support sits at S1 ($16.63) and the lower daily Bollinger Band ($15.84). Resistance levels include the daily pivot ($17.02), R1 ($17.29), and the EMA200 ($17.65). A close above the EMA200 would invalidate the bearish structure.
Why did American Eagle stock fall after beating Q2 earnings?
The Q2 2026 beat was largely driven by tariff refunds rather than organic strength. Margin tightening overshadowed the headline beat. Management also flagged denim and inventory risks in the AE segment during the earnings call.
What is American Eagle’s guidance for the rest of the year?
Management raised full-year operating income guidance to a range of $540 million to $550 million. Q3 comparable sales are expected in the mid- to high-single-digit range. Aerie continues to show brand strength within the portfolio.
Disclaimer: This article is for informational purposes only and does not constitute financial advice, an investment recommendation, or a solicitation to buy or sell any financial instrument or cryptocurrency. The analysis provided is not indicative of future results. Investing in crypto assets and financial markets carries a high risk of capital loss. Always do your own research (DYOR) and consult a qualified financial advisor before making any decision.
Article produced with the assistance of artificial intelligence and reviewed by the editorial team.
American Eagle Outfitters, Inc. stock stays bearish despite Q2 earnings beat
American Eagle Outfitters, Inc. stock sits at a fragile juncture. Price closed at $16.89 on September 9, below every major moving average. A Q2 earnings beat failed to convince, as margin concerns overshadowed headline strength. The bearish technical structure now confronts a more nuanced fundamental story.
AEO — daily chart with candlesticks, EMA20/EMA50 and volume.
Key takeaways
AEO closed at $16.89 on September 9, below the EMA20, EMA50, and EMA200 on the daily chart.
The daily regime is bearish, but RSI14 at 49.36 shows neutral momentum, not oversold conditions.
Q2 2026 earnings beat expectations, driven by tariff refunds, yet margin tightening weighed on the stock reaction.
Management raised full-year operating income guidance to $540 million to $550 million; Q3 comps guided to mid- to high-single digits.
Bullish invalidation requires a daily close above the EMA200 at $17.65; bearish continuation targets S1 at $16.63.
Daily Structure Confirms a Bearish Regime for AEO Stock
The daily chart signals a bearish regime. Price closed at $16.89, below the EMA20 ($16.92), the EMA50 ($17.06), and notably below the EMA200 ($17.65). That stacking of moving averages above spot price is a textbook bearish alignment.
Momentum Indicators Signal Caution, Not Collapse
However, momentum is not collapsing. RSI14 sits at 49.36, essentially neutral. That is an important nuance. A reading near 50 means sellers do not have full control of momentum yet, even though the trend structure favors them.
Meanwhile, the daily MACD line (-0.02) remains above its signal (-0.09). The histogram is positive at 0.07. That signals fading downside pressure. It is not a reversal signal, but it is worth watching closely.
Volatility and Pivot Context
Bollinger Bands add further context. The mid-band sits at 16.67, with the upper band at 17.49 and the lower band at 15.84. Price trades just above the midline. This leaves room to move in either direction without stretching volatility extremes.
ATR14 at 0.68 confirms that daily swings remain meaningful. Sharp intraday moves should not surprise anyone tracking American Eagle Outfitters, Inc. stock this week. On the pivot side, the daily pivot point at 17.02 sits just above current price. Resistance stands at 17.29 (R1) and support at 16.63 (S1). As long as price stays below the pivot, sellers retain a slight structural edge.
H1 Timeframe: Momentum Stalling Near Resistance
The hourly chart shows consolidation, not trend continuation. Price at 16.91 trades below the EMA20 (17.07) but above the EMA50 (16.98) and roughly in line with the EMA200 (16.93). That is a mixed EMA stack, unlike the clean bearish alignment on the daily chart.
Therefore, the H1 tape reads as consolidation rather than trend continuation. RSI14 at 45.75 leans soft but is not extreme. More telling is the MACD: the line at 0.02 is still above zero. However, the histogram has flipped negative at -0.04. Upward momentum that built earlier in the session is now stalling. This lines up with the daily bearish bias rather than fighting it.
The H1 pivot at 16.98 sits just above the current close, with resistance at 17.07 and support at 16.81. Price hovering below its own pivot reinforces the short-term defensive posture. Bollinger Bands on H1 show the mid at 17.14 and the lower band at 16.85. Price is pressing toward the lower band, another sign that intraday sellers are still active.
15m Execution Context
The 15-minute chart reveals short-term weakness. RSI14 has dropped to 39.77, approaching oversold territory without quite reaching it. Price at 16.91 trades below the EMA20 (17.08) and EMA50 (17.10). However, it remains above the EMA200 (16.99). MACD is modestly negative, with the histogram at -0.01, confirming short-term downside pressure.
The 15m pivot at 16.94 sits just above spot, with support at 16.85 and resistance at 17.01. For traders using this timeframe purely for timing, the tight ATR14 of 0.12 suggests compressed short-term volatility. Any breakout above 17.01 or breakdown below 16.85 could set the tone for the next few hours.
Earnings Context: A Beat That Didn’t Convince
Q2 2026 results beat expectations but failed to inspire buyers. The beat was largely driven by tariff refunds rather than organic strength. Margins tightened as a result. Shares fell despite the headline beat. This explains why the daily chart shows a bearish tilt even as fundamentals were technically positive on the surface.
On a more constructive note, management raised full-year operating income guidance to a range of $540 million to $550 million. Q3 comparable sales are expected in the mid- to high-single-digit range. Aerie continues to show strength as a brand, which is a genuine positive within the portfolio. At the same time, the AE segment carries inventory and denim-related risks that management flagged directly on the earnings call. That tension between a strong Aerie business and a softer AE core likely explains why the stock reaction has been muted rather than celebratory.
Bullish Scenario for American Eagle Outfitters Stock
Bulls need to reclaim the daily EMA20 near $16.92 and push through the pivot at $17.02. A close back above the EMA50 at $17.06 would follow. A test of R1 at $17.29 would meaningfully weaken the bearish regime tag on the daily chart.
If Q3 comps actually land in the mid- to high-single-digit range as guided, and if Aerie’s momentum continues to offset AE segment softness, sentiment could shift quickly. A daily close above the EMA200 at $17.65 would be the clearest technical signal that the broader downtrend has been invalidated.
Bearish Scenario and Invalidation Levels
Sellers likely stay in control if American Eagle Outfitters, Inc. stock fails to reclaim the daily pivot. Continued trading below the EMA20 and EMA50 would reinforce the bearish structure. A break below S1 at $16.63 would open the door toward the lower Bollinger Band at $15.84. That represents a meaningful downside extension from current levels.
Continued margin compression could add fuel to the bearish case. Further denim or inventory-related commentary would also weigh on sentiment. Disappointment in Q3 comps versus the mid- to high-single-digit guidance would reinforce this path. In this scenario, the daily bearish regime continues to dominate. H1 and 15m weakness would act as confirmation rather than contradiction.
Closing Take on American Eagle Outfitters, Inc. Stock
Overall, American Eagle Outfitters, Inc. stock sits at a technically important juncture. The daily timeframe is bearish by structure. Yet momentum indicators are not screaming oversold, leaving room for a bounce attempt. The H1 chart shows stalling momentum near resistance, largely echoing the daily caution. The 15m timeframe confirms short-term softness without extreme readings.
Given the post-earnings volatility and the tension between Aerie’s strength and AE segment risks, positioning here requires patience. Volatility, as measured by ATR across all three timeframes, remains elevated. Both scenarios deserve respect until price commits clearly above or below the key levels outlined above.
FAQ
What is the outlook for American Eagle Outfitters, Inc. stock?
The daily chart shows a bearish regime with price at $16.89 below all major moving averages. However, RSI14 at 49.36 signals neutral momentum rather than oversold conditions. This leaves room for either a bounce or further decline depending on how key levels are resolved.
What are the key price levels to watch for AEO stock?
Key support sits at S1 ($16.63) and the lower daily Bollinger Band ($15.84). Resistance levels include the daily pivot ($17.02), R1 ($17.29), and the EMA200 ($17.65). A close above the EMA200 would invalidate the bearish structure.
Why did American Eagle stock fall after beating Q2 earnings?
The Q2 2026 beat was largely driven by tariff refunds rather than organic strength. Margin tightening overshadowed the headline beat. Management also flagged denim and inventory risks in the AE segment during the earnings call.
What is American Eagle’s guidance for the rest of the year?
Management raised full-year operating income guidance to a range of $540 million to $550 million. Q3 comparable sales are expected in the mid- to high-single-digit range. Aerie continues to show brand strength within the portfolio.
Disclaimer: This article is for informational purposes only and does not constitute financial advice, an investment recommendation, or a solicitation to buy or sell any financial instrument or cryptocurrency. The analysis provided is not indicative of future results. Investing in crypto assets and financial markets carries a high risk of capital loss. Always do your own research (DYOR) and consult a qualified financial advisor before making any decision.
Article produced with the assistance of artificial intelligence and reviewed by the editorial team.
AEO — daily chart with candlesticks, EMA20/EMA50 and volume.
Key takeaways
AEO closed at $16.89 on September 9, below the EMA20, EMA50, and EMA200 on the daily chart.
The daily regime is bearish, but RSI14 at 49.36 shows neutral momentum, not oversold conditions.
Q2 2026 earnings beat expectations, driven by tariff refunds, yet margin tightening weighed on the stock reaction.
Management raised full-year operating income guidance to $540 million to $550 million; Q3 comps guided to mid- to high-single digits.
Bullish invalidation requires a daily close above the EMA200 at $17.65; bearish continuation targets S1 at $16.63.
Daily Structure Confirms a Bearish Regime for AEO Stock
The daily chart signals a bearish regime. Price closed at $16.89, below the EMA20 ($16.92), the EMA50 ($17.06), and notably below the EMA200 ($17.65). That stacking of moving averages above spot price is a textbook bearish alignment.
Momentum Indicators Signal Caution, Not Collapse
However, momentum is not collapsing. RSI14 sits at 49.36, essentially neutral. That is an important nuance. A reading near 50 means sellers do not have full control of momentum yet, even though the trend structure favors them.
Meanwhile, the daily MACD line (-0.02) remains above its signal (-0.09). The histogram is positive at 0.07. That signals fading downside pressure. It is not a reversal signal, but it is worth watching closely.
Volatility and Pivot Context
Bollinger Bands add further context. The mid-band sits at 16.67, with the upper band at 17.49 and the lower band at 15.84. Price trades just above the midline. This leaves room to move in either direction without stretching volatility extremes.
ATR14 at 0.68 confirms that daily swings remain meaningful. Sharp intraday moves should not surprise anyone tracking American Eagle Outfitters, Inc. stock this week. On the pivot side, the daily pivot point at 17.02 sits just above current price. Resistance stands at 17.29 (R1) and support at 16.63 (S1). As long as price stays below the pivot, sellers retain a slight structural edge.
H1 Timeframe: Momentum Stalling Near Resistance
The hourly chart shows consolidation, not trend continuation. Price at 16.91 trades below the EMA20 (17.07) but above the EMA50 (16.98) and roughly in line with the EMA200 (16.93). That is a mixed EMA stack, unlike the clean bearish alignment on the daily chart.
Therefore, the H1 tape reads as consolidation rather than trend continuation. RSI14 at 45.75 leans soft but is not extreme. More telling is the MACD: the line at 0.02 is still above zero. However, the histogram has flipped negative at -0.04. Upward momentum that built earlier in the session is now stalling. This lines up with the daily bearish bias rather than fighting it.
The H1 pivot at 16.98 sits just above the current close, with resistance at 17.07 and support at 16.81. Price hovering below its own pivot reinforces the short-term defensive posture. Bollinger Bands on H1 show the mid at 17.14 and the lower band at 16.85. Price is pressing toward the lower band, another sign that intraday sellers are still active.
15m Execution Context
The 15-minute chart reveals short-term weakness. RSI14 has dropped to 39.77, approaching oversold territory without quite reaching it. Price at 16.91 trades below the EMA20 (17.08) and EMA50 (17.10). However, it remains above the EMA200 (16.99). MACD is modestly negative, with the histogram at -0.01, confirming short-term downside pressure.
The 15m pivot at 16.94 sits just above spot, with support at 16.85 and resistance at 17.01. For traders using this timeframe purely for timing, the tight ATR14 of 0.12 suggests compressed short-term volatility. Any breakout above 17.01 or breakdown below 16.85 could set the tone for the next few hours.
Earnings Context: A Beat That Didn’t Convince
Q2 2026 results beat expectations but failed to inspire buyers. The beat was largely driven by tariff refunds rather than organic strength. Margins tightened as a result. Shares fell despite the headline beat. This explains why the daily chart shows a bearish tilt even as fundamentals were technically positive on the surface.
On a more constructive note, management raised full-year operating income guidance to a range of $540 million to $550 million. Q3 comparable sales are expected in the mid- to high-single-digit range. Aerie continues to show strength as a brand, which is a genuine positive within the portfolio. At the same time, the AE segment carries inventory and denim-related risks that management flagged directly on the earnings call. That tension between a strong Aerie business and a softer AE core likely explains why the stock reaction has been muted rather than celebratory.
Bullish Scenario for American Eagle Outfitters Stock
Bulls need to reclaim the daily EMA20 near $16.92 and push through the pivot at $17.02. A close back above the EMA50 at $17.06 would follow. A test of R1 at $17.29 would meaningfully weaken the bearish regime tag on the daily chart.
If Q3 comps actually land in the mid- to high-single-digit range as guided, and if Aerie’s momentum continues to offset AE segment softness, sentiment could shift quickly. A daily close above the EMA200 at $17.65 would be the clearest technical signal that the broader downtrend has been invalidated.
Bearish Scenario and Invalidation Levels
Sellers likely stay in control if American Eagle Outfitters, Inc. stock fails to reclaim the daily pivot. Continued trading below the EMA20 and EMA50 would reinforce the bearish structure. A break below S1 at $16.63 would open the door toward the lower Bollinger Band at $15.84. That represents a meaningful downside extension from current levels.
Continued margin compression could add fuel to the bearish case. Further denim or inventory-related commentary would also weigh on sentiment. Disappointment in Q3 comps versus the mid- to high-single-digit guidance would reinforce this path. In this scenario, the daily bearish regime continues to dominate. H1 and 15m weakness would act as confirmation rather than contradiction.
Closing Take on American Eagle Outfitters, Inc. Stock
Overall, American Eagle Outfitters, Inc. stock sits at a technically important juncture. The daily timeframe is bearish by structure. Yet momentum indicators are not screaming oversold, leaving room for a bounce attempt. The H1 chart shows stalling momentum near resistance, largely echoing the daily caution. The 15m timeframe confirms short-term softness without extreme readings.
Given the post-earnings volatility and the tension between Aerie’s strength and AE segment risks, positioning here requires patience. Volatility, as measured by ATR across all three timeframes, remains elevated. Both scenarios deserve respect until price commits clearly above or below the key levels outlined above.
FAQ
What is the outlook for American Eagle Outfitters, Inc. stock?
The daily chart shows a bearish regime with price at $16.89 below all major moving averages. However, RSI14 at 49.36 signals neutral momentum rather than oversold conditions. This leaves room for either a bounce or further decline depending on how key levels are resolved.
What are the key price levels to watch for AEO stock?
Key support sits at S1 ($16.63) and the lower daily Bollinger Band ($15.84). Resistance levels include the daily pivot ($17.02), R1 ($17.29), and the EMA200 ($17.65). A close above the EMA200 would invalidate the bearish structure.
Why did American Eagle stock fall after beating Q2 earnings?
The Q2 2026 beat was largely driven by tariff refunds rather than organic strength. Margin tightening overshadowed the headline beat. Management also flagged denim and inventory risks in the AE segment during the earnings call.
What is American Eagle’s guidance for the rest of the year?
Management raised full-year operating income guidance to a range of $540 million to $550 million. Q3 comparable sales are expected in the mid- to high-single-digit range. Aerie continues to show brand strength within the portfolio.
Disclaimer: This article is for informational purposes only and does not constitute financial advice, an investment recommendation, or a solicitation to buy or sell any financial instrument or cryptocurrency. The analysis provided is not indicative of future results. Investing in crypto assets and financial markets carries a high risk of capital loss. Always do your own research (DYOR) and consult a qualified financial advisor before making any decision.
Article produced with the assistance of artificial intelligence and reviewed by the editorial team.
9

Article
Cloudflare, Inc. stock surges 9.25% on OpenAI deal, hits overbought signalCloudflare, Inc. stock surged 6.32% to close at $314.18 after announcing a security partnership with OpenAI. The session produced a trend-day breakout—open at $295.5, high of $317.55—changing NET‘s technical picture heading into the next sessions.
NET — daily chart with candlesticks, EMA20/EMA50 and volume.
Key takeaways
Cloudflare, Inc. stock jumped 9.25% to $314.18 on an OpenAI security partnership announcement.
Daily EMA structure remains bullish with EMA20/50/200 stacked, but the daily MACD shows a negative histogram.
1H RSI14 at 76.63 signals overbought conditions despite strong short-term momentum.
Near-term resistance sits at $323.64 (R1) and the upper Bollinger Band at $326.3.
Insider caution: President Michelle Zatlyn sold $27.6 million in stock.
Cloudflare, Inc. Stock: Daily Trend and Momentum Structure
Cloudflare, Inc. stock maintains a clearly bullish daily structure, with price trading above all three key moving averages. However, momentum indicators are sending mixed signals that warrant attention. Price is above the EMA20 at $291.1, the EMA50 at $279.65, and the EMA200 at $238.08. This stacked alignment reflects a well-established uptrend. The daily RSI14 sits at 58.58, a constructive reading rather than a stretched one. In other words, there is still room for the rally to extend before the daily timeframe flags overbought conditions.
However, the daily MACD introduces a note of caution. The MACD line at 2.2 sits below the signal line at 2.85, producing a negative histogram of -0.65. That is a subtle divergence. Price just broke out aggressively, yet daily momentum has not fully confirmed the move. It is not a reversal signal. But it does suggest the breakout is running slightly ahead of the underlying momentum reading.
Cloudflare, Inc. Stock: Volatility and Bollinger Context
Volatility has expanded sharply, and NET is now pressing against the upper Bollinger Band. This signals both strength and potential exhaustion risk. Daily ATR14 sits at 16.94, roughly double what a quieter tape would show. Price has pushed well above the Bollinger midline at $295.33 and now approaches the upper band at $326.3. The lower band sits far below at $264.35. This positioning near the upper band, combined with elevated ATR, points to a market that has moved fast. The tape could either extend on strong follow-through or digest the gain through consolidation.
The daily pivot structure reinforces this framing. The pivot point stands at $308.09. Resistance R1 sits at $323.64 and support S1 at $298.63. Friday’s close above the pivot keeps the bullish bias intact. A push through R1 would open the door toward the upper Bollinger Band as the next real test.
1H Timeframe: Confirmation With an Overbought Warning
The 1-hour chart confirms Cloudflare, Inc. stock‘s bullish trend structure but flashes an overbought warning the daily chart does not yet show. The EMA20 ($298.17), EMA50 ($292.29), and EMA200 ($290.29) are all stacked bullishly. Price at $314.28 trades comfortably above all three. The 1H MACD is notably strong. The line at 8.18 stands well above the signal at 4.85, with a histogram of 3.33. This shows genuine momentum behind the move, not a one-off spike.
At the same time, the 1H RSI14 has climbed to 76.63, a clearly overbought reading. This is where the timeframes start to diverge in tone. The daily chart still has room to run, but the hourly chart is flashing exhaustion risk after such a fast rally. Price is currently sitting almost exactly on the 1H pivot at $314.13. Resistance R1 at $315.94 sits just overhead, and support S1 at $312.46 lies close below. That tight range around the pivot suggests the market is pausing to decide its next direction.
15-Minute Execution Context
The 15-minute chart reveals early signs of short-term momentum fatigue. This suggests a pause or shallow pullback before any renewed push higher. The EMA20 ($311.47), EMA50 ($302.25), and EMA200 ($291.42) remain bullishly aligned. RSI14 at 65.98 is firm but not extreme. Yet the 15m MACD histogram is negative at -0.98, with the line at 4.46 below the signal at 5.44. That short-term momentum cooling is notable. It comes right as price hovers near the upper Bollinger Band at $317.8. ATR14 on this timeframe is a modest $1.87, consistent with tighter intraday ranges as the market consolidates Wednesday’s breakout gains.
Overall, the multi-timeframe read is bullish on trend but mixed on momentum. The daily chart supports continuation. The 1H chart confirms the uptrend while warning of overbought conditions. Meanwhile, the 15m chart shows early signs of short-term fatigue. This is a market that has moved fast and now needs to prove it can hold new ground.
Bullish Scenario
The bullish case for Cloudflare, Inc. stock hinges on the fundamental catalyst and technical follow-through above $323.64. News flow around the OpenAI security partnership gives the rally a narrative beyond pure technicals. Commentary also suggests Meta’s new Muse agent could boost web traffic, potentially lifting Cloudflare’s revenue. Options activity has signaled bullish conviction around the 9.25% surge, according to Investing.com. Therefore, if price holds above the daily EMA20 near $291.1 and clears R1 at $323.64, the path toward the upper Bollinger Band at $326.3 becomes the next target. A sustained break there would confirm the breakout has staying power.
Bearish Scenario
The bearish case builds on overbought hourly conditions and insider selling activity. Failure to hold $312.46 would serve as an early warning sign. The overbought 1H RSI at 76.63, combined with the negative daily MACD histogram, builds a credible case for a near-term pullback. If price fails to hold above the 1H pivot at $314.13 and slips through S1 at $312.46, caution is warranted.
A deeper retracement toward the daily EMA20 at $291.1 would invalidate the immediate bullish continuation. This holds true even if the broader uptrend defined by the EMA200 at $238.08 remains intact. Notably, insider selling adds a layer of caution: Cloudflare president Michelle Zatlyn sold $27.6 million in stock. It is a datapoint worth watching even if it does not by itself determine direction.
The conflict between strong trend structure and stretched short-term momentum is exactly the kind of tension that produces choppy, two-sided price action before resolution. The overbought hourly reading and cooling 15-minute momentum mean this is not a straightforward, one-directional setup.
Cloudflare, Inc. Stock: Technical Outlook
Cloudflare, Inc. stock enters the next sessions with a clear bullish daily bias. A powerful fundamental catalyst and a stacked EMA structure across all three timeframes reinforce this view. At the same time, elevated ATR readings, an overbought 1H RSI, and a softening 15-minute MACD all point to near-term uncertainty. The rally may not extend cleanly without a pause.
Positioning around current levels likely requires patience. Volatility has picked up sharply, and the market appears to be pausing at resistance to absorb Wednesday’s gap. Given the mixed momentum signals layered on a strong trend, near-term price action deserves close attention before assuming the breakout continues in a straight line.
FAQ
What drove Cloudflare, Inc. stock’s 9.25% surge?
The surge followed a newly announced security partnership with OpenAI. Additional commentary around Meta’s Muse agent potentially boosting web traffic and Cloudflare’s revenue added to the bullish sentiment. Options activity also signaled strong conviction behind the move.
Is Cloudflare, Inc. stock overbought after the rally?
On the daily timeframe, RSI14 at 58.58 suggests there is still room to run. However, the 1-hour RSI14 has reached 76.63, which is clearly overbought. This creates a mixed picture: the broader trend remains constructive, but short-term exhaustion risk is elevated.
What are the key support levels for NET?
Immediate support sits at the 1H pivot S1 of $312.46. Below that, the daily pivot S1 at $298.63 and the daily EMA20 at $291.1 represent key levels. The EMA200 at $238.08 defines the broader uptrend floor.
What is the bullish target for Cloudflare, Inc. stock?
The immediate bullish target is the daily R1 resistance at $323.64, followed by the upper Bollinger Band at $326.3. A sustained break above these levels would confirm the breakout has genuine staying power beyond a one-day event.
Disclaimer: This article is for informational purposes only and does not constitute financial advice, an investment recommendation, or a solicitation to buy or sell any financial instrument or cryptocurrency. The analysis provided is not indicative of future results. Investing in crypto assets and financial markets carries a high risk of capital loss. Always do your own research (DYOR) and consult a qualified financial advisor before making any decision.
Article produced with the assistance of artificial intelligence and reviewed by the editorial team.
Cloudflare, Inc. stock surges 9.25% on OpenAI deal, hits overbought signal
Cloudflare, Inc. stock surged 6.32% to close at $314.18 after announcing a security partnership with OpenAI. The session produced a trend-day breakout—open at $295.5, high of $317.55—changing NET‘s technical picture heading into the next sessions.
NET — daily chart with candlesticks, EMA20/EMA50 and volume.
Key takeaways
Cloudflare, Inc. stock jumped 9.25% to $314.18 on an OpenAI security partnership announcement.
Daily EMA structure remains bullish with EMA20/50/200 stacked, but the daily MACD shows a negative histogram.
1H RSI14 at 76.63 signals overbought conditions despite strong short-term momentum.
Near-term resistance sits at $323.64 (R1) and the upper Bollinger Band at $326.3.
Insider caution: President Michelle Zatlyn sold $27.6 million in stock.
Cloudflare, Inc. Stock: Daily Trend and Momentum Structure
Cloudflare, Inc. stock maintains a clearly bullish daily structure, with price trading above all three key moving averages. However, momentum indicators are sending mixed signals that warrant attention. Price is above the EMA20 at $291.1, the EMA50 at $279.65, and the EMA200 at $238.08. This stacked alignment reflects a well-established uptrend. The daily RSI14 sits at 58.58, a constructive reading rather than a stretched one. In other words, there is still room for the rally to extend before the daily timeframe flags overbought conditions.
However, the daily MACD introduces a note of caution. The MACD line at 2.2 sits below the signal line at 2.85, producing a negative histogram of -0.65. That is a subtle divergence. Price just broke out aggressively, yet daily momentum has not fully confirmed the move. It is not a reversal signal. But it does suggest the breakout is running slightly ahead of the underlying momentum reading.
Cloudflare, Inc. Stock: Volatility and Bollinger Context
Volatility has expanded sharply, and NET is now pressing against the upper Bollinger Band. This signals both strength and potential exhaustion risk. Daily ATR14 sits at 16.94, roughly double what a quieter tape would show. Price has pushed well above the Bollinger midline at $295.33 and now approaches the upper band at $326.3. The lower band sits far below at $264.35. This positioning near the upper band, combined with elevated ATR, points to a market that has moved fast. The tape could either extend on strong follow-through or digest the gain through consolidation.
The daily pivot structure reinforces this framing. The pivot point stands at $308.09. Resistance R1 sits at $323.64 and support S1 at $298.63. Friday’s close above the pivot keeps the bullish bias intact. A push through R1 would open the door toward the upper Bollinger Band as the next real test.
1H Timeframe: Confirmation With an Overbought Warning
The 1-hour chart confirms Cloudflare, Inc. stock‘s bullish trend structure but flashes an overbought warning the daily chart does not yet show. The EMA20 ($298.17), EMA50 ($292.29), and EMA200 ($290.29) are all stacked bullishly. Price at $314.28 trades comfortably above all three. The 1H MACD is notably strong. The line at 8.18 stands well above the signal at 4.85, with a histogram of 3.33. This shows genuine momentum behind the move, not a one-off spike.
At the same time, the 1H RSI14 has climbed to 76.63, a clearly overbought reading. This is where the timeframes start to diverge in tone. The daily chart still has room to run, but the hourly chart is flashing exhaustion risk after such a fast rally. Price is currently sitting almost exactly on the 1H pivot at $314.13. Resistance R1 at $315.94 sits just overhead, and support S1 at $312.46 lies close below. That tight range around the pivot suggests the market is pausing to decide its next direction.
15-Minute Execution Context
The 15-minute chart reveals early signs of short-term momentum fatigue. This suggests a pause or shallow pullback before any renewed push higher. The EMA20 ($311.47), EMA50 ($302.25), and EMA200 ($291.42) remain bullishly aligned. RSI14 at 65.98 is firm but not extreme. Yet the 15m MACD histogram is negative at -0.98, with the line at 4.46 below the signal at 5.44. That short-term momentum cooling is notable. It comes right as price hovers near the upper Bollinger Band at $317.8. ATR14 on this timeframe is a modest $1.87, consistent with tighter intraday ranges as the market consolidates Wednesday’s breakout gains.
Overall, the multi-timeframe read is bullish on trend but mixed on momentum. The daily chart supports continuation. The 1H chart confirms the uptrend while warning of overbought conditions. Meanwhile, the 15m chart shows early signs of short-term fatigue. This is a market that has moved fast and now needs to prove it can hold new ground.
Bullish Scenario
The bullish case for Cloudflare, Inc. stock hinges on the fundamental catalyst and technical follow-through above $323.64. News flow around the OpenAI security partnership gives the rally a narrative beyond pure technicals. Commentary also suggests Meta’s new Muse agent could boost web traffic, potentially lifting Cloudflare’s revenue. Options activity has signaled bullish conviction around the 9.25% surge, according to Investing.com. Therefore, if price holds above the daily EMA20 near $291.1 and clears R1 at $323.64, the path toward the upper Bollinger Band at $326.3 becomes the next target. A sustained break there would confirm the breakout has staying power.
Bearish Scenario
The bearish case builds on overbought hourly conditions and insider selling activity. Failure to hold $312.46 would serve as an early warning sign. The overbought 1H RSI at 76.63, combined with the negative daily MACD histogram, builds a credible case for a near-term pullback. If price fails to hold above the 1H pivot at $314.13 and slips through S1 at $312.46, caution is warranted.
A deeper retracement toward the daily EMA20 at $291.1 would invalidate the immediate bullish continuation. This holds true even if the broader uptrend defined by the EMA200 at $238.08 remains intact. Notably, insider selling adds a layer of caution: Cloudflare president Michelle Zatlyn sold $27.6 million in stock. It is a datapoint worth watching even if it does not by itself determine direction.
The conflict between strong trend structure and stretched short-term momentum is exactly the kind of tension that produces choppy, two-sided price action before resolution. The overbought hourly reading and cooling 15-minute momentum mean this is not a straightforward, one-directional setup.
Cloudflare, Inc. Stock: Technical Outlook
Cloudflare, Inc. stock enters the next sessions with a clear bullish daily bias. A powerful fundamental catalyst and a stacked EMA structure across all three timeframes reinforce this view. At the same time, elevated ATR readings, an overbought 1H RSI, and a softening 15-minute MACD all point to near-term uncertainty. The rally may not extend cleanly without a pause.
Positioning around current levels likely requires patience. Volatility has picked up sharply, and the market appears to be pausing at resistance to absorb Wednesday’s gap. Given the mixed momentum signals layered on a strong trend, near-term price action deserves close attention before assuming the breakout continues in a straight line.
FAQ
What drove Cloudflare, Inc. stock’s 9.25% surge?
The surge followed a newly announced security partnership with OpenAI. Additional commentary around Meta’s Muse agent potentially boosting web traffic and Cloudflare’s revenue added to the bullish sentiment. Options activity also signaled strong conviction behind the move.
Is Cloudflare, Inc. stock overbought after the rally?
On the daily timeframe, RSI14 at 58.58 suggests there is still room to run. However, the 1-hour RSI14 has reached 76.63, which is clearly overbought. This creates a mixed picture: the broader trend remains constructive, but short-term exhaustion risk is elevated.
What are the key support levels for NET?
Immediate support sits at the 1H pivot S1 of $312.46. Below that, the daily pivot S1 at $298.63 and the daily EMA20 at $291.1 represent key levels. The EMA200 at $238.08 defines the broader uptrend floor.
What is the bullish target for Cloudflare, Inc. stock?
The immediate bullish target is the daily R1 resistance at $323.64, followed by the upper Bollinger Band at $326.3. A sustained break above these levels would confirm the breakout has genuine staying power beyond a one-day event.
Disclaimer: This article is for informational purposes only and does not constitute financial advice, an investment recommendation, or a solicitation to buy or sell any financial instrument or cryptocurrency. The analysis provided is not indicative of future results. Investing in crypto assets and financial markets carries a high risk of capital loss. Always do your own research (DYOR) and consult a qualified financial advisor before making any decision.
Article produced with the assistance of artificial intelligence and reviewed by the editorial team.
NET — daily chart with candlesticks, EMA20/EMA50 and volume.
Key takeaways
Cloudflare, Inc. stock jumped 9.25% to $314.18 on an OpenAI security partnership announcement.
Daily EMA structure remains bullish with EMA20/50/200 stacked, but the daily MACD shows a negative histogram.
1H RSI14 at 76.63 signals overbought conditions despite strong short-term momentum.
Near-term resistance sits at $323.64 (R1) and the upper Bollinger Band at $326.3.
Insider caution: President Michelle Zatlyn sold $27.6 million in stock.
Cloudflare, Inc. Stock: Daily Trend and Momentum Structure
Cloudflare, Inc. stock maintains a clearly bullish daily structure, with price trading above all three key moving averages. However, momentum indicators are sending mixed signals that warrant attention. Price is above the EMA20 at $291.1, the EMA50 at $279.65, and the EMA200 at $238.08. This stacked alignment reflects a well-established uptrend. The daily RSI14 sits at 58.58, a constructive reading rather than a stretched one. In other words, there is still room for the rally to extend before the daily timeframe flags overbought conditions.
However, the daily MACD introduces a note of caution. The MACD line at 2.2 sits below the signal line at 2.85, producing a negative histogram of -0.65. That is a subtle divergence. Price just broke out aggressively, yet daily momentum has not fully confirmed the move. It is not a reversal signal. But it does suggest the breakout is running slightly ahead of the underlying momentum reading.
Cloudflare, Inc. Stock: Volatility and Bollinger Context
Volatility has expanded sharply, and NET is now pressing against the upper Bollinger Band. This signals both strength and potential exhaustion risk. Daily ATR14 sits at 16.94, roughly double what a quieter tape would show. Price has pushed well above the Bollinger midline at $295.33 and now approaches the upper band at $326.3. The lower band sits far below at $264.35. This positioning near the upper band, combined with elevated ATR, points to a market that has moved fast. The tape could either extend on strong follow-through or digest the gain through consolidation.
The daily pivot structure reinforces this framing. The pivot point stands at $308.09. Resistance R1 sits at $323.64 and support S1 at $298.63. Friday’s close above the pivot keeps the bullish bias intact. A push through R1 would open the door toward the upper Bollinger Band as the next real test.
1H Timeframe: Confirmation With an Overbought Warning
The 1-hour chart confirms Cloudflare, Inc. stock‘s bullish trend structure but flashes an overbought warning the daily chart does not yet show. The EMA20 ($298.17), EMA50 ($292.29), and EMA200 ($290.29) are all stacked bullishly. Price at $314.28 trades comfortably above all three. The 1H MACD is notably strong. The line at 8.18 stands well above the signal at 4.85, with a histogram of 3.33. This shows genuine momentum behind the move, not a one-off spike.
At the same time, the 1H RSI14 has climbed to 76.63, a clearly overbought reading. This is where the timeframes start to diverge in tone. The daily chart still has room to run, but the hourly chart is flashing exhaustion risk after such a fast rally. Price is currently sitting almost exactly on the 1H pivot at $314.13. Resistance R1 at $315.94 sits just overhead, and support S1 at $312.46 lies close below. That tight range around the pivot suggests the market is pausing to decide its next direction.
15-Minute Execution Context
The 15-minute chart reveals early signs of short-term momentum fatigue. This suggests a pause or shallow pullback before any renewed push higher. The EMA20 ($311.47), EMA50 ($302.25), and EMA200 ($291.42) remain bullishly aligned. RSI14 at 65.98 is firm but not extreme. Yet the 15m MACD histogram is negative at -0.98, with the line at 4.46 below the signal at 5.44. That short-term momentum cooling is notable. It comes right as price hovers near the upper Bollinger Band at $317.8. ATR14 on this timeframe is a modest $1.87, consistent with tighter intraday ranges as the market consolidates Wednesday’s breakout gains.
Overall, the multi-timeframe read is bullish on trend but mixed on momentum. The daily chart supports continuation. The 1H chart confirms the uptrend while warning of overbought conditions. Meanwhile, the 15m chart shows early signs of short-term fatigue. This is a market that has moved fast and now needs to prove it can hold new ground.
Bullish Scenario
The bullish case for Cloudflare, Inc. stock hinges on the fundamental catalyst and technical follow-through above $323.64. News flow around the OpenAI security partnership gives the rally a narrative beyond pure technicals. Commentary also suggests Meta’s new Muse agent could boost web traffic, potentially lifting Cloudflare’s revenue. Options activity has signaled bullish conviction around the 9.25% surge, according to Investing.com. Therefore, if price holds above the daily EMA20 near $291.1 and clears R1 at $323.64, the path toward the upper Bollinger Band at $326.3 becomes the next target. A sustained break there would confirm the breakout has staying power.
Bearish Scenario
The bearish case builds on overbought hourly conditions and insider selling activity. Failure to hold $312.46 would serve as an early warning sign. The overbought 1H RSI at 76.63, combined with the negative daily MACD histogram, builds a credible case for a near-term pullback. If price fails to hold above the 1H pivot at $314.13 and slips through S1 at $312.46, caution is warranted.
A deeper retracement toward the daily EMA20 at $291.1 would invalidate the immediate bullish continuation. This holds true even if the broader uptrend defined by the EMA200 at $238.08 remains intact. Notably, insider selling adds a layer of caution: Cloudflare president Michelle Zatlyn sold $27.6 million in stock. It is a datapoint worth watching even if it does not by itself determine direction.
The conflict between strong trend structure and stretched short-term momentum is exactly the kind of tension that produces choppy, two-sided price action before resolution. The overbought hourly reading and cooling 15-minute momentum mean this is not a straightforward, one-directional setup.
Cloudflare, Inc. Stock: Technical Outlook
Cloudflare, Inc. stock enters the next sessions with a clear bullish daily bias. A powerful fundamental catalyst and a stacked EMA structure across all three timeframes reinforce this view. At the same time, elevated ATR readings, an overbought 1H RSI, and a softening 15-minute MACD all point to near-term uncertainty. The rally may not extend cleanly without a pause.
Positioning around current levels likely requires patience. Volatility has picked up sharply, and the market appears to be pausing at resistance to absorb Wednesday’s gap. Given the mixed momentum signals layered on a strong trend, near-term price action deserves close attention before assuming the breakout continues in a straight line.
FAQ
What drove Cloudflare, Inc. stock’s 9.25% surge?
The surge followed a newly announced security partnership with OpenAI. Additional commentary around Meta’s Muse agent potentially boosting web traffic and Cloudflare’s revenue added to the bullish sentiment. Options activity also signaled strong conviction behind the move.
Is Cloudflare, Inc. stock overbought after the rally?
On the daily timeframe, RSI14 at 58.58 suggests there is still room to run. However, the 1-hour RSI14 has reached 76.63, which is clearly overbought. This creates a mixed picture: the broader trend remains constructive, but short-term exhaustion risk is elevated.
What are the key support levels for NET?
Immediate support sits at the 1H pivot S1 of $312.46. Below that, the daily pivot S1 at $298.63 and the daily EMA20 at $291.1 represent key levels. The EMA200 at $238.08 defines the broader uptrend floor.
What is the bullish target for Cloudflare, Inc. stock?
The immediate bullish target is the daily R1 resistance at $323.64, followed by the upper Bollinger Band at $326.3. A sustained break above these levels would confirm the breakout has genuine staying power beyond a one-day event.
Disclaimer: This article is for informational purposes only and does not constitute financial advice, an investment recommendation, or a solicitation to buy or sell any financial instrument or cryptocurrency. The analysis provided is not indicative of future results. Investing in crypto assets and financial markets carries a high risk of capital loss. Always do your own research (DYOR) and consult a qualified financial advisor before making any decision.
Article produced with the assistance of artificial intelligence and reviewed by the editorial team.
53

Article
Block crypto custody bank seeks OCC approval to launch Builders BankJack Dorsey’s payments company is making its boldest regulatory move yet in digital assets. Block has filed an application with the Office of the Comptroller of the Currency to launch a new Block crypto custody bank called Builders Bank & Trust, N.A., a specialized institution designed to hold Bitcoin and stablecoins for clients under direct federal oversight rather than state-by-state rules.
Key takeaways
Block has applied to the OCC to open Builders Bank & Trust, N.A., a proposed national trust bank.
The bank would focus exclusively on custody and fiduciary services for digital assets like Bitcoin and stablecoins.
Builders Bank would not accept customer deposits, make loans, or offer FDIC insured accounts.
Lee Woolley, Block’s head of digital assets strategy, is expected to serve as president and CEO if the application is approved.
No timeline has been given for the OCC’s decision, and Block joins Ripple, Circle, BitGo, Payward and Zerohash in pursuing similar national charters.
Block Files to Create Builders Bank Under OCC Supervision
Block has formally asked federal regulators for permission to launch a bank built specifically around digital asset custody services. The company confirmed it submitted its Builders Bank OCC application to the Office of the Comptroller of the Currency, seeking approval to operate as an uninsured national trust bank.
If the OCC signs off, Builders Bank would function under a national trust bank charter, giving Block one consistent federal standard to follow instead of navigating separate rules in every state where it operates. That single regulatory framework is central to the pitch: as Block’s digital asset business grows, a national charter would let custody operations scale without getting tangled in a patchwork of local requirements.
The OCC has not indicated when it will rule on the request. Regulators will need to determine whether Builders Bank meets the standards required for a national trust bank charter, and Block has offered no public estimate of how long that review might take.
Builders Bank’s Focus on Digital Asset Custody and Fiduciary Services
Builders Bank is designed to do one thing well: safeguard digital assets on behalf of clients, not act as a general-purpose lender or deposit-taking institution. The proposed charter would let it hold Bitcoin and stablecoins for firms and individuals who want a federally supervised place to store crypto holdings.
Scope of Services and Charter Limitations
The bank’s activities would be tightly restricted to custody, fiduciary duties, and other trust-related services permitted under its charter. That narrow scope separates Builders Bank from a conventional commercial bank offering checking accounts, mortgages, or business loans. Everything about the design points toward a single purpose: acting as a regulated custodian for crypto assets rather than a full-service lender.
Non-Depository Status and Impact
Because Builders Bank would be a non-depository, uninsured institution, it would not accept customer deposits or offer FDIC insured accounts, and it would not make loans. That structure matters for anyone weighing where to park crypto holdings: clients using Builders Bank would be relying on fiduciary custody protections tied to the trust charter, not the deposit insurance that backs a traditional savings or checking account. It’s a trade-off that mirrors how other crypto-focused trust banks have positioned themselves — regulated, but built around custody rather than banking in the conventional sense.
Leadership and Block’s Experience Supporting Builders Bank
Lee Woolley, who currently leads Block’s digital assets strategy, is expected to take the helm as president and CEO of Builders Bank if regulators grant approval. Woolley brings more than two decades of banking and financial services experience to the role, and Block has pointed to that background as a fit for the bank’s fiduciary mandate.
Woolley has said the new institution would draw on Block’s existing digital asset operations along with its experience running Square Financial Services, the company’s industrial bank. That combination, he argued, gives Builders Bank a solid operational foundation — Block isn’t starting from zero on banking compliance, since Square Financial Services has already exposed the company to federal oversight and regulatory reporting requirements.
Implications for Block and the US Crypto Custody Landscape
Block’s push for a dedicated Block crypto custody bank lands amid a broader wave of fintech and crypto firms seeking the same kind of federal charter. Ripple has already secured conditional approval for a comparable national trust bank charter, while Circle and BitGo have received final approval for theirs. Kraken parent Payward and crypto infrastructure provider Zerohash have also filed similar applications, signaling that national trust charters are becoming a standard playbook for companies that want to offer regulated custody without becoming full commercial banks.
Why does this matter beyond Block? A national charter effectively lets these companies operate as coast-to-coast custodians under one regulator, sidestepping the slower, fragmented process of seeking licenses state by state. For institutional clients and larger crypto holders, that uniformity can make a custodian more attractive, since compliance expectations stay consistent no matter where the client is based. For Block specifically, approval would slot neatly into its larger strategy around Bitcoin and stablecoins, giving the company a federally supervised vehicle to expand custody offerings tied to its existing digital asset business.
The competitive angle is hard to ignore. With Ripple, Circle, BitGo, Payward and Zerohash all pursuing or holding similar charters, the OCC is emerging as a key gatekeeper shaping which crypto companies get to offer bank-grade custody in the United States. Block’s application puts it squarely in that race, though its fate — like the others still pending — rests entirely on how quickly and how favorably the OCC decides to move.
FAQ
What is the purpose of Builders Bank?
Builders Bank focuses exclusively on custody and fiduciary services for digital assets such as Bitcoin and stablecoins, rather than traditional banking.
Will Builders Bank accept customer deposits or offer FDIC insurance?
No, Builders Bank would not accept customer deposits or offer FDIC insured accounts, since it is proposed as a non-depository institution.
Under which regulatory framework would Builders Bank operate?
Builders Bank would operate under a national trust bank charter supervised by the Office of the Comptroller of the Currency, giving it one federal regulatory framework instead of separate state rules.
Who is expected to lead Builders Bank?
Lee Woolley, Block’s head of digital assets strategy, is expected to serve as president and CEO of Builders Bank if the OCC approves the application.
Article produced with the assistance of artificial intelligence and reviewed by the editorial team.
Block crypto custody bank seeks OCC approval to launch Builders Bank
Jack Dorsey’s payments company is making its boldest regulatory move yet in digital assets. Block has filed an application with the Office of the Comptroller of the Currency to launch a new Block crypto custody bank called Builders Bank & Trust, N.A., a specialized institution designed to hold Bitcoin and stablecoins for clients under direct federal oversight rather than state-by-state rules.
Key takeaways
Block has applied to the OCC to open Builders Bank & Trust, N.A., a proposed national trust bank.
The bank would focus exclusively on custody and fiduciary services for digital assets like Bitcoin and stablecoins.
Builders Bank would not accept customer deposits, make loans, or offer FDIC insured accounts.
Lee Woolley, Block’s head of digital assets strategy, is expected to serve as president and CEO if the application is approved.
No timeline has been given for the OCC’s decision, and Block joins Ripple, Circle, BitGo, Payward and Zerohash in pursuing similar national charters.
Block Files to Create Builders Bank Under OCC Supervision
Block has formally asked federal regulators for permission to launch a bank built specifically around digital asset custody services. The company confirmed it submitted its Builders Bank OCC application to the Office of the Comptroller of the Currency, seeking approval to operate as an uninsured national trust bank.
If the OCC signs off, Builders Bank would function under a national trust bank charter, giving Block one consistent federal standard to follow instead of navigating separate rules in every state where it operates. That single regulatory framework is central to the pitch: as Block’s digital asset business grows, a national charter would let custody operations scale without getting tangled in a patchwork of local requirements.
The OCC has not indicated when it will rule on the request. Regulators will need to determine whether Builders Bank meets the standards required for a national trust bank charter, and Block has offered no public estimate of how long that review might take.
Builders Bank’s Focus on Digital Asset Custody and Fiduciary Services
Builders Bank is designed to do one thing well: safeguard digital assets on behalf of clients, not act as a general-purpose lender or deposit-taking institution. The proposed charter would let it hold Bitcoin and stablecoins for firms and individuals who want a federally supervised place to store crypto holdings.
Scope of Services and Charter Limitations
The bank’s activities would be tightly restricted to custody, fiduciary duties, and other trust-related services permitted under its charter. That narrow scope separates Builders Bank from a conventional commercial bank offering checking accounts, mortgages, or business loans. Everything about the design points toward a single purpose: acting as a regulated custodian for crypto assets rather than a full-service lender.
Non-Depository Status and Impact
Because Builders Bank would be a non-depository, uninsured institution, it would not accept customer deposits or offer FDIC insured accounts, and it would not make loans. That structure matters for anyone weighing where to park crypto holdings: clients using Builders Bank would be relying on fiduciary custody protections tied to the trust charter, not the deposit insurance that backs a traditional savings or checking account. It’s a trade-off that mirrors how other crypto-focused trust banks have positioned themselves — regulated, but built around custody rather than banking in the conventional sense.
Leadership and Block’s Experience Supporting Builders Bank
Lee Woolley, who currently leads Block’s digital assets strategy, is expected to take the helm as president and CEO of Builders Bank if regulators grant approval. Woolley brings more than two decades of banking and financial services experience to the role, and Block has pointed to that background as a fit for the bank’s fiduciary mandate.
Woolley has said the new institution would draw on Block’s existing digital asset operations along with its experience running Square Financial Services, the company’s industrial bank. That combination, he argued, gives Builders Bank a solid operational foundation — Block isn’t starting from zero on banking compliance, since Square Financial Services has already exposed the company to federal oversight and regulatory reporting requirements.
Implications for Block and the US Crypto Custody Landscape
Block’s push for a dedicated Block crypto custody bank lands amid a broader wave of fintech and crypto firms seeking the same kind of federal charter. Ripple has already secured conditional approval for a comparable national trust bank charter, while Circle and BitGo have received final approval for theirs. Kraken parent Payward and crypto infrastructure provider Zerohash have also filed similar applications, signaling that national trust charters are becoming a standard playbook for companies that want to offer regulated custody without becoming full commercial banks.
Why does this matter beyond Block? A national charter effectively lets these companies operate as coast-to-coast custodians under one regulator, sidestepping the slower, fragmented process of seeking licenses state by state. For institutional clients and larger crypto holders, that uniformity can make a custodian more attractive, since compliance expectations stay consistent no matter where the client is based. For Block specifically, approval would slot neatly into its larger strategy around Bitcoin and stablecoins, giving the company a federally supervised vehicle to expand custody offerings tied to its existing digital asset business.
The competitive angle is hard to ignore. With Ripple, Circle, BitGo, Payward and Zerohash all pursuing or holding similar charters, the OCC is emerging as a key gatekeeper shaping which crypto companies get to offer bank-grade custody in the United States. Block’s application puts it squarely in that race, though its fate — like the others still pending — rests entirely on how quickly and how favorably the OCC decides to move.
FAQ
What is the purpose of Builders Bank?
Builders Bank focuses exclusively on custody and fiduciary services for digital assets such as Bitcoin and stablecoins, rather than traditional banking.
Will Builders Bank accept customer deposits or offer FDIC insurance?
No, Builders Bank would not accept customer deposits or offer FDIC insured accounts, since it is proposed as a non-depository institution.
Under which regulatory framework would Builders Bank operate?
Builders Bank would operate under a national trust bank charter supervised by the Office of the Comptroller of the Currency, giving it one federal regulatory framework instead of separate state rules.
Who is expected to lead Builders Bank?
Lee Woolley, Block’s head of digital assets strategy, is expected to serve as president and CEO of Builders Bank if the OCC approves the application.
Article produced with the assistance of artificial intelligence and reviewed by the editorial team.
Key takeaways
Block has applied to the OCC to open Builders Bank & Trust, N.A., a proposed national trust bank.
The bank would focus exclusively on custody and fiduciary services for digital assets like Bitcoin and stablecoins.
Builders Bank would not accept customer deposits, make loans, or offer FDIC insured accounts.
Lee Woolley, Block’s head of digital assets strategy, is expected to serve as president and CEO if the application is approved.
No timeline has been given for the OCC’s decision, and Block joins Ripple, Circle, BitGo, Payward and Zerohash in pursuing similar national charters.
Block Files to Create Builders Bank Under OCC Supervision
Block has formally asked federal regulators for permission to launch a bank built specifically around digital asset custody services. The company confirmed it submitted its Builders Bank OCC application to the Office of the Comptroller of the Currency, seeking approval to operate as an uninsured national trust bank.
If the OCC signs off, Builders Bank would function under a national trust bank charter, giving Block one consistent federal standard to follow instead of navigating separate rules in every state where it operates. That single regulatory framework is central to the pitch: as Block’s digital asset business grows, a national charter would let custody operations scale without getting tangled in a patchwork of local requirements.
The OCC has not indicated when it will rule on the request. Regulators will need to determine whether Builders Bank meets the standards required for a national trust bank charter, and Block has offered no public estimate of how long that review might take.
Builders Bank’s Focus on Digital Asset Custody and Fiduciary Services
Builders Bank is designed to do one thing well: safeguard digital assets on behalf of clients, not act as a general-purpose lender or deposit-taking institution. The proposed charter would let it hold Bitcoin and stablecoins for firms and individuals who want a federally supervised place to store crypto holdings.
Scope of Services and Charter Limitations
The bank’s activities would be tightly restricted to custody, fiduciary duties, and other trust-related services permitted under its charter. That narrow scope separates Builders Bank from a conventional commercial bank offering checking accounts, mortgages, or business loans. Everything about the design points toward a single purpose: acting as a regulated custodian for crypto assets rather than a full-service lender.
Non-Depository Status and Impact
Because Builders Bank would be a non-depository, uninsured institution, it would not accept customer deposits or offer FDIC insured accounts, and it would not make loans. That structure matters for anyone weighing where to park crypto holdings: clients using Builders Bank would be relying on fiduciary custody protections tied to the trust charter, not the deposit insurance that backs a traditional savings or checking account. It’s a trade-off that mirrors how other crypto-focused trust banks have positioned themselves — regulated, but built around custody rather than banking in the conventional sense.
Leadership and Block’s Experience Supporting Builders Bank
Lee Woolley, who currently leads Block’s digital assets strategy, is expected to take the helm as president and CEO of Builders Bank if regulators grant approval. Woolley brings more than two decades of banking and financial services experience to the role, and Block has pointed to that background as a fit for the bank’s fiduciary mandate.
Woolley has said the new institution would draw on Block’s existing digital asset operations along with its experience running Square Financial Services, the company’s industrial bank. That combination, he argued, gives Builders Bank a solid operational foundation — Block isn’t starting from zero on banking compliance, since Square Financial Services has already exposed the company to federal oversight and regulatory reporting requirements.
Implications for Block and the US Crypto Custody Landscape
Block’s push for a dedicated Block crypto custody bank lands amid a broader wave of fintech and crypto firms seeking the same kind of federal charter. Ripple has already secured conditional approval for a comparable national trust bank charter, while Circle and BitGo have received final approval for theirs. Kraken parent Payward and crypto infrastructure provider Zerohash have also filed similar applications, signaling that national trust charters are becoming a standard playbook for companies that want to offer regulated custody without becoming full commercial banks.
Why does this matter beyond Block? A national charter effectively lets these companies operate as coast-to-coast custodians under one regulator, sidestepping the slower, fragmented process of seeking licenses state by state. For institutional clients and larger crypto holders, that uniformity can make a custodian more attractive, since compliance expectations stay consistent no matter where the client is based. For Block specifically, approval would slot neatly into its larger strategy around Bitcoin and stablecoins, giving the company a federally supervised vehicle to expand custody offerings tied to its existing digital asset business.
The competitive angle is hard to ignore. With Ripple, Circle, BitGo, Payward and Zerohash all pursuing or holding similar charters, the OCC is emerging as a key gatekeeper shaping which crypto companies get to offer bank-grade custody in the United States. Block’s application puts it squarely in that race, though its fate — like the others still pending — rests entirely on how quickly and how favorably the OCC decides to move.
FAQ
What is the purpose of Builders Bank?
Builders Bank focuses exclusively on custody and fiduciary services for digital assets such as Bitcoin and stablecoins, rather than traditional banking.
Will Builders Bank accept customer deposits or offer FDIC insurance?
No, Builders Bank would not accept customer deposits or offer FDIC insured accounts, since it is proposed as a non-depository institution.
Under which regulatory framework would Builders Bank operate?
Builders Bank would operate under a national trust bank charter supervised by the Office of the Comptroller of the Currency, giving it one federal regulatory framework instead of separate state rules.
Who is expected to lead Builders Bank?
Lee Woolley, Block’s head of digital assets strategy, is expected to serve as president and CEO of Builders Bank if the OCC approves the application.
Article produced with the assistance of artificial intelligence and reviewed by the editorial team.
2
78

Article
POLYX crypto price trend stays bearish as token sits 95% below 2024 highPolymesh’s POLYX token has slipped nearly 4% in the past 24 hours, a pullback that comes right after a month of gains and raises fresh questions about the broader POLYX crypto price trend. The asset, often described as the blockchain built for real-world assets, had actually climbed 16.6% over the previous 30 days before this latest dip, giving traders a brief reason to hope for a turnaround. That optimism is now being tested against a chart structure that has stayed stubbornly bearish since October 2025.
Key takeaways
POLYX has dropped almost 4% in 24 hours after a 16.6% rally over the prior 30 days.
The token is down 95% from its 2024 all-time high of $0.75.
A former $0.10 support zone held from 2023 to mid-2025, but the weekly trend turned bearish in October 2025.
Weekly resistance sits at $0.0665, with $0.0518 now acting as a secondary ceiling.
Daily RSI at 57 and a rising OBV since August hint at underlying buying pressure, even as price keeps sliding.
Recent Price Movements Point to Persistent Bearish Pressure
The short-term swings tell a story of hesitation rather than conviction. A near 4% drop in a single day, following a monthly gain of 16.6%, suggests traders are still unsure whether the bounce was the start of something bigger or just a temporary retracement inside a longer downtrend.
A 4% Drop After a 16.6% Monthly Bounce
That kind of whiplash is common in altcoins caught between a broader cryptocurrency bear market and pockets of speculative buying. A popular chart account, World of Charts, posted a three-day logarithmic POLYX chart on X captioned “getting ready,” pointing to a possible recovery path. The same post noted that Bitcoin and Ethereum sentiment had turned bullish following gains in August, and suggested that if BTC’s retest of the $77,000 zone proves to be only a retracement, it could lift sentiment across altcoins, including Polymesh.
Down 95% From the 2024 Peak
Zooming out erases most of the short-term noise. POLYX currently sits about 95% below its all-time high of $0.75, reached in 2024. That scale of decline is a reminder of just how far the token has fallen from its peak, and it frames every recent bounce as a small move within a much larger drawdown.
Key Support and Resistance Levels Define the Market Structure
The technical picture on the weekly chart still favors sellers, and several specific price levels now stand between POLYX and any credible reversal. Understanding where those levels sit helps explain why a modest rally hasn’t yet changed the underlying trend.
The $0.10 Zone That Held for Years
Between 2023 and mid-2025, the $0.10 area acted as a reliable support zone for POLYX, absorbing selling pressure repeatedly during that stretch. That floor eventually gave way, and the token’s weekly swing structure had already turned bearish even before the latest downturn accelerated in October 2025.
Weekly Resistance at $0.0665 and $0.0518
On the weekly timeframe, the most recent swing high sits at $0.0665, set back in May. For the structure to flip bullish, buyers would need to break convincingly above that level. Closer to current prices, the former swing low at $0.0518 is now being tested as resistance. Even if bulls manage to push above that zone, the broader trend on the weekly chart remains bearish until $0.0665 falls.
Daily Chart Resistance Near $0.0406
The one-day chart mirrors the same bearish swing structure, with key points at $0.0406 and $0.0276. POLYX currently trades closer to the higher of those two levels, but the $0.037 supply zone above it has not been convincingly breached. Until that happens, the daily chart continues to favor sellers as well.
Technical Indicators Send Mixed Signals in This POLYX Technical Analysis
Not every signal points down. A closer look at momentum and volume indicators reveals some divergence from price action, which is often worth watching even in a downtrend.
RSI at 57 Hints at Modest Momentum
The daily Relative Strength Index reads 57, a level that signals some upward momentum without pushing into overbought territory. It’s not a strong bullish signal on its own, but it does show buyers haven’t disappeared entirely.
Rising OBV Despite Falling Price
More notable are the POLYX OBV RSI signals taken together. On-Balance Volume, a tool that tracks cumulative buying and selling pressure, has been climbing steadily since August even as the price kept falling. That divergence implies buying volume has, on balance, exceeded selling volume during this stretch — a pattern that sometimes precedes a shift in trend, though it hasn’t translated into a price breakout yet.
What It Would Take to Shift the Trend
A genuine reversal in the POLYX crypto price trend would require more than quiet accumulation. Traders would need to step in aggressively, with high-volume buying strong enough to break through the key resistance levels on both the weekly and daily charts — starting with $0.0406 on the daily timeframe and eventually $0.0518 and $0.0665 on the weekly chart. Until that kind of decisive move happens, the path of least resistance for Polymesh’s token remains tilted toward the downside, even with volume-based indicators quietly building underneath the surface.
FAQ
What is the current trend of POLYX crypto?
POLYX is currently in a long-term bearish trend that has been in place since October 2025, despite recent short-term price fluctuations, including a 16.6% gain over 30 days followed by a nearly 4% pullback.
Which price levels are key resistances for POLYX to break to signal recovery?
The key resistance levels are the weekly swing high at $0.0665 and the recent swing low at $0.0518, which now acts as resistance. On the daily chart, the $0.0406 level is also critical.
Do technical indicators suggest a possible bullish reversal for POLYX?
Some indicators, like the daily RSI at 57 and a rising OBV since August, suggest limited upward momentum. However, an actual bullish reversal would require aggressive, high-volume buying that breaks through the key resistance levels.
How much has POLYX declined from its all-time high?
POLYX has declined roughly 95% from its all-time high price of $0.75, which it reached in 2024.
Article produced with the assistance of artificial intelligence and reviewed by the editorial team.
POLYX crypto price trend stays bearish as token sits 95% below 2024 high
Polymesh’s POLYX token has slipped nearly 4% in the past 24 hours, a pullback that comes right after a month of gains and raises fresh questions about the broader POLYX crypto price trend. The asset, often described as the blockchain built for real-world assets, had actually climbed 16.6% over the previous 30 days before this latest dip, giving traders a brief reason to hope for a turnaround. That optimism is now being tested against a chart structure that has stayed stubbornly bearish since October 2025.
Key takeaways
POLYX has dropped almost 4% in 24 hours after a 16.6% rally over the prior 30 days.
The token is down 95% from its 2024 all-time high of $0.75.
A former $0.10 support zone held from 2023 to mid-2025, but the weekly trend turned bearish in October 2025.
Weekly resistance sits at $0.0665, with $0.0518 now acting as a secondary ceiling.
Daily RSI at 57 and a rising OBV since August hint at underlying buying pressure, even as price keeps sliding.
Recent Price Movements Point to Persistent Bearish Pressure
The short-term swings tell a story of hesitation rather than conviction. A near 4% drop in a single day, following a monthly gain of 16.6%, suggests traders are still unsure whether the bounce was the start of something bigger or just a temporary retracement inside a longer downtrend.
A 4% Drop After a 16.6% Monthly Bounce
That kind of whiplash is common in altcoins caught between a broader cryptocurrency bear market and pockets of speculative buying. A popular chart account, World of Charts, posted a three-day logarithmic POLYX chart on X captioned “getting ready,” pointing to a possible recovery path. The same post noted that Bitcoin and Ethereum sentiment had turned bullish following gains in August, and suggested that if BTC’s retest of the $77,000 zone proves to be only a retracement, it could lift sentiment across altcoins, including Polymesh.
Down 95% From the 2024 Peak
Zooming out erases most of the short-term noise. POLYX currently sits about 95% below its all-time high of $0.75, reached in 2024. That scale of decline is a reminder of just how far the token has fallen from its peak, and it frames every recent bounce as a small move within a much larger drawdown.
Key Support and Resistance Levels Define the Market Structure
The technical picture on the weekly chart still favors sellers, and several specific price levels now stand between POLYX and any credible reversal. Understanding where those levels sit helps explain why a modest rally hasn’t yet changed the underlying trend.
The $0.10 Zone That Held for Years
Between 2023 and mid-2025, the $0.10 area acted as a reliable support zone for POLYX, absorbing selling pressure repeatedly during that stretch. That floor eventually gave way, and the token’s weekly swing structure had already turned bearish even before the latest downturn accelerated in October 2025.
Weekly Resistance at $0.0665 and $0.0518
On the weekly timeframe, the most recent swing high sits at $0.0665, set back in May. For the structure to flip bullish, buyers would need to break convincingly above that level. Closer to current prices, the former swing low at $0.0518 is now being tested as resistance. Even if bulls manage to push above that zone, the broader trend on the weekly chart remains bearish until $0.0665 falls.
Daily Chart Resistance Near $0.0406
The one-day chart mirrors the same bearish swing structure, with key points at $0.0406 and $0.0276. POLYX currently trades closer to the higher of those two levels, but the $0.037 supply zone above it has not been convincingly breached. Until that happens, the daily chart continues to favor sellers as well.
Technical Indicators Send Mixed Signals in This POLYX Technical Analysis
Not every signal points down. A closer look at momentum and volume indicators reveals some divergence from price action, which is often worth watching even in a downtrend.
RSI at 57 Hints at Modest Momentum
The daily Relative Strength Index reads 57, a level that signals some upward momentum without pushing into overbought territory. It’s not a strong bullish signal on its own, but it does show buyers haven’t disappeared entirely.
Rising OBV Despite Falling Price
More notable are the POLYX OBV RSI signals taken together. On-Balance Volume, a tool that tracks cumulative buying and selling pressure, has been climbing steadily since August even as the price kept falling. That divergence implies buying volume has, on balance, exceeded selling volume during this stretch — a pattern that sometimes precedes a shift in trend, though it hasn’t translated into a price breakout yet.
What It Would Take to Shift the Trend
A genuine reversal in the POLYX crypto price trend would require more than quiet accumulation. Traders would need to step in aggressively, with high-volume buying strong enough to break through the key resistance levels on both the weekly and daily charts — starting with $0.0406 on the daily timeframe and eventually $0.0518 and $0.0665 on the weekly chart. Until that kind of decisive move happens, the path of least resistance for Polymesh’s token remains tilted toward the downside, even with volume-based indicators quietly building underneath the surface.
FAQ
What is the current trend of POLYX crypto?
POLYX is currently in a long-term bearish trend that has been in place since October 2025, despite recent short-term price fluctuations, including a 16.6% gain over 30 days followed by a nearly 4% pullback.
Which price levels are key resistances for POLYX to break to signal recovery?
The key resistance levels are the weekly swing high at $0.0665 and the recent swing low at $0.0518, which now acts as resistance. On the daily chart, the $0.0406 level is also critical.
Do technical indicators suggest a possible bullish reversal for POLYX?
Some indicators, like the daily RSI at 57 and a rising OBV since August, suggest limited upward momentum. However, an actual bullish reversal would require aggressive, high-volume buying that breaks through the key resistance levels.
How much has POLYX declined from its all-time high?
POLYX has declined roughly 95% from its all-time high price of $0.75, which it reached in 2024.
Article produced with the assistance of artificial intelligence and reviewed by the editorial team.
Key takeaways
POLYX has dropped almost 4% in 24 hours after a 16.6% rally over the prior 30 days.
The token is down 95% from its 2024 all-time high of $0.75.
A former $0.10 support zone held from 2023 to mid-2025, but the weekly trend turned bearish in October 2025.
Weekly resistance sits at $0.0665, with $0.0518 now acting as a secondary ceiling.
Daily RSI at 57 and a rising OBV since August hint at underlying buying pressure, even as price keeps sliding.
Recent Price Movements Point to Persistent Bearish Pressure
The short-term swings tell a story of hesitation rather than conviction. A near 4% drop in a single day, following a monthly gain of 16.6%, suggests traders are still unsure whether the bounce was the start of something bigger or just a temporary retracement inside a longer downtrend.
A 4% Drop After a 16.6% Monthly Bounce
That kind of whiplash is common in altcoins caught between a broader cryptocurrency bear market and pockets of speculative buying. A popular chart account, World of Charts, posted a three-day logarithmic POLYX chart on X captioned “getting ready,” pointing to a possible recovery path. The same post noted that Bitcoin and Ethereum sentiment had turned bullish following gains in August, and suggested that if BTC’s retest of the $77,000 zone proves to be only a retracement, it could lift sentiment across altcoins, including Polymesh.
Down 95% From the 2024 Peak
Zooming out erases most of the short-term noise. POLYX currently sits about 95% below its all-time high of $0.75, reached in 2024. That scale of decline is a reminder of just how far the token has fallen from its peak, and it frames every recent bounce as a small move within a much larger drawdown.
Key Support and Resistance Levels Define the Market Structure
The technical picture on the weekly chart still favors sellers, and several specific price levels now stand between POLYX and any credible reversal. Understanding where those levels sit helps explain why a modest rally hasn’t yet changed the underlying trend.
The $0.10 Zone That Held for Years
Between 2023 and mid-2025, the $0.10 area acted as a reliable support zone for POLYX, absorbing selling pressure repeatedly during that stretch. That floor eventually gave way, and the token’s weekly swing structure had already turned bearish even before the latest downturn accelerated in October 2025.
Weekly Resistance at $0.0665 and $0.0518
On the weekly timeframe, the most recent swing high sits at $0.0665, set back in May. For the structure to flip bullish, buyers would need to break convincingly above that level. Closer to current prices, the former swing low at $0.0518 is now being tested as resistance. Even if bulls manage to push above that zone, the broader trend on the weekly chart remains bearish until $0.0665 falls.
Daily Chart Resistance Near $0.0406
The one-day chart mirrors the same bearish swing structure, with key points at $0.0406 and $0.0276. POLYX currently trades closer to the higher of those two levels, but the $0.037 supply zone above it has not been convincingly breached. Until that happens, the daily chart continues to favor sellers as well.
Technical Indicators Send Mixed Signals in This POLYX Technical Analysis
Not every signal points down. A closer look at momentum and volume indicators reveals some divergence from price action, which is often worth watching even in a downtrend.
RSI at 57 Hints at Modest Momentum
The daily Relative Strength Index reads 57, a level that signals some upward momentum without pushing into overbought territory. It’s not a strong bullish signal on its own, but it does show buyers haven’t disappeared entirely.
Rising OBV Despite Falling Price
More notable are the POLYX OBV RSI signals taken together. On-Balance Volume, a tool that tracks cumulative buying and selling pressure, has been climbing steadily since August even as the price kept falling. That divergence implies buying volume has, on balance, exceeded selling volume during this stretch — a pattern that sometimes precedes a shift in trend, though it hasn’t translated into a price breakout yet.
What It Would Take to Shift the Trend
A genuine reversal in the POLYX crypto price trend would require more than quiet accumulation. Traders would need to step in aggressively, with high-volume buying strong enough to break through the key resistance levels on both the weekly and daily charts — starting with $0.0406 on the daily timeframe and eventually $0.0518 and $0.0665 on the weekly chart. Until that kind of decisive move happens, the path of least resistance for Polymesh’s token remains tilted toward the downside, even with volume-based indicators quietly building underneath the surface.
FAQ
What is the current trend of POLYX crypto?
POLYX is currently in a long-term bearish trend that has been in place since October 2025, despite recent short-term price fluctuations, including a 16.6% gain over 30 days followed by a nearly 4% pullback.
Which price levels are key resistances for POLYX to break to signal recovery?
The key resistance levels are the weekly swing high at $0.0665 and the recent swing low at $0.0518, which now acts as resistance. On the daily chart, the $0.0406 level is also critical.
Do technical indicators suggest a possible bullish reversal for POLYX?
Some indicators, like the daily RSI at 57 and a rising OBV since August, suggest limited upward momentum. However, an actual bullish reversal would require aggressive, high-volume buying that breaks through the key resistance levels.
How much has POLYX declined from its all-time high?
POLYX has declined roughly 95% from its all-time high price of $0.75, which it reached in 2024.
Article produced with the assistance of artificial intelligence and reviewed by the editorial team.
14

Article
AeroVironment, Inc. stock: $1.5B backlog collides with bearish technicalsAeroVironment, Inc. stock presents a conflicted setup. Technicals paint a bearish picture, with price trading below all major moving averages. Yet fundamentals tell another story: record quarterly revenue, a surging backlog, and reaffirmed guidance. The tension between these two narratives demands close attention.
AVAV — daily chart with candlesticks, EMA20/EMA50 and volume.
Key takeaways
AeroVironment, Inc. stock closed at $140.80 on September 9 after a sharp intraday reversal from an open of $149.05.
Daily moving averages are stacked bearishly: price sits below the EMA20 (153.71), EMA50 (160.48), and EMA200 (200.03).
Momentum indicators confirm weakness, with daily RSI14 at 37.75 and the MACD histogram at -1.69, still widening.
Q1 FY2027 revenue reached a record $480 million, while the backlog expanded to $1.5 billion.
A daily close above the EMA20 near 153.71 would be the first meaningful signal that sellers are losing control.
AeroVironment, Inc. Stock Technical Analysis: Daily Bias Turns Bearish
The daily chart for AeroVironment, Inc. stock shows an unambiguous bearish structure. Price sits below every major moving average in a stacked, descending alignment. The daily session on September 9 illustrates the pressure clearly. AVAV opened at 149.05 and pushed briefly to 150.05. Then it collapsed to a low of 139.77 before closing at 140.80. This heavy intraday reversal reflects aggressive selling into strength, not a simple drift lower.
Moving Average Alignment Confirms Bearish Control
On the daily timeframe, the trend structure leaves little room for debate. Price sits below the EMA20 at 153.71, the EMA50 at 160.48, and the EMA200 at 200.03. That stacked, descending alignment marks a textbook bearish regime. The system’s own regime tag confirms it directly.
Momentum backs up that read. The daily RSI14 sits at 37.75 — still short of oversold territory but firmly on the weak side of neutral. Meanwhile, the MACD line at -6.02 remains well below its signal line at -4.32. The histogram of -1.69 shows the bearish gap is still widening. In practical terms, sellers have not lost control yet.
The Bollinger Bands add useful context. The mid-band sits at 159.31, with the upper band at 194.10 and the lower at 124.51. Price is trading closer to the lower boundary than the middle. That leaves room for further downside before the band itself becomes a technical brake. At the same time, the ATR14 of 7.65 confirms that daily volatility has expanded meaningfully — a detail that matters for position sizing.
Pivot levels frame the near-term battlefield. The daily pivot point sits at 143.54, with resistance at 147.31 and support at 137.03. Price closing at 140.80, below the pivot, keeps the tone defensive heading into the next session.
H1 Timeframe Confirms the Downside Pressure
The hourly chart reinforces the bearish message, mirroring the daily structure with all key moving averages stacked above the last close. The one-hour chart does not offer much relief to bulls. EMA20 at 144.22, EMA50 at 146.14, and EMA200 at 154.94 all sit above the last close of 140.77. The regime reading here is again bearish. This removes any argument that the daily weakness is an isolated event.
RSI14 on the hourly chart reads 36.47, essentially in line with the daily figure. MACD is negative as well. The line at -1.19 sits below the signal at -0.42, with a histogram of -0.77. However, one detail stands out: price on the hourly chart is trading right against the lower Bollinger Band. The band’s lower edge sits at 138.75 and the last close at 140.77. That proximity often precedes either a bounce attempt or an acceleration lower. Right now the chart alone cannot tell you which.
The hourly pivot at 140.73 sits almost exactly where price closed. Resistance rests at 141.68 and support at 139.81. This is a market balancing right on its own pivot line — a delicate position after a sharp daily decline.
15-Minute Chart: Short-Term Stabilization Signals
The 15-minute chart introduces a modest nuance, with early signs that intraday selling momentum is losing steam despite the broader bearish trend. On the 15-minute chart, the picture gets slightly more nuanced. EMA20 at 141.96, EMA50 at 143.82, and EMA200 at 145.59 keep the short-term structure bearish. This remains consistent with the higher timeframes. RSI14 at 35.86 stays soft, and the regime tag remains bearish.
Notably, the MACD histogram on the 15-minute chart has flipped to a slightly positive 0.05. Yet the MACD line at -1.27 remains below the signal at -1.32. That is a small but real detail. It suggests downside momentum is losing some steam intraday, even while the broader trend stays negative. This is exactly the kind of nuance that matters for execution timing rather than for the core directional bias.
With the 15-minute pivot at 140.73 essentially matching price, and support at 139.82 sitting close by, the short-term range is tight. The ATR14 here is just 0.82. That confirms intraday volatility has compressed relative to the daily and hourly readings.
Earnings Beat: Record Revenue and Growing Backlog
AeroVironment’s latest earnings report delivered a powerful fundamental counterweight to the bearish technical picture, with record revenue and a rapidly expanding backlog. The Q1 FY2027 earnings call revealed $480 million in quarterly revenue. The backlog has grown to $1.5 billion. The company also reported significant LOCUST wins and reaffirmed its FY2027 revenue guidance of $2.125 billion to $2.225 billion. Meanwhile, it continues scaling LOCUST and Titan production capacity.
Separately, coverage described the earnings beat in clear terms. AeroVironment’s results beat estimates as drone demand lifted revenue to a record. Bookings surged alongside the backlog growth. On top of that, a premarket movers report flagged AVAV as one of the notable gainers heading into the next session. This suggests buyers stepped in after the earnings release despite the prior day’s steep daily decline. Therefore, the AeroVironment, Inc. stock price action around this earnings cycle looks less like a rejection of the business. It looks more like a market still digesting a sharp prior move before repricing around the new guidance.
Bullish Scenario for AVAV Stock
A bullish reversal in AeroVironment, Inc. stock would require price to methodically reclaim key levels, starting with a daily close above the EMA20 near 153.71. A constructive case for AeroVironment, Inc. stock would need price to reclaim ground methodically rather than in one violent move. A daily close back above the EMA20 near 153.71 would be the first meaningful signal that sellers are losing grip. On the hourly chart, a sustained break above the 141.68 resistance level would add early confirmation. A subsequent move through the 144.22 EMA20 would strengthen that signal further.
The fundamental narrative supports this scenario well. Record revenue, a $1.5 billion backlog, reaffirmed FY2027 guidance, and continued LOCUST and Titan capacity scaling all point toward a company executing on growth even as the stock chart lags behind. The premarket surge noted after the earnings release is an early sign that some investors are willing to buy this dip on fundamentals. The positive tick in the 15-minute MACD histogram fits into that same short-term stabilization story.
Bearish Scenario and What Would Invalidate the Bullish Case
The weight of technical evidence still favors sellers, and a daily close below 137.03 would open the door toward the lower Bollinger Band at 124.51. On the other hand, the weight of technical evidence still favors sellers for now. A daily close below the 137.03 support level would open the door toward the lower Bollinger Band at 124.51. That level becomes relevant given the elevated ATR14 of 7.65. In contrast to any bullish reclaim attempt, continued MACD histogram expansion on the daily chart would confirm that momentum is still accelerating to the downside. The current reading sits at -1.69.
On the hourly chart, a decisive break below the 138.75 lower Bollinger Band would invalidate any near-term bounce thesis. Combined with RSI14 sliding under 30, this would confirm the bearish regime is deepening rather than pausing. In that scenario, the earnings beat and backlog growth would be treated by the market as already priced in. Technical selling pressure would simply override the fundamental improvement in the near term.
Closing Thoughts
AeroVironment, Inc. stock sits at a genuine crossroads where technical damage meets fundamental strength. The next few closes will likely determine which force prevails. Overall, AeroVironment, Inc. stock sits at a genuine crossroads between technical damage and fundamental strength. The daily and hourly timeframes both point to a bearish regime. Price trades below every key moving average and momentum indicators still lean negative. Meanwhile, the 15-minute chart hints at short-term stabilization. The underlying business just delivered record revenue, a growing backlog, and reaffirmed guidance.
Given the elevated ATR readings across timeframes, volatility is likely to stay high in the sessions ahead. Positioning around AVAV right now means acknowledging that conflict directly rather than choosing one side of the story. The next few closes relative to the pivot levels and moving averages outlined above should offer clearer evidence. Which force — technical selling or fundamental buying — ultimately takes control remains the central question.
FAQ
What is the current technical outlook for AeroVironment, Inc. stock?
The technical outlook for AeroVironment, Inc. stock is bearish across daily and hourly timeframes. Price trades below the EMA20 (153.71), EMA50 (160.48), and EMA200 (200.03) in a stacked, descending alignment. RSI14 sits at 37.75 on the daily chart, and the MACD histogram at -1.69 confirms momentum is still widening to the downside.
What were the key highlights from AeroVironment’s latest earnings report?
AeroVironment reported record Q1 FY2027 revenue of $480 million, with a backlog that expanded to $1.5 billion. The company reaffirmed FY2027 revenue guidance of $2.125 billion to $2.225 billion and continues scaling LOCUST and Titan production capacity. The results beat estimates as drone demand drove the revenue surge.
What levels should traders watch for a bullish reversal in AVAV stock?
A daily close above the EMA20 near 153.71 would be the first meaningful signal that selling pressure is fading. On the hourly chart, a sustained break above the 141.68 resistance level, followed by a move through the 144.22 EMA20, would add confirmation. Without reclaiming these levels, the bearish technical structure remains intact.
Disclaimer: This article is for informational purposes only and does not constitute financial advice, an investment recommendation, or a solicitation to buy or sell any financial instrument or cryptocurrency. The analysis provided is not indicative of future results. Investing in crypto assets and financial markets carries a high risk of capital loss. Always do your own research (DYOR) and consult a qualified financial advisor before making any decision.
Article produced with the assistance of artificial intelligence and reviewed by the editorial team.
AeroVironment, Inc. stock: $1.5B backlog collides with bearish technicals
AeroVironment, Inc. stock presents a conflicted setup. Technicals paint a bearish picture, with price trading below all major moving averages. Yet fundamentals tell another story: record quarterly revenue, a surging backlog, and reaffirmed guidance. The tension between these two narratives demands close attention.
AVAV — daily chart with candlesticks, EMA20/EMA50 and volume.
Key takeaways
AeroVironment, Inc. stock closed at $140.80 on September 9 after a sharp intraday reversal from an open of $149.05.
Daily moving averages are stacked bearishly: price sits below the EMA20 (153.71), EMA50 (160.48), and EMA200 (200.03).
Momentum indicators confirm weakness, with daily RSI14 at 37.75 and the MACD histogram at -1.69, still widening.
Q1 FY2027 revenue reached a record $480 million, while the backlog expanded to $1.5 billion.
A daily close above the EMA20 near 153.71 would be the first meaningful signal that sellers are losing control.
AeroVironment, Inc. Stock Technical Analysis: Daily Bias Turns Bearish
The daily chart for AeroVironment, Inc. stock shows an unambiguous bearish structure. Price sits below every major moving average in a stacked, descending alignment. The daily session on September 9 illustrates the pressure clearly. AVAV opened at 149.05 and pushed briefly to 150.05. Then it collapsed to a low of 139.77 before closing at 140.80. This heavy intraday reversal reflects aggressive selling into strength, not a simple drift lower.
Moving Average Alignment Confirms Bearish Control
On the daily timeframe, the trend structure leaves little room for debate. Price sits below the EMA20 at 153.71, the EMA50 at 160.48, and the EMA200 at 200.03. That stacked, descending alignment marks a textbook bearish regime. The system’s own regime tag confirms it directly.
Momentum backs up that read. The daily RSI14 sits at 37.75 — still short of oversold territory but firmly on the weak side of neutral. Meanwhile, the MACD line at -6.02 remains well below its signal line at -4.32. The histogram of -1.69 shows the bearish gap is still widening. In practical terms, sellers have not lost control yet.
The Bollinger Bands add useful context. The mid-band sits at 159.31, with the upper band at 194.10 and the lower at 124.51. Price is trading closer to the lower boundary than the middle. That leaves room for further downside before the band itself becomes a technical brake. At the same time, the ATR14 of 7.65 confirms that daily volatility has expanded meaningfully — a detail that matters for position sizing.
Pivot levels frame the near-term battlefield. The daily pivot point sits at 143.54, with resistance at 147.31 and support at 137.03. Price closing at 140.80, below the pivot, keeps the tone defensive heading into the next session.
H1 Timeframe Confirms the Downside Pressure
The hourly chart reinforces the bearish message, mirroring the daily structure with all key moving averages stacked above the last close. The one-hour chart does not offer much relief to bulls. EMA20 at 144.22, EMA50 at 146.14, and EMA200 at 154.94 all sit above the last close of 140.77. The regime reading here is again bearish. This removes any argument that the daily weakness is an isolated event.
RSI14 on the hourly chart reads 36.47, essentially in line with the daily figure. MACD is negative as well. The line at -1.19 sits below the signal at -0.42, with a histogram of -0.77. However, one detail stands out: price on the hourly chart is trading right against the lower Bollinger Band. The band’s lower edge sits at 138.75 and the last close at 140.77. That proximity often precedes either a bounce attempt or an acceleration lower. Right now the chart alone cannot tell you which.
The hourly pivot at 140.73 sits almost exactly where price closed. Resistance rests at 141.68 and support at 139.81. This is a market balancing right on its own pivot line — a delicate position after a sharp daily decline.
15-Minute Chart: Short-Term Stabilization Signals
The 15-minute chart introduces a modest nuance, with early signs that intraday selling momentum is losing steam despite the broader bearish trend. On the 15-minute chart, the picture gets slightly more nuanced. EMA20 at 141.96, EMA50 at 143.82, and EMA200 at 145.59 keep the short-term structure bearish. This remains consistent with the higher timeframes. RSI14 at 35.86 stays soft, and the regime tag remains bearish.
Notably, the MACD histogram on the 15-minute chart has flipped to a slightly positive 0.05. Yet the MACD line at -1.27 remains below the signal at -1.32. That is a small but real detail. It suggests downside momentum is losing some steam intraday, even while the broader trend stays negative. This is exactly the kind of nuance that matters for execution timing rather than for the core directional bias.
With the 15-minute pivot at 140.73 essentially matching price, and support at 139.82 sitting close by, the short-term range is tight. The ATR14 here is just 0.82. That confirms intraday volatility has compressed relative to the daily and hourly readings.
Earnings Beat: Record Revenue and Growing Backlog
AeroVironment’s latest earnings report delivered a powerful fundamental counterweight to the bearish technical picture, with record revenue and a rapidly expanding backlog. The Q1 FY2027 earnings call revealed $480 million in quarterly revenue. The backlog has grown to $1.5 billion. The company also reported significant LOCUST wins and reaffirmed its FY2027 revenue guidance of $2.125 billion to $2.225 billion. Meanwhile, it continues scaling LOCUST and Titan production capacity.
Separately, coverage described the earnings beat in clear terms. AeroVironment’s results beat estimates as drone demand lifted revenue to a record. Bookings surged alongside the backlog growth. On top of that, a premarket movers report flagged AVAV as one of the notable gainers heading into the next session. This suggests buyers stepped in after the earnings release despite the prior day’s steep daily decline. Therefore, the AeroVironment, Inc. stock price action around this earnings cycle looks less like a rejection of the business. It looks more like a market still digesting a sharp prior move before repricing around the new guidance.
Bullish Scenario for AVAV Stock
A bullish reversal in AeroVironment, Inc. stock would require price to methodically reclaim key levels, starting with a daily close above the EMA20 near 153.71. A constructive case for AeroVironment, Inc. stock would need price to reclaim ground methodically rather than in one violent move. A daily close back above the EMA20 near 153.71 would be the first meaningful signal that sellers are losing grip. On the hourly chart, a sustained break above the 141.68 resistance level would add early confirmation. A subsequent move through the 144.22 EMA20 would strengthen that signal further.
The fundamental narrative supports this scenario well. Record revenue, a $1.5 billion backlog, reaffirmed FY2027 guidance, and continued LOCUST and Titan capacity scaling all point toward a company executing on growth even as the stock chart lags behind. The premarket surge noted after the earnings release is an early sign that some investors are willing to buy this dip on fundamentals. The positive tick in the 15-minute MACD histogram fits into that same short-term stabilization story.
Bearish Scenario and What Would Invalidate the Bullish Case
The weight of technical evidence still favors sellers, and a daily close below 137.03 would open the door toward the lower Bollinger Band at 124.51. On the other hand, the weight of technical evidence still favors sellers for now. A daily close below the 137.03 support level would open the door toward the lower Bollinger Band at 124.51. That level becomes relevant given the elevated ATR14 of 7.65. In contrast to any bullish reclaim attempt, continued MACD histogram expansion on the daily chart would confirm that momentum is still accelerating to the downside. The current reading sits at -1.69.
On the hourly chart, a decisive break below the 138.75 lower Bollinger Band would invalidate any near-term bounce thesis. Combined with RSI14 sliding under 30, this would confirm the bearish regime is deepening rather than pausing. In that scenario, the earnings beat and backlog growth would be treated by the market as already priced in. Technical selling pressure would simply override the fundamental improvement in the near term.
Closing Thoughts
AeroVironment, Inc. stock sits at a genuine crossroads where technical damage meets fundamental strength. The next few closes will likely determine which force prevails. Overall, AeroVironment, Inc. stock sits at a genuine crossroads between technical damage and fundamental strength. The daily and hourly timeframes both point to a bearish regime. Price trades below every key moving average and momentum indicators still lean negative. Meanwhile, the 15-minute chart hints at short-term stabilization. The underlying business just delivered record revenue, a growing backlog, and reaffirmed guidance.
Given the elevated ATR readings across timeframes, volatility is likely to stay high in the sessions ahead. Positioning around AVAV right now means acknowledging that conflict directly rather than choosing one side of the story. The next few closes relative to the pivot levels and moving averages outlined above should offer clearer evidence. Which force — technical selling or fundamental buying — ultimately takes control remains the central question.
FAQ
What is the current technical outlook for AeroVironment, Inc. stock?
The technical outlook for AeroVironment, Inc. stock is bearish across daily and hourly timeframes. Price trades below the EMA20 (153.71), EMA50 (160.48), and EMA200 (200.03) in a stacked, descending alignment. RSI14 sits at 37.75 on the daily chart, and the MACD histogram at -1.69 confirms momentum is still widening to the downside.
What were the key highlights from AeroVironment’s latest earnings report?
AeroVironment reported record Q1 FY2027 revenue of $480 million, with a backlog that expanded to $1.5 billion. The company reaffirmed FY2027 revenue guidance of $2.125 billion to $2.225 billion and continues scaling LOCUST and Titan production capacity. The results beat estimates as drone demand drove the revenue surge.
What levels should traders watch for a bullish reversal in AVAV stock?
A daily close above the EMA20 near 153.71 would be the first meaningful signal that selling pressure is fading. On the hourly chart, a sustained break above the 141.68 resistance level, followed by a move through the 144.22 EMA20, would add confirmation. Without reclaiming these levels, the bearish technical structure remains intact.
Disclaimer: This article is for informational purposes only and does not constitute financial advice, an investment recommendation, or a solicitation to buy or sell any financial instrument or cryptocurrency. The analysis provided is not indicative of future results. Investing in crypto assets and financial markets carries a high risk of capital loss. Always do your own research (DYOR) and consult a qualified financial advisor before making any decision.
Article produced with the assistance of artificial intelligence and reviewed by the editorial team.
AVAV — daily chart with candlesticks, EMA20/EMA50 and volume.
Key takeaways
AeroVironment, Inc. stock closed at $140.80 on September 9 after a sharp intraday reversal from an open of $149.05.
Daily moving averages are stacked bearishly: price sits below the EMA20 (153.71), EMA50 (160.48), and EMA200 (200.03).
Momentum indicators confirm weakness, with daily RSI14 at 37.75 and the MACD histogram at -1.69, still widening.
Q1 FY2027 revenue reached a record $480 million, while the backlog expanded to $1.5 billion.
A daily close above the EMA20 near 153.71 would be the first meaningful signal that sellers are losing control.
AeroVironment, Inc. Stock Technical Analysis: Daily Bias Turns Bearish
The daily chart for AeroVironment, Inc. stock shows an unambiguous bearish structure. Price sits below every major moving average in a stacked, descending alignment. The daily session on September 9 illustrates the pressure clearly. AVAV opened at 149.05 and pushed briefly to 150.05. Then it collapsed to a low of 139.77 before closing at 140.80. This heavy intraday reversal reflects aggressive selling into strength, not a simple drift lower.
Moving Average Alignment Confirms Bearish Control
On the daily timeframe, the trend structure leaves little room for debate. Price sits below the EMA20 at 153.71, the EMA50 at 160.48, and the EMA200 at 200.03. That stacked, descending alignment marks a textbook bearish regime. The system’s own regime tag confirms it directly.
Momentum backs up that read. The daily RSI14 sits at 37.75 — still short of oversold territory but firmly on the weak side of neutral. Meanwhile, the MACD line at -6.02 remains well below its signal line at -4.32. The histogram of -1.69 shows the bearish gap is still widening. In practical terms, sellers have not lost control yet.
The Bollinger Bands add useful context. The mid-band sits at 159.31, with the upper band at 194.10 and the lower at 124.51. Price is trading closer to the lower boundary than the middle. That leaves room for further downside before the band itself becomes a technical brake. At the same time, the ATR14 of 7.65 confirms that daily volatility has expanded meaningfully — a detail that matters for position sizing.
Pivot levels frame the near-term battlefield. The daily pivot point sits at 143.54, with resistance at 147.31 and support at 137.03. Price closing at 140.80, below the pivot, keeps the tone defensive heading into the next session.
H1 Timeframe Confirms the Downside Pressure
The hourly chart reinforces the bearish message, mirroring the daily structure with all key moving averages stacked above the last close. The one-hour chart does not offer much relief to bulls. EMA20 at 144.22, EMA50 at 146.14, and EMA200 at 154.94 all sit above the last close of 140.77. The regime reading here is again bearish. This removes any argument that the daily weakness is an isolated event.
RSI14 on the hourly chart reads 36.47, essentially in line with the daily figure. MACD is negative as well. The line at -1.19 sits below the signal at -0.42, with a histogram of -0.77. However, one detail stands out: price on the hourly chart is trading right against the lower Bollinger Band. The band’s lower edge sits at 138.75 and the last close at 140.77. That proximity often precedes either a bounce attempt or an acceleration lower. Right now the chart alone cannot tell you which.
The hourly pivot at 140.73 sits almost exactly where price closed. Resistance rests at 141.68 and support at 139.81. This is a market balancing right on its own pivot line — a delicate position after a sharp daily decline.
15-Minute Chart: Short-Term Stabilization Signals
The 15-minute chart introduces a modest nuance, with early signs that intraday selling momentum is losing steam despite the broader bearish trend. On the 15-minute chart, the picture gets slightly more nuanced. EMA20 at 141.96, EMA50 at 143.82, and EMA200 at 145.59 keep the short-term structure bearish. This remains consistent with the higher timeframes. RSI14 at 35.86 stays soft, and the regime tag remains bearish.
Notably, the MACD histogram on the 15-minute chart has flipped to a slightly positive 0.05. Yet the MACD line at -1.27 remains below the signal at -1.32. That is a small but real detail. It suggests downside momentum is losing some steam intraday, even while the broader trend stays negative. This is exactly the kind of nuance that matters for execution timing rather than for the core directional bias.
With the 15-minute pivot at 140.73 essentially matching price, and support at 139.82 sitting close by, the short-term range is tight. The ATR14 here is just 0.82. That confirms intraday volatility has compressed relative to the daily and hourly readings.
Earnings Beat: Record Revenue and Growing Backlog
AeroVironment’s latest earnings report delivered a powerful fundamental counterweight to the bearish technical picture, with record revenue and a rapidly expanding backlog. The Q1 FY2027 earnings call revealed $480 million in quarterly revenue. The backlog has grown to $1.5 billion. The company also reported significant LOCUST wins and reaffirmed its FY2027 revenue guidance of $2.125 billion to $2.225 billion. Meanwhile, it continues scaling LOCUST and Titan production capacity.
Separately, coverage described the earnings beat in clear terms. AeroVironment’s results beat estimates as drone demand lifted revenue to a record. Bookings surged alongside the backlog growth. On top of that, a premarket movers report flagged AVAV as one of the notable gainers heading into the next session. This suggests buyers stepped in after the earnings release despite the prior day’s steep daily decline. Therefore, the AeroVironment, Inc. stock price action around this earnings cycle looks less like a rejection of the business. It looks more like a market still digesting a sharp prior move before repricing around the new guidance.
Bullish Scenario for AVAV Stock
A bullish reversal in AeroVironment, Inc. stock would require price to methodically reclaim key levels, starting with a daily close above the EMA20 near 153.71. A constructive case for AeroVironment, Inc. stock would need price to reclaim ground methodically rather than in one violent move. A daily close back above the EMA20 near 153.71 would be the first meaningful signal that sellers are losing grip. On the hourly chart, a sustained break above the 141.68 resistance level would add early confirmation. A subsequent move through the 144.22 EMA20 would strengthen that signal further.
The fundamental narrative supports this scenario well. Record revenue, a $1.5 billion backlog, reaffirmed FY2027 guidance, and continued LOCUST and Titan capacity scaling all point toward a company executing on growth even as the stock chart lags behind. The premarket surge noted after the earnings release is an early sign that some investors are willing to buy this dip on fundamentals. The positive tick in the 15-minute MACD histogram fits into that same short-term stabilization story.
Bearish Scenario and What Would Invalidate the Bullish Case
The weight of technical evidence still favors sellers, and a daily close below 137.03 would open the door toward the lower Bollinger Band at 124.51. On the other hand, the weight of technical evidence still favors sellers for now. A daily close below the 137.03 support level would open the door toward the lower Bollinger Band at 124.51. That level becomes relevant given the elevated ATR14 of 7.65. In contrast to any bullish reclaim attempt, continued MACD histogram expansion on the daily chart would confirm that momentum is still accelerating to the downside. The current reading sits at -1.69.
On the hourly chart, a decisive break below the 138.75 lower Bollinger Band would invalidate any near-term bounce thesis. Combined with RSI14 sliding under 30, this would confirm the bearish regime is deepening rather than pausing. In that scenario, the earnings beat and backlog growth would be treated by the market as already priced in. Technical selling pressure would simply override the fundamental improvement in the near term.
Closing Thoughts
AeroVironment, Inc. stock sits at a genuine crossroads where technical damage meets fundamental strength. The next few closes will likely determine which force prevails. Overall, AeroVironment, Inc. stock sits at a genuine crossroads between technical damage and fundamental strength. The daily and hourly timeframes both point to a bearish regime. Price trades below every key moving average and momentum indicators still lean negative. Meanwhile, the 15-minute chart hints at short-term stabilization. The underlying business just delivered record revenue, a growing backlog, and reaffirmed guidance.
Given the elevated ATR readings across timeframes, volatility is likely to stay high in the sessions ahead. Positioning around AVAV right now means acknowledging that conflict directly rather than choosing one side of the story. The next few closes relative to the pivot levels and moving averages outlined above should offer clearer evidence. Which force — technical selling or fundamental buying — ultimately takes control remains the central question.
FAQ
What is the current technical outlook for AeroVironment, Inc. stock?
The technical outlook for AeroVironment, Inc. stock is bearish across daily and hourly timeframes. Price trades below the EMA20 (153.71), EMA50 (160.48), and EMA200 (200.03) in a stacked, descending alignment. RSI14 sits at 37.75 on the daily chart, and the MACD histogram at -1.69 confirms momentum is still widening to the downside.
What were the key highlights from AeroVironment’s latest earnings report?
AeroVironment reported record Q1 FY2027 revenue of $480 million, with a backlog that expanded to $1.5 billion. The company reaffirmed FY2027 revenue guidance of $2.125 billion to $2.225 billion and continues scaling LOCUST and Titan production capacity. The results beat estimates as drone demand drove the revenue surge.
What levels should traders watch for a bullish reversal in AVAV stock?
A daily close above the EMA20 near 153.71 would be the first meaningful signal that selling pressure is fading. On the hourly chart, a sustained break above the 141.68 resistance level, followed by a move through the 144.22 EMA20, would add confirmation. Without reclaiming these levels, the bearish technical structure remains intact.
Disclaimer: This article is for informational purposes only and does not constitute financial advice, an investment recommendation, or a solicitation to buy or sell any financial instrument or cryptocurrency. The analysis provided is not indicative of future results. Investing in crypto assets and financial markets carries a high risk of capital loss. Always do your own research (DYOR) and consult a qualified financial advisor before making any decision.
Article produced with the assistance of artificial intelligence and reviewed by the editorial team.
7

Article
MultiversX crypto’s EGLD hits overbought RSI of 76 near key $5.77 resistanceThe EGLD token has surged into technically overbought territory, with the MultiversX crypto market facing a pivotal test at the 5.38 level. Daily RSI has climbed to 76.44, creating tension between the strong trend structure and growing signals of exhaustion across multiple timeframes.
EGLD/USDT — daily chart with candlesticks, EMA20/EMA50 and volume.
Key takeaways
EGLD trades at 5.38 with daily RSI at 76.44, deep in overbought territory on the daily chart.
Price sits above all three daily EMAs, though the 50 EMA has not yet crossed above the 200, signalling an immature trend.
Total crypto market capitalization fell 3.26% over 24 hours as Bitcoin dominance reached 58.56%.
xExchange daily fees surged 127.73% and 30-day fees jumped 388.99%, pointing to rising network usage.
Fear & Greed Index sits at 69, a level historically associated with late-stage rallies rather than fresh uptrends.
Daily Chart: EGLD Structure Is Bullish, But Stretched
EGLD’s daily structure remains technically bullish, but the rally has stretched price far ahead of its underlying trend infrastructure. The token at 5.38 trades above the 20 EMA at 4.30, the 50 EMA at 3.67, and the 200 EMA at 3.93. However, the 50 EMA still sits below the 200, confirming that this move accelerated faster than the medium-term trend could adjust. In other words, this looks less like a mature, well-established uptrend and more like a sharp, recent breakout that dragged price well ahead of its own trend foundation.
The RSI at 76.44 is the clearest warning sign on this timeframe. Readings this high do not automatically mean a reversal is imminent, but they do place the asset in a zone where pullbacks or sideways digestion become statistically more likely. The daily MACD line at 0.55 remains above its signal line at 0.46, with a histogram of 0.09. Momentum is technically positive, yet the histogram’s size relative to how far price has run suggests the thrust may be flattening rather than accelerating.
Bollinger Bands reinforce the same story: price at 5.38 presses right against the upper band at 5.59, with the mid-band all the way down at 4.18. That is a significant distance from the mean, and moves that stretch this far tend to either consolidate or snap back before continuing. Daily ATR of 0.50 confirms volatility has expanded meaningfully. The daily pivot cluster frames the near-term battlefield clearly: pivot at 5.39, resistance at 5.77, and support at 5.00 marking the level where the bullish case would need defending.
1H View: Momentum Still Bullish, But Cooling
The hourly chart tells a calmer version of the same story. Price at 5.39 sits above its 20 EMA at 5.18, 50 EMA at 5.02, and 200 EMA at 4.66, with the regime explicitly tagged bullish. RSI at 63.25 is elevated but nowhere near the extreme seen on the daily chart. This is a market still leaning bullish without being dangerously overheated on this timeframe. The MACD line at 0.10 remains above the signal at 0.08, though the histogram has thinned to just 0.02, consistent with momentum that has lost some of its earlier punch but not yet reversed.
The hourly Bollinger Band setup shows price pressed right against the upper band at 5.40, with the mid-band at 5.17. That is another sign of a market running hot on a shorter timeframe too, even if not to daily extremes. Meanwhile, the hourly pivot levels — pivot 5.34, resistance 5.44, support 5.28 — show a tight range where price has been oscillating, aligning with the idea that the market is pausing to catch its breath.
15-Minute Context: Momentum Is Flattening Into Resistance
Zooming into the 15-minute chart, RSI has cooled to 54.67, essentially neutral, and the MACD histogram has flattened to 0.00. Intraday momentum has stalled just below the immediate resistance zone. EMAs remain stacked bullish, with the 20 EMA at 5.33 above the 50 at 5.22 and the 200 at 5.00, so the short-term trend structure has not broken. That said, the loss of momentum matters for anyone using this timeframe for execution timing.
Price is effectively coiling just under the shared pivot resistance at 5.44, and this is the level that must give way for the next leg to carry real conviction. Taken together, the multi-timeframe picture reveals genuine tension: the daily chart flashes overbought warnings and volatility expansion, the hourly chart is bullish but losing steam, and the 15-minute chart has gone essentially flat right at resistance. None of these timeframes outright contradict each other — they all describe the same pause, with the outcome still undecided.
Bullish Scenario
For the bulls, the case rests on EGLD holding above the hourly EMA20 at 5.18 and defending the shared pivot around 5.34–5.39. A clean break and hold above the daily R1 at 5.77 would confirm the uptrend has enough fuel to push into new territory. There is also a fundamentals-adjacent tailwind worth noting: xExchange, the leading DEX in the MultiversX crypto ecosystem, saw its daily fees jump 127.73% and its 30-day fees surge 388.99%, even after a 28.02% pullback over the past seven days. That kind of on-chain fee activity points to a real pickup in network usage, which can help justify sustained demand for EGLD. If price can absorb the current overbought reading without a sharp correction, that would be a bullish signal in itself.
Bearish Scenario
The bearish case leans on exactly what the data flags: a daily RSI at 76.44 pressing against the upper Bollinger Band, inside a market where total capitalization is already down 3.26% over 24 hours and Bitcoin dominance is climbing to 58.56%. That combination — an overextended altcoin chart inside a risk-off broader tape — is the kind of setup that has historically preceded sharp mean-reversion moves. A break below the daily pivot at 5.39 and the hourly EMA50 at 5.02 would open the door toward S1 support at 5.00. A deeper failure could eventually pull price back toward the daily EMA20 near 4.30, where the more sustainable trend structure actually sits. The Fear & Greed Index reading of 69, classified as Greed, adds a contrarian note: sentiment this elevated often coincides with late-stage rallies rather than the start of new ones.
Where This Leaves Traders
This is a market where the timeframes tell slightly different parts of the same story rather than flatly disagreeing. The daily chart says this move is stretched and needs to prove it can hold these levels. The hourly chart says the trend is still intact but tiring. The 15-minute chart says buyers have paused right at resistance. None of that resolves the bigger question on its own — it simply narrows the range of outcomes to a fairly clean binary: either EGLD consolidates and holds its EMA structure long enough to earn a push through daily resistance at 5.77, or the overbought daily reading finally gets resolved with a pullback toward the 5.00–4.30 zone.
Volatility is elevated on every timeframe right now, and that cuts both ways: it can extend a breakout just as easily as it can accelerate a reversal. Anyone tracking this setup should watch how price behaves around the 5.34–5.39 pivot cluster over the next sessions, since that is likely to determine which of these two scenarios starts to dominate. With a market this stretched, position sizing and awareness of how fast conditions can flip matter more than trying to predict the exact next candle.
FAQ
What does a daily RSI of 76.44 mean for EGLD?
A daily RSI above 70 places EGLD in overbought territory, where pullbacks or sideways consolidation become statistically more likely. It does not guarantee an immediate reversal, but it signals that buying pressure has been extended and the risk of mean reversion is elevated relative to earlier stages of the move.
Is the EGLD uptrend still intact?
Yes, across all timeframes the EMA structure remains bullish, with price above the 20, 50, and 200-period averages. However, the daily 50 EMA remains below the 200 EMA, indicating the trend accelerated rapidly and has not yet matured into a fully established long-term uptrend.
What are the key price levels to watch?
Resistance sits at 5.44 on the hourly chart and 5.77 on the daily R1. Support lies at the daily pivot of 5.39, with stronger support at 5.00 and the daily EMA20 near 4.30. The 5.34–5.39 pivot cluster is the immediate zone likely to determine the next directional move.
How does the broader crypto market affect EGLD’s outlook?
With total crypto market cap down 3.26% and Bitcoin dominance at 58.56%, the broader environment is tilting defensive. An overextended altcoin chart inside a risk-off tape has historically preceded sharp corrections, making the current divergence between EGLD’s strength and market-wide caution a key variable to monitor.
Disclaimer: This article is for informational purposes only and does not constitute financial advice, an investment recommendation, or a solicitation to buy or sell any financial instrument or cryptocurrency. The analysis provided is not indicative of future results. Investing in crypto assets and financial markets carries a high risk of capital loss. Always do your own research (DYOR) and consult a qualified financial advisor before making any decision.
Article produced with the assistance of artificial intelligence and reviewed by the editorial team.
MultiversX crypto’s EGLD hits overbought RSI of 76 near key $5.77 resistance
The EGLD token has surged into technically overbought territory, with the MultiversX crypto market facing a pivotal test at the 5.38 level. Daily RSI has climbed to 76.44, creating tension between the strong trend structure and growing signals of exhaustion across multiple timeframes.
EGLD/USDT — daily chart with candlesticks, EMA20/EMA50 and volume.
Key takeaways
EGLD trades at 5.38 with daily RSI at 76.44, deep in overbought territory on the daily chart.
Price sits above all three daily EMAs, though the 50 EMA has not yet crossed above the 200, signalling an immature trend.
Total crypto market capitalization fell 3.26% over 24 hours as Bitcoin dominance reached 58.56%.
xExchange daily fees surged 127.73% and 30-day fees jumped 388.99%, pointing to rising network usage.
Fear & Greed Index sits at 69, a level historically associated with late-stage rallies rather than fresh uptrends.
Daily Chart: EGLD Structure Is Bullish, But Stretched
EGLD’s daily structure remains technically bullish, but the rally has stretched price far ahead of its underlying trend infrastructure. The token at 5.38 trades above the 20 EMA at 4.30, the 50 EMA at 3.67, and the 200 EMA at 3.93. However, the 50 EMA still sits below the 200, confirming that this move accelerated faster than the medium-term trend could adjust. In other words, this looks less like a mature, well-established uptrend and more like a sharp, recent breakout that dragged price well ahead of its own trend foundation.
The RSI at 76.44 is the clearest warning sign on this timeframe. Readings this high do not automatically mean a reversal is imminent, but they do place the asset in a zone where pullbacks or sideways digestion become statistically more likely. The daily MACD line at 0.55 remains above its signal line at 0.46, with a histogram of 0.09. Momentum is technically positive, yet the histogram’s size relative to how far price has run suggests the thrust may be flattening rather than accelerating.
Bollinger Bands reinforce the same story: price at 5.38 presses right against the upper band at 5.59, with the mid-band all the way down at 4.18. That is a significant distance from the mean, and moves that stretch this far tend to either consolidate or snap back before continuing. Daily ATR of 0.50 confirms volatility has expanded meaningfully. The daily pivot cluster frames the near-term battlefield clearly: pivot at 5.39, resistance at 5.77, and support at 5.00 marking the level where the bullish case would need defending.
1H View: Momentum Still Bullish, But Cooling
The hourly chart tells a calmer version of the same story. Price at 5.39 sits above its 20 EMA at 5.18, 50 EMA at 5.02, and 200 EMA at 4.66, with the regime explicitly tagged bullish. RSI at 63.25 is elevated but nowhere near the extreme seen on the daily chart. This is a market still leaning bullish without being dangerously overheated on this timeframe. The MACD line at 0.10 remains above the signal at 0.08, though the histogram has thinned to just 0.02, consistent with momentum that has lost some of its earlier punch but not yet reversed.
The hourly Bollinger Band setup shows price pressed right against the upper band at 5.40, with the mid-band at 5.17. That is another sign of a market running hot on a shorter timeframe too, even if not to daily extremes. Meanwhile, the hourly pivot levels — pivot 5.34, resistance 5.44, support 5.28 — show a tight range where price has been oscillating, aligning with the idea that the market is pausing to catch its breath.
15-Minute Context: Momentum Is Flattening Into Resistance
Zooming into the 15-minute chart, RSI has cooled to 54.67, essentially neutral, and the MACD histogram has flattened to 0.00. Intraday momentum has stalled just below the immediate resistance zone. EMAs remain stacked bullish, with the 20 EMA at 5.33 above the 50 at 5.22 and the 200 at 5.00, so the short-term trend structure has not broken. That said, the loss of momentum matters for anyone using this timeframe for execution timing.
Price is effectively coiling just under the shared pivot resistance at 5.44, and this is the level that must give way for the next leg to carry real conviction. Taken together, the multi-timeframe picture reveals genuine tension: the daily chart flashes overbought warnings and volatility expansion, the hourly chart is bullish but losing steam, and the 15-minute chart has gone essentially flat right at resistance. None of these timeframes outright contradict each other — they all describe the same pause, with the outcome still undecided.
Bullish Scenario
For the bulls, the case rests on EGLD holding above the hourly EMA20 at 5.18 and defending the shared pivot around 5.34–5.39. A clean break and hold above the daily R1 at 5.77 would confirm the uptrend has enough fuel to push into new territory. There is also a fundamentals-adjacent tailwind worth noting: xExchange, the leading DEX in the MultiversX crypto ecosystem, saw its daily fees jump 127.73% and its 30-day fees surge 388.99%, even after a 28.02% pullback over the past seven days. That kind of on-chain fee activity points to a real pickup in network usage, which can help justify sustained demand for EGLD. If price can absorb the current overbought reading without a sharp correction, that would be a bullish signal in itself.
Bearish Scenario
The bearish case leans on exactly what the data flags: a daily RSI at 76.44 pressing against the upper Bollinger Band, inside a market where total capitalization is already down 3.26% over 24 hours and Bitcoin dominance is climbing to 58.56%. That combination — an overextended altcoin chart inside a risk-off broader tape — is the kind of setup that has historically preceded sharp mean-reversion moves. A break below the daily pivot at 5.39 and the hourly EMA50 at 5.02 would open the door toward S1 support at 5.00. A deeper failure could eventually pull price back toward the daily EMA20 near 4.30, where the more sustainable trend structure actually sits. The Fear & Greed Index reading of 69, classified as Greed, adds a contrarian note: sentiment this elevated often coincides with late-stage rallies rather than the start of new ones.
Where This Leaves Traders
This is a market where the timeframes tell slightly different parts of the same story rather than flatly disagreeing. The daily chart says this move is stretched and needs to prove it can hold these levels. The hourly chart says the trend is still intact but tiring. The 15-minute chart says buyers have paused right at resistance. None of that resolves the bigger question on its own — it simply narrows the range of outcomes to a fairly clean binary: either EGLD consolidates and holds its EMA structure long enough to earn a push through daily resistance at 5.77, or the overbought daily reading finally gets resolved with a pullback toward the 5.00–4.30 zone.
Volatility is elevated on every timeframe right now, and that cuts both ways: it can extend a breakout just as easily as it can accelerate a reversal. Anyone tracking this setup should watch how price behaves around the 5.34–5.39 pivot cluster over the next sessions, since that is likely to determine which of these two scenarios starts to dominate. With a market this stretched, position sizing and awareness of how fast conditions can flip matter more than trying to predict the exact next candle.
FAQ
What does a daily RSI of 76.44 mean for EGLD?
A daily RSI above 70 places EGLD in overbought territory, where pullbacks or sideways consolidation become statistically more likely. It does not guarantee an immediate reversal, but it signals that buying pressure has been extended and the risk of mean reversion is elevated relative to earlier stages of the move.
Is the EGLD uptrend still intact?
Yes, across all timeframes the EMA structure remains bullish, with price above the 20, 50, and 200-period averages. However, the daily 50 EMA remains below the 200 EMA, indicating the trend accelerated rapidly and has not yet matured into a fully established long-term uptrend.
What are the key price levels to watch?
Resistance sits at 5.44 on the hourly chart and 5.77 on the daily R1. Support lies at the daily pivot of 5.39, with stronger support at 5.00 and the daily EMA20 near 4.30. The 5.34–5.39 pivot cluster is the immediate zone likely to determine the next directional move.
How does the broader crypto market affect EGLD’s outlook?
With total crypto market cap down 3.26% and Bitcoin dominance at 58.56%, the broader environment is tilting defensive. An overextended altcoin chart inside a risk-off tape has historically preceded sharp corrections, making the current divergence between EGLD’s strength and market-wide caution a key variable to monitor.
Disclaimer: This article is for informational purposes only and does not constitute financial advice, an investment recommendation, or a solicitation to buy or sell any financial instrument or cryptocurrency. The analysis provided is not indicative of future results. Investing in crypto assets and financial markets carries a high risk of capital loss. Always do your own research (DYOR) and consult a qualified financial advisor before making any decision.
Article produced with the assistance of artificial intelligence and reviewed by the editorial team.
EGLD/USDT — daily chart with candlesticks, EMA20/EMA50 and volume.
Key takeaways
EGLD trades at 5.38 with daily RSI at 76.44, deep in overbought territory on the daily chart.
Price sits above all three daily EMAs, though the 50 EMA has not yet crossed above the 200, signalling an immature trend.
Total crypto market capitalization fell 3.26% over 24 hours as Bitcoin dominance reached 58.56%.
xExchange daily fees surged 127.73% and 30-day fees jumped 388.99%, pointing to rising network usage.
Fear & Greed Index sits at 69, a level historically associated with late-stage rallies rather than fresh uptrends.
Daily Chart: EGLD Structure Is Bullish, But Stretched
EGLD’s daily structure remains technically bullish, but the rally has stretched price far ahead of its underlying trend infrastructure. The token at 5.38 trades above the 20 EMA at 4.30, the 50 EMA at 3.67, and the 200 EMA at 3.93. However, the 50 EMA still sits below the 200, confirming that this move accelerated faster than the medium-term trend could adjust. In other words, this looks less like a mature, well-established uptrend and more like a sharp, recent breakout that dragged price well ahead of its own trend foundation.
The RSI at 76.44 is the clearest warning sign on this timeframe. Readings this high do not automatically mean a reversal is imminent, but they do place the asset in a zone where pullbacks or sideways digestion become statistically more likely. The daily MACD line at 0.55 remains above its signal line at 0.46, with a histogram of 0.09. Momentum is technically positive, yet the histogram’s size relative to how far price has run suggests the thrust may be flattening rather than accelerating.
Bollinger Bands reinforce the same story: price at 5.38 presses right against the upper band at 5.59, with the mid-band all the way down at 4.18. That is a significant distance from the mean, and moves that stretch this far tend to either consolidate or snap back before continuing. Daily ATR of 0.50 confirms volatility has expanded meaningfully. The daily pivot cluster frames the near-term battlefield clearly: pivot at 5.39, resistance at 5.77, and support at 5.00 marking the level where the bullish case would need defending.
1H View: Momentum Still Bullish, But Cooling
The hourly chart tells a calmer version of the same story. Price at 5.39 sits above its 20 EMA at 5.18, 50 EMA at 5.02, and 200 EMA at 4.66, with the regime explicitly tagged bullish. RSI at 63.25 is elevated but nowhere near the extreme seen on the daily chart. This is a market still leaning bullish without being dangerously overheated on this timeframe. The MACD line at 0.10 remains above the signal at 0.08, though the histogram has thinned to just 0.02, consistent with momentum that has lost some of its earlier punch but not yet reversed.
The hourly Bollinger Band setup shows price pressed right against the upper band at 5.40, with the mid-band at 5.17. That is another sign of a market running hot on a shorter timeframe too, even if not to daily extremes. Meanwhile, the hourly pivot levels — pivot 5.34, resistance 5.44, support 5.28 — show a tight range where price has been oscillating, aligning with the idea that the market is pausing to catch its breath.
15-Minute Context: Momentum Is Flattening Into Resistance
Zooming into the 15-minute chart, RSI has cooled to 54.67, essentially neutral, and the MACD histogram has flattened to 0.00. Intraday momentum has stalled just below the immediate resistance zone. EMAs remain stacked bullish, with the 20 EMA at 5.33 above the 50 at 5.22 and the 200 at 5.00, so the short-term trend structure has not broken. That said, the loss of momentum matters for anyone using this timeframe for execution timing.
Price is effectively coiling just under the shared pivot resistance at 5.44, and this is the level that must give way for the next leg to carry real conviction. Taken together, the multi-timeframe picture reveals genuine tension: the daily chart flashes overbought warnings and volatility expansion, the hourly chart is bullish but losing steam, and the 15-minute chart has gone essentially flat right at resistance. None of these timeframes outright contradict each other — they all describe the same pause, with the outcome still undecided.
Bullish Scenario
For the bulls, the case rests on EGLD holding above the hourly EMA20 at 5.18 and defending the shared pivot around 5.34–5.39. A clean break and hold above the daily R1 at 5.77 would confirm the uptrend has enough fuel to push into new territory. There is also a fundamentals-adjacent tailwind worth noting: xExchange, the leading DEX in the MultiversX crypto ecosystem, saw its daily fees jump 127.73% and its 30-day fees surge 388.99%, even after a 28.02% pullback over the past seven days. That kind of on-chain fee activity points to a real pickup in network usage, which can help justify sustained demand for EGLD. If price can absorb the current overbought reading without a sharp correction, that would be a bullish signal in itself.
Bearish Scenario
The bearish case leans on exactly what the data flags: a daily RSI at 76.44 pressing against the upper Bollinger Band, inside a market where total capitalization is already down 3.26% over 24 hours and Bitcoin dominance is climbing to 58.56%. That combination — an overextended altcoin chart inside a risk-off broader tape — is the kind of setup that has historically preceded sharp mean-reversion moves. A break below the daily pivot at 5.39 and the hourly EMA50 at 5.02 would open the door toward S1 support at 5.00. A deeper failure could eventually pull price back toward the daily EMA20 near 4.30, where the more sustainable trend structure actually sits. The Fear & Greed Index reading of 69, classified as Greed, adds a contrarian note: sentiment this elevated often coincides with late-stage rallies rather than the start of new ones.
Where This Leaves Traders
This is a market where the timeframes tell slightly different parts of the same story rather than flatly disagreeing. The daily chart says this move is stretched and needs to prove it can hold these levels. The hourly chart says the trend is still intact but tiring. The 15-minute chart says buyers have paused right at resistance. None of that resolves the bigger question on its own — it simply narrows the range of outcomes to a fairly clean binary: either EGLD consolidates and holds its EMA structure long enough to earn a push through daily resistance at 5.77, or the overbought daily reading finally gets resolved with a pullback toward the 5.00–4.30 zone.
Volatility is elevated on every timeframe right now, and that cuts both ways: it can extend a breakout just as easily as it can accelerate a reversal. Anyone tracking this setup should watch how price behaves around the 5.34–5.39 pivot cluster over the next sessions, since that is likely to determine which of these two scenarios starts to dominate. With a market this stretched, position sizing and awareness of how fast conditions can flip matter more than trying to predict the exact next candle.
FAQ
What does a daily RSI of 76.44 mean for EGLD?
A daily RSI above 70 places EGLD in overbought territory, where pullbacks or sideways consolidation become statistically more likely. It does not guarantee an immediate reversal, but it signals that buying pressure has been extended and the risk of mean reversion is elevated relative to earlier stages of the move.
Is the EGLD uptrend still intact?
Yes, across all timeframes the EMA structure remains bullish, with price above the 20, 50, and 200-period averages. However, the daily 50 EMA remains below the 200 EMA, indicating the trend accelerated rapidly and has not yet matured into a fully established long-term uptrend.
What are the key price levels to watch?
Resistance sits at 5.44 on the hourly chart and 5.77 on the daily R1. Support lies at the daily pivot of 5.39, with stronger support at 5.00 and the daily EMA20 near 4.30. The 5.34–5.39 pivot cluster is the immediate zone likely to determine the next directional move.
How does the broader crypto market affect EGLD’s outlook?
With total crypto market cap down 3.26% and Bitcoin dominance at 58.56%, the broader environment is tilting defensive. An overextended altcoin chart inside a risk-off tape has historically preceded sharp corrections, making the current divergence between EGLD’s strength and market-wide caution a key variable to monitor.
Disclaimer: This article is for informational purposes only and does not constitute financial advice, an investment recommendation, or a solicitation to buy or sell any financial instrument or cryptocurrency. The analysis provided is not indicative of future results. Investing in crypto assets and financial markets carries a high risk of capital loss. Always do your own research (DYOR) and consult a qualified financial advisor before making any decision.
Article produced with the assistance of artificial intelligence and reviewed by the editorial team.
61

Article
SGX Bitcoin Ether Futures Open to US Institutions After $5.8B SurgeThe Singapore Exchange has cleared a regulatory hurdle that could reshape how American money flows into Asian crypto markets. SGX has obtained authorization from the U.S. Commodity Futures Trading Commission under Regulation 48.10, letting U.S. institutional investors trade its SGX bitcoin ether futures directly for the first time. The approval marks a notable shift for a derivatives market that has grown steadily since its debut just months ago, and it opens a new channel connecting Wall Street trading desks to liquidity pools that were previously off-limits.
Key takeaways
SGX received CFTC authorization under Regulation 48.10, allowing U.S. institutions to trade its bitcoin and ether perpetual futures without SGX registering as a U.S. exchange.
The exchange’s crypto perpetual futures, launched in late November 2025, have processed $5.8 billion in cumulative traded volume, or roughly 400,000 lots.
Bitcoin dominates activity, accounting for 66% of open interest and 83% of daily trading volume since inception.
SGX uses margin calls and collateral top-ups instead of auto-liquidations, and excludes stablecoins as acceptable collateral.
The exchange plans to launch dated futures and options for bitcoin and ether as its next product step.
SGX Gains CFTC Authorization Under Regulation 48.10
Regulation 48.10 is the mechanism that made this possible. It allows a registered Foreign Board of Trade — an overseas exchange the CFTC formally recognizes — to give U.S. participants direct access to its trading system without setting up a separate, fully U.S.-regulated exchange. In practical terms, SGX can now open its existing order books to American institutional traders under CFTC oversight, rather than launching a parallel U.S. listing from scratch.
“Under the Regulation 48.10 ruling, we have obtained CFTC authorization to open our crypto products to U.S. institutional access. Previously, U.S. participants couldn’t trade these contracts but now they can,” said KC Lam, head of crypto derivatives at SGX Group, in comments to CoinDesk.
Lam described the approval as “an important milestone” that “bridges the U.S. TradFi participants trading crypto futures with Asian liquidity pools” and, in his words, “legitimizes crypto derivatives as a regulated asset class.” Why does this matter beyond SGX itself? Because it signals that regulated crypto derivatives infrastructure outside the U.S. can now be plugged directly into American institutional flows, a template other foreign exchanges may look to replicate as regulators grow more comfortable with the asset class.
How SGX’s Crypto Perpetual Futures Have Performed Since Launch
SGX’s bitcoin and ether perpetual contracts have built real trading momentum in a short window. Since launching in late November 2025, the products have recorded $5.8 billion in cumulative traded volume — around 400,000 lots — establishing a track record before U.S. institutions were even able to participate.
Daily average volume across both contracts reached roughly 1,300 lots, or about $19 million, as of August. Bitcoin remains the dominant driver of activity, making up 66% of open interest and 83% of daily average volume since the contracts went live. The single busiest trading day so far saw 11,500 lots change hands, equal to $145 million in notional value.
Structurally, SGX’s perpetual futures differ from the crypto-native products traders are used to. There’s no expiry date, mirroring the format popularized on crypto exchanges, but SGX relies on margin calls and collateral top-ups rather than automatic liquidations when positions move against a trader. Stablecoins are explicitly excluded as acceptable collateral. “As they can break peg during volatile periods,” Lam explained, a design choice meant to reduce risk during exactly the kind of market stress that would otherwise trigger forced closeouts.
The contracts themselves are benchmarked to indices jointly developed with CoinDesk Indices, according to Mohit Baheti, head of iEdge Indices at SGX Group, and are managed under the EU Benchmark Regulation — a compliance detail that reinforces the products’ positioning as regulated, institutional-grade instruments rather than crypto-native derivatives.
Onboarding US Institutions: Clearing, Collateral and Trading Strategies
Getting American clients trading doesn’t happen overnight. Regardless of jurisdiction, onboarding new clients—handled through clearing members for KYC checks, deposits and API connectivity—generally requires two to four weeks. Asked whether trading volumes had already picked up following August’s crypto rally, Lam pointed to onboarding timelines, not market appetite, as the real pace-setter.
“With our FIS-enabled back-office integration now fully in place, we are actively preparing our U.S. clearing members to onboard clients over the next month or two,” Lam said. That timeline matters for anyone watching whether this regulatory green light translates into actual volume — the infrastructure is ready, but the client pipeline still needs to work through standard operational steps.
Once active, traders are using SGX’s perpetuals for two distinct purposes. Some are expressing macro-directional views on bitcoin and ether tied to broader themes like currency debasement concerns, while others run more mechanical cash-and-carry strategies that exploit funding-rate and pricing differentials between venues. That mix of directional and arbitrage-driven flow is typical of a maturing derivatives market rather than a purely speculative one — a distinction that matters for how regulators and institutional risk committees evaluate the product going forward.
What’s Next: Dated Futures and Options for Bitcoin and Ether
SGX isn’t stopping at perpetuals. The exchange is preparing to roll out dated futures and options contracts for bitcoin and ether as the next stage of its crypto derivatives buildout.
“The next step in our pipeline is launching dated futures and options for Bitcoin and Ethereum. Developing that heavy-duty infrastructure is the major lift; once in place, adding other major coins may become a straightforward process like adding another contract,” Lam said. He added that SGX plans to broaden its offerings but is “taking a disciplined, step-by-step approach” — language that suggests further expansion beyond bitcoin and ether is possible once the core infrastructure is built out, without committing to a specific timeline.
For now, the immediate story is access. With Regulation 48.10 clearance in hand, SGX has effectively removed the regulatory barrier that kept U.S. institutions on the sidelines of its bitcoin and ether perpetual futures market, and the coming weeks of clearing-member onboarding will show how quickly that access turns into real trading flow.
FAQ
What regulatory approval did SGX receive to allow US institutions to trade its crypto futures?
SGX obtained CFTC authorization under Regulation 48.10, allowing US institutional investors direct access to its bitcoin and ether perpetual futures without SGX registering as a US exchange.
When were SGX’s bitcoin and ether perpetual futures launched?
SGX launched its crypto perpetual futures covering bitcoin and ether in late November 2025.
How much trading volume have SGX crypto perpetual futures processed since launch?
Since launch, SGX crypto perpetual futures have processed $5.8 billion in cumulative traded volume.
What are SGX’s next planned product launches in crypto derivatives?
SGX plans to launch dated futures and options for bitcoin and ether as the next step in its product pipeline.
Article produced with the assistance of artificial intelligence and reviewed by the editorial team.
SGX Bitcoin Ether Futures Open to US Institutions After $5.8B Surge
The Singapore Exchange has cleared a regulatory hurdle that could reshape how American money flows into Asian crypto markets. SGX has obtained authorization from the U.S. Commodity Futures Trading Commission under Regulation 48.10, letting U.S. institutional investors trade its SGX bitcoin ether futures directly for the first time. The approval marks a notable shift for a derivatives market that has grown steadily since its debut just months ago, and it opens a new channel connecting Wall Street trading desks to liquidity pools that were previously off-limits.
Key takeaways
SGX received CFTC authorization under Regulation 48.10, allowing U.S. institutions to trade its bitcoin and ether perpetual futures without SGX registering as a U.S. exchange.
The exchange’s crypto perpetual futures, launched in late November 2025, have processed $5.8 billion in cumulative traded volume, or roughly 400,000 lots.
Bitcoin dominates activity, accounting for 66% of open interest and 83% of daily trading volume since inception.
SGX uses margin calls and collateral top-ups instead of auto-liquidations, and excludes stablecoins as acceptable collateral.
The exchange plans to launch dated futures and options for bitcoin and ether as its next product step.
SGX Gains CFTC Authorization Under Regulation 48.10
Regulation 48.10 is the mechanism that made this possible. It allows a registered Foreign Board of Trade — an overseas exchange the CFTC formally recognizes — to give U.S. participants direct access to its trading system without setting up a separate, fully U.S.-regulated exchange. In practical terms, SGX can now open its existing order books to American institutional traders under CFTC oversight, rather than launching a parallel U.S. listing from scratch.
“Under the Regulation 48.10 ruling, we have obtained CFTC authorization to open our crypto products to U.S. institutional access. Previously, U.S. participants couldn’t trade these contracts but now they can,” said KC Lam, head of crypto derivatives at SGX Group, in comments to CoinDesk.
Lam described the approval as “an important milestone” that “bridges the U.S. TradFi participants trading crypto futures with Asian liquidity pools” and, in his words, “legitimizes crypto derivatives as a regulated asset class.” Why does this matter beyond SGX itself? Because it signals that regulated crypto derivatives infrastructure outside the U.S. can now be plugged directly into American institutional flows, a template other foreign exchanges may look to replicate as regulators grow more comfortable with the asset class.
How SGX’s Crypto Perpetual Futures Have Performed Since Launch
SGX’s bitcoin and ether perpetual contracts have built real trading momentum in a short window. Since launching in late November 2025, the products have recorded $5.8 billion in cumulative traded volume — around 400,000 lots — establishing a track record before U.S. institutions were even able to participate.
Daily average volume across both contracts reached roughly 1,300 lots, or about $19 million, as of August. Bitcoin remains the dominant driver of activity, making up 66% of open interest and 83% of daily average volume since the contracts went live. The single busiest trading day so far saw 11,500 lots change hands, equal to $145 million in notional value.
Structurally, SGX’s perpetual futures differ from the crypto-native products traders are used to. There’s no expiry date, mirroring the format popularized on crypto exchanges, but SGX relies on margin calls and collateral top-ups rather than automatic liquidations when positions move against a trader. Stablecoins are explicitly excluded as acceptable collateral. “As they can break peg during volatile periods,” Lam explained, a design choice meant to reduce risk during exactly the kind of market stress that would otherwise trigger forced closeouts.
The contracts themselves are benchmarked to indices jointly developed with CoinDesk Indices, according to Mohit Baheti, head of iEdge Indices at SGX Group, and are managed under the EU Benchmark Regulation — a compliance detail that reinforces the products’ positioning as regulated, institutional-grade instruments rather than crypto-native derivatives.
Onboarding US Institutions: Clearing, Collateral and Trading Strategies
Getting American clients trading doesn’t happen overnight. Regardless of jurisdiction, onboarding new clients—handled through clearing members for KYC checks, deposits and API connectivity—generally requires two to four weeks. Asked whether trading volumes had already picked up following August’s crypto rally, Lam pointed to onboarding timelines, not market appetite, as the real pace-setter.
“With our FIS-enabled back-office integration now fully in place, we are actively preparing our U.S. clearing members to onboard clients over the next month or two,” Lam said. That timeline matters for anyone watching whether this regulatory green light translates into actual volume — the infrastructure is ready, but the client pipeline still needs to work through standard operational steps.
Once active, traders are using SGX’s perpetuals for two distinct purposes. Some are expressing macro-directional views on bitcoin and ether tied to broader themes like currency debasement concerns, while others run more mechanical cash-and-carry strategies that exploit funding-rate and pricing differentials between venues. That mix of directional and arbitrage-driven flow is typical of a maturing derivatives market rather than a purely speculative one — a distinction that matters for how regulators and institutional risk committees evaluate the product going forward.
What’s Next: Dated Futures and Options for Bitcoin and Ether
SGX isn’t stopping at perpetuals. The exchange is preparing to roll out dated futures and options contracts for bitcoin and ether as the next stage of its crypto derivatives buildout.
“The next step in our pipeline is launching dated futures and options for Bitcoin and Ethereum. Developing that heavy-duty infrastructure is the major lift; once in place, adding other major coins may become a straightforward process like adding another contract,” Lam said. He added that SGX plans to broaden its offerings but is “taking a disciplined, step-by-step approach” — language that suggests further expansion beyond bitcoin and ether is possible once the core infrastructure is built out, without committing to a specific timeline.
For now, the immediate story is access. With Regulation 48.10 clearance in hand, SGX has effectively removed the regulatory barrier that kept U.S. institutions on the sidelines of its bitcoin and ether perpetual futures market, and the coming weeks of clearing-member onboarding will show how quickly that access turns into real trading flow.
FAQ
What regulatory approval did SGX receive to allow US institutions to trade its crypto futures?
SGX obtained CFTC authorization under Regulation 48.10, allowing US institutional investors direct access to its bitcoin and ether perpetual futures without SGX registering as a US exchange.
When were SGX’s bitcoin and ether perpetual futures launched?
SGX launched its crypto perpetual futures covering bitcoin and ether in late November 2025.
How much trading volume have SGX crypto perpetual futures processed since launch?
Since launch, SGX crypto perpetual futures have processed $5.8 billion in cumulative traded volume.
What are SGX’s next planned product launches in crypto derivatives?
SGX plans to launch dated futures and options for bitcoin and ether as the next step in its product pipeline.
Article produced with the assistance of artificial intelligence and reviewed by the editorial team.
Key takeaways
SGX received CFTC authorization under Regulation 48.10, allowing U.S. institutions to trade its bitcoin and ether perpetual futures without SGX registering as a U.S. exchange.
The exchange’s crypto perpetual futures, launched in late November 2025, have processed $5.8 billion in cumulative traded volume, or roughly 400,000 lots.
Bitcoin dominates activity, accounting for 66% of open interest and 83% of daily trading volume since inception.
SGX uses margin calls and collateral top-ups instead of auto-liquidations, and excludes stablecoins as acceptable collateral.
The exchange plans to launch dated futures and options for bitcoin and ether as its next product step.
SGX Gains CFTC Authorization Under Regulation 48.10
Regulation 48.10 is the mechanism that made this possible. It allows a registered Foreign Board of Trade — an overseas exchange the CFTC formally recognizes — to give U.S. participants direct access to its trading system without setting up a separate, fully U.S.-regulated exchange. In practical terms, SGX can now open its existing order books to American institutional traders under CFTC oversight, rather than launching a parallel U.S. listing from scratch.
“Under the Regulation 48.10 ruling, we have obtained CFTC authorization to open our crypto products to U.S. institutional access. Previously, U.S. participants couldn’t trade these contracts but now they can,” said KC Lam, head of crypto derivatives at SGX Group, in comments to CoinDesk.
Lam described the approval as “an important milestone” that “bridges the U.S. TradFi participants trading crypto futures with Asian liquidity pools” and, in his words, “legitimizes crypto derivatives as a regulated asset class.” Why does this matter beyond SGX itself? Because it signals that regulated crypto derivatives infrastructure outside the U.S. can now be plugged directly into American institutional flows, a template other foreign exchanges may look to replicate as regulators grow more comfortable with the asset class.
How SGX’s Crypto Perpetual Futures Have Performed Since Launch
SGX’s bitcoin and ether perpetual contracts have built real trading momentum in a short window. Since launching in late November 2025, the products have recorded $5.8 billion in cumulative traded volume — around 400,000 lots — establishing a track record before U.S. institutions were even able to participate.
Daily average volume across both contracts reached roughly 1,300 lots, or about $19 million, as of August. Bitcoin remains the dominant driver of activity, making up 66% of open interest and 83% of daily average volume since the contracts went live. The single busiest trading day so far saw 11,500 lots change hands, equal to $145 million in notional value.
Structurally, SGX’s perpetual futures differ from the crypto-native products traders are used to. There’s no expiry date, mirroring the format popularized on crypto exchanges, but SGX relies on margin calls and collateral top-ups rather than automatic liquidations when positions move against a trader. Stablecoins are explicitly excluded as acceptable collateral. “As they can break peg during volatile periods,” Lam explained, a design choice meant to reduce risk during exactly the kind of market stress that would otherwise trigger forced closeouts.
The contracts themselves are benchmarked to indices jointly developed with CoinDesk Indices, according to Mohit Baheti, head of iEdge Indices at SGX Group, and are managed under the EU Benchmark Regulation — a compliance detail that reinforces the products’ positioning as regulated, institutional-grade instruments rather than crypto-native derivatives.
Onboarding US Institutions: Clearing, Collateral and Trading Strategies
Getting American clients trading doesn’t happen overnight. Regardless of jurisdiction, onboarding new clients—handled through clearing members for KYC checks, deposits and API connectivity—generally requires two to four weeks. Asked whether trading volumes had already picked up following August’s crypto rally, Lam pointed to onboarding timelines, not market appetite, as the real pace-setter.
“With our FIS-enabled back-office integration now fully in place, we are actively preparing our U.S. clearing members to onboard clients over the next month or two,” Lam said. That timeline matters for anyone watching whether this regulatory green light translates into actual volume — the infrastructure is ready, but the client pipeline still needs to work through standard operational steps.
Once active, traders are using SGX’s perpetuals for two distinct purposes. Some are expressing macro-directional views on bitcoin and ether tied to broader themes like currency debasement concerns, while others run more mechanical cash-and-carry strategies that exploit funding-rate and pricing differentials between venues. That mix of directional and arbitrage-driven flow is typical of a maturing derivatives market rather than a purely speculative one — a distinction that matters for how regulators and institutional risk committees evaluate the product going forward.
What’s Next: Dated Futures and Options for Bitcoin and Ether
SGX isn’t stopping at perpetuals. The exchange is preparing to roll out dated futures and options contracts for bitcoin and ether as the next stage of its crypto derivatives buildout.
“The next step in our pipeline is launching dated futures and options for Bitcoin and Ethereum. Developing that heavy-duty infrastructure is the major lift; once in place, adding other major coins may become a straightforward process like adding another contract,” Lam said. He added that SGX plans to broaden its offerings but is “taking a disciplined, step-by-step approach” — language that suggests further expansion beyond bitcoin and ether is possible once the core infrastructure is built out, without committing to a specific timeline.
For now, the immediate story is access. With Regulation 48.10 clearance in hand, SGX has effectively removed the regulatory barrier that kept U.S. institutions on the sidelines of its bitcoin and ether perpetual futures market, and the coming weeks of clearing-member onboarding will show how quickly that access turns into real trading flow.
FAQ
What regulatory approval did SGX receive to allow US institutions to trade its crypto futures?
SGX obtained CFTC authorization under Regulation 48.10, allowing US institutional investors direct access to its bitcoin and ether perpetual futures without SGX registering as a US exchange.
When were SGX’s bitcoin and ether perpetual futures launched?
SGX launched its crypto perpetual futures covering bitcoin and ether in late November 2025.
How much trading volume have SGX crypto perpetual futures processed since launch?
Since launch, SGX crypto perpetual futures have processed $5.8 billion in cumulative traded volume.
What are SGX’s next planned product launches in crypto derivatives?
SGX plans to launch dated futures and options for bitcoin and ether as the next step in its product pipeline.
Article produced with the assistance of artificial intelligence and reviewed by the editorial team.
1
94

Article
Cryptocurrency theft case: Malone Lam admits to $245M Bitcoin heistA 22-year-old school dropout from Singapore has admitted to running one of the largest cryptocurrency theft operations ever prosecuted in the United States, a case that shows just how easily social engineering can drain a crypto wallet worth hundreds of millions of dollars. Malone Lam, who left school in the eighth grade before eventually settling in Miami, pleaded guilty to a racketeering conspiracy charge tied to the theft and laundering of more than $245 million in digital assets. The cryptocurrency theft case against him is now considered a major milestone in a much larger federal investigation into an international crypto-theft network.
Key takeaways
Malone Lam, 22, pleaded guilty to a RICO conspiracy charge tied to the theft and laundering of more than $245 million in digital assets.
Lam and his associates stole over 4,100 Bitcoin from a Washington, DC victim by impersonating Google and Gemini executives, in a theft valued at more than $230 million in August 2024.
At least 18 defendants have been charged in the wider enterprise, which authorities say operated from October 2023 through May 2025.
Stolen funds financed over 30 exotic cars, a $2 million watch, mansions, private jets and a single $569,000 night out at a Los Angeles nightclub.
Lam faces up to 20 years in prison on the RICO charge, with his next status hearing scheduled for December 8, 2026.
Malone Lam Pleads Guilty in a $245 Million Cryptocurrency Theft Case
Lam entered his guilty plea on September 8, 2026, in US District Court in Washington, DC, admitting to a single count of participating in a RICO conspiracy. According to the US Department of Justice, he led an international cybercrime ring that relied on social engineering tactics to steal and launder digital assets exceeding $245 million in value.
Prosecutors say the enterprise operated from at least October 2023 through May 2025, drawing in participants across several US states and abroad. Using online aliases such as “Anne Hathaway,” “$$$” and “King Greavy,” Lam — a Singapore citizen who later relocated to Miami — is accused of helping run the group’s social engineering schemes by pinpointing victims and assigning roles among network members. Among the 18 individuals charged in this broader case, he became the 11th to plead guilty, a development investigators view as a major turning point despite being one of many defendants. He faces a maximum sentence of 20 years on the RICO conspiracy charge, and his next status hearing is scheduled for December 8, 2026.
How a Bitcoin Social Engineering Scam Drained One Victim’s Wallet
Posing as Google and Gemini staff
On August 18, 2024, Lam and his alleged accomplices carried out the case’s biggest single theft, targeting a cryptocurrency investor based in Washington, DC. Rather than hacking directly into the victim’s wallet, members of the group relied on a Bitcoin social engineering scam: two conspirators posed as representatives of Google and the Gemini cryptocurrency exchange, convincing the victim his accounts were compromised. That manipulation led him to hand over access to his Google Drive and reveal security codes, giving the group everything it needed to move his funds.
More than $230 million taken in one theft
Using that access, the conspirators siphoned off more than 4,100 Bitcoin. The original federal indictment valued the stolen Bitcoin at more than $230 million at the time of the theft in August 2024. The Justice Department’s broader case describes the full enterprise as having stolen and laundered cryptocurrency worth over $245 million, indicating the Washington theft was not an isolated event. The expanded indictment also references a separate theft of more than $14 million in cryptocurrency from another victim in July 2024.
This is where the case matters beyond the courtroom: it underscores how vulnerable even sophisticated crypto holders remain to impersonation tactics that require no technical hacking at all, only a convincing phone call and a moment of trust.
An International Network Built From Gaming Friendships
Prosecutors describe a criminal enterprise with clearly divided labor — database hackers, target identifiers, callers, organizers, money launderers, and even people allegedly tied to residential burglaries targeting cryptocurrency hardware wallets. At least 18 defendants have been charged in connection with the wider operation, which authorities say grew out of friendships formed on online gaming platforms before evolving into an organized scheme targeting wealthy cryptocurrency holders across the country.
Ferraris, Mansions and a $569,000 Night: Where the Stolen Bitcoin Went
An extravagant, short-lived lifestyle
Once the Bitcoin was converted into cash, Lam and other members of the operation poured the money into an extravagant lifestyle. According to the Associated Press, Lam purchased more than 30 exotic cars, including custom Porsches, Lamborghinis and Ferraris, and bought a watch worth roughly $2 million. He and his associates rented mansions in Miami and used the stolen funds to cover private jets, security personnel and luxury clothing. One of the most eye-catching figures in the case came from a single evening at a Los Angeles nightclub, where Lam reportedly spent about $569,000. The Justice Department says members of the wider conspiracy sometimes spent as much as $500,000 per night on nightclub services and bought vehicles ranging from $100,000 to $3.8 million.
Shell companies, private jets and stuffed toys
Beyond the spending, investigators uncovered unusual methods allegedly used to disguise the origin of the funds. Members of the enterprise reportedly relied on luxury rental properties, private aircraft and shell companies to obscure asset ownership. The expanded indictment also alleges that some members offered unlicensed crypto-to-cash services and that bulk cash was shipped through the US postal system hidden inside Squishmallow stuffed toys — a detail that illustrates just how far the laundering operation extended beyond the digital realm. These allegations apply to the broader case and remain subject to the legal process for defendants who have not yet entered guilty pleas.
Arrest in Miami and What Happens Next in the Case
Lam managed to keep up his extravagant spending for about a month before authorities caught up with him, arresting him in Miami in September 2024 after digital evidence tied him to the theft — a case reportedly helped along when an off-duty law enforcement officer allegedly tipped him off that investigators were closing in. Around the same period, alleged co-conspirator Jeandiel Serrano was also taken into custody, after cryptocurrency-related activity led investigators to a high-end property in California.
As the probe grew, prosecutors ultimately charged 18 defendants, with three co-conspirators sentenced before Lam even entered his plea, while others remain in various stages of pleading guilty or awaiting trial. Recordings made during the investigation reportedly captured Lam speaking from behind bars, admitting that he and his associates had once joked about what getting arrested might look like but never imagined the situation would escalate this far. During an earlier court appearance, after hearing prosecutors outline the extent of his spending, US Magistrate Judge Alicia Valle remarked that the case resembled “Ferris Bueller gone bad” — a nod to the mischievous protagonist of the 1986 film, even though Lam’s alleged crimes spanned hundreds of millions of dollars rather than a single day of playing hooky.
Lam’s admission of guilt is far from the final chapter in this RICO crypto conspiracy. No sentencing date has been fixed beyond a status hearing scheduled for December 8, 2026, and legal proceedings against the remaining defendants are still unfolding. Nevertheless, the case makes clear how a group of friends who met through online gaming ended up orchestrating one of the biggest cryptocurrency theft operations in American history — serving as a stark warning to anyone tempted to trust an unexpected call claiming to be from “Google” or a crypto exchange.
FAQ
How did Malone Lam and his associates steal over 4,100 Bitcoin?
They used social engineering by impersonating Google and Gemini executives to trick the victim into providing access and security codes.
What luxury items were purchased with the stolen cryptocurrency?
The stolen funds financed over 30 exotic cars, a $2 million watch, mansions, private jets, and lavish nightclub spending including a $569,000 night in Los Angeles.
What charges does Malone Lam face and when is his next court hearing?
Malone Lam pleaded guilty to one count of RICO conspiracy and faces up to 20 years in prison. His next status hearing is December 8, 2026.
How extensive was the criminal enterprise behind the cryptocurrency theft?
The enterprise was international, operated from October 2023 through May 2025, and involved at least 18 defendants.
Article produced with the assistance of artificial intelligence and reviewed by the editorial team.
Cryptocurrency theft case: Malone Lam admits to $245M Bitcoin heist
A 22-year-old school dropout from Singapore has admitted to running one of the largest cryptocurrency theft operations ever prosecuted in the United States, a case that shows just how easily social engineering can drain a crypto wallet worth hundreds of millions of dollars. Malone Lam, who left school in the eighth grade before eventually settling in Miami, pleaded guilty to a racketeering conspiracy charge tied to the theft and laundering of more than $245 million in digital assets. The cryptocurrency theft case against him is now considered a major milestone in a much larger federal investigation into an international crypto-theft network.
Key takeaways
Malone Lam, 22, pleaded guilty to a RICO conspiracy charge tied to the theft and laundering of more than $245 million in digital assets.
Lam and his associates stole over 4,100 Bitcoin from a Washington, DC victim by impersonating Google and Gemini executives, in a theft valued at more than $230 million in August 2024.
At least 18 defendants have been charged in the wider enterprise, which authorities say operated from October 2023 through May 2025.
Stolen funds financed over 30 exotic cars, a $2 million watch, mansions, private jets and a single $569,000 night out at a Los Angeles nightclub.
Lam faces up to 20 years in prison on the RICO charge, with his next status hearing scheduled for December 8, 2026.
Malone Lam Pleads Guilty in a $245 Million Cryptocurrency Theft Case
Lam entered his guilty plea on September 8, 2026, in US District Court in Washington, DC, admitting to a single count of participating in a RICO conspiracy. According to the US Department of Justice, he led an international cybercrime ring that relied on social engineering tactics to steal and launder digital assets exceeding $245 million in value.
Prosecutors say the enterprise operated from at least October 2023 through May 2025, drawing in participants across several US states and abroad. Using online aliases such as “Anne Hathaway,” “$$$” and “King Greavy,” Lam — a Singapore citizen who later relocated to Miami — is accused of helping run the group’s social engineering schemes by pinpointing victims and assigning roles among network members. Among the 18 individuals charged in this broader case, he became the 11th to plead guilty, a development investigators view as a major turning point despite being one of many defendants. He faces a maximum sentence of 20 years on the RICO conspiracy charge, and his next status hearing is scheduled for December 8, 2026.
How a Bitcoin Social Engineering Scam Drained One Victim’s Wallet
Posing as Google and Gemini staff
On August 18, 2024, Lam and his alleged accomplices carried out the case’s biggest single theft, targeting a cryptocurrency investor based in Washington, DC. Rather than hacking directly into the victim’s wallet, members of the group relied on a Bitcoin social engineering scam: two conspirators posed as representatives of Google and the Gemini cryptocurrency exchange, convincing the victim his accounts were compromised. That manipulation led him to hand over access to his Google Drive and reveal security codes, giving the group everything it needed to move his funds.
More than $230 million taken in one theft
Using that access, the conspirators siphoned off more than 4,100 Bitcoin. The original federal indictment valued the stolen Bitcoin at more than $230 million at the time of the theft in August 2024. The Justice Department’s broader case describes the full enterprise as having stolen and laundered cryptocurrency worth over $245 million, indicating the Washington theft was not an isolated event. The expanded indictment also references a separate theft of more than $14 million in cryptocurrency from another victim in July 2024.
This is where the case matters beyond the courtroom: it underscores how vulnerable even sophisticated crypto holders remain to impersonation tactics that require no technical hacking at all, only a convincing phone call and a moment of trust.
An International Network Built From Gaming Friendships
Prosecutors describe a criminal enterprise with clearly divided labor — database hackers, target identifiers, callers, organizers, money launderers, and even people allegedly tied to residential burglaries targeting cryptocurrency hardware wallets. At least 18 defendants have been charged in connection with the wider operation, which authorities say grew out of friendships formed on online gaming platforms before evolving into an organized scheme targeting wealthy cryptocurrency holders across the country.
Ferraris, Mansions and a $569,000 Night: Where the Stolen Bitcoin Went
An extravagant, short-lived lifestyle
Once the Bitcoin was converted into cash, Lam and other members of the operation poured the money into an extravagant lifestyle. According to the Associated Press, Lam purchased more than 30 exotic cars, including custom Porsches, Lamborghinis and Ferraris, and bought a watch worth roughly $2 million. He and his associates rented mansions in Miami and used the stolen funds to cover private jets, security personnel and luxury clothing. One of the most eye-catching figures in the case came from a single evening at a Los Angeles nightclub, where Lam reportedly spent about $569,000. The Justice Department says members of the wider conspiracy sometimes spent as much as $500,000 per night on nightclub services and bought vehicles ranging from $100,000 to $3.8 million.
Shell companies, private jets and stuffed toys
Beyond the spending, investigators uncovered unusual methods allegedly used to disguise the origin of the funds. Members of the enterprise reportedly relied on luxury rental properties, private aircraft and shell companies to obscure asset ownership. The expanded indictment also alleges that some members offered unlicensed crypto-to-cash services and that bulk cash was shipped through the US postal system hidden inside Squishmallow stuffed toys — a detail that illustrates just how far the laundering operation extended beyond the digital realm. These allegations apply to the broader case and remain subject to the legal process for defendants who have not yet entered guilty pleas.
Arrest in Miami and What Happens Next in the Case
Lam managed to keep up his extravagant spending for about a month before authorities caught up with him, arresting him in Miami in September 2024 after digital evidence tied him to the theft — a case reportedly helped along when an off-duty law enforcement officer allegedly tipped him off that investigators were closing in. Around the same period, alleged co-conspirator Jeandiel Serrano was also taken into custody, after cryptocurrency-related activity led investigators to a high-end property in California.
As the probe grew, prosecutors ultimately charged 18 defendants, with three co-conspirators sentenced before Lam even entered his plea, while others remain in various stages of pleading guilty or awaiting trial. Recordings made during the investigation reportedly captured Lam speaking from behind bars, admitting that he and his associates had once joked about what getting arrested might look like but never imagined the situation would escalate this far. During an earlier court appearance, after hearing prosecutors outline the extent of his spending, US Magistrate Judge Alicia Valle remarked that the case resembled “Ferris Bueller gone bad” — a nod to the mischievous protagonist of the 1986 film, even though Lam’s alleged crimes spanned hundreds of millions of dollars rather than a single day of playing hooky.
Lam’s admission of guilt is far from the final chapter in this RICO crypto conspiracy. No sentencing date has been fixed beyond a status hearing scheduled for December 8, 2026, and legal proceedings against the remaining defendants are still unfolding. Nevertheless, the case makes clear how a group of friends who met through online gaming ended up orchestrating one of the biggest cryptocurrency theft operations in American history — serving as a stark warning to anyone tempted to trust an unexpected call claiming to be from “Google” or a crypto exchange.
FAQ
How did Malone Lam and his associates steal over 4,100 Bitcoin?
They used social engineering by impersonating Google and Gemini executives to trick the victim into providing access and security codes.
What luxury items were purchased with the stolen cryptocurrency?
The stolen funds financed over 30 exotic cars, a $2 million watch, mansions, private jets, and lavish nightclub spending including a $569,000 night in Los Angeles.
What charges does Malone Lam face and when is his next court hearing?
Malone Lam pleaded guilty to one count of RICO conspiracy and faces up to 20 years in prison. His next status hearing is December 8, 2026.
How extensive was the criminal enterprise behind the cryptocurrency theft?
The enterprise was international, operated from October 2023 through May 2025, and involved at least 18 defendants.
Article produced with the assistance of artificial intelligence and reviewed by the editorial team.
Key takeaways
Malone Lam, 22, pleaded guilty to a RICO conspiracy charge tied to the theft and laundering of more than $245 million in digital assets.
Lam and his associates stole over 4,100 Bitcoin from a Washington, DC victim by impersonating Google and Gemini executives, in a theft valued at more than $230 million in August 2024.
At least 18 defendants have been charged in the wider enterprise, which authorities say operated from October 2023 through May 2025.
Stolen funds financed over 30 exotic cars, a $2 million watch, mansions, private jets and a single $569,000 night out at a Los Angeles nightclub.
Lam faces up to 20 years in prison on the RICO charge, with his next status hearing scheduled for December 8, 2026.
Malone Lam Pleads Guilty in a $245 Million Cryptocurrency Theft Case
Lam entered his guilty plea on September 8, 2026, in US District Court in Washington, DC, admitting to a single count of participating in a RICO conspiracy. According to the US Department of Justice, he led an international cybercrime ring that relied on social engineering tactics to steal and launder digital assets exceeding $245 million in value.
Prosecutors say the enterprise operated from at least October 2023 through May 2025, drawing in participants across several US states and abroad. Using online aliases such as “Anne Hathaway,” “$$$” and “King Greavy,” Lam — a Singapore citizen who later relocated to Miami — is accused of helping run the group’s social engineering schemes by pinpointing victims and assigning roles among network members. Among the 18 individuals charged in this broader case, he became the 11th to plead guilty, a development investigators view as a major turning point despite being one of many defendants. He faces a maximum sentence of 20 years on the RICO conspiracy charge, and his next status hearing is scheduled for December 8, 2026.
How a Bitcoin Social Engineering Scam Drained One Victim’s Wallet
Posing as Google and Gemini staff
On August 18, 2024, Lam and his alleged accomplices carried out the case’s biggest single theft, targeting a cryptocurrency investor based in Washington, DC. Rather than hacking directly into the victim’s wallet, members of the group relied on a Bitcoin social engineering scam: two conspirators posed as representatives of Google and the Gemini cryptocurrency exchange, convincing the victim his accounts were compromised. That manipulation led him to hand over access to his Google Drive and reveal security codes, giving the group everything it needed to move his funds.
More than $230 million taken in one theft
Using that access, the conspirators siphoned off more than 4,100 Bitcoin. The original federal indictment valued the stolen Bitcoin at more than $230 million at the time of the theft in August 2024. The Justice Department’s broader case describes the full enterprise as having stolen and laundered cryptocurrency worth over $245 million, indicating the Washington theft was not an isolated event. The expanded indictment also references a separate theft of more than $14 million in cryptocurrency from another victim in July 2024.
This is where the case matters beyond the courtroom: it underscores how vulnerable even sophisticated crypto holders remain to impersonation tactics that require no technical hacking at all, only a convincing phone call and a moment of trust.
An International Network Built From Gaming Friendships
Prosecutors describe a criminal enterprise with clearly divided labor — database hackers, target identifiers, callers, organizers, money launderers, and even people allegedly tied to residential burglaries targeting cryptocurrency hardware wallets. At least 18 defendants have been charged in connection with the wider operation, which authorities say grew out of friendships formed on online gaming platforms before evolving into an organized scheme targeting wealthy cryptocurrency holders across the country.
Ferraris, Mansions and a $569,000 Night: Where the Stolen Bitcoin Went
An extravagant, short-lived lifestyle
Once the Bitcoin was converted into cash, Lam and other members of the operation poured the money into an extravagant lifestyle. According to the Associated Press, Lam purchased more than 30 exotic cars, including custom Porsches, Lamborghinis and Ferraris, and bought a watch worth roughly $2 million. He and his associates rented mansions in Miami and used the stolen funds to cover private jets, security personnel and luxury clothing. One of the most eye-catching figures in the case came from a single evening at a Los Angeles nightclub, where Lam reportedly spent about $569,000. The Justice Department says members of the wider conspiracy sometimes spent as much as $500,000 per night on nightclub services and bought vehicles ranging from $100,000 to $3.8 million.
Shell companies, private jets and stuffed toys
Beyond the spending, investigators uncovered unusual methods allegedly used to disguise the origin of the funds. Members of the enterprise reportedly relied on luxury rental properties, private aircraft and shell companies to obscure asset ownership. The expanded indictment also alleges that some members offered unlicensed crypto-to-cash services and that bulk cash was shipped through the US postal system hidden inside Squishmallow stuffed toys — a detail that illustrates just how far the laundering operation extended beyond the digital realm. These allegations apply to the broader case and remain subject to the legal process for defendants who have not yet entered guilty pleas.
Arrest in Miami and What Happens Next in the Case
Lam managed to keep up his extravagant spending for about a month before authorities caught up with him, arresting him in Miami in September 2024 after digital evidence tied him to the theft — a case reportedly helped along when an off-duty law enforcement officer allegedly tipped him off that investigators were closing in. Around the same period, alleged co-conspirator Jeandiel Serrano was also taken into custody, after cryptocurrency-related activity led investigators to a high-end property in California.
As the probe grew, prosecutors ultimately charged 18 defendants, with three co-conspirators sentenced before Lam even entered his plea, while others remain in various stages of pleading guilty or awaiting trial. Recordings made during the investigation reportedly captured Lam speaking from behind bars, admitting that he and his associates had once joked about what getting arrested might look like but never imagined the situation would escalate this far. During an earlier court appearance, after hearing prosecutors outline the extent of his spending, US Magistrate Judge Alicia Valle remarked that the case resembled “Ferris Bueller gone bad” — a nod to the mischievous protagonist of the 1986 film, even though Lam’s alleged crimes spanned hundreds of millions of dollars rather than a single day of playing hooky.
Lam’s admission of guilt is far from the final chapter in this RICO crypto conspiracy. No sentencing date has been fixed beyond a status hearing scheduled for December 8, 2026, and legal proceedings against the remaining defendants are still unfolding. Nevertheless, the case makes clear how a group of friends who met through online gaming ended up orchestrating one of the biggest cryptocurrency theft operations in American history — serving as a stark warning to anyone tempted to trust an unexpected call claiming to be from “Google” or a crypto exchange.
FAQ
How did Malone Lam and his associates steal over 4,100 Bitcoin?
They used social engineering by impersonating Google and Gemini executives to trick the victim into providing access and security codes.
What luxury items were purchased with the stolen cryptocurrency?
The stolen funds financed over 30 exotic cars, a $2 million watch, mansions, private jets, and lavish nightclub spending including a $569,000 night in Los Angeles.
What charges does Malone Lam face and when is his next court hearing?
Malone Lam pleaded guilty to one count of RICO conspiracy and faces up to 20 years in prison. His next status hearing is December 8, 2026.
How extensive was the criminal enterprise behind the cryptocurrency theft?
The enterprise was international, operated from October 2023 through May 2025, and involved at least 18 defendants.
Article produced with the assistance of artificial intelligence and reviewed by the editorial team.
1
58

Article
Archer Aviation Stock Stays Below Every Key Average Despite Wisk Aero DealArcher Aviation stock sits at an uncomfortable crossroads. The daily chart shows the stock struggling under its moving averages, even as newsflow keeps improving. The gap between narrative and price action is the real story right now.
ACHR — daily chart with candlesticks, EMA20/EMA50 and volume.
Key takeaways
ACHR closed at $5.50, trading below all three daily EMAs (20, 50, 200).
Daily RSI14 reads 44.87 — neutral territory, not yet signaling exhaustion.
The MACD histogram at -0.08 confirms a bearish cross and fading momentum.
Positive fundamentals — including the Wisk Aero acquisition and Midnight eVTOL milestones — have yet to lift price action.
Daily support sits at $5.40; a break below opens the door to the lower Bollinger band at $5.29.
Archer Aviation Stock: Daily Trend Still Leans Bearish
The daily chart for Archer Aviation stock remains in a clear bearish structure. Price trades below all three key EMAs, with the 200-day sitting more than a dollar above spot.
The EMA20 sits at $5.79, the EMA50 at $5.68, and the EMA200 at $6.52. That stacking — price under every average — points to a stock still working through a longer-term downtrend. This is not a fresh breakout.
At the same time, RSI14 on the daily reads 44.87, neutral territory rather than oversold. The recent slide has not reached exhaustion. No strong technical signal suggests the downside is done.
Meanwhile, the daily MACD line reads 0.01 against a signal line of 0.10. The histogram sits at -0.08. That bearish cross confirms momentum is fading rather than building.
The Bollinger setup adds another layer. The mid-band sits at $6.04, the upper band at $6.79, and the lower band at $5.29. At $5.50, ACHR trades in the lower half of its volatility envelope, closer to the floor than the middle.
ATR14 of $0.28 shows daily ranges remain wide relative to the share price. Swings in either direction stay very plausible.
Pivot levels reinforce the cautious read. The daily pivot is $5.60, with resistance at $5.69 and support at $5.40. Price closing below the pivot keeps the near-term bias tilted to the downside unless buyers step in with conviction.
Hourly Chart Confirms the Weakness
Meanwhile, the hourly timeframe offers no relief for Archer Aviation stock. Price sits below all three EMAs, and the EMA50 and EMA200 have converged almost exactly. That convergence signals a stalled intraday trend rather than fresh strength.
The latest hourly candle closed at $5.50, with EMA20 at $5.67, EMA50 at $5.73, and EMA200 at $5.73. Notably, the EMA50 and EMA200 sitting at the same level reinforces the stalled-trend read.
RSI14 on the hourly has dropped to 33.91, approaching oversold conditions. MACD is negative too. The line at -0.04 against a signal of -0.01 produces a histogram of -0.03.
In short, the hourly chart is confirming, not contradicting, the daily bearish tilt. That alignment across timeframes strengthens the case that current pressure is more than daily noise.
The hourly Bollinger bands show the mid at $5.69, upper at $5.90, and lower at $5.49. Price remains essentially glued to the lower band. Pivot data puts the hourly pivot at $5.53 and S1 support at $5.47, meaning ACHR trades right on its intraday floor.
15-Minute Chart: Oversold, But Not Reversing Yet
Zooming in further, the 15-minute chart shows Archer Aviation stock in oversold territory. However, a confirmed reversal has not yet materialized. RSI14 has fallen to 31.46, while the MACD histogram has merely flattened rather than turning positive.
The system explicitly tags the 15-minute regime as bearish. The MACD histogram flattened to 0.00, even though both the MACD line and signal remain negative at -0.04. That flattening can hint at short-term seller fatigue. It is not yet a confirmed reversal signal.
Additionally, price hugs the lower Bollinger band, with the mid at $5.59, upper at $5.65, and lower at $5.52. The 15-minute pivot sits at $5.52, with support at $5.48. Both levels sit essentially where price currently trades.
Still, for traders watching intraday entries, the support cluster around $5.47–$5.48 is the level to monitor. Any short-term bounce attempt would need to start there.
A Real Conflict: Strong News, Weak Price Action
Archer Aviation stock presents a genuine conflict between fundamentals and price action. The operational news has been constructive, yet the technical picture remains decidedly weak.
On the fundamental side, Archer Aviation has been anything but quiet. The company is reportedly buying Boeing’s Wisk Aero, Insitu, and SkyGrid. This signals rapid expansion through partnerships and acquisitions.
Separately, Archer’s Midnight eVTOL completed a piloted round trip between Salinas and Hollister airports. The flight covered roughly 40 miles in 12 minutes each way, backed by FAA-supported expansion plans.
Beyond that, Archer’s multi-city “No Roads” flight tour is expanding Midnight testing across varied routes. The company is preparing for eIPP flights, LA28, and eventual passenger services.
Even Motley Fool’s coverage framed shares below $6 as a risk-tolerant buy opportunity, while making clear the stock remains far from safe.
Therefore, the disconnect is notable. The operational and corporate news is genuinely positive. Yet price still trades below every meaningful moving average on both daily and hourly charts.
This divergence often means the market has not fully digested the news. Alternatively, broader sentiment may simply be overriding company-specific catalysts for now.
Bullish Scenario
For Archer Aviation stock to turn bullish, buyers must reclaim key technical levels. The first hurdle is the daily pivot at $5.60, followed by the EMA50 at $5.68.
A close back above the EMA20 near $5.79 would be a stronger signal. That would indicate short-term structure is repairing. RSI moving back above 50 on both daily and hourly charts would confirm momentum has actually shifted, rather than just stabilized.
In that scenario, the steady stream of positive news could start acting as genuine fundamental support. Deals involving Wisk Aero, Insitu, and SkyGrid, along with FAA-backed flight milestones, would then carry more weight.
Bearish Scenario
The bearish case for Archer Aviation stock remains straightforward. Failure to hold daily support at $5.40 opens the door toward the lower Bollinger band at $5.29.
A break below $5.29, especially on rising volume, would suggest the broader downtrend remains firmly in place. The EMA200 at $6.52 continues to define that trend from above.
Continued weakness on the hourly chart would further validate the bearish tone. A drop through the $5.47 support zone would confirm sellers are still setting the tone, despite the positive headlines.
Closing Take on Archer Aviation Stock
Archer Aviation stock is caught between an improving operational story and a technical picture that has not yet turned. Elevated volatility means sharp moves in either direction remain firmly on the table.
ATR readings across timeframes reflect this elevated volatility relative to the share price. Positioning here requires patience. The daily trend still leans cautious, and the hourly chart confirms that caution.
Only the 15-minute picture offers early, unconfirmed signs of oversold conditions. Until price reclaims key levels like the $5.60 pivot or $5.68 EMA50, uncertainty is likely to remain the dominant theme.
FAQ
Is Archer Aviation stock a buy at current levels?
The technical picture remains bearish across daily and hourly timeframes. With RSI at 44.87 on the daily chart and price below all key EMAs, the stock has not yet shown a confirmed reversal. Positive fundamentals — including the Wisk Aero acquisition and Midnight eVTOL milestones — offer long-term potential, but price action has not aligned with the news yet.
What are the key support levels for ACHR?
The immediate support for Archer Aviation stock sits at $5.40, the daily S1 pivot. Below that, the lower daily Bollinger band at $5.29 is the next level to watch. On the hourly chart, the $5.47–$5.48 cluster serves as the intraday floor. A break below these levels on rising volume would reinforce the bearish structure.
What would signal a bullish reversal for Archer Aviation stock?
A bullish reversal would require ACHR to reclaim the daily pivot at $5.60 first, then push above the EMA50 at $5.68. A close above the EMA20 near $5.79 would provide stronger confirmation. RSI moving back above 50 on both daily and hourly charts would confirm momentum has actually shifted.
Disclaimer: This article is for informational purposes only and does not constitute financial advice, an investment recommendation, or a solicitation to buy or sell any financial instrument or cryptocurrency. The analysis provided is not indicative of future results. Investing in crypto assets and financial markets carries a high risk of capital loss. Always do your own research (DYOR) and consult a qualified financial advisor before making any decision.
Article produced with the assistance of artificial intelligence and reviewed by the editorial team.
Archer Aviation Stock Stays Below Every Key Average Despite Wisk Aero Deal
Archer Aviation stock sits at an uncomfortable crossroads. The daily chart shows the stock struggling under its moving averages, even as newsflow keeps improving. The gap between narrative and price action is the real story right now.
ACHR — daily chart with candlesticks, EMA20/EMA50 and volume.
Key takeaways
ACHR closed at $5.50, trading below all three daily EMAs (20, 50, 200).
Daily RSI14 reads 44.87 — neutral territory, not yet signaling exhaustion.
The MACD histogram at -0.08 confirms a bearish cross and fading momentum.
Positive fundamentals — including the Wisk Aero acquisition and Midnight eVTOL milestones — have yet to lift price action.
Daily support sits at $5.40; a break below opens the door to the lower Bollinger band at $5.29.
Archer Aviation Stock: Daily Trend Still Leans Bearish
The daily chart for Archer Aviation stock remains in a clear bearish structure. Price trades below all three key EMAs, with the 200-day sitting more than a dollar above spot.
The EMA20 sits at $5.79, the EMA50 at $5.68, and the EMA200 at $6.52. That stacking — price under every average — points to a stock still working through a longer-term downtrend. This is not a fresh breakout.
At the same time, RSI14 on the daily reads 44.87, neutral territory rather than oversold. The recent slide has not reached exhaustion. No strong technical signal suggests the downside is done.
Meanwhile, the daily MACD line reads 0.01 against a signal line of 0.10. The histogram sits at -0.08. That bearish cross confirms momentum is fading rather than building.
The Bollinger setup adds another layer. The mid-band sits at $6.04, the upper band at $6.79, and the lower band at $5.29. At $5.50, ACHR trades in the lower half of its volatility envelope, closer to the floor than the middle.
ATR14 of $0.28 shows daily ranges remain wide relative to the share price. Swings in either direction stay very plausible.
Pivot levels reinforce the cautious read. The daily pivot is $5.60, with resistance at $5.69 and support at $5.40. Price closing below the pivot keeps the near-term bias tilted to the downside unless buyers step in with conviction.
Hourly Chart Confirms the Weakness
Meanwhile, the hourly timeframe offers no relief for Archer Aviation stock. Price sits below all three EMAs, and the EMA50 and EMA200 have converged almost exactly. That convergence signals a stalled intraday trend rather than fresh strength.
The latest hourly candle closed at $5.50, with EMA20 at $5.67, EMA50 at $5.73, and EMA200 at $5.73. Notably, the EMA50 and EMA200 sitting at the same level reinforces the stalled-trend read.
RSI14 on the hourly has dropped to 33.91, approaching oversold conditions. MACD is negative too. The line at -0.04 against a signal of -0.01 produces a histogram of -0.03.
In short, the hourly chart is confirming, not contradicting, the daily bearish tilt. That alignment across timeframes strengthens the case that current pressure is more than daily noise.
The hourly Bollinger bands show the mid at $5.69, upper at $5.90, and lower at $5.49. Price remains essentially glued to the lower band. Pivot data puts the hourly pivot at $5.53 and S1 support at $5.47, meaning ACHR trades right on its intraday floor.
15-Minute Chart: Oversold, But Not Reversing Yet
Zooming in further, the 15-minute chart shows Archer Aviation stock in oversold territory. However, a confirmed reversal has not yet materialized. RSI14 has fallen to 31.46, while the MACD histogram has merely flattened rather than turning positive.
The system explicitly tags the 15-minute regime as bearish. The MACD histogram flattened to 0.00, even though both the MACD line and signal remain negative at -0.04. That flattening can hint at short-term seller fatigue. It is not yet a confirmed reversal signal.
Additionally, price hugs the lower Bollinger band, with the mid at $5.59, upper at $5.65, and lower at $5.52. The 15-minute pivot sits at $5.52, with support at $5.48. Both levels sit essentially where price currently trades.
Still, for traders watching intraday entries, the support cluster around $5.47–$5.48 is the level to monitor. Any short-term bounce attempt would need to start there.
A Real Conflict: Strong News, Weak Price Action
Archer Aviation stock presents a genuine conflict between fundamentals and price action. The operational news has been constructive, yet the technical picture remains decidedly weak.
On the fundamental side, Archer Aviation has been anything but quiet. The company is reportedly buying Boeing’s Wisk Aero, Insitu, and SkyGrid. This signals rapid expansion through partnerships and acquisitions.
Separately, Archer’s Midnight eVTOL completed a piloted round trip between Salinas and Hollister airports. The flight covered roughly 40 miles in 12 minutes each way, backed by FAA-supported expansion plans.
Beyond that, Archer’s multi-city “No Roads” flight tour is expanding Midnight testing across varied routes. The company is preparing for eIPP flights, LA28, and eventual passenger services.
Even Motley Fool’s coverage framed shares below $6 as a risk-tolerant buy opportunity, while making clear the stock remains far from safe.
Therefore, the disconnect is notable. The operational and corporate news is genuinely positive. Yet price still trades below every meaningful moving average on both daily and hourly charts.
This divergence often means the market has not fully digested the news. Alternatively, broader sentiment may simply be overriding company-specific catalysts for now.
Bullish Scenario
For Archer Aviation stock to turn bullish, buyers must reclaim key technical levels. The first hurdle is the daily pivot at $5.60, followed by the EMA50 at $5.68.
A close back above the EMA20 near $5.79 would be a stronger signal. That would indicate short-term structure is repairing. RSI moving back above 50 on both daily and hourly charts would confirm momentum has actually shifted, rather than just stabilized.
In that scenario, the steady stream of positive news could start acting as genuine fundamental support. Deals involving Wisk Aero, Insitu, and SkyGrid, along with FAA-backed flight milestones, would then carry more weight.
Bearish Scenario
The bearish case for Archer Aviation stock remains straightforward. Failure to hold daily support at $5.40 opens the door toward the lower Bollinger band at $5.29.
A break below $5.29, especially on rising volume, would suggest the broader downtrend remains firmly in place. The EMA200 at $6.52 continues to define that trend from above.
Continued weakness on the hourly chart would further validate the bearish tone. A drop through the $5.47 support zone would confirm sellers are still setting the tone, despite the positive headlines.
Closing Take on Archer Aviation Stock
Archer Aviation stock is caught between an improving operational story and a technical picture that has not yet turned. Elevated volatility means sharp moves in either direction remain firmly on the table.
ATR readings across timeframes reflect this elevated volatility relative to the share price. Positioning here requires patience. The daily trend still leans cautious, and the hourly chart confirms that caution.
Only the 15-minute picture offers early, unconfirmed signs of oversold conditions. Until price reclaims key levels like the $5.60 pivot or $5.68 EMA50, uncertainty is likely to remain the dominant theme.
FAQ
Is Archer Aviation stock a buy at current levels?
The technical picture remains bearish across daily and hourly timeframes. With RSI at 44.87 on the daily chart and price below all key EMAs, the stock has not yet shown a confirmed reversal. Positive fundamentals — including the Wisk Aero acquisition and Midnight eVTOL milestones — offer long-term potential, but price action has not aligned with the news yet.
What are the key support levels for ACHR?
The immediate support for Archer Aviation stock sits at $5.40, the daily S1 pivot. Below that, the lower daily Bollinger band at $5.29 is the next level to watch. On the hourly chart, the $5.47–$5.48 cluster serves as the intraday floor. A break below these levels on rising volume would reinforce the bearish structure.
What would signal a bullish reversal for Archer Aviation stock?
A bullish reversal would require ACHR to reclaim the daily pivot at $5.60 first, then push above the EMA50 at $5.68. A close above the EMA20 near $5.79 would provide stronger confirmation. RSI moving back above 50 on both daily and hourly charts would confirm momentum has actually shifted.
Disclaimer: This article is for informational purposes only and does not constitute financial advice, an investment recommendation, or a solicitation to buy or sell any financial instrument or cryptocurrency. The analysis provided is not indicative of future results. Investing in crypto assets and financial markets carries a high risk of capital loss. Always do your own research (DYOR) and consult a qualified financial advisor before making any decision.
Article produced with the assistance of artificial intelligence and reviewed by the editorial team.
ACHR — daily chart with candlesticks, EMA20/EMA50 and volume.
Key takeaways
ACHR closed at $5.50, trading below all three daily EMAs (20, 50, 200).
Daily RSI14 reads 44.87 — neutral territory, not yet signaling exhaustion.
The MACD histogram at -0.08 confirms a bearish cross and fading momentum.
Positive fundamentals — including the Wisk Aero acquisition and Midnight eVTOL milestones — have yet to lift price action.
Daily support sits at $5.40; a break below opens the door to the lower Bollinger band at $5.29.
Archer Aviation Stock: Daily Trend Still Leans Bearish
The daily chart for Archer Aviation stock remains in a clear bearish structure. Price trades below all three key EMAs, with the 200-day sitting more than a dollar above spot.
The EMA20 sits at $5.79, the EMA50 at $5.68, and the EMA200 at $6.52. That stacking — price under every average — points to a stock still working through a longer-term downtrend. This is not a fresh breakout.
At the same time, RSI14 on the daily reads 44.87, neutral territory rather than oversold. The recent slide has not reached exhaustion. No strong technical signal suggests the downside is done.
Meanwhile, the daily MACD line reads 0.01 against a signal line of 0.10. The histogram sits at -0.08. That bearish cross confirms momentum is fading rather than building.
The Bollinger setup adds another layer. The mid-band sits at $6.04, the upper band at $6.79, and the lower band at $5.29. At $5.50, ACHR trades in the lower half of its volatility envelope, closer to the floor than the middle.
ATR14 of $0.28 shows daily ranges remain wide relative to the share price. Swings in either direction stay very plausible.
Pivot levels reinforce the cautious read. The daily pivot is $5.60, with resistance at $5.69 and support at $5.40. Price closing below the pivot keeps the near-term bias tilted to the downside unless buyers step in with conviction.
Hourly Chart Confirms the Weakness
Meanwhile, the hourly timeframe offers no relief for Archer Aviation stock. Price sits below all three EMAs, and the EMA50 and EMA200 have converged almost exactly. That convergence signals a stalled intraday trend rather than fresh strength.
The latest hourly candle closed at $5.50, with EMA20 at $5.67, EMA50 at $5.73, and EMA200 at $5.73. Notably, the EMA50 and EMA200 sitting at the same level reinforces the stalled-trend read.
RSI14 on the hourly has dropped to 33.91, approaching oversold conditions. MACD is negative too. The line at -0.04 against a signal of -0.01 produces a histogram of -0.03.
In short, the hourly chart is confirming, not contradicting, the daily bearish tilt. That alignment across timeframes strengthens the case that current pressure is more than daily noise.
The hourly Bollinger bands show the mid at $5.69, upper at $5.90, and lower at $5.49. Price remains essentially glued to the lower band. Pivot data puts the hourly pivot at $5.53 and S1 support at $5.47, meaning ACHR trades right on its intraday floor.
15-Minute Chart: Oversold, But Not Reversing Yet
Zooming in further, the 15-minute chart shows Archer Aviation stock in oversold territory. However, a confirmed reversal has not yet materialized. RSI14 has fallen to 31.46, while the MACD histogram has merely flattened rather than turning positive.
The system explicitly tags the 15-minute regime as bearish. The MACD histogram flattened to 0.00, even though both the MACD line and signal remain negative at -0.04. That flattening can hint at short-term seller fatigue. It is not yet a confirmed reversal signal.
Additionally, price hugs the lower Bollinger band, with the mid at $5.59, upper at $5.65, and lower at $5.52. The 15-minute pivot sits at $5.52, with support at $5.48. Both levels sit essentially where price currently trades.
Still, for traders watching intraday entries, the support cluster around $5.47–$5.48 is the level to monitor. Any short-term bounce attempt would need to start there.
A Real Conflict: Strong News, Weak Price Action
Archer Aviation stock presents a genuine conflict between fundamentals and price action. The operational news has been constructive, yet the technical picture remains decidedly weak.
On the fundamental side, Archer Aviation has been anything but quiet. The company is reportedly buying Boeing’s Wisk Aero, Insitu, and SkyGrid. This signals rapid expansion through partnerships and acquisitions.
Separately, Archer’s Midnight eVTOL completed a piloted round trip between Salinas and Hollister airports. The flight covered roughly 40 miles in 12 minutes each way, backed by FAA-supported expansion plans.
Beyond that, Archer’s multi-city “No Roads” flight tour is expanding Midnight testing across varied routes. The company is preparing for eIPP flights, LA28, and eventual passenger services.
Even Motley Fool’s coverage framed shares below $6 as a risk-tolerant buy opportunity, while making clear the stock remains far from safe.
Therefore, the disconnect is notable. The operational and corporate news is genuinely positive. Yet price still trades below every meaningful moving average on both daily and hourly charts.
This divergence often means the market has not fully digested the news. Alternatively, broader sentiment may simply be overriding company-specific catalysts for now.
Bullish Scenario
For Archer Aviation stock to turn bullish, buyers must reclaim key technical levels. The first hurdle is the daily pivot at $5.60, followed by the EMA50 at $5.68.
A close back above the EMA20 near $5.79 would be a stronger signal. That would indicate short-term structure is repairing. RSI moving back above 50 on both daily and hourly charts would confirm momentum has actually shifted, rather than just stabilized.
In that scenario, the steady stream of positive news could start acting as genuine fundamental support. Deals involving Wisk Aero, Insitu, and SkyGrid, along with FAA-backed flight milestones, would then carry more weight.
Bearish Scenario
The bearish case for Archer Aviation stock remains straightforward. Failure to hold daily support at $5.40 opens the door toward the lower Bollinger band at $5.29.
A break below $5.29, especially on rising volume, would suggest the broader downtrend remains firmly in place. The EMA200 at $6.52 continues to define that trend from above.
Continued weakness on the hourly chart would further validate the bearish tone. A drop through the $5.47 support zone would confirm sellers are still setting the tone, despite the positive headlines.
Closing Take on Archer Aviation Stock
Archer Aviation stock is caught between an improving operational story and a technical picture that has not yet turned. Elevated volatility means sharp moves in either direction remain firmly on the table.
ATR readings across timeframes reflect this elevated volatility relative to the share price. Positioning here requires patience. The daily trend still leans cautious, and the hourly chart confirms that caution.
Only the 15-minute picture offers early, unconfirmed signs of oversold conditions. Until price reclaims key levels like the $5.60 pivot or $5.68 EMA50, uncertainty is likely to remain the dominant theme.
FAQ
Is Archer Aviation stock a buy at current levels?
The technical picture remains bearish across daily and hourly timeframes. With RSI at 44.87 on the daily chart and price below all key EMAs, the stock has not yet shown a confirmed reversal. Positive fundamentals — including the Wisk Aero acquisition and Midnight eVTOL milestones — offer long-term potential, but price action has not aligned with the news yet.
What are the key support levels for ACHR?
The immediate support for Archer Aviation stock sits at $5.40, the daily S1 pivot. Below that, the lower daily Bollinger band at $5.29 is the next level to watch. On the hourly chart, the $5.47–$5.48 cluster serves as the intraday floor. A break below these levels on rising volume would reinforce the bearish structure.
What would signal a bullish reversal for Archer Aviation stock?
A bullish reversal would require ACHR to reclaim the daily pivot at $5.60 first, then push above the EMA50 at $5.68. A close above the EMA20 near $5.79 would provide stronger confirmation. RSI moving back above 50 on both daily and hourly charts would confirm momentum has actually shifted.
Disclaimer: This article is for informational purposes only and does not constitute financial advice, an investment recommendation, or a solicitation to buy or sell any financial instrument or cryptocurrency. The analysis provided is not indicative of future results. Investing in crypto assets and financial markets carries a high risk of capital loss. Always do your own research (DYOR) and consult a qualified financial advisor before making any decision.
Article produced with the assistance of artificial intelligence and reviewed by the editorial team.
3

Article
Pinterest stock sinks to $18.28 as CFO exit fuels a 7-day selloffPinterest stock closed at $18.28, marking its seventh consecutive down session. The sharp technical breakdown accelerated after a CFO resignation rattled sentiment. With price now trading below all major moving averages, oversold extremes are colliding with a deepening confidence crisis.
PINS — daily chart with candlesticks, EMA20/EMA50 and volume.
Key takeaways
Pinterest stock closed at $18.28, marking its seventh consecutive down session.
RSI14 on the daily chart sits at 23.15, deep in oversold territory.
Price is trading below the lower Bollinger band, signaling a volatility expansion event.
The CFO resignation has intensified the selloff, compounding technical weakness.
Hourly RSI14 at 13.65 and a narrowing MACD histogram suggest a short-term bounce could emerge.
Daily Chart: Pinterest Stock Confirms a Bearish Regime
The daily chart confirms Pinterest stock is in a fully bearish regime. Price trades below the EMA20 at 21.84, the EMA50 at 22.23, and the EMA200 at 23.40. No short-term average is acting as support.
Momentum Indicators Flash Extreme Readings
RSI14 on the daily sits at 23.15, deep into oversold territory. Momentum has been pushed hard to the downside across multiple sessions. Meanwhile, the MACD line at -0.89 sits well below its signal line at -0.41, with a histogram of -0.48. That gap is widening rather than narrowing, confirming downside momentum is still accelerating.
Volatility Expansion Signals Capitulation Risk
The Bollinger setup adds another layer to the bearish case. The mid-band sits at 22.34 and the lower band at 19.39. The closing price of 18.28 trades below the lower band entirely. This is a volatility expansion event, not a routine pullback. It typically signals either a capitulation low forming or forced selling continuing. ATR14 at 0.85 confirms daily ranges have widened meaningfully. Whichever direction comes next will likely arrive with force.
Pivot levels reinforce the pressure. The daily pivot sits at 18.92, well above the current close, while S1 is at 17.64. Price trading below its own pivot keeps sellers in the driver’s seat. The next real technical test is that 17.64 zone.
Hourly Timeframe: Confirmation With a Twist
The 1H chart confirms the bearish daily bias in trend structure. However, the momentum picture introduces meaningful complications. EMA20 at 19.65, EMA50 at 20.62, and EMA200 at 22.24 all stack above price. The hourly regime is also flagged bearish. Yet RSI14 on the hourly has dropped to 13.65, an extreme reading that goes beyond simple oversold and flags exhaustion risk.
At the same time, the MACD histogram on the hourly sits at -0.14, notably narrower than the -0.48 seen on the daily. That divergence matters. Intraday selling pressure is decelerating, even as the broader daily trend remains firmly negative. This is the core conflict in Pinterest stock right now. The daily trend is bearish and still gaining momentum. However, the hourly timeframe shows signs of a stretched move that could produce a short-term bounce. The hourly pivot at 18.39 frames a tight battleground just below current price, with S1 at 18.18 and R1 at 18.49.
15-Minute Execution Context
On the 15-minute chart, Pinterest stock shows tentative stabilization, though the broader bearish structure remains intact. RSI14 reads 20.9, still oversold but off the hourly extreme. Notably, the MACD histogram has flipped to a marginally positive 0.01, up from negative territory. It is a small but real signal that downside pressure is pausing at this granular level.
Still, the EMA stack on the 15-minute chart remains fully bearish. EMA20 at 18.84, EMA50 at 19.39, and EMA200 at 20.74 all sit above price. Any short-term bounce here would need to be read as corrective activity inside a larger downtrend, not a reversal signal. The 15-minute pivot at 18.37, with S1 at 18.20, marks the immediate zone traders are watching for signs of a floor.
News Flow: A Confidence Problem, Not Just a Chart Problem
Pinterest stock’s selloff is being driven by a confidence crisis, not just technical factors. Reports confirm shares have tumbled for seven consecutive sessions, sinking further after news of a CFO resignation. That kind of leadership exit tends to hit sentiment hard, independent of underlying fundamentals. It helps explain why the selling has been so persistent.
However, not every recent narrative around Pinterest stock is negative. One analysis argues that underlying growth remains stronger than the market currently credits. It points to temporary factors distorting Q3 guidance perception, while still rating the stock a Hold. Separately, Pinterest management presented at the Goldman Sachs Communacopia + Technology Conference 2026. This keeps the company visible to institutional audiences even as the stock struggles technically.
Bullish Scenario
For a bullish case to develop, Pinterest stock would first need to stabilize above daily S1 at 17.64. Reclaiming the daily pivot at 18.92 would be an early sign that sellers are losing control. Beyond that, a meaningful recovery would require RSI to climb out of oversold territory across both daily and hourly timeframes. The daily MACD histogram would need to stop widening and begin to contract. Reclaiming the EMA20 near 21.84 on the daily would offer the first real confirmation. It would signal the broader downtrend is losing conviction, not just pausing.
Bearish Scenario
The bearish scenario, in contrast, simply requires continuation of what is already in motion. A daily close below S1 at 17.64 would confirm the breakdown is extending. It would show the move below the lower Bollinger band is being extended rather than rejected. The daily MACD histogram is still widening and the EMA stack remains bearish across all three timeframes. Further downside follow-through would not be surprising. The only caveat: hourly momentum divergence would eventually need to translate into an actual daily-level bounce to shift the narrative.
Closing Take
Overall, Pinterest stock is caught between a clearly bearish daily trend and stretched, potentially exhausted momentum on shorter timeframes. The daily chart says sellers remain in control, with price below every major EMA and outside the lower Bollinger band. Meanwhile, the hourly and 15-minute charts hint that selling pace may be slowing. With ATR elevated and headline risk still fresh, volatility is likely to stay high in either direction. Caution around conviction-heavy positioning seems warranted until price action clarifies which timeframe is telling the more accurate story.
FAQ
Why is Pinterest stock falling?
Pinterest stock has fallen for seven consecutive sessions, with the selloff intensifying after a CFO resignation announcement. Technically, price is trading below all major EMAs and outside the lower Bollinger band, confirming a fully bearish regime.
Is Pinterest stock oversold?
Yes. The daily RSI14 sits at 23.15 and the hourly RSI14 has dropped to 13.65, both deep in oversold territory. However, oversold conditions can persist during strong downtrends and do not guarantee an immediate reversal.
What are the key support levels for Pinterest stock?
The immediate support is daily S1 at 17.64. Below that, the next technical test would be S2 levels. On the upside, the daily pivot at 18.92 and the EMA20 at 21.84 serve as resistance markers.
Could Pinterest stock bounce from here?
The hourly timeframe shows some exhaustion signals. The MACD histogram is narrowing and RSI is at extreme levels. A short-term bounce is possible, but it would likely be corrective within the larger bearish trend unless price reclaims key moving averages.
Disclaimer: This article is for informational purposes only and does not constitute financial advice, an investment recommendation, or a solicitation to buy or sell any financial instrument or cryptocurrency. The analysis provided is not indicative of future results. Investing in crypto assets and financial markets carries a high risk of capital loss. Always do your own research (DYOR) and consult a qualified financial advisor before making any decision.
Article produced with the assistance of artificial intelligence and reviewed by the editorial team.
Pinterest stock sinks to $18.28 as CFO exit fuels a 7-day selloff
Pinterest stock closed at $18.28, marking its seventh consecutive down session. The sharp technical breakdown accelerated after a CFO resignation rattled sentiment. With price now trading below all major moving averages, oversold extremes are colliding with a deepening confidence crisis.
PINS — daily chart with candlesticks, EMA20/EMA50 and volume.
Key takeaways
Pinterest stock closed at $18.28, marking its seventh consecutive down session.
RSI14 on the daily chart sits at 23.15, deep in oversold territory.
Price is trading below the lower Bollinger band, signaling a volatility expansion event.
The CFO resignation has intensified the selloff, compounding technical weakness.
Hourly RSI14 at 13.65 and a narrowing MACD histogram suggest a short-term bounce could emerge.
Daily Chart: Pinterest Stock Confirms a Bearish Regime
The daily chart confirms Pinterest stock is in a fully bearish regime. Price trades below the EMA20 at 21.84, the EMA50 at 22.23, and the EMA200 at 23.40. No short-term average is acting as support.
Momentum Indicators Flash Extreme Readings
RSI14 on the daily sits at 23.15, deep into oversold territory. Momentum has been pushed hard to the downside across multiple sessions. Meanwhile, the MACD line at -0.89 sits well below its signal line at -0.41, with a histogram of -0.48. That gap is widening rather than narrowing, confirming downside momentum is still accelerating.
Volatility Expansion Signals Capitulation Risk
The Bollinger setup adds another layer to the bearish case. The mid-band sits at 22.34 and the lower band at 19.39. The closing price of 18.28 trades below the lower band entirely. This is a volatility expansion event, not a routine pullback. It typically signals either a capitulation low forming or forced selling continuing. ATR14 at 0.85 confirms daily ranges have widened meaningfully. Whichever direction comes next will likely arrive with force.
Pivot levels reinforce the pressure. The daily pivot sits at 18.92, well above the current close, while S1 is at 17.64. Price trading below its own pivot keeps sellers in the driver’s seat. The next real technical test is that 17.64 zone.
Hourly Timeframe: Confirmation With a Twist
The 1H chart confirms the bearish daily bias in trend structure. However, the momentum picture introduces meaningful complications. EMA20 at 19.65, EMA50 at 20.62, and EMA200 at 22.24 all stack above price. The hourly regime is also flagged bearish. Yet RSI14 on the hourly has dropped to 13.65, an extreme reading that goes beyond simple oversold and flags exhaustion risk.
At the same time, the MACD histogram on the hourly sits at -0.14, notably narrower than the -0.48 seen on the daily. That divergence matters. Intraday selling pressure is decelerating, even as the broader daily trend remains firmly negative. This is the core conflict in Pinterest stock right now. The daily trend is bearish and still gaining momentum. However, the hourly timeframe shows signs of a stretched move that could produce a short-term bounce. The hourly pivot at 18.39 frames a tight battleground just below current price, with S1 at 18.18 and R1 at 18.49.
15-Minute Execution Context
On the 15-minute chart, Pinterest stock shows tentative stabilization, though the broader bearish structure remains intact. RSI14 reads 20.9, still oversold but off the hourly extreme. Notably, the MACD histogram has flipped to a marginally positive 0.01, up from negative territory. It is a small but real signal that downside pressure is pausing at this granular level.
Still, the EMA stack on the 15-minute chart remains fully bearish. EMA20 at 18.84, EMA50 at 19.39, and EMA200 at 20.74 all sit above price. Any short-term bounce here would need to be read as corrective activity inside a larger downtrend, not a reversal signal. The 15-minute pivot at 18.37, with S1 at 18.20, marks the immediate zone traders are watching for signs of a floor.
News Flow: A Confidence Problem, Not Just a Chart Problem
Pinterest stock’s selloff is being driven by a confidence crisis, not just technical factors. Reports confirm shares have tumbled for seven consecutive sessions, sinking further after news of a CFO resignation. That kind of leadership exit tends to hit sentiment hard, independent of underlying fundamentals. It helps explain why the selling has been so persistent.
However, not every recent narrative around Pinterest stock is negative. One analysis argues that underlying growth remains stronger than the market currently credits. It points to temporary factors distorting Q3 guidance perception, while still rating the stock a Hold. Separately, Pinterest management presented at the Goldman Sachs Communacopia + Technology Conference 2026. This keeps the company visible to institutional audiences even as the stock struggles technically.
Bullish Scenario
For a bullish case to develop, Pinterest stock would first need to stabilize above daily S1 at 17.64. Reclaiming the daily pivot at 18.92 would be an early sign that sellers are losing control. Beyond that, a meaningful recovery would require RSI to climb out of oversold territory across both daily and hourly timeframes. The daily MACD histogram would need to stop widening and begin to contract. Reclaiming the EMA20 near 21.84 on the daily would offer the first real confirmation. It would signal the broader downtrend is losing conviction, not just pausing.
Bearish Scenario
The bearish scenario, in contrast, simply requires continuation of what is already in motion. A daily close below S1 at 17.64 would confirm the breakdown is extending. It would show the move below the lower Bollinger band is being extended rather than rejected. The daily MACD histogram is still widening and the EMA stack remains bearish across all three timeframes. Further downside follow-through would not be surprising. The only caveat: hourly momentum divergence would eventually need to translate into an actual daily-level bounce to shift the narrative.
Closing Take
Overall, Pinterest stock is caught between a clearly bearish daily trend and stretched, potentially exhausted momentum on shorter timeframes. The daily chart says sellers remain in control, with price below every major EMA and outside the lower Bollinger band. Meanwhile, the hourly and 15-minute charts hint that selling pace may be slowing. With ATR elevated and headline risk still fresh, volatility is likely to stay high in either direction. Caution around conviction-heavy positioning seems warranted until price action clarifies which timeframe is telling the more accurate story.
FAQ
Why is Pinterest stock falling?
Pinterest stock has fallen for seven consecutive sessions, with the selloff intensifying after a CFO resignation announcement. Technically, price is trading below all major EMAs and outside the lower Bollinger band, confirming a fully bearish regime.
Is Pinterest stock oversold?
Yes. The daily RSI14 sits at 23.15 and the hourly RSI14 has dropped to 13.65, both deep in oversold territory. However, oversold conditions can persist during strong downtrends and do not guarantee an immediate reversal.
What are the key support levels for Pinterest stock?
The immediate support is daily S1 at 17.64. Below that, the next technical test would be S2 levels. On the upside, the daily pivot at 18.92 and the EMA20 at 21.84 serve as resistance markers.
Could Pinterest stock bounce from here?
The hourly timeframe shows some exhaustion signals. The MACD histogram is narrowing and RSI is at extreme levels. A short-term bounce is possible, but it would likely be corrective within the larger bearish trend unless price reclaims key moving averages.
Disclaimer: This article is for informational purposes only and does not constitute financial advice, an investment recommendation, or a solicitation to buy or sell any financial instrument or cryptocurrency. The analysis provided is not indicative of future results. Investing in crypto assets and financial markets carries a high risk of capital loss. Always do your own research (DYOR) and consult a qualified financial advisor before making any decision.
Article produced with the assistance of artificial intelligence and reviewed by the editorial team.
PINS — daily chart with candlesticks, EMA20/EMA50 and volume.
Key takeaways
Pinterest stock closed at $18.28, marking its seventh consecutive down session.
RSI14 on the daily chart sits at 23.15, deep in oversold territory.
Price is trading below the lower Bollinger band, signaling a volatility expansion event.
The CFO resignation has intensified the selloff, compounding technical weakness.
Hourly RSI14 at 13.65 and a narrowing MACD histogram suggest a short-term bounce could emerge.
Daily Chart: Pinterest Stock Confirms a Bearish Regime
The daily chart confirms Pinterest stock is in a fully bearish regime. Price trades below the EMA20 at 21.84, the EMA50 at 22.23, and the EMA200 at 23.40. No short-term average is acting as support.
Momentum Indicators Flash Extreme Readings
RSI14 on the daily sits at 23.15, deep into oversold territory. Momentum has been pushed hard to the downside across multiple sessions. Meanwhile, the MACD line at -0.89 sits well below its signal line at -0.41, with a histogram of -0.48. That gap is widening rather than narrowing, confirming downside momentum is still accelerating.
Volatility Expansion Signals Capitulation Risk
The Bollinger setup adds another layer to the bearish case. The mid-band sits at 22.34 and the lower band at 19.39. The closing price of 18.28 trades below the lower band entirely. This is a volatility expansion event, not a routine pullback. It typically signals either a capitulation low forming or forced selling continuing. ATR14 at 0.85 confirms daily ranges have widened meaningfully. Whichever direction comes next will likely arrive with force.
Pivot levels reinforce the pressure. The daily pivot sits at 18.92, well above the current close, while S1 is at 17.64. Price trading below its own pivot keeps sellers in the driver’s seat. The next real technical test is that 17.64 zone.
Hourly Timeframe: Confirmation With a Twist
The 1H chart confirms the bearish daily bias in trend structure. However, the momentum picture introduces meaningful complications. EMA20 at 19.65, EMA50 at 20.62, and EMA200 at 22.24 all stack above price. The hourly regime is also flagged bearish. Yet RSI14 on the hourly has dropped to 13.65, an extreme reading that goes beyond simple oversold and flags exhaustion risk.
At the same time, the MACD histogram on the hourly sits at -0.14, notably narrower than the -0.48 seen on the daily. That divergence matters. Intraday selling pressure is decelerating, even as the broader daily trend remains firmly negative. This is the core conflict in Pinterest stock right now. The daily trend is bearish and still gaining momentum. However, the hourly timeframe shows signs of a stretched move that could produce a short-term bounce. The hourly pivot at 18.39 frames a tight battleground just below current price, with S1 at 18.18 and R1 at 18.49.
15-Minute Execution Context
On the 15-minute chart, Pinterest stock shows tentative stabilization, though the broader bearish structure remains intact. RSI14 reads 20.9, still oversold but off the hourly extreme. Notably, the MACD histogram has flipped to a marginally positive 0.01, up from negative territory. It is a small but real signal that downside pressure is pausing at this granular level.
Still, the EMA stack on the 15-minute chart remains fully bearish. EMA20 at 18.84, EMA50 at 19.39, and EMA200 at 20.74 all sit above price. Any short-term bounce here would need to be read as corrective activity inside a larger downtrend, not a reversal signal. The 15-minute pivot at 18.37, with S1 at 18.20, marks the immediate zone traders are watching for signs of a floor.
News Flow: A Confidence Problem, Not Just a Chart Problem
Pinterest stock’s selloff is being driven by a confidence crisis, not just technical factors. Reports confirm shares have tumbled for seven consecutive sessions, sinking further after news of a CFO resignation. That kind of leadership exit tends to hit sentiment hard, independent of underlying fundamentals. It helps explain why the selling has been so persistent.
However, not every recent narrative around Pinterest stock is negative. One analysis argues that underlying growth remains stronger than the market currently credits. It points to temporary factors distorting Q3 guidance perception, while still rating the stock a Hold. Separately, Pinterest management presented at the Goldman Sachs Communacopia + Technology Conference 2026. This keeps the company visible to institutional audiences even as the stock struggles technically.
Bullish Scenario
For a bullish case to develop, Pinterest stock would first need to stabilize above daily S1 at 17.64. Reclaiming the daily pivot at 18.92 would be an early sign that sellers are losing control. Beyond that, a meaningful recovery would require RSI to climb out of oversold territory across both daily and hourly timeframes. The daily MACD histogram would need to stop widening and begin to contract. Reclaiming the EMA20 near 21.84 on the daily would offer the first real confirmation. It would signal the broader downtrend is losing conviction, not just pausing.
Bearish Scenario
The bearish scenario, in contrast, simply requires continuation of what is already in motion. A daily close below S1 at 17.64 would confirm the breakdown is extending. It would show the move below the lower Bollinger band is being extended rather than rejected. The daily MACD histogram is still widening and the EMA stack remains bearish across all three timeframes. Further downside follow-through would not be surprising. The only caveat: hourly momentum divergence would eventually need to translate into an actual daily-level bounce to shift the narrative.
Closing Take
Overall, Pinterest stock is caught between a clearly bearish daily trend and stretched, potentially exhausted momentum on shorter timeframes. The daily chart says sellers remain in control, with price below every major EMA and outside the lower Bollinger band. Meanwhile, the hourly and 15-minute charts hint that selling pace may be slowing. With ATR elevated and headline risk still fresh, volatility is likely to stay high in either direction. Caution around conviction-heavy positioning seems warranted until price action clarifies which timeframe is telling the more accurate story.
FAQ
Why is Pinterest stock falling?
Pinterest stock has fallen for seven consecutive sessions, with the selloff intensifying after a CFO resignation announcement. Technically, price is trading below all major EMAs and outside the lower Bollinger band, confirming a fully bearish regime.
Is Pinterest stock oversold?
Yes. The daily RSI14 sits at 23.15 and the hourly RSI14 has dropped to 13.65, both deep in oversold territory. However, oversold conditions can persist during strong downtrends and do not guarantee an immediate reversal.
What are the key support levels for Pinterest stock?
The immediate support is daily S1 at 17.64. Below that, the next technical test would be S2 levels. On the upside, the daily pivot at 18.92 and the EMA20 at 21.84 serve as resistance markers.
Could Pinterest stock bounce from here?
The hourly timeframe shows some exhaustion signals. The MACD histogram is narrowing and RSI is at extreme levels. A short-term bounce is possible, but it would likely be corrective within the larger bearish trend unless price reclaims key moving averages.
Disclaimer: This article is for informational purposes only and does not constitute financial advice, an investment recommendation, or a solicitation to buy or sell any financial instrument or cryptocurrency. The analysis provided is not indicative of future results. Investing in crypto assets and financial markets carries a high risk of capital loss. Always do your own research (DYOR) and consult a qualified financial advisor before making any decision.
Article produced with the assistance of artificial intelligence and reviewed by the editorial team.
PINSUS+1.97%
5

Article
Kalshi’s gold silver futures could trade 24/7, challenging CME’s gripKalshi is pushing into precious metals. The prediction-market platform, known for its rapid rollout of crypto-linked derivatives, has asked federal regulators to let it list perpetual futures contracts tied to gold and silver — a move that would bring the Kalshi gold and silver futures products into a market long dominated by traditional exchanges like CME Group. The filings, submitted on September 9 to the Commodity Futures Trading Commission, mark the company’s first step outside cryptocurrency since it began building out its no-expiry contract lineup earlier this year.
Key takeaways
Kalshi filed with the CFTC on September 9 to launch GOLDPERP and SILVERPERP, perpetual futures tracking gold and silver spot prices.
Both contracts are cash settled with no physical delivery and carry no expiration date, using a funding rate to stay aligned with spot markets.
Pyth Network will act as the designated price oracle for both products.
Kalshi wants the contracts to trade 24/7, including weekends and holidays — an expansion from an earlier 24/5 proposal.
The filing cites persistent silver supply shortfalls dating back to 2021 and expected to continue into early 2026.
Kalshi Files for Gold and Silver Perpetual Futures with CFTC
Kalshi’s latest regulatory push seeks authorization for two dollar-settled instruments that would give traders exposure to gold and silver prices without ever touching the metal itself. The company submitted its applications through CFTC Regulation 40.2(a), a self-certification pathway that lets a registered exchange launch a new product by attesting it complies with the Commodity Exchange Act, rather than waiting for a formal commission vote on each contract.
Product Names and Regulatory Process
The two proposed instruments are named GOLDPERP and SILVERPERP. Because Kalshi is using self-certification rather than a formal approval proceeding, the contracts can move toward listing without the commission casting an affirmative vote on each one — a faster route than the process Kalshi used earlier this year for its Bitcoin perpetual.
Contract Structure and Settlement
GOLDPERP is built to mirror the U.S. dollar spot price of one troy ounce of gold, while SILVERPERP does the same for silver. Neither contract involves physical delivery. Both settle entirely in cash, meaning traders never receive bars, coins, or any other physical form of the metal, and contract holders cannot demand delivery from Kalshi when they close a position.
What sets these products apart from standard futures is their perpetual structure. Instead of expiring on a fixed date, GOLDPERP and SILVERPERP stay open indefinitely. A funding rate mechanism keeps the contract price tethered to the underlying spot market — traders holding long positions may pay those holding short positions, or vice versa, depending on how the contract trades relative to its benchmark. That design removes the need for the periodic “rolling” that traditional futures traders go through when moving a position from an expiring contract into the next one. Kalshi has said this structure could lower rollover costs for market participants such as bullion dealers, metal refiners, financial institutions, and companies with sustained gold or silver exposure.
Innovative Trading Schedule and Price Oracle Integration
Kalshi wants these contracts trading nonstop, and it wants an independent data source setting the price. Together, those two design choices would make GOLDPERP and SILVERPERP function differently from anything currently available on regulated U.S. metals markets.
Continuous 24/7 Trading Availability
Under the filed specifications, both contracts would operate around the clock, seven days a week, including weekends and recognized holidays. That’s a notable jump from what Kalshi floated back in July, when early discussions pointed toward a more limited 24/5 trading window. For U.S.-based traders, round-the-clock access would mean the ability to react to precious metals price moves even when conventional futures exchanges are shut — though liquidity and pricing outside standard market hours could behave differently than during regular sessions.
Use of Pyth Network as Price Oracle
Pyth Network has been named as the designated price oracle for both GOLDPERP and SILVERPERP. Pyth aggregates pricing data from a range of sources, including market makers, trading venues, and financial institutions, and that consolidated feed will determine the reference price used to settle and fund the contracts. Anchoring the products to an established oracle network is meant to give the perpetual contracts a transparent, continuously updated benchmark rather than relying on a single exchange’s closing price.
Market Context and Strategic Expansion
The timing of the filing isn’t incidental. Kalshi is leaning into a silver market that has been under sustained pressure, while simultaneously building on momentum from its crypto perpetuals business.
Silver Market Supply Shortfalls
Kalshi’s filing points directly to physical market conditions to justify SILVERPERP’s design. The company notes that silver markets have experienced persistent annual supply shortfalls since 2021, with that tightness expected to extend through early 2026. Because SILVERPERP settles in cash and can’t be converted into physical metal, Kalshi argues the contract wouldn’t add delivery pressure to an already strained underlying market — traders get price exposure, but the physical supply-demand balance stays untouched.
Kalshi’s Growth in Perpetual Futures
The gold and silver filings arrive on the heels of an aggressive build-out in crypto perpetuals. Kalshi secured CFTC approval for its Bitcoin perpetual contract, BTCPERP, in May — the first U.S.-regulated product of its kind — following a formal review rather than self-certification. From there, the platform added 17 more cryptocurrency perpetuals covering assets including Ether, XRP, Solana, and Hyperliquid. On September 4, five additional contracts went live tracking BNB, Cardano, Worldcoin, Aave, and Venice Token.
By June, Kalshi’s perpetual futures business had already crossed $8.5 billion in cumulative trading volume, a figure that underscores how quickly the exchange has scaled a product category that barely existed on regulated U.S. platforms a year earlier. That growth hasn’t gone unchallenged, though. CME Group sued the CFTC in June, arguing that Kalshi’s Bitcoin perpetual should be classified as a swap rather than a futures contract — a distinction that would place it under a different regulatory framework and, CME claims, has put established futures exchanges at a competitive disadvantage. The CFTC has since moved to dismiss the case, arguing CME hasn’t shown concrete harm and pointing to CME’s own Bitcoin and Ether futures volumes as evidence the competitive impact is overstated. A federal court has not yet ruled on the dismissal motion or settled the broader question of how crypto perpetuals should be classified.
That unresolved legal fight matters well beyond Bitcoin. If the case eventually determines that perpetual futures belong in the swap category rather than the futures category, it could reshape how Kalshi’s entire perpetuals lineup — including any future gold and silver products — gets regulated and who’s allowed to compete in offering them. For now, Kalshi is moving ahead regardless, treating precious metals as the next frontier for a trading structure it has already proven can draw significant volume in crypto markets.
Kalshi has been careful to frame GOLDPERP and SILVERPERP as distinct from the event-based, short-duration contracts on gold and silver it already lists. Where those existing products resolve on set dates tied to specific market outcomes, the new perpetual contracts are built for traders who want continuous, rollover-free exposure to metals prices — a structural shift that, if approved, would give U.S. investors a regulated alternative to holding physical bullion or metal-backed ETF shares.
FAQ
What new products has Kalshi filed with the CFTC?
Kalshi has filed to offer perpetual futures contracts for gold and silver, named GOLDPERP and SILVERPERP.
How are the GOLDPERP and SILVERPERP contracts settled?
Both contracts are cash settled with no physical delivery of gold or silver.
What is unique about the contract duration for GOLDPERP and SILVERPERP?
These contracts have a perpetual structure without expiration, maintained by a funding rate mechanism aligning prices with spot markets.
When can investors trade these perpetual futures?
Kalshi proposes continuous 24/7 trading for these contracts, including weekends and holidays.
Article produced with the assistance of artificial intelligence and reviewed by the editorial team.
Kalshi’s gold silver futures could trade 24/7, challenging CME’s grip
Kalshi is pushing into precious metals. The prediction-market platform, known for its rapid rollout of crypto-linked derivatives, has asked federal regulators to let it list perpetual futures contracts tied to gold and silver — a move that would bring the Kalshi gold and silver futures products into a market long dominated by traditional exchanges like CME Group. The filings, submitted on September 9 to the Commodity Futures Trading Commission, mark the company’s first step outside cryptocurrency since it began building out its no-expiry contract lineup earlier this year.
Key takeaways
Kalshi filed with the CFTC on September 9 to launch GOLDPERP and SILVERPERP, perpetual futures tracking gold and silver spot prices.
Both contracts are cash settled with no physical delivery and carry no expiration date, using a funding rate to stay aligned with spot markets.
Pyth Network will act as the designated price oracle for both products.
Kalshi wants the contracts to trade 24/7, including weekends and holidays — an expansion from an earlier 24/5 proposal.
The filing cites persistent silver supply shortfalls dating back to 2021 and expected to continue into early 2026.
Kalshi Files for Gold and Silver Perpetual Futures with CFTC
Kalshi’s latest regulatory push seeks authorization for two dollar-settled instruments that would give traders exposure to gold and silver prices without ever touching the metal itself. The company submitted its applications through CFTC Regulation 40.2(a), a self-certification pathway that lets a registered exchange launch a new product by attesting it complies with the Commodity Exchange Act, rather than waiting for a formal commission vote on each contract.
Product Names and Regulatory Process
The two proposed instruments are named GOLDPERP and SILVERPERP. Because Kalshi is using self-certification rather than a formal approval proceeding, the contracts can move toward listing without the commission casting an affirmative vote on each one — a faster route than the process Kalshi used earlier this year for its Bitcoin perpetual.
Contract Structure and Settlement
GOLDPERP is built to mirror the U.S. dollar spot price of one troy ounce of gold, while SILVERPERP does the same for silver. Neither contract involves physical delivery. Both settle entirely in cash, meaning traders never receive bars, coins, or any other physical form of the metal, and contract holders cannot demand delivery from Kalshi when they close a position.
What sets these products apart from standard futures is their perpetual structure. Instead of expiring on a fixed date, GOLDPERP and SILVERPERP stay open indefinitely. A funding rate mechanism keeps the contract price tethered to the underlying spot market — traders holding long positions may pay those holding short positions, or vice versa, depending on how the contract trades relative to its benchmark. That design removes the need for the periodic “rolling” that traditional futures traders go through when moving a position from an expiring contract into the next one. Kalshi has said this structure could lower rollover costs for market participants such as bullion dealers, metal refiners, financial institutions, and companies with sustained gold or silver exposure.
Innovative Trading Schedule and Price Oracle Integration
Kalshi wants these contracts trading nonstop, and it wants an independent data source setting the price. Together, those two design choices would make GOLDPERP and SILVERPERP function differently from anything currently available on regulated U.S. metals markets.
Continuous 24/7 Trading Availability
Under the filed specifications, both contracts would operate around the clock, seven days a week, including weekends and recognized holidays. That’s a notable jump from what Kalshi floated back in July, when early discussions pointed toward a more limited 24/5 trading window. For U.S.-based traders, round-the-clock access would mean the ability to react to precious metals price moves even when conventional futures exchanges are shut — though liquidity and pricing outside standard market hours could behave differently than during regular sessions.
Use of Pyth Network as Price Oracle
Pyth Network has been named as the designated price oracle for both GOLDPERP and SILVERPERP. Pyth aggregates pricing data from a range of sources, including market makers, trading venues, and financial institutions, and that consolidated feed will determine the reference price used to settle and fund the contracts. Anchoring the products to an established oracle network is meant to give the perpetual contracts a transparent, continuously updated benchmark rather than relying on a single exchange’s closing price.
Market Context and Strategic Expansion
The timing of the filing isn’t incidental. Kalshi is leaning into a silver market that has been under sustained pressure, while simultaneously building on momentum from its crypto perpetuals business.
Silver Market Supply Shortfalls
Kalshi’s filing points directly to physical market conditions to justify SILVERPERP’s design. The company notes that silver markets have experienced persistent annual supply shortfalls since 2021, with that tightness expected to extend through early 2026. Because SILVERPERP settles in cash and can’t be converted into physical metal, Kalshi argues the contract wouldn’t add delivery pressure to an already strained underlying market — traders get price exposure, but the physical supply-demand balance stays untouched.
Kalshi’s Growth in Perpetual Futures
The gold and silver filings arrive on the heels of an aggressive build-out in crypto perpetuals. Kalshi secured CFTC approval for its Bitcoin perpetual contract, BTCPERP, in May — the first U.S.-regulated product of its kind — following a formal review rather than self-certification. From there, the platform added 17 more cryptocurrency perpetuals covering assets including Ether, XRP, Solana, and Hyperliquid. On September 4, five additional contracts went live tracking BNB, Cardano, Worldcoin, Aave, and Venice Token.
By June, Kalshi’s perpetual futures business had already crossed $8.5 billion in cumulative trading volume, a figure that underscores how quickly the exchange has scaled a product category that barely existed on regulated U.S. platforms a year earlier. That growth hasn’t gone unchallenged, though. CME Group sued the CFTC in June, arguing that Kalshi’s Bitcoin perpetual should be classified as a swap rather than a futures contract — a distinction that would place it under a different regulatory framework and, CME claims, has put established futures exchanges at a competitive disadvantage. The CFTC has since moved to dismiss the case, arguing CME hasn’t shown concrete harm and pointing to CME’s own Bitcoin and Ether futures volumes as evidence the competitive impact is overstated. A federal court has not yet ruled on the dismissal motion or settled the broader question of how crypto perpetuals should be classified.
That unresolved legal fight matters well beyond Bitcoin. If the case eventually determines that perpetual futures belong in the swap category rather than the futures category, it could reshape how Kalshi’s entire perpetuals lineup — including any future gold and silver products — gets regulated and who’s allowed to compete in offering them. For now, Kalshi is moving ahead regardless, treating precious metals as the next frontier for a trading structure it has already proven can draw significant volume in crypto markets.
Kalshi has been careful to frame GOLDPERP and SILVERPERP as distinct from the event-based, short-duration contracts on gold and silver it already lists. Where those existing products resolve on set dates tied to specific market outcomes, the new perpetual contracts are built for traders who want continuous, rollover-free exposure to metals prices — a structural shift that, if approved, would give U.S. investors a regulated alternative to holding physical bullion or metal-backed ETF shares.
FAQ
What new products has Kalshi filed with the CFTC?
Kalshi has filed to offer perpetual futures contracts for gold and silver, named GOLDPERP and SILVERPERP.
How are the GOLDPERP and SILVERPERP contracts settled?
Both contracts are cash settled with no physical delivery of gold or silver.
What is unique about the contract duration for GOLDPERP and SILVERPERP?
These contracts have a perpetual structure without expiration, maintained by a funding rate mechanism aligning prices with spot markets.
When can investors trade these perpetual futures?
Kalshi proposes continuous 24/7 trading for these contracts, including weekends and holidays.
Article produced with the assistance of artificial intelligence and reviewed by the editorial team.
Key takeaways
Kalshi filed with the CFTC on September 9 to launch GOLDPERP and SILVERPERP, perpetual futures tracking gold and silver spot prices.
Both contracts are cash settled with no physical delivery and carry no expiration date, using a funding rate to stay aligned with spot markets.
Pyth Network will act as the designated price oracle for both products.
Kalshi wants the contracts to trade 24/7, including weekends and holidays — an expansion from an earlier 24/5 proposal.
The filing cites persistent silver supply shortfalls dating back to 2021 and expected to continue into early 2026.
Kalshi Files for Gold and Silver Perpetual Futures with CFTC
Kalshi’s latest regulatory push seeks authorization for two dollar-settled instruments that would give traders exposure to gold and silver prices without ever touching the metal itself. The company submitted its applications through CFTC Regulation 40.2(a), a self-certification pathway that lets a registered exchange launch a new product by attesting it complies with the Commodity Exchange Act, rather than waiting for a formal commission vote on each contract.
Product Names and Regulatory Process
The two proposed instruments are named GOLDPERP and SILVERPERP. Because Kalshi is using self-certification rather than a formal approval proceeding, the contracts can move toward listing without the commission casting an affirmative vote on each one — a faster route than the process Kalshi used earlier this year for its Bitcoin perpetual.
Contract Structure and Settlement
GOLDPERP is built to mirror the U.S. dollar spot price of one troy ounce of gold, while SILVERPERP does the same for silver. Neither contract involves physical delivery. Both settle entirely in cash, meaning traders never receive bars, coins, or any other physical form of the metal, and contract holders cannot demand delivery from Kalshi when they close a position.
What sets these products apart from standard futures is their perpetual structure. Instead of expiring on a fixed date, GOLDPERP and SILVERPERP stay open indefinitely. A funding rate mechanism keeps the contract price tethered to the underlying spot market — traders holding long positions may pay those holding short positions, or vice versa, depending on how the contract trades relative to its benchmark. That design removes the need for the periodic “rolling” that traditional futures traders go through when moving a position from an expiring contract into the next one. Kalshi has said this structure could lower rollover costs for market participants such as bullion dealers, metal refiners, financial institutions, and companies with sustained gold or silver exposure.
Innovative Trading Schedule and Price Oracle Integration
Kalshi wants these contracts trading nonstop, and it wants an independent data source setting the price. Together, those two design choices would make GOLDPERP and SILVERPERP function differently from anything currently available on regulated U.S. metals markets.
Continuous 24/7 Trading Availability
Under the filed specifications, both contracts would operate around the clock, seven days a week, including weekends and recognized holidays. That’s a notable jump from what Kalshi floated back in July, when early discussions pointed toward a more limited 24/5 trading window. For U.S.-based traders, round-the-clock access would mean the ability to react to precious metals price moves even when conventional futures exchanges are shut — though liquidity and pricing outside standard market hours could behave differently than during regular sessions.
Use of Pyth Network as Price Oracle
Pyth Network has been named as the designated price oracle for both GOLDPERP and SILVERPERP. Pyth aggregates pricing data from a range of sources, including market makers, trading venues, and financial institutions, and that consolidated feed will determine the reference price used to settle and fund the contracts. Anchoring the products to an established oracle network is meant to give the perpetual contracts a transparent, continuously updated benchmark rather than relying on a single exchange’s closing price.
Market Context and Strategic Expansion
The timing of the filing isn’t incidental. Kalshi is leaning into a silver market that has been under sustained pressure, while simultaneously building on momentum from its crypto perpetuals business.
Silver Market Supply Shortfalls
Kalshi’s filing points directly to physical market conditions to justify SILVERPERP’s design. The company notes that silver markets have experienced persistent annual supply shortfalls since 2021, with that tightness expected to extend through early 2026. Because SILVERPERP settles in cash and can’t be converted into physical metal, Kalshi argues the contract wouldn’t add delivery pressure to an already strained underlying market — traders get price exposure, but the physical supply-demand balance stays untouched.
Kalshi’s Growth in Perpetual Futures
The gold and silver filings arrive on the heels of an aggressive build-out in crypto perpetuals. Kalshi secured CFTC approval for its Bitcoin perpetual contract, BTCPERP, in May — the first U.S.-regulated product of its kind — following a formal review rather than self-certification. From there, the platform added 17 more cryptocurrency perpetuals covering assets including Ether, XRP, Solana, and Hyperliquid. On September 4, five additional contracts went live tracking BNB, Cardano, Worldcoin, Aave, and Venice Token.
By June, Kalshi’s perpetual futures business had already crossed $8.5 billion in cumulative trading volume, a figure that underscores how quickly the exchange has scaled a product category that barely existed on regulated U.S. platforms a year earlier. That growth hasn’t gone unchallenged, though. CME Group sued the CFTC in June, arguing that Kalshi’s Bitcoin perpetual should be classified as a swap rather than a futures contract — a distinction that would place it under a different regulatory framework and, CME claims, has put established futures exchanges at a competitive disadvantage. The CFTC has since moved to dismiss the case, arguing CME hasn’t shown concrete harm and pointing to CME’s own Bitcoin and Ether futures volumes as evidence the competitive impact is overstated. A federal court has not yet ruled on the dismissal motion or settled the broader question of how crypto perpetuals should be classified.
That unresolved legal fight matters well beyond Bitcoin. If the case eventually determines that perpetual futures belong in the swap category rather than the futures category, it could reshape how Kalshi’s entire perpetuals lineup — including any future gold and silver products — gets regulated and who’s allowed to compete in offering them. For now, Kalshi is moving ahead regardless, treating precious metals as the next frontier for a trading structure it has already proven can draw significant volume in crypto markets.
Kalshi has been careful to frame GOLDPERP and SILVERPERP as distinct from the event-based, short-duration contracts on gold and silver it already lists. Where those existing products resolve on set dates tied to specific market outcomes, the new perpetual contracts are built for traders who want continuous, rollover-free exposure to metals prices — a structural shift that, if approved, would give U.S. investors a regulated alternative to holding physical bullion or metal-backed ETF shares.
FAQ
What new products has Kalshi filed with the CFTC?
Kalshi has filed to offer perpetual futures contracts for gold and silver, named GOLDPERP and SILVERPERP.
How are the GOLDPERP and SILVERPERP contracts settled?
Both contracts are cash settled with no physical delivery of gold or silver.
What is unique about the contract duration for GOLDPERP and SILVERPERP?
These contracts have a perpetual structure without expiration, maintained by a funding rate mechanism aligning prices with spot markets.
When can investors trade these perpetual futures?
Kalshi proposes continuous 24/7 trading for these contracts, including weekends and holidays.
Article produced with the assistance of artificial intelligence and reviewed by the editorial team.
212
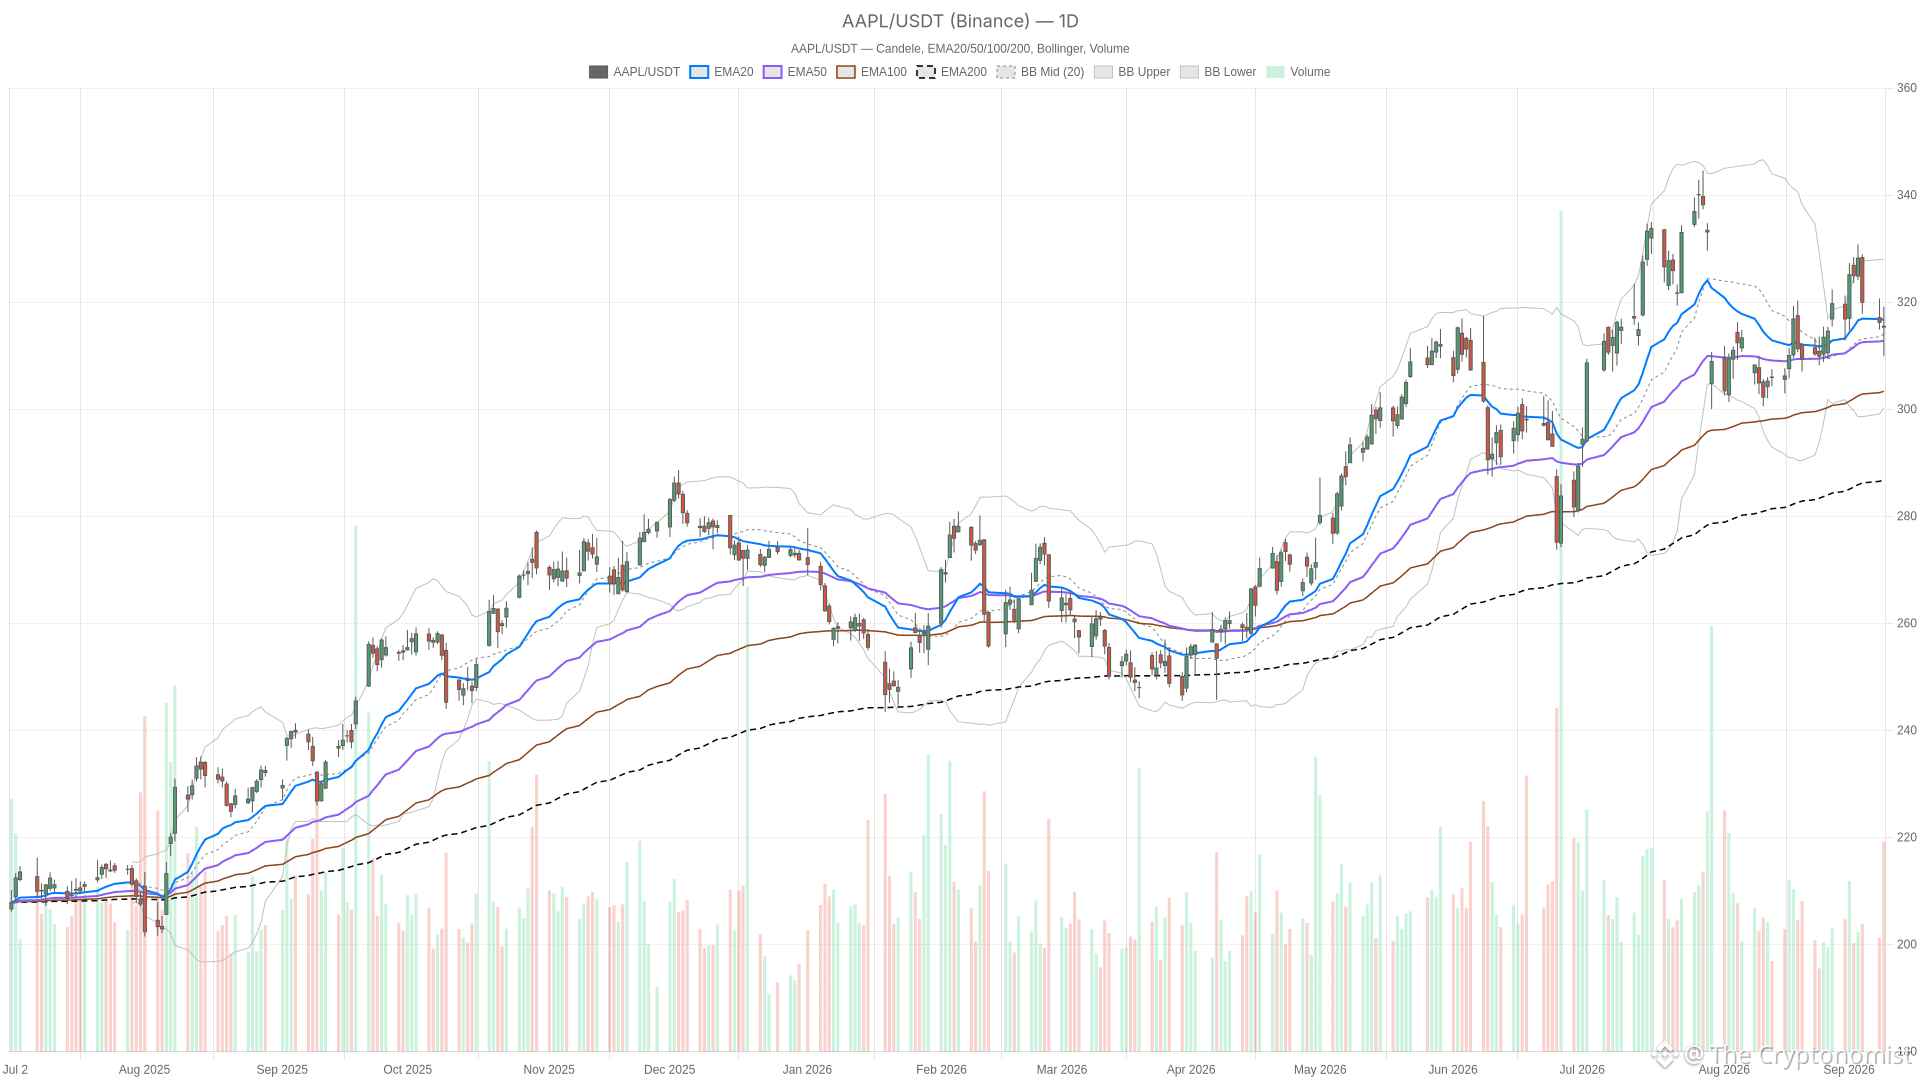
Article
Apple Stock Holds $315 Pivot as Analysts Clash Over $372 TargetApple stock consolidates near $315, caught between constructive daily momentum and a softer hourly structure. Shares closed at $315.34, down from $319.15, after Apple’s foldable iPhone Duo launch at $1,999 and AI push. The mixed reaction is visible across timeframes.
AAPL — daily chart with candlesticks, EMA20/EMA50 and volume.
Key takeaways
Apple stock closed at $315.34, down from an intraday high of $319.15 after the latest product event.
The daily chart holds above the 50-day EMA at 312.77 and the 200-day EMA at 286.81, but price slipped below the 20-day EMA.
Hourly momentum has turned bearish, with RSI14 at 43.73 and the MACD histogram turning negative.
The daily pivot at 314.80 frames the battle zone, with resistance at 319.69 and support at 310.44.
Analyst targets diverge: one Strong Buy calls for $372, while another flags stretched valuation.
Daily Trend Remains Intact as Momentum Cools
Apple stock’s daily trend remains structurally intact, though momentum has cooled noticeably. On the daily chart, Apple stock sits below the 20-day EMA at 316.70. However, it holds comfortably above the 50-day EMA at 312.77 and far above the 200-day EMA at 286.81. That long-term stack still favors buyers on a structural basis. Yet the slip under the shorter EMA signals the recent rally has lost thrust.
RSI14 on the daily frame reads 49.35 — essentially neutral. It is neither overbought nor oversold. This tells a clear story: momentum has flattened rather than reversed. Meanwhile, the daily MACD line at 1.80 remains above its signal line at 1.37 with a positive histogram of 0.43. This keeps the broader picture tilted slightly bullish, even as gains have slowed.
Bollinger Bands show price hovering near the midline of 314.06. The upper band sits at 327.94 and the lower band at 300.18. Positioning near the middle reflects indecision rather than a strong directional push. Daily ATR14 stands at 7.39, confirming elevated volatility for meaningful swings. The daily pivot at 314.80 frames the immediate battle zone, with resistance at 319.69 and support at 310.44.
Hourly Chart Tells a Different Story
The hourly chart on Apple stock paints a less encouraging picture, with price trading below all three key EMAs. The 1-hour timeframe shows price at 315.41 sitting beneath the 20-hour EMA at 316.71. It also trades below the 50-hour EMA at 318.43 and the 200-hour EMA at 316.35. This bearish EMA stack directly contrasts with the daily chart’s long-term bullish alignment. That conflict lies at the core of the current setup.
Hourly RSI14 reads 43.73, leaning toward the softer side without being oversold. At the same time, the hourly MACD line at -2.29 sits below its signal at -2.20. The negative histogram of -0.09 confirms short-term downside pressure is real, though modest. The hourly Bollinger midline at 316.64 reinforces that the stock struggles to reclaim short-term equilibrium.
Hourly ATR14 at 2.67 shows intraday ranges have compressed relative to the broader daily volatility backdrop.
15-Minute Chart Shows Early Stabilization
In contrast, the 15-minute chart offers a slightly more constructive short-term signal. Price at 315.41 has reclaimed the 15-minute 20-EMA at 314.38. However, it remains below the 50-EMA at 315.61 and the 200-EMA at 318.49.
RSI14 on this timeframe has ticked up to 53.69. Notably, the MACD line at 0.05 has crossed above its signal at -0.43, generating a positive histogram of 0.49. Therefore, early signs of a short-term bounce are emerging. Still, this has not yet resolved the larger conflict between the daily and hourly trends.
News Flow Deepens the Divergence
The fundamental backdrop mirrors the technical split, with analyst reactions to Apple’s product event pointing in opposite directions. One Seeking Alpha analysis following the iPhone launch carries a Strong Buy rating with a $372 price target. It argues the $2,000 foldable iPhone Duo reshapes the investment case for Apple stock. On the other hand, a separate piece titled ‘Apple Event: The Art Of Playing It Safe’ warns that valuation already looks stretched.
This event also marked the first major product showcase led by new CEO John Ternus. His debut adds an extra layer of scrutiny to how the market digests the announcements. The AI-focused ‘Intelligent Personal Hub’ vision adds long-term potential, but near-term conviction remains divided.
Bullish Scenario
A bullish continuation for Apple stock requires reclaiming key resistance levels and flipping short-term momentum positive. Price would need to retake the daily 20-EMA at 316.70 and push through the daily pivot resistance at 319.69. A sustained move above the daily Bollinger midline would add confirmation. This would align with the hourly MACD turning positive and RSI climbing back above 50.
In this scenario, the more optimistic $372 price target tied to AI integration and the new iPhone Duo would gain technical support. The daily uptrend structure above the 50 and 200 EMAs would reassert itself.
Bearish Scenario
The bearish case for Apple stock centers on a failure to reclaim the 20-EMA, followed by a break below daily support. A rejection at the daily 20-EMA at 316.70 would keep sellers in control. A subsequent break below support at 310.44 would open the door toward the lower Bollinger band at 300.18. Such a move would be consistent with the daily ATR14 of 7.39.
This breakdown would align with the valuation-stretched narrative from the more cautious analyst view. It would also confirm that the hourly bearish EMA stack has overtaken the broader trend. A daily RSI drop below 45, combined with a deeper negative MACD histogram, would fully invalidate the bullish thesis.
Positioning Into a Mixed Setup
Apple stock sits at a genuine inflection point, with conflicting signals across timeframes demanding patience. Overall, the daily chart still reflects long-term strength with price well above the 200-day EMA. However, short-term momentum on the hourly timeframe has clearly deteriorated. Meanwhile, the 15-minute chart hints at early stabilization that higher timeframes have yet to confirm.
Given elevated ATR readings and the mixed analyst reaction to the product event, volatility around the $315 pivot is likely to persist. Traders watching Apple stock should treat the daily pivot and the 310–320 range as the key battleground. The decisive signal will come when one timeframe confirms the other.
FAQ
Is Apple stock still in a daily uptrend?
The daily trend remains structurally intact. Apple stock holds above the 50-day EMA at 312.77 and the 200-day EMA at 286.81. However, momentum has cooled, with RSI14 at 49.35 and price slipping below the 20-day EMA at 316.70.
What are the key support and resistance levels for Apple stock?
The daily pivot at 314.80 serves as the immediate reference. Resistance sits at 319.69, while key support rests at 310.44. A break lower would target the lower Bollinger band at 300.18.
How did the market react to Apple’s latest product event?
The reaction has been mixed. One Seeking Alpha analyst issued a Strong Buy with a $372 target around the foldable iPhone Duo. Another flagged stretched valuation. Apple stock closed at $315.34, down from an intraday high of $319.15.
What would confirm a bullish reversal on Apple stock?
A bullish confirmation requires reclaiming the daily 20-EMA at 316.70 and pushing through resistance at 319.69. The hourly MACD flipping positive and RSI moving above 50 would add conviction.
Disclaimer: This article is for informational purposes only and does not constitute financial advice, an investment recommendation, or a solicitation to buy or sell any financial instrument or cryptocurrency. The analysis provided is not indicative of future results. Investing in crypto assets and financial markets carries a high risk of capital loss. Always do your own research (DYOR) and consult a qualified financial advisor before making any decision.
Article produced with the assistance of artificial intelligence and reviewed by the editorial team.
Apple Stock Holds $315 Pivot as Analysts Clash Over $372 Target
Apple stock consolidates near $315, caught between constructive daily momentum and a softer hourly structure. Shares closed at $315.34, down from $319.15, after Apple’s foldable iPhone Duo launch at $1,999 and AI push. The mixed reaction is visible across timeframes.
AAPL — daily chart with candlesticks, EMA20/EMA50 and volume.
Key takeaways
Apple stock closed at $315.34, down from an intraday high of $319.15 after the latest product event.
The daily chart holds above the 50-day EMA at 312.77 and the 200-day EMA at 286.81, but price slipped below the 20-day EMA.
Hourly momentum has turned bearish, with RSI14 at 43.73 and the MACD histogram turning negative.
The daily pivot at 314.80 frames the battle zone, with resistance at 319.69 and support at 310.44.
Analyst targets diverge: one Strong Buy calls for $372, while another flags stretched valuation.
Daily Trend Remains Intact as Momentum Cools
Apple stock’s daily trend remains structurally intact, though momentum has cooled noticeably. On the daily chart, Apple stock sits below the 20-day EMA at 316.70. However, it holds comfortably above the 50-day EMA at 312.77 and far above the 200-day EMA at 286.81. That long-term stack still favors buyers on a structural basis. Yet the slip under the shorter EMA signals the recent rally has lost thrust.
RSI14 on the daily frame reads 49.35 — essentially neutral. It is neither overbought nor oversold. This tells a clear story: momentum has flattened rather than reversed. Meanwhile, the daily MACD line at 1.80 remains above its signal line at 1.37 with a positive histogram of 0.43. This keeps the broader picture tilted slightly bullish, even as gains have slowed.
Bollinger Bands show price hovering near the midline of 314.06. The upper band sits at 327.94 and the lower band at 300.18. Positioning near the middle reflects indecision rather than a strong directional push. Daily ATR14 stands at 7.39, confirming elevated volatility for meaningful swings. The daily pivot at 314.80 frames the immediate battle zone, with resistance at 319.69 and support at 310.44.
Hourly Chart Tells a Different Story
The hourly chart on Apple stock paints a less encouraging picture, with price trading below all three key EMAs. The 1-hour timeframe shows price at 315.41 sitting beneath the 20-hour EMA at 316.71. It also trades below the 50-hour EMA at 318.43 and the 200-hour EMA at 316.35. This bearish EMA stack directly contrasts with the daily chart’s long-term bullish alignment. That conflict lies at the core of the current setup.
Hourly RSI14 reads 43.73, leaning toward the softer side without being oversold. At the same time, the hourly MACD line at -2.29 sits below its signal at -2.20. The negative histogram of -0.09 confirms short-term downside pressure is real, though modest. The hourly Bollinger midline at 316.64 reinforces that the stock struggles to reclaim short-term equilibrium.
Hourly ATR14 at 2.67 shows intraday ranges have compressed relative to the broader daily volatility backdrop.
15-Minute Chart Shows Early Stabilization
In contrast, the 15-minute chart offers a slightly more constructive short-term signal. Price at 315.41 has reclaimed the 15-minute 20-EMA at 314.38. However, it remains below the 50-EMA at 315.61 and the 200-EMA at 318.49.
RSI14 on this timeframe has ticked up to 53.69. Notably, the MACD line at 0.05 has crossed above its signal at -0.43, generating a positive histogram of 0.49. Therefore, early signs of a short-term bounce are emerging. Still, this has not yet resolved the larger conflict between the daily and hourly trends.
News Flow Deepens the Divergence
The fundamental backdrop mirrors the technical split, with analyst reactions to Apple’s product event pointing in opposite directions. One Seeking Alpha analysis following the iPhone launch carries a Strong Buy rating with a $372 price target. It argues the $2,000 foldable iPhone Duo reshapes the investment case for Apple stock. On the other hand, a separate piece titled ‘Apple Event: The Art Of Playing It Safe’ warns that valuation already looks stretched.
This event also marked the first major product showcase led by new CEO John Ternus. His debut adds an extra layer of scrutiny to how the market digests the announcements. The AI-focused ‘Intelligent Personal Hub’ vision adds long-term potential, but near-term conviction remains divided.
Bullish Scenario
A bullish continuation for Apple stock requires reclaiming key resistance levels and flipping short-term momentum positive. Price would need to retake the daily 20-EMA at 316.70 and push through the daily pivot resistance at 319.69. A sustained move above the daily Bollinger midline would add confirmation. This would align with the hourly MACD turning positive and RSI climbing back above 50.
In this scenario, the more optimistic $372 price target tied to AI integration and the new iPhone Duo would gain technical support. The daily uptrend structure above the 50 and 200 EMAs would reassert itself.
Bearish Scenario
The bearish case for Apple stock centers on a failure to reclaim the 20-EMA, followed by a break below daily support. A rejection at the daily 20-EMA at 316.70 would keep sellers in control. A subsequent break below support at 310.44 would open the door toward the lower Bollinger band at 300.18. Such a move would be consistent with the daily ATR14 of 7.39.
This breakdown would align with the valuation-stretched narrative from the more cautious analyst view. It would also confirm that the hourly bearish EMA stack has overtaken the broader trend. A daily RSI drop below 45, combined with a deeper negative MACD histogram, would fully invalidate the bullish thesis.
Positioning Into a Mixed Setup
Apple stock sits at a genuine inflection point, with conflicting signals across timeframes demanding patience. Overall, the daily chart still reflects long-term strength with price well above the 200-day EMA. However, short-term momentum on the hourly timeframe has clearly deteriorated. Meanwhile, the 15-minute chart hints at early stabilization that higher timeframes have yet to confirm.
Given elevated ATR readings and the mixed analyst reaction to the product event, volatility around the $315 pivot is likely to persist. Traders watching Apple stock should treat the daily pivot and the 310–320 range as the key battleground. The decisive signal will come when one timeframe confirms the other.
FAQ
Is Apple stock still in a daily uptrend?
The daily trend remains structurally intact. Apple stock holds above the 50-day EMA at 312.77 and the 200-day EMA at 286.81. However, momentum has cooled, with RSI14 at 49.35 and price slipping below the 20-day EMA at 316.70.
What are the key support and resistance levels for Apple stock?
The daily pivot at 314.80 serves as the immediate reference. Resistance sits at 319.69, while key support rests at 310.44. A break lower would target the lower Bollinger band at 300.18.
How did the market react to Apple’s latest product event?
The reaction has been mixed. One Seeking Alpha analyst issued a Strong Buy with a $372 target around the foldable iPhone Duo. Another flagged stretched valuation. Apple stock closed at $315.34, down from an intraday high of $319.15.
What would confirm a bullish reversal on Apple stock?
A bullish confirmation requires reclaiming the daily 20-EMA at 316.70 and pushing through resistance at 319.69. The hourly MACD flipping positive and RSI moving above 50 would add conviction.
Disclaimer: This article is for informational purposes only and does not constitute financial advice, an investment recommendation, or a solicitation to buy or sell any financial instrument or cryptocurrency. The analysis provided is not indicative of future results. Investing in crypto assets and financial markets carries a high risk of capital loss. Always do your own research (DYOR) and consult a qualified financial advisor before making any decision.
Article produced with the assistance of artificial intelligence and reviewed by the editorial team.
AAPL — daily chart with candlesticks, EMA20/EMA50 and volume.
Key takeaways
Apple stock closed at $315.34, down from an intraday high of $319.15 after the latest product event.
The daily chart holds above the 50-day EMA at 312.77 and the 200-day EMA at 286.81, but price slipped below the 20-day EMA.
Hourly momentum has turned bearish, with RSI14 at 43.73 and the MACD histogram turning negative.
The daily pivot at 314.80 frames the battle zone, with resistance at 319.69 and support at 310.44.
Analyst targets diverge: one Strong Buy calls for $372, while another flags stretched valuation.
Daily Trend Remains Intact as Momentum Cools
Apple stock’s daily trend remains structurally intact, though momentum has cooled noticeably. On the daily chart, Apple stock sits below the 20-day EMA at 316.70. However, it holds comfortably above the 50-day EMA at 312.77 and far above the 200-day EMA at 286.81. That long-term stack still favors buyers on a structural basis. Yet the slip under the shorter EMA signals the recent rally has lost thrust.
RSI14 on the daily frame reads 49.35 — essentially neutral. It is neither overbought nor oversold. This tells a clear story: momentum has flattened rather than reversed. Meanwhile, the daily MACD line at 1.80 remains above its signal line at 1.37 with a positive histogram of 0.43. This keeps the broader picture tilted slightly bullish, even as gains have slowed.
Bollinger Bands show price hovering near the midline of 314.06. The upper band sits at 327.94 and the lower band at 300.18. Positioning near the middle reflects indecision rather than a strong directional push. Daily ATR14 stands at 7.39, confirming elevated volatility for meaningful swings. The daily pivot at 314.80 frames the immediate battle zone, with resistance at 319.69 and support at 310.44.
Hourly Chart Tells a Different Story
The hourly chart on Apple stock paints a less encouraging picture, with price trading below all three key EMAs. The 1-hour timeframe shows price at 315.41 sitting beneath the 20-hour EMA at 316.71. It also trades below the 50-hour EMA at 318.43 and the 200-hour EMA at 316.35. This bearish EMA stack directly contrasts with the daily chart’s long-term bullish alignment. That conflict lies at the core of the current setup.
Hourly RSI14 reads 43.73, leaning toward the softer side without being oversold. At the same time, the hourly MACD line at -2.29 sits below its signal at -2.20. The negative histogram of -0.09 confirms short-term downside pressure is real, though modest. The hourly Bollinger midline at 316.64 reinforces that the stock struggles to reclaim short-term equilibrium.
Hourly ATR14 at 2.67 shows intraday ranges have compressed relative to the broader daily volatility backdrop.
15-Minute Chart Shows Early Stabilization
In contrast, the 15-minute chart offers a slightly more constructive short-term signal. Price at 315.41 has reclaimed the 15-minute 20-EMA at 314.38. However, it remains below the 50-EMA at 315.61 and the 200-EMA at 318.49.
RSI14 on this timeframe has ticked up to 53.69. Notably, the MACD line at 0.05 has crossed above its signal at -0.43, generating a positive histogram of 0.49. Therefore, early signs of a short-term bounce are emerging. Still, this has not yet resolved the larger conflict between the daily and hourly trends.
News Flow Deepens the Divergence
The fundamental backdrop mirrors the technical split, with analyst reactions to Apple’s product event pointing in opposite directions. One Seeking Alpha analysis following the iPhone launch carries a Strong Buy rating with a $372 price target. It argues the $2,000 foldable iPhone Duo reshapes the investment case for Apple stock. On the other hand, a separate piece titled ‘Apple Event: The Art Of Playing It Safe’ warns that valuation already looks stretched.
This event also marked the first major product showcase led by new CEO John Ternus. His debut adds an extra layer of scrutiny to how the market digests the announcements. The AI-focused ‘Intelligent Personal Hub’ vision adds long-term potential, but near-term conviction remains divided.
Bullish Scenario
A bullish continuation for Apple stock requires reclaiming key resistance levels and flipping short-term momentum positive. Price would need to retake the daily 20-EMA at 316.70 and push through the daily pivot resistance at 319.69. A sustained move above the daily Bollinger midline would add confirmation. This would align with the hourly MACD turning positive and RSI climbing back above 50.
In this scenario, the more optimistic $372 price target tied to AI integration and the new iPhone Duo would gain technical support. The daily uptrend structure above the 50 and 200 EMAs would reassert itself.
Bearish Scenario
The bearish case for Apple stock centers on a failure to reclaim the 20-EMA, followed by a break below daily support. A rejection at the daily 20-EMA at 316.70 would keep sellers in control. A subsequent break below support at 310.44 would open the door toward the lower Bollinger band at 300.18. Such a move would be consistent with the daily ATR14 of 7.39.
This breakdown would align with the valuation-stretched narrative from the more cautious analyst view. It would also confirm that the hourly bearish EMA stack has overtaken the broader trend. A daily RSI drop below 45, combined with a deeper negative MACD histogram, would fully invalidate the bullish thesis.
Positioning Into a Mixed Setup
Apple stock sits at a genuine inflection point, with conflicting signals across timeframes demanding patience. Overall, the daily chart still reflects long-term strength with price well above the 200-day EMA. However, short-term momentum on the hourly timeframe has clearly deteriorated. Meanwhile, the 15-minute chart hints at early stabilization that higher timeframes have yet to confirm.
Given elevated ATR readings and the mixed analyst reaction to the product event, volatility around the $315 pivot is likely to persist. Traders watching Apple stock should treat the daily pivot and the 310–320 range as the key battleground. The decisive signal will come when one timeframe confirms the other.
FAQ
Is Apple stock still in a daily uptrend?
The daily trend remains structurally intact. Apple stock holds above the 50-day EMA at 312.77 and the 200-day EMA at 286.81. However, momentum has cooled, with RSI14 at 49.35 and price slipping below the 20-day EMA at 316.70.
What are the key support and resistance levels for Apple stock?
The daily pivot at 314.80 serves as the immediate reference. Resistance sits at 319.69, while key support rests at 310.44. A break lower would target the lower Bollinger band at 300.18.
How did the market react to Apple’s latest product event?
The reaction has been mixed. One Seeking Alpha analyst issued a Strong Buy with a $372 target around the foldable iPhone Duo. Another flagged stretched valuation. Apple stock closed at $315.34, down from an intraday high of $319.15.
What would confirm a bullish reversal on Apple stock?
A bullish confirmation requires reclaiming the daily 20-EMA at 316.70 and pushing through resistance at 319.69. The hourly MACD flipping positive and RSI moving above 50 would add conviction.
Disclaimer: This article is for informational purposes only and does not constitute financial advice, an investment recommendation, or a solicitation to buy or sell any financial instrument or cryptocurrency. The analysis provided is not indicative of future results. Investing in crypto assets and financial markets carries a high risk of capital loss. Always do your own research (DYOR) and consult a qualified financial advisor before making any decision.
Article produced with the assistance of artificial intelligence and reviewed by the editorial team.
4

Article
PayPal’s custom stablecoins hit $100M in volume on new PYUSDx platformPayPal has quietly opened the door to a new kind of digital dollar, one that businesses can shape to fit their own products rather than accept a one-size-fits-all token. On September 9, PayPal, M0 and MoonPay officially launched PYUSDx, a platform built to let companies issue PayPal custom stablecoins backed by PayPal USD, and three early adopters have already pushed more than $100 million in combined processed volume through the system.
Key takeaways
PayPal, M0 and MoonPay launched the PYUSDx platform on September 9, allowing businesses to issue their own branded stablecoins backed by PayPal USD.
Three initial projects — Saturn, Concrete and Cap — have collectively processed over $100 million in transaction volume, though the figure reflects activity, not market cap or revenue.
MoonPay Digital Assets Limited issues the PYUSDx tokens, while Paxos Trust Company remains the issuer of the underlying PYUSD stablecoin.
PYUSDx tokens cannot currently be sent, received, or used for payments inside the PayPal or Venmo apps.
USD.AI and Fairblock are expected to join the platform after the initial launch group, though no activation dates have been confirmed.
PayPal Launches PYUSDx Custom Stablecoin Platform
PYUSDx is not a stablecoin in itself — it’s an issuance framework that lets other companies build their own dollar-pegged tokens on top of PayPal’s existing infrastructure. That distinction matters because it reframes what PayPal is actually selling here: not a single coin, but a toolkit for creating many.
Through the platform, businesses can issue application-specific tokens backed by PayPal USD while customizing names, access restrictions, reward distribution, collateral policies and cross-chain availability. The partners first floated this framework back in February, describing it as a way for developers to launch branded digital dollars without building their own issuance and liquidity systems from scratch, according to earlier crypto.news reporting.
M0 built the programmable token infrastructure that powers PYUSDx, letting issuers mix and match components instead of locking into a fixed stablecoin design. MoonPay handles issuance, onboarding and distribution, while PayPal supplies the connective tissue through PYUSD itself. That arrangement stretches PYUSD’s role well beyond direct payments, turning it into a reserve asset that other financial applications can lean on.
Early Projects and $100 Million Processed Volume
Three projects — Saturn, Concrete and Cap — are the first to go live on PYUSDx, and together they’ve already pushed more than $100 million through the platform. That’s a notable early signal for a system that only launched publicly on September 9, though it’s worth being precise about what the number actually measures.
The $100 million figure reflects processed transaction volume tied to those three projects, not the market capitalization of PYUSDx tokens and not company revenue. Saturn uses the system to run USDat, a dollar-denominated settlement token. Concrete launched concUSD to support its on-chain vault infrastructure, and Cap introduced cUSD as the native dollar asset for its credit platform.
Each project keeps control over its own branding and certain operating rules, including how returns or incentives get distributed, within the bounds of its chosen structure and applicable law. What’s missing is a breakdown of how that $100 million splits across the three tokens, and whether it reflects transfers, settlement activity, minting, or some combination of measures. Without that detail, the number should be read as a snapshot of activity rather than a hard financial metric.
Issuance and Backing Details of PYUSDx Tokens
Who actually stands behind these tokens is a separate question from who backs the dollars underneath them — and that separation is the whole point of understanding PYUSDx’s risk structure. MoonPay Digital Assets Limited issues the custom PYUSDx tokens themselves, while Paxos Trust Company issues the underlying PYUSD stablecoin that gives them their dollar backing.
According to PayPal’s own disclosures, each PYUSD token can be exchanged for a U.S. dollar on a one-to-one basis, with backing coming from dollar deposits, U.S. Treasuries and comparable cash equivalents. Paxos publishes monthly reserve reports and third-party attestations on its transparency page covering those assets, giving PYUSD holders a documented reserve trail.
Nature of PYUSDx Tokens vs PYUSD
A PYUSDx token is not the same instrument as PYUSD, and that gap matters for anyone weighing redemption or issuer risk. Holding a custom token issued through the platform doesn’t automatically create the same direct relationship with Paxos that a PYUSD holder has. Each token’s terms depend on the participating business, MoonPay’s issuance structure, and the smart contracts governing conversions — meaning users need to check each project’s documentation rather than assume uniform redemption rights across the board. Regulatory treatment could also differ by jurisdiction and use case, since a token built for lending or restricted settlement may face different rules than one designed mainly for payments.
Future Participants USD.AI and Fairblock
USD.AI and Fairblock are next in line to join the platform, according to the companies, though neither has disclosed a confirmed activation date, supported network, or initial issuance amount. Until their tokens go live, their involvement remains a stated plan rather than an operating reality.
Limitations and Next Steps for PYUSDx
PYUSDx tokens can’t currently move through PayPal’s or Venmo‘s consumer apps, and that’s a meaningful boundary on how far this launch actually reaches right now. Eligible PayPal customers can buy, hold, transfer and sell PYUSD directly, and businesses can use it for supported payments — but none of those consumer-facing functions extend automatically to USDat, concUSD, cUSD, or whatever comes next through the platform.
That gap matters for context. PayPal’s brand and its underlying stablecoin shouldn’t be mistaken for a guarantee that every custom token built through PYUSDx will eventually work inside PayPal’s payment network. For now, the platform’s real-world use cases sit outside PayPal’s own apps, centered instead on external blockchain applications and specialized financial products like settlement, credit and decentralized finance.
This fits into a broader pattern of PayPal pushing its stablecoin further into blockchain infrastructure. The company recently made PYUSD available through Polygon’s Open Money Stack, adding payment, compliance and fiat-conversion tools for businesses. PayPal has also elevated stablecoins to a corporate growth priority, a shift that followed the company processing $486.4 billion in quarterly payment volume, according to crypto.news reporting.
Why does any of this matter beyond the launch headlines? Because PYUSDx gives PayPal a second lever to grow demand for its own stablecoin without having to run every application built around it. If Saturn, Concrete, Cap or future participants scale up, they’ll likely need more PYUSD sitting behind their custom tokens as backing — indirectly expanding PYUSD’s footprint even though PayPal itself isn’t operating those individual projects. That said, the partners haven’t published any targets for future issuance or reserve demand, so the scale of that indirect growth remains an open question.
The next confirmed milestone is the arrival of USD.AI and Fairblock, though timing stays unannounced. PayPal, M0 and MoonPay may also bring on additional businesses looking for customized settlement assets, and each new token will come with its own disclosures on issuance, reserves, conversions, access controls and user eligibility. More granular reporting on how the first three projects generated their combined $100 million would help clarify what the platform has actually achieved so far — and reserve verification will matter just as much, since users need a clear line between the underlying PYUSD backing and the transaction volume generated by the custom tokens riding on top of it.
PYUSDx, in other words, enters the market as infrastructure rather than as a rival to PYUSD itself. Whether it grows into a meaningful layer of the stablecoin ecosystem will hinge on how many businesses actually adopt its programmable features — and whether token holders can trust that converting a custom coin back into PYUSD works as smoothly as the pitch suggests.
FAQ
What is PYUSDx?
PYUSDx is a custom stablecoin issuance platform launched by PayPal, M0 and MoonPay that allows businesses to create programmable stablecoins backed by PayPal USD.
Who issues PYUSDx tokens and the underlying stablecoin?
MoonPay Digital Assets Limited issues PYUSDx tokens, while Paxos Trust Company issues the underlying PYUSD stablecoin.
Can PYUSDx tokens be used within PayPal or Venmo apps?
No, PYUSDx tokens cannot currently be sent, received, or used for payments inside the PayPal and Venmo applications.
What does the $100 million figure represent in PYUSDx’s launch?
It represents the combined processed transaction volume generated by the first three PYUSDx project tokens, not their market capitalization or revenues.
Article produced with the assistance of artificial intelligence and reviewed by the editorial team.
PayPal’s custom stablecoins hit $100M in volume on new PYUSDx platform
PayPal has quietly opened the door to a new kind of digital dollar, one that businesses can shape to fit their own products rather than accept a one-size-fits-all token. On September 9, PayPal, M0 and MoonPay officially launched PYUSDx, a platform built to let companies issue PayPal custom stablecoins backed by PayPal USD, and three early adopters have already pushed more than $100 million in combined processed volume through the system.
Key takeaways
PayPal, M0 and MoonPay launched the PYUSDx platform on September 9, allowing businesses to issue their own branded stablecoins backed by PayPal USD.
Three initial projects — Saturn, Concrete and Cap — have collectively processed over $100 million in transaction volume, though the figure reflects activity, not market cap or revenue.
MoonPay Digital Assets Limited issues the PYUSDx tokens, while Paxos Trust Company remains the issuer of the underlying PYUSD stablecoin.
PYUSDx tokens cannot currently be sent, received, or used for payments inside the PayPal or Venmo apps.
USD.AI and Fairblock are expected to join the platform after the initial launch group, though no activation dates have been confirmed.
PayPal Launches PYUSDx Custom Stablecoin Platform
PYUSDx is not a stablecoin in itself — it’s an issuance framework that lets other companies build their own dollar-pegged tokens on top of PayPal’s existing infrastructure. That distinction matters because it reframes what PayPal is actually selling here: not a single coin, but a toolkit for creating many.
Through the platform, businesses can issue application-specific tokens backed by PayPal USD while customizing names, access restrictions, reward distribution, collateral policies and cross-chain availability. The partners first floated this framework back in February, describing it as a way for developers to launch branded digital dollars without building their own issuance and liquidity systems from scratch, according to earlier crypto.news reporting.
M0 built the programmable token infrastructure that powers PYUSDx, letting issuers mix and match components instead of locking into a fixed stablecoin design. MoonPay handles issuance, onboarding and distribution, while PayPal supplies the connective tissue through PYUSD itself. That arrangement stretches PYUSD’s role well beyond direct payments, turning it into a reserve asset that other financial applications can lean on.
Early Projects and $100 Million Processed Volume
Three projects — Saturn, Concrete and Cap — are the first to go live on PYUSDx, and together they’ve already pushed more than $100 million through the platform. That’s a notable early signal for a system that only launched publicly on September 9, though it’s worth being precise about what the number actually measures.
The $100 million figure reflects processed transaction volume tied to those three projects, not the market capitalization of PYUSDx tokens and not company revenue. Saturn uses the system to run USDat, a dollar-denominated settlement token. Concrete launched concUSD to support its on-chain vault infrastructure, and Cap introduced cUSD as the native dollar asset for its credit platform.
Each project keeps control over its own branding and certain operating rules, including how returns or incentives get distributed, within the bounds of its chosen structure and applicable law. What’s missing is a breakdown of how that $100 million splits across the three tokens, and whether it reflects transfers, settlement activity, minting, or some combination of measures. Without that detail, the number should be read as a snapshot of activity rather than a hard financial metric.
Issuance and Backing Details of PYUSDx Tokens
Who actually stands behind these tokens is a separate question from who backs the dollars underneath them — and that separation is the whole point of understanding PYUSDx’s risk structure. MoonPay Digital Assets Limited issues the custom PYUSDx tokens themselves, while Paxos Trust Company issues the underlying PYUSD stablecoin that gives them their dollar backing.
According to PayPal’s own disclosures, each PYUSD token can be exchanged for a U.S. dollar on a one-to-one basis, with backing coming from dollar deposits, U.S. Treasuries and comparable cash equivalents. Paxos publishes monthly reserve reports and third-party attestations on its transparency page covering those assets, giving PYUSD holders a documented reserve trail.
Nature of PYUSDx Tokens vs PYUSD
A PYUSDx token is not the same instrument as PYUSD, and that gap matters for anyone weighing redemption or issuer risk. Holding a custom token issued through the platform doesn’t automatically create the same direct relationship with Paxos that a PYUSD holder has. Each token’s terms depend on the participating business, MoonPay’s issuance structure, and the smart contracts governing conversions — meaning users need to check each project’s documentation rather than assume uniform redemption rights across the board. Regulatory treatment could also differ by jurisdiction and use case, since a token built for lending or restricted settlement may face different rules than one designed mainly for payments.
Future Participants USD.AI and Fairblock
USD.AI and Fairblock are next in line to join the platform, according to the companies, though neither has disclosed a confirmed activation date, supported network, or initial issuance amount. Until their tokens go live, their involvement remains a stated plan rather than an operating reality.
Limitations and Next Steps for PYUSDx
PYUSDx tokens can’t currently move through PayPal’s or Venmo‘s consumer apps, and that’s a meaningful boundary on how far this launch actually reaches right now. Eligible PayPal customers can buy, hold, transfer and sell PYUSD directly, and businesses can use it for supported payments — but none of those consumer-facing functions extend automatically to USDat, concUSD, cUSD, or whatever comes next through the platform.
That gap matters for context. PayPal’s brand and its underlying stablecoin shouldn’t be mistaken for a guarantee that every custom token built through PYUSDx will eventually work inside PayPal’s payment network. For now, the platform’s real-world use cases sit outside PayPal’s own apps, centered instead on external blockchain applications and specialized financial products like settlement, credit and decentralized finance.
This fits into a broader pattern of PayPal pushing its stablecoin further into blockchain infrastructure. The company recently made PYUSD available through Polygon’s Open Money Stack, adding payment, compliance and fiat-conversion tools for businesses. PayPal has also elevated stablecoins to a corporate growth priority, a shift that followed the company processing $486.4 billion in quarterly payment volume, according to crypto.news reporting.
Why does any of this matter beyond the launch headlines? Because PYUSDx gives PayPal a second lever to grow demand for its own stablecoin without having to run every application built around it. If Saturn, Concrete, Cap or future participants scale up, they’ll likely need more PYUSD sitting behind their custom tokens as backing — indirectly expanding PYUSD’s footprint even though PayPal itself isn’t operating those individual projects. That said, the partners haven’t published any targets for future issuance or reserve demand, so the scale of that indirect growth remains an open question.
The next confirmed milestone is the arrival of USD.AI and Fairblock, though timing stays unannounced. PayPal, M0 and MoonPay may also bring on additional businesses looking for customized settlement assets, and each new token will come with its own disclosures on issuance, reserves, conversions, access controls and user eligibility. More granular reporting on how the first three projects generated their combined $100 million would help clarify what the platform has actually achieved so far — and reserve verification will matter just as much, since users need a clear line between the underlying PYUSD backing and the transaction volume generated by the custom tokens riding on top of it.
PYUSDx, in other words, enters the market as infrastructure rather than as a rival to PYUSD itself. Whether it grows into a meaningful layer of the stablecoin ecosystem will hinge on how many businesses actually adopt its programmable features — and whether token holders can trust that converting a custom coin back into PYUSD works as smoothly as the pitch suggests.
FAQ
What is PYUSDx?
PYUSDx is a custom stablecoin issuance platform launched by PayPal, M0 and MoonPay that allows businesses to create programmable stablecoins backed by PayPal USD.
Who issues PYUSDx tokens and the underlying stablecoin?
MoonPay Digital Assets Limited issues PYUSDx tokens, while Paxos Trust Company issues the underlying PYUSD stablecoin.
Can PYUSDx tokens be used within PayPal or Venmo apps?
No, PYUSDx tokens cannot currently be sent, received, or used for payments inside the PayPal and Venmo applications.
What does the $100 million figure represent in PYUSDx’s launch?
It represents the combined processed transaction volume generated by the first three PYUSDx project tokens, not their market capitalization or revenues.
Article produced with the assistance of artificial intelligence and reviewed by the editorial team.
Key takeaways
PayPal, M0 and MoonPay launched the PYUSDx platform on September 9, allowing businesses to issue their own branded stablecoins backed by PayPal USD.
Three initial projects — Saturn, Concrete and Cap — have collectively processed over $100 million in transaction volume, though the figure reflects activity, not market cap or revenue.
MoonPay Digital Assets Limited issues the PYUSDx tokens, while Paxos Trust Company remains the issuer of the underlying PYUSD stablecoin.
PYUSDx tokens cannot currently be sent, received, or used for payments inside the PayPal or Venmo apps.
USD.AI and Fairblock are expected to join the platform after the initial launch group, though no activation dates have been confirmed.
PayPal Launches PYUSDx Custom Stablecoin Platform
PYUSDx is not a stablecoin in itself — it’s an issuance framework that lets other companies build their own dollar-pegged tokens on top of PayPal’s existing infrastructure. That distinction matters because it reframes what PayPal is actually selling here: not a single coin, but a toolkit for creating many.
Through the platform, businesses can issue application-specific tokens backed by PayPal USD while customizing names, access restrictions, reward distribution, collateral policies and cross-chain availability. The partners first floated this framework back in February, describing it as a way for developers to launch branded digital dollars without building their own issuance and liquidity systems from scratch, according to earlier crypto.news reporting.
M0 built the programmable token infrastructure that powers PYUSDx, letting issuers mix and match components instead of locking into a fixed stablecoin design. MoonPay handles issuance, onboarding and distribution, while PayPal supplies the connective tissue through PYUSD itself. That arrangement stretches PYUSD’s role well beyond direct payments, turning it into a reserve asset that other financial applications can lean on.
Early Projects and $100 Million Processed Volume
Three projects — Saturn, Concrete and Cap — are the first to go live on PYUSDx, and together they’ve already pushed more than $100 million through the platform. That’s a notable early signal for a system that only launched publicly on September 9, though it’s worth being precise about what the number actually measures.
The $100 million figure reflects processed transaction volume tied to those three projects, not the market capitalization of PYUSDx tokens and not company revenue. Saturn uses the system to run USDat, a dollar-denominated settlement token. Concrete launched concUSD to support its on-chain vault infrastructure, and Cap introduced cUSD as the native dollar asset for its credit platform.
Each project keeps control over its own branding and certain operating rules, including how returns or incentives get distributed, within the bounds of its chosen structure and applicable law. What’s missing is a breakdown of how that $100 million splits across the three tokens, and whether it reflects transfers, settlement activity, minting, or some combination of measures. Without that detail, the number should be read as a snapshot of activity rather than a hard financial metric.
Issuance and Backing Details of PYUSDx Tokens
Who actually stands behind these tokens is a separate question from who backs the dollars underneath them — and that separation is the whole point of understanding PYUSDx’s risk structure. MoonPay Digital Assets Limited issues the custom PYUSDx tokens themselves, while Paxos Trust Company issues the underlying PYUSD stablecoin that gives them their dollar backing.
According to PayPal’s own disclosures, each PYUSD token can be exchanged for a U.S. dollar on a one-to-one basis, with backing coming from dollar deposits, U.S. Treasuries and comparable cash equivalents. Paxos publishes monthly reserve reports and third-party attestations on its transparency page covering those assets, giving PYUSD holders a documented reserve trail.
Nature of PYUSDx Tokens vs PYUSD
A PYUSDx token is not the same instrument as PYUSD, and that gap matters for anyone weighing redemption or issuer risk. Holding a custom token issued through the platform doesn’t automatically create the same direct relationship with Paxos that a PYUSD holder has. Each token’s terms depend on the participating business, MoonPay’s issuance structure, and the smart contracts governing conversions — meaning users need to check each project’s documentation rather than assume uniform redemption rights across the board. Regulatory treatment could also differ by jurisdiction and use case, since a token built for lending or restricted settlement may face different rules than one designed mainly for payments.
Future Participants USD.AI and Fairblock
USD.AI and Fairblock are next in line to join the platform, according to the companies, though neither has disclosed a confirmed activation date, supported network, or initial issuance amount. Until their tokens go live, their involvement remains a stated plan rather than an operating reality.
Limitations and Next Steps for PYUSDx
PYUSDx tokens can’t currently move through PayPal’s or Venmo‘s consumer apps, and that’s a meaningful boundary on how far this launch actually reaches right now. Eligible PayPal customers can buy, hold, transfer and sell PYUSD directly, and businesses can use it for supported payments — but none of those consumer-facing functions extend automatically to USDat, concUSD, cUSD, or whatever comes next through the platform.
That gap matters for context. PayPal’s brand and its underlying stablecoin shouldn’t be mistaken for a guarantee that every custom token built through PYUSDx will eventually work inside PayPal’s payment network. For now, the platform’s real-world use cases sit outside PayPal’s own apps, centered instead on external blockchain applications and specialized financial products like settlement, credit and decentralized finance.
This fits into a broader pattern of PayPal pushing its stablecoin further into blockchain infrastructure. The company recently made PYUSD available through Polygon’s Open Money Stack, adding payment, compliance and fiat-conversion tools for businesses. PayPal has also elevated stablecoins to a corporate growth priority, a shift that followed the company processing $486.4 billion in quarterly payment volume, according to crypto.news reporting.
Why does any of this matter beyond the launch headlines? Because PYUSDx gives PayPal a second lever to grow demand for its own stablecoin without having to run every application built around it. If Saturn, Concrete, Cap or future participants scale up, they’ll likely need more PYUSD sitting behind their custom tokens as backing — indirectly expanding PYUSD’s footprint even though PayPal itself isn’t operating those individual projects. That said, the partners haven’t published any targets for future issuance or reserve demand, so the scale of that indirect growth remains an open question.
The next confirmed milestone is the arrival of USD.AI and Fairblock, though timing stays unannounced. PayPal, M0 and MoonPay may also bring on additional businesses looking for customized settlement assets, and each new token will come with its own disclosures on issuance, reserves, conversions, access controls and user eligibility. More granular reporting on how the first three projects generated their combined $100 million would help clarify what the platform has actually achieved so far — and reserve verification will matter just as much, since users need a clear line between the underlying PYUSD backing and the transaction volume generated by the custom tokens riding on top of it.
PYUSDx, in other words, enters the market as infrastructure rather than as a rival to PYUSD itself. Whether it grows into a meaningful layer of the stablecoin ecosystem will hinge on how many businesses actually adopt its programmable features — and whether token holders can trust that converting a custom coin back into PYUSD works as smoothly as the pitch suggests.
FAQ
What is PYUSDx?
PYUSDx is a custom stablecoin issuance platform launched by PayPal, M0 and MoonPay that allows businesses to create programmable stablecoins backed by PayPal USD.
Who issues PYUSDx tokens and the underlying stablecoin?
MoonPay Digital Assets Limited issues PYUSDx tokens, while Paxos Trust Company issues the underlying PYUSD stablecoin.
Can PYUSDx tokens be used within PayPal or Venmo apps?
No, PYUSDx tokens cannot currently be sent, received, or used for payments inside the PayPal and Venmo applications.
What does the $100 million figure represent in PYUSDx’s launch?
It represents the combined processed transaction volume generated by the first three PYUSDx project tokens, not their market capitalization or revenues.
Article produced with the assistance of artificial intelligence and reviewed by the editorial team.
56
Log in to explore more content
Join global crypto users on Binance Square
⚡️ Get latest and useful information about crypto.
💬 Trusted by the world’s largest crypto exchange.
👍 Discover real insights from verified creators.
Email / Phone number
Trending Topics
USAugustPPIRisesLessThanExpected
3,607 views
146 Discussing
🚨 US AUG PPI: Rises LESS Than Expected! Bullish for Crypto? 🚀
PPI +0.4% MoM as expected, but CORE PPI only +0.2% vs +0.3% expected - cooling!
What it means:
• Wholesale inflation softer than feared
• Fed rate hike chance now 62% - but dovish signals coming
• Core PCE revisions expected downward - bullish
• BTC usually pumps on softer PPI
Fed meeting Sep 15-16 - Market now expects pause, not hike?
Is this the green light for Q4 rally?
#Bitcoin #PPI #Fed #CryptoNews #BTC#usaugustppiriseslessthanexpected
True News
·1 Likes
·820 views
SECApprovesNasdaqTexasCommodityTrustRule
4,137 views
185 Discussing
ECBRaisesRatesSecondTimeTo2.5%
2,027 views
129 Discussing