

张烁峰Ain
2.4k Posts

张烁峰Ain
Report
Block User
深耕合约交易,btc持有者, 独立交易员.美股.加密.贵金属交易.江恩理论

BTC Holder
Frequent Trader
1.2 Years
75 Following
1.1K+ Followers
2.2K+ Liked
Posts
All
Quotes
Videos
Live
PINNED
·
--
Everyone can add friends by entering in the search box:
Input > Chat Room > Copy ID: 1129067177
Steps to add friends 🎈 see images 1, 2, 3
Let's not get separated, okay? I will accompany you on this path of Binance.
#加密市场观察
Everyone can add friends by entering in the search box:
Input > Chat Room > Copy ID: 1129067177
Steps to add friends 🎈 see images 1, 2, 3
Let's not get separated, okay? I will accompany you on this path of Binance.
#加密市场观察
Input > Chat Room > Copy ID: 1129067177
Steps to add friends 🎈 see images 1, 2, 3
Let's not get separated, okay? I will accompany you on this path of Binance.
#加密市场观察




1
1
4
268
·
--
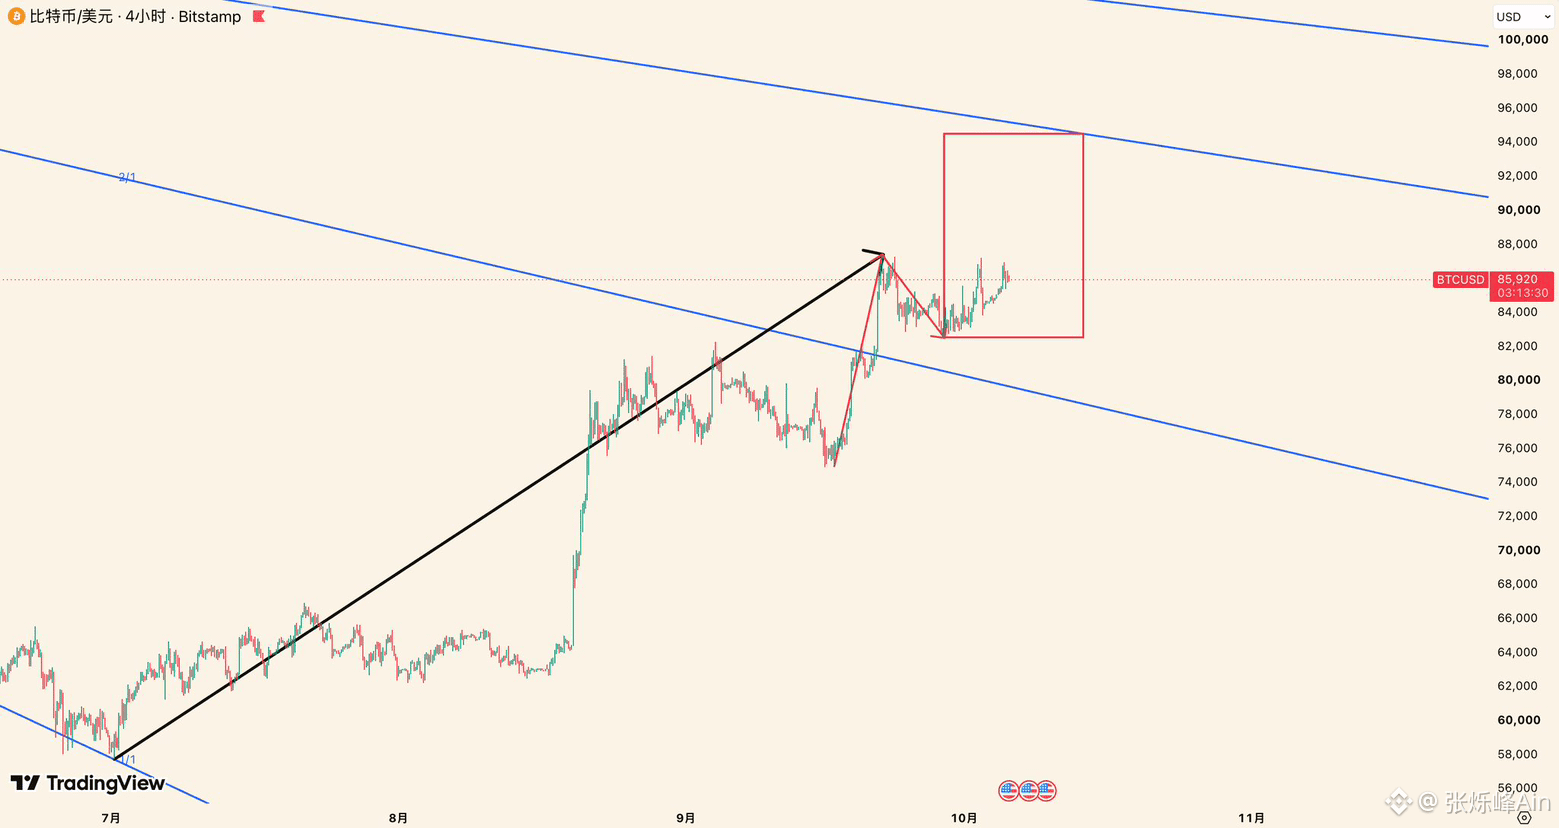
Since we said that the 82300–74968 move was a correction of the 57800–82300 rally and had already ended, BTC has risen steadily from 74968 to 87396.
This is a standard daily-timeframe rally.
BTC is likely to end its more than ten days of sideways trading this week, so we should pay close attention to the following:
If BTC does not fall below 82563 again this week, or if a daily candle closes above 86360, we can assume that the 87396–82563 move was a daily-timeframe correction of the 74968–87396 rally and has ended. If the 87396–82563 move is confirmed as the entire correction, it would be a strong correction.
Under this scenario, the rally from 82563 is on the same timeframe as the 74968–87396 rally; both are daily-timeframe moves.
If BTC falls below 82563 again this week, but stays above the blue 2/1 Gann angle line—around 79780–80100—we will continue, for now, to view the decline from 87396 as a correction of the 74968–87396 rally. A further break below 82563 would make this a complex correction. Once its endpoint is found, the subsequent rally would also be on the daily timeframe.
If this is only a daily-timeframe correction, it will most likely end this week, as its duration is already close to the limit for a daily-timeframe correction. If it does not end this week, consider the possibility that the correction is expanding to a higher timeframe.
In mid-June, I noted that the interim low was likely to occur from late June to early July. BTC then fell to 57800 and staged a V-shaped rebound ✅
On August 21, I clearly stated that 79500 was not the end of the rally. BTC then continued higher, reaching 82500 ✅
On September 18, I pointed out that 82300–74968 was the entire correction. BTC continued higher afterward, reaching a high of 87396 ✅
We have been tracking BTC's market structure consistently since 2025, and we have flagged most key turning points in advance. If you're interested in BTC, don't forget to like and follow. Your support also motivates me to keep posting 💗#BTC走势分析 $BTC
{future}(BTCUSDT)
Since we said that the 82300–74968 move was a correction of the 57800–82300 rally and had already ended, BTC has risen steadily from 74968 to 87396.
This is a standard daily-timeframe rally.
BTC is likely to end its more than ten days of sideways trading this week, so we should pay close attention to the following:
If BTC does not fall below 82563 again this week, or if a daily candle closes above 86360, we can assume that the 87396–82563 move was a daily-timeframe correction of the 74968–87396 rally and has ended. If the 87396–82563 move is confirmed as the entire correction, it would be a strong correction.
Under this scenario, the rally from 82563 is on the same timeframe as the 74968–87396 rally; both are daily-timeframe moves.
If BTC falls below 82563 again this week, but stays above the blue 2/1 Gann angle line—around 79780–80100—we will continue, for now, to view the decline from 87396 as a correction of the 74968–87396 rally. A further break below 82563 would make this a complex correction. Once its endpoint is found, the subsequent rally would also be on the daily timeframe.
If this is only a daily-timeframe correction, it will most likely end this week, as its duration is already close to the limit for a daily-timeframe correction. If it does not end this week, consider the possibility that the correction is expanding to a higher timeframe.
In mid-June, I noted that the interim low was likely to occur from late June to early July. BTC then fell to 57800 and staged a V-shaped rebound ✅
On August 21, I clearly stated that 79500 was not the end of the rally. BTC then continued higher, reaching 82500 ✅
On September 18, I pointed out that 82300–74968 was the entire correction. BTC continued higher afterward, reaching a high of 87396 ✅
We have been tracking BTC's market structure consistently since 2025, and we have flagged most key turning points in advance. If you're interested in BTC, don't forget to like and follow. Your support also motivates me to keep posting 💗#BTC走势分析 $BTC
This is a standard daily-timeframe rally.
BTC is likely to end its more than ten days of sideways trading this week, so we should pay close attention to the following:
If BTC does not fall below 82563 again this week, or if a daily candle closes above 86360, we can assume that the 87396–82563 move was a daily-timeframe correction of the 74968–87396 rally and has ended. If the 87396–82563 move is confirmed as the entire correction, it would be a strong correction.
Under this scenario, the rally from 82563 is on the same timeframe as the 74968–87396 rally; both are daily-timeframe moves.
If BTC falls below 82563 again this week, but stays above the blue 2/1 Gann angle line—around 79780–80100—we will continue, for now, to view the decline from 87396 as a correction of the 74968–87396 rally. A further break below 82563 would make this a complex correction. Once its endpoint is found, the subsequent rally would also be on the daily timeframe.
If this is only a daily-timeframe correction, it will most likely end this week, as its duration is already close to the limit for a daily-timeframe correction. If it does not end this week, consider the possibility that the correction is expanding to a higher timeframe.
In mid-June, I noted that the interim low was likely to occur from late June to early July. BTC then fell to 57800 and staged a V-shaped rebound ✅
On August 21, I clearly stated that 79500 was not the end of the rally. BTC then continued higher, reaching 82500 ✅
On September 18, I pointed out that 82300–74968 was the entire correction. BTC continued higher afterward, reaching a high of 87396 ✅
We have been tracking BTC's market structure consistently since 2025, and we have flagged most key turning points in advance. If you're interested in BTC, don't forget to like and follow. Your support also motivates me to keep posting 💗#BTC走势分析 $BTC
3
869
·
--
Nasdaq and Nvidia both hit new highs one after another—has a new round of gains in the U.S. stock market begun?
Next week’s gold price action is extremely critical! Where are the opportunities for #BTC, #ETH, and #CRCL?
In one video, I’ll clearly outline the next steps for each asset $BTC $ETH
Nasdaq and Nvidia both hit new highs one after another—has a new round of gains in the U.S. stock market begun?
Next week’s gold price action is extremely critical! Where are the opportunities for #BTC, #ETH, and #CRCL?
In one video, I’ll clearly outline the next steps for each asset $BTC $ETH
Next week’s gold price action is extremely critical! Where are the opportunities for #BTC, #ETH, and #CRCL?
In one video, I’ll clearly outline the next steps for each asset $BTC $ETH
888
·
--
After BTC broke through 86300, it once plunged to within less than 200 points of the previous high, but then suddenly violently pulled back. Why didn’t it break the previous high when it was just one step away? After the drop, why didn’t it also fall below the trading range?
At the end of May and early June, we suggested that the ETH downtrend would end around 1500. More than three months have passed. Since 1505, ETH’s highest gain has reached 86%. From 2807 onward, is what we’re seeing just a correction within the uptrend, or has a larger-scale correction already begun? Where should we look to enter next?
U.S. Treasury yields have been surging continuously, and gold—an asset that doesn’t pay interest—has clearly come under pressure. When will a smooth, flowing market finally arrive?
Also, we’ve found that the U.S. stock market may already be at the starting point of a new round of trend.
In tomorrow’s video, I’ll go through $BTC $ETH gold and the entire U.S. stock market. Could there be good trading opportunities in October? I think there will be.
{future}(ETHUSDT)
{future}(BTCUSDT)
After BTC broke through 86300, it once plunged to within less than 200 points of the previous high, but then suddenly violently pulled back. Why didn’t it break the previous high when it was just one step away? After the drop, why didn’t it also fall below the trading range?
At the end of May and early June, we suggested that the ETH downtrend would end around 1500. More than three months have passed. Since 1505, ETH’s highest gain has reached 86%. From 2807 onward, is what we’re seeing just a correction within the uptrend, or has a larger-scale correction already begun? Where should we look to enter next?
U.S. Treasury yields have been surging continuously, and gold—an asset that doesn’t pay interest—has clearly come under pressure. When will a smooth, flowing market finally arrive?
Also, we’ve found that the U.S. stock market may already be at the starting point of a new round of trend.
In tomorrow’s video, I’ll go through $BTC $ETH gold and the entire U.S. stock market. Could there be good trading opportunities in October? I think there will be.
At the end of May and early June, we suggested that the ETH downtrend would end around 1500. More than three months have passed. Since 1505, ETH’s highest gain has reached 86%. From 2807 onward, is what we’re seeing just a correction within the uptrend, or has a larger-scale correction already begun? Where should we look to enter next?
U.S. Treasury yields have been surging continuously, and gold—an asset that doesn’t pay interest—has clearly come under pressure. When will a smooth, flowing market finally arrive?
Also, we’ve found that the U.S. stock market may already be at the starting point of a new round of trend.
In tomorrow’s video, I’ll go through $BTC $ETH gold and the entire U.S. stock market. Could there be good trading opportunities in October? I think there will be.

1
5
4.1k
·
--
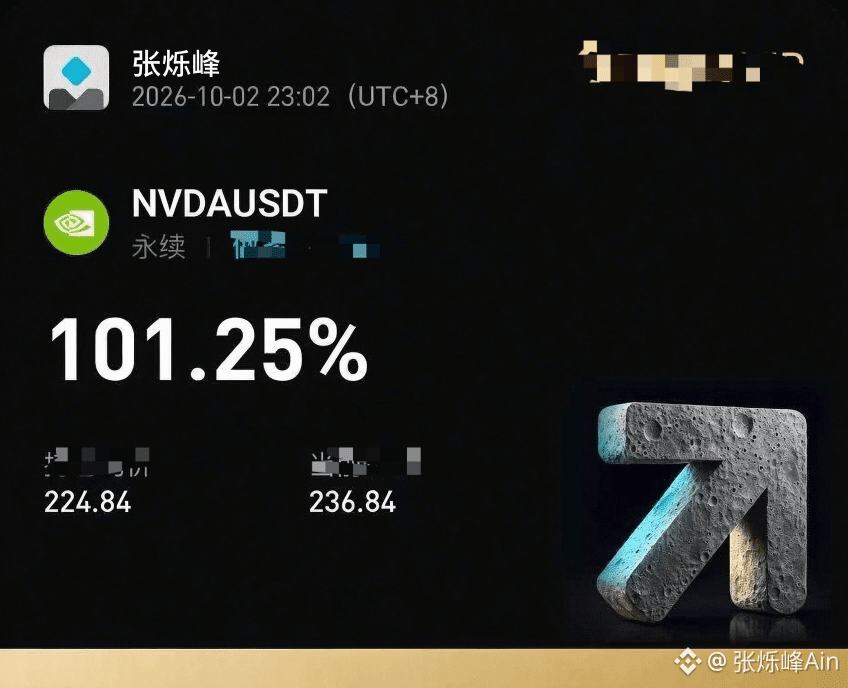
As early as September 20, 2025, I recommended NVDA to everyone. A year later, Nvidia is now at 237+.
In a tweet dated September 10, 2026, it was said that Nvidia’s adjustment would end above 205, and then it would quickly break 236.54; afterward, Nvidia fell to 208.93V ✅
To align knowledge with action—in line with that—on September 25 we entered a long position from the right side. Nvidia’s走势 since September 10 has perfectly matched expectations. So how should we look at what comes next?
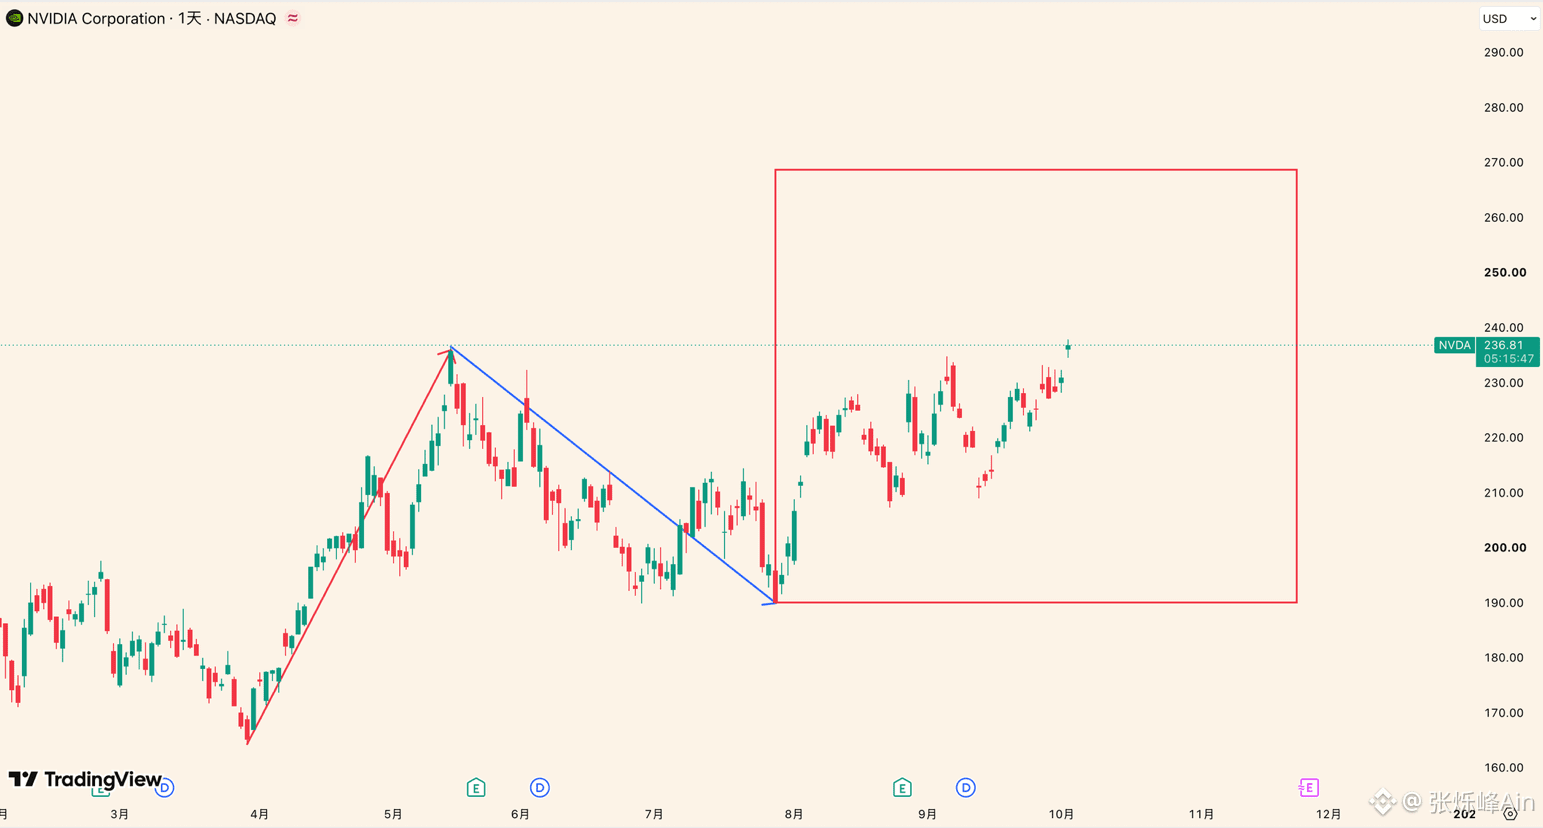
As shown in Figure 1, at a smaller level, the red segment is an upswing at the daily-chart level, while the blue segment is a pullback against it. In this path, the move starting from 208.93 is at least an upswing of the same level as the red segment. The observation point is at 226.6—if it can hold above that level, the uptrend still has momentum.
The trend outlook has never changed since 2025: bullish in the long run—hold long term.
As early as September 20, 2025, I recommended NVDA to everyone. A year later, Nvidia is now at 237+.
In a tweet dated September 10, 2026, it was said that Nvidia’s adjustment would end above 205, and then it would quickly break 236.54; afterward, Nvidia fell to 208.93V ✅
To align knowledge with action—in line with that—on September 25 we entered a long position from the right side. Nvidia’s走势 since September 10 has perfectly matched expectations. So how should we look at what comes next?
As shown in Figure 1, at a smaller level, the red segment is an upswing at the daily-chart level, while the blue segment is a pullback against it. In this path, the move starting from 208.93 is at least an upswing of the same level as the red segment. The observation point is at 226.6—if it can hold above that level, the uptrend still has momentum.
The trend outlook has never changed since 2025: bullish in the long run—hold long term.
In a tweet dated September 10, 2026, it was said that Nvidia’s adjustment would end above 205, and then it would quickly break 236.54; afterward, Nvidia fell to 208.93V ✅
To align knowledge with action—in line with that—on September 25 we entered a long position from the right side. Nvidia’s走势 since September 10 has perfectly matched expectations. So how should we look at what comes next?
As shown in Figure 1, at a smaller level, the red segment is an upswing at the daily-chart level, while the blue segment is a pullback against it. In this path, the move starting from 208.93 is at least an upswing of the same level as the red segment. The observation point is at 226.6—if it can hold above that level, the uptrend still has momentum.
The trend outlook has never changed since 2025: bullish in the long run—hold long term.

706
·
--
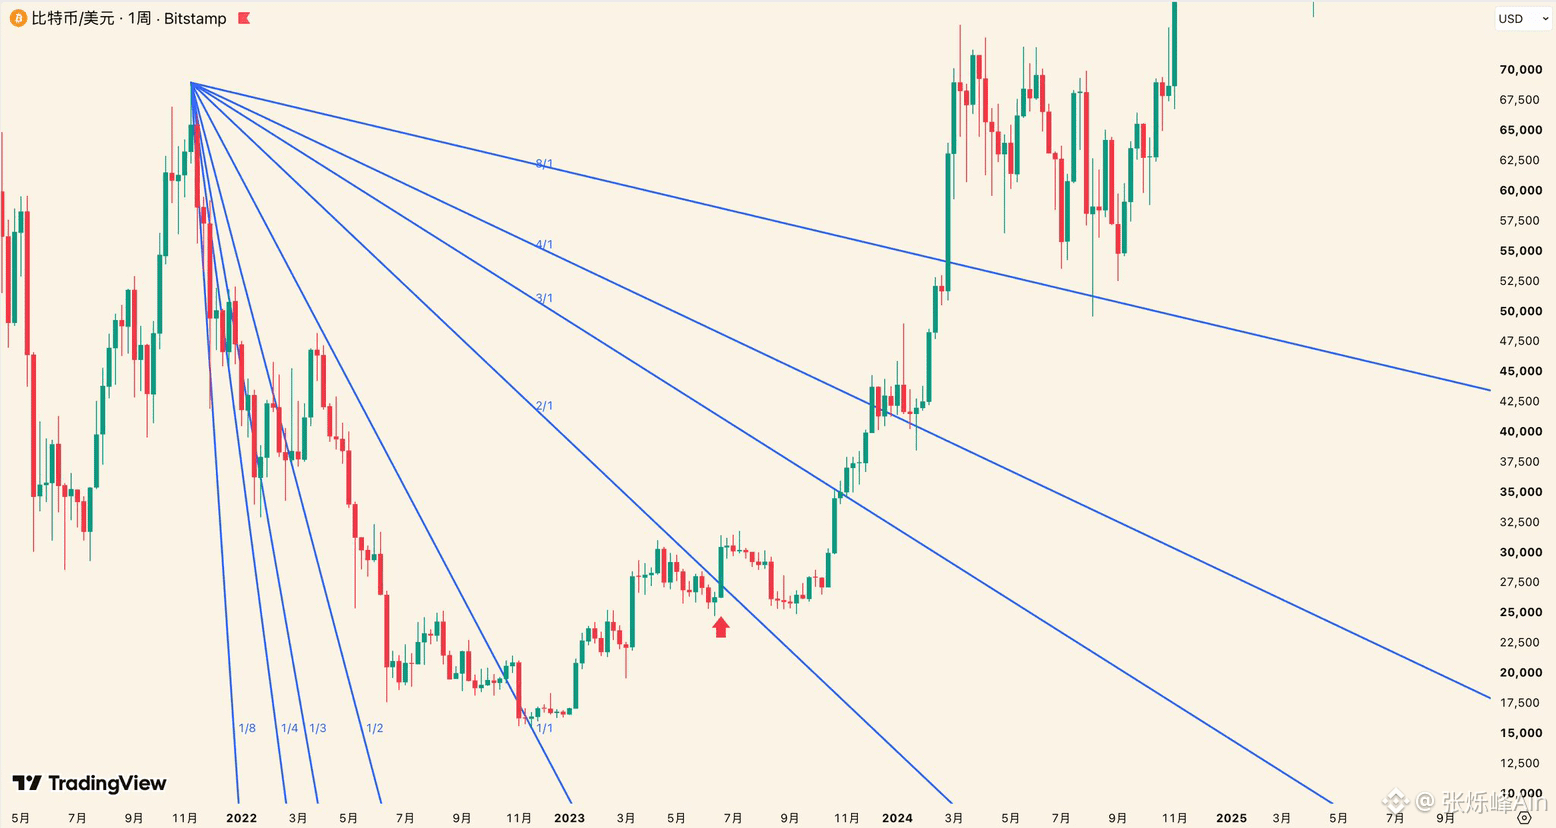
Why is it more likely that the BTC started from 87395 to move downward is an adjustment rather than a brand-new decline? Understanding this is very important for us to handle subsequent BTC trading:
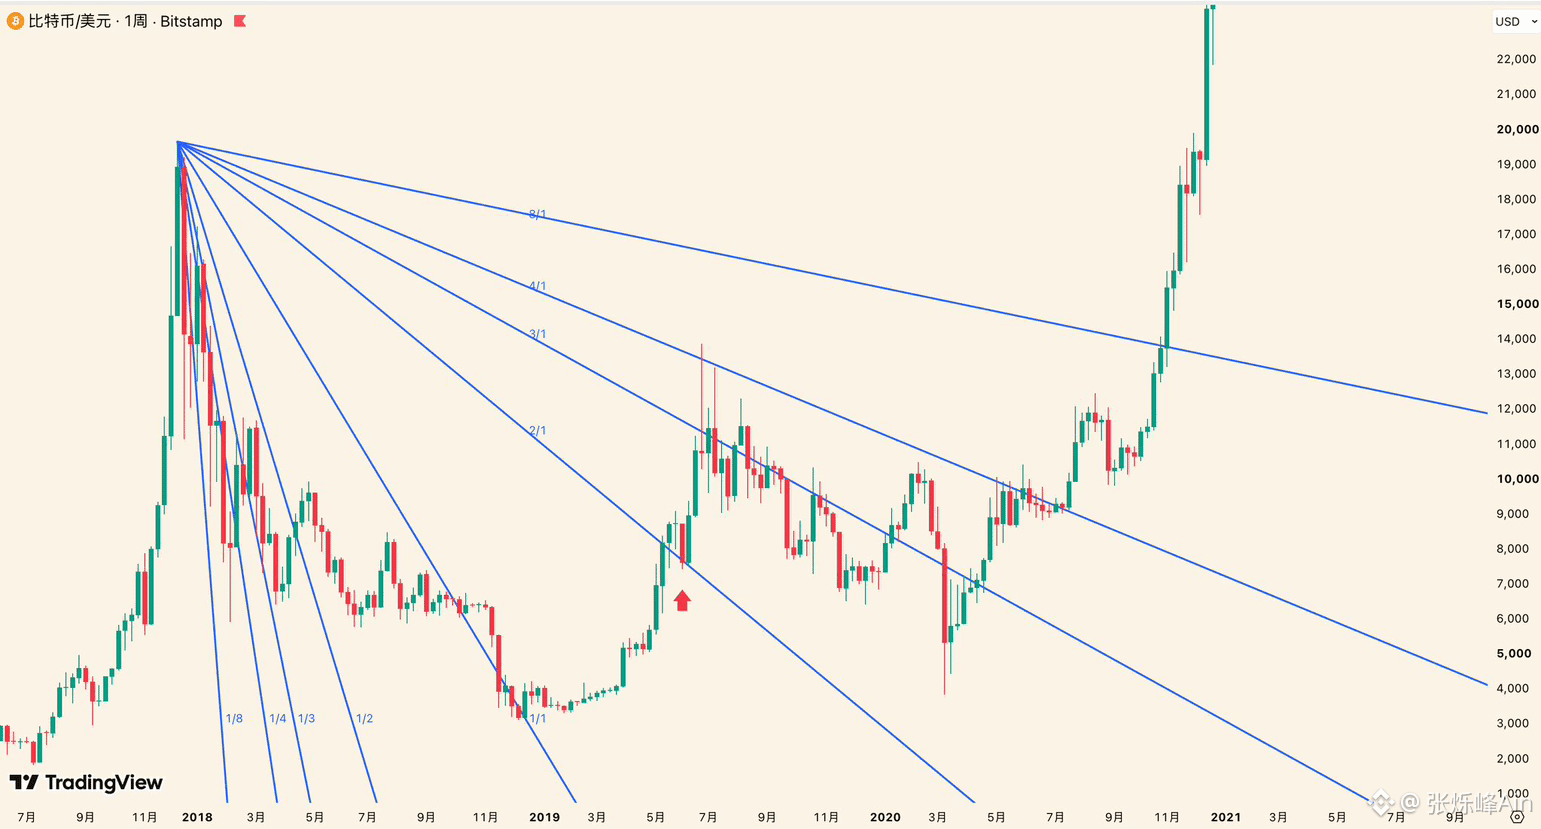
As shown in Figure 1, after BTC broke through the blue Gann 2/1 angle line in 2018, it then went through a round of adjustments targeting the rise from 3156 to 13970. After the adjustment ended, BTC entered a highly explosive uptrend during the 2020–2021 bull market;
Looking at Figure 2, in 2023 BTC again broke through the 2/1 level, and then likewise started running an adjustment targeting the rise from 15476 to 31804. After the adjustment ended at 24901, BTC rallied all the way to 73777;
On September 21, 2026, BTC broke through 2/1 for the third time. After the breakout, the market entered another adjustment phase.
If this time still follows the structure of the first two rounds, what will happen after the adjustment ends?
History won’t simply repeat itself, but the structure of each BTC bull-bear cycle is always surprisingly similar.
Careful friends will notice that after BTC broke through 2/1 in 2018, the adjustment lasted 261 days, with a maximum drawdown of 72.93%. In the second round, this time shortened to 60 days, and the maximum drawdown dropped to 21.71%. Why did the adjustment time keep getting shorter and the drawdown also keep getting smaller?
The main reason is that BTC’s size and liquidity are continuously expanding, and the participation of institutions and global capital has been increasing as well. Therefore, that kind of huge volatility in the early days will become harder and harder to occur.
Also, as the market matures and price discovery efficiency improves, adjustment amplitudes often converge, and the pace becomes faster too—something similar to the development of the gold market.
If this decline starting from 87395 is still merely a pullback after the 2/1 breakout, then this adjustment is the last chance to get on board for friends who missed the move that started from 57800. Recent market action has indeed been a bit dull, but I will continue to track BTC’s行情. Everyone, stay tuned. Real-time market analysis and trading strategies will also be shared in the 🐼 group.
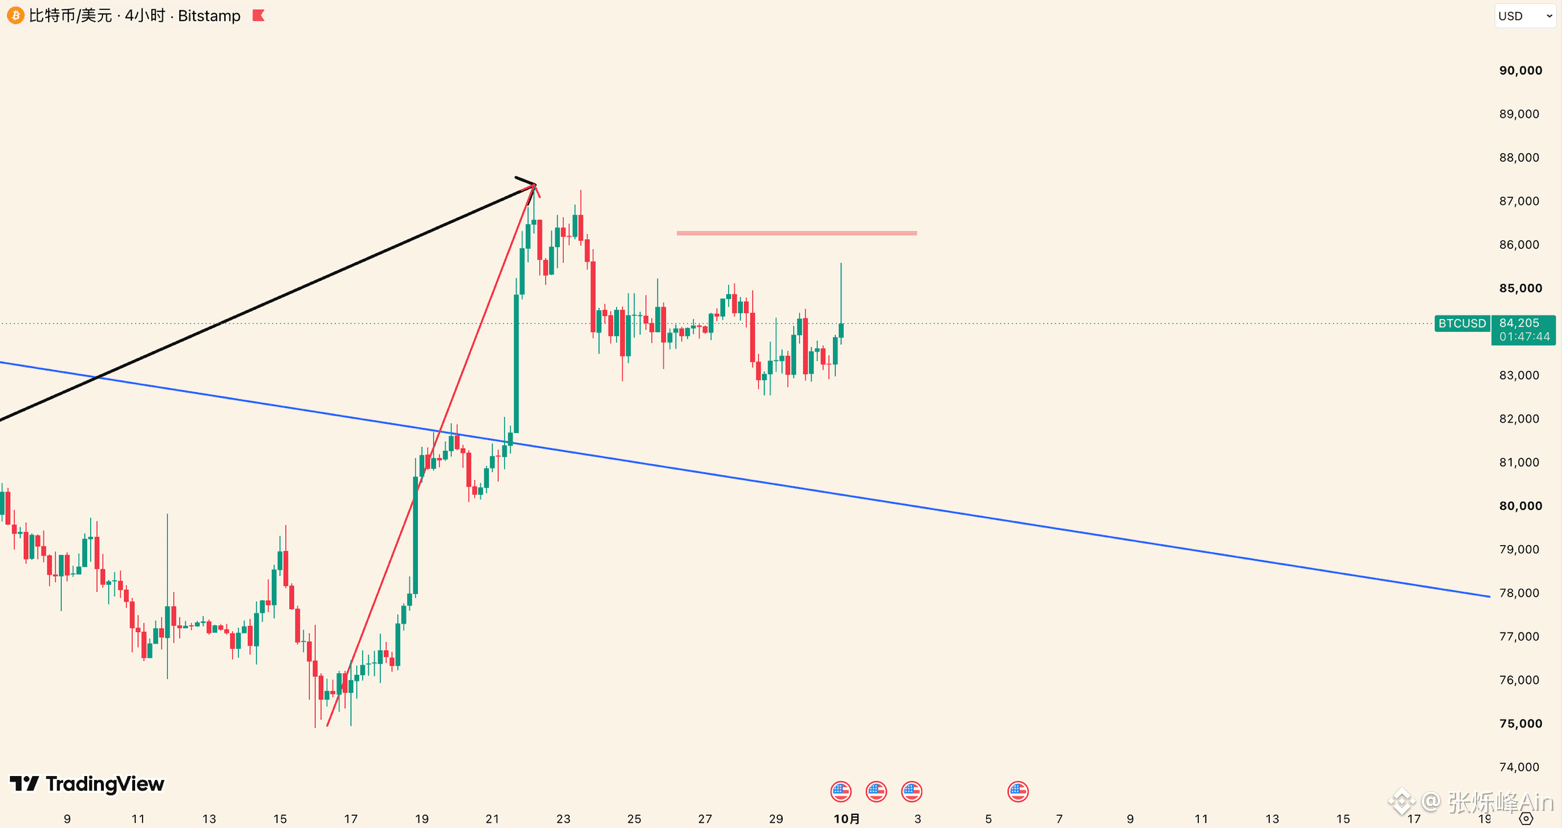
On smaller timeframes as shown in Figure 4, if the pullback starting from 87395 is a minor pullback within the red segment in Figure 4, then only after it breaks and holds above the right side of 86300 can we assume the adjustment has ended; otherwise, we should not assume the adjustment has ended yet.
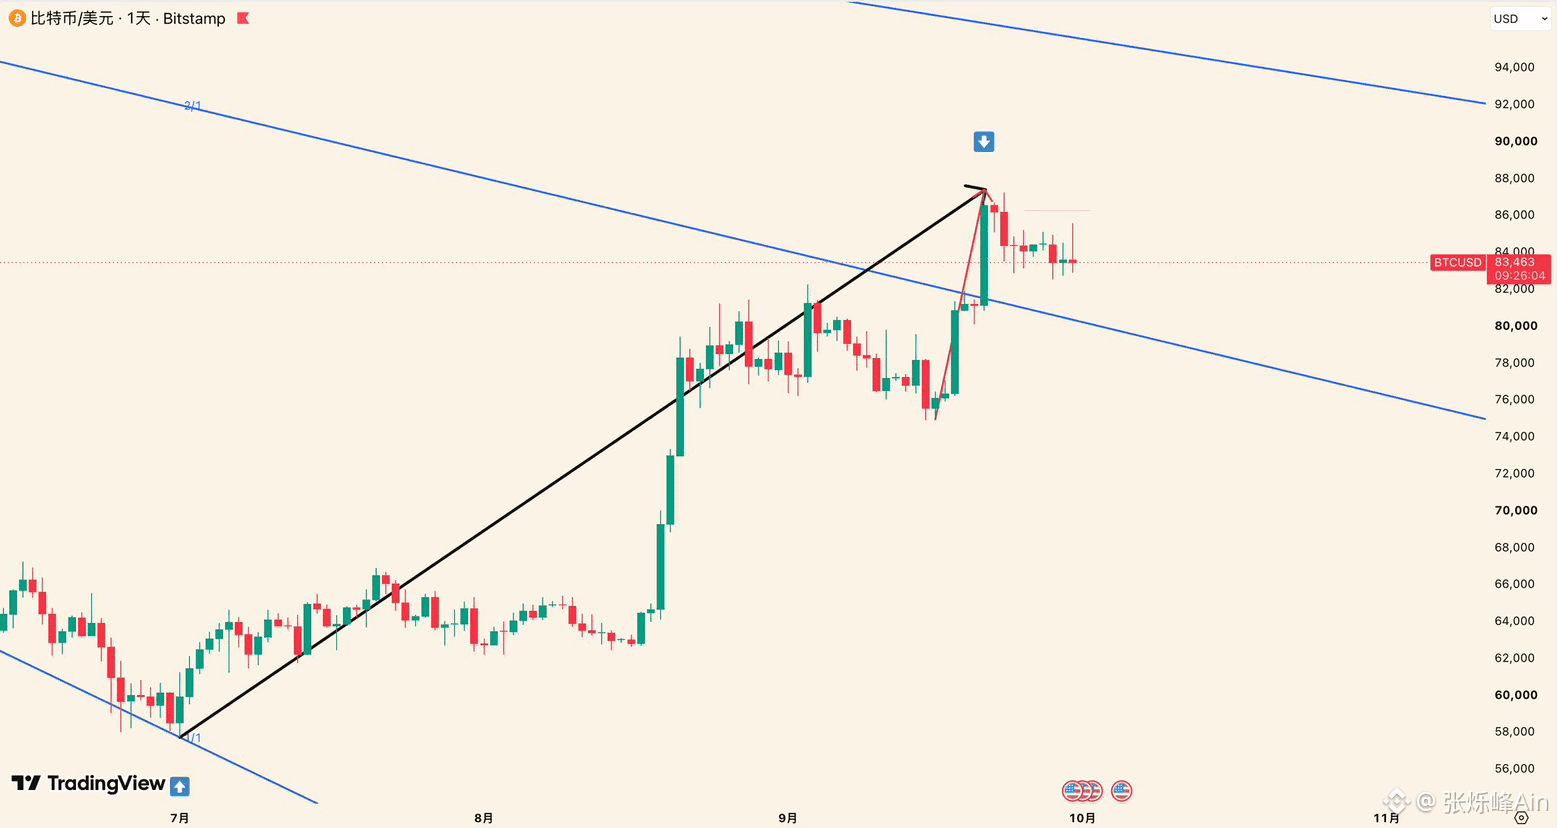
The 2/1 below (79900–80150) is the key to distinguishing whether the adjustment is targeting the entire black segment or only the red segment. It’s important to note that the longer the horizontal consolidation time here lasts, the higher the probability that what starts running from 87395 is a pullback rather than a new decline. Adjustment period: $BTC {future}(BTCUSDT)
Why is it more likely that the BTC started from 87395 to move downward is an adjustment rather than a brand-new decline? Understanding this is very important for us to handle subsequent BTC trading:
As shown in Figure 1, after BTC broke through the blue Gann 2/1 angle line in 2018, it then went through a round of adjustments targeting the rise from 3156 to 13970. After the adjustment ended, BTC entered a highly explosive uptrend during the 2020–2021 bull market;
Looking at Figure 2, in 2023 BTC again broke through the 2/1 level, and then likewise started running an adjustment targeting the rise from 15476 to 31804. After the adjustment ended at 24901, BTC rallied all the way to 73777;
On September 21, 2026, BTC broke through 2/1 for the third time. After the breakout, the market entered another adjustment phase.
If this time still follows the structure of the first two rounds, what will happen after the adjustment ends?
History won’t simply repeat itself, but the structure of each BTC bull-bear cycle is always surprisingly similar.
Careful friends will notice that after BTC broke through 2/1 in 2018, the adjustment lasted 261 days, with a maximum drawdown of 72.93%. In the second round, this time shortened to 60 days, and the maximum drawdown dropped to 21.71%. Why did the adjustment time keep getting shorter and the drawdown also keep getting smaller?
The main reason is that BTC’s size and liquidity are continuously expanding, and the participation of institutions and global capital has been increasing as well. Therefore, that kind of huge volatility in the early days will become harder and harder to occur.
Also, as the market matures and price discovery efficiency improves, adjustment amplitudes often converge, and the pace becomes faster too—something similar to the development of the gold market.
If this decline starting from 87395 is still merely a pullback after the 2/1 breakout, then this adjustment is the last chance to get on board for friends who missed the move that started from 57800. Recent market action has indeed been a bit dull, but I will continue to track BTC’s行情. Everyone, stay tuned. Real-time market analysis and trading strategies will also be shared in the 🐼 group.
On smaller timeframes as shown in Figure 4, if the pullback starting from 87395 is a minor pullback within the red segment in Figure 4, then only after it breaks and holds above the right side of 86300 can we assume the adjustment has ended; otherwise, we should not assume the adjustment has ended yet.
The 2/1 below (79900–80150) is the key to distinguishing whether the adjustment is targeting the entire black segment or only the red segment. It’s important to note that the longer the horizontal consolidation time here lasts, the higher the probability that what starts running from 87395 is a pullback rather than a new decline. Adjustment period: $BTC
As shown in Figure 1, after BTC broke through the blue Gann 2/1 angle line in 2018, it then went through a round of adjustments targeting the rise from 3156 to 13970. After the adjustment ended, BTC entered a highly explosive uptrend during the 2020–2021 bull market;
Looking at Figure 2, in 2023 BTC again broke through the 2/1 level, and then likewise started running an adjustment targeting the rise from 15476 to 31804. After the adjustment ended at 24901, BTC rallied all the way to 73777;
On September 21, 2026, BTC broke through 2/1 for the third time. After the breakout, the market entered another adjustment phase.
If this time still follows the structure of the first two rounds, what will happen after the adjustment ends?
History won’t simply repeat itself, but the structure of each BTC bull-bear cycle is always surprisingly similar.
Careful friends will notice that after BTC broke through 2/1 in 2018, the adjustment lasted 261 days, with a maximum drawdown of 72.93%. In the second round, this time shortened to 60 days, and the maximum drawdown dropped to 21.71%. Why did the adjustment time keep getting shorter and the drawdown also keep getting smaller?
The main reason is that BTC’s size and liquidity are continuously expanding, and the participation of institutions and global capital has been increasing as well. Therefore, that kind of huge volatility in the early days will become harder and harder to occur.
Also, as the market matures and price discovery efficiency improves, adjustment amplitudes often converge, and the pace becomes faster too—something similar to the development of the gold market.
If this decline starting from 87395 is still merely a pullback after the 2/1 breakout, then this adjustment is the last chance to get on board for friends who missed the move that started from 57800. Recent market action has indeed been a bit dull, but I will continue to track BTC’s行情. Everyone, stay tuned. Real-time market analysis and trading strategies will also be shared in the 🐼 group.
On smaller timeframes as shown in Figure 4, if the pullback starting from 87395 is a minor pullback within the red segment in Figure 4, then only after it breaks and holds above the right side of 86300 can we assume the adjustment has ended; otherwise, we should not assume the adjustment has ended yet.
The 2/1 below (79900–80150) is the key to distinguishing whether the adjustment is targeting the entire black segment or only the red segment. It’s important to note that the longer the horizontal consolidation time here lasts, the higher the probability that what starts running from 87395 is a pullback rather than a new decline. Adjustment period: $BTC
3
1.4k
·
--
Am I possibly the first blogger to say that the BTC bear market has ended?
In the June posts and videos, I mentioned that BTC’s interim low would occur around the end of June to early July on the Gann timeline, with the endpoint at 58,000; then after that, BTC dropped to 57,800 on July 1 ✅
And also possibly the first blogger on the whole internet to say that BTC would start to pull back after 87,395?
Starting in mid-September, I repeatedly emphasized that a pullback is about to begin—at least a daily-chart-level pullback targeting the rise from 74,967 to 87,395. Then we saw that the pullback that began at 87,395 has already been ongoing for a week ✅
Maybe I’m still the earliest blogger to catch the adjustment endpoint:
In yesterday’s post, we said that BTC breaking above 86,380 would allow us to assume that the pullback of the red segment shown in the chart has already ended. Today, the high reached 85,650, then it pulled back—so we do not yet assume that the adjustment is over.
Going forward, if there are no highs above 85,650, then 82,593–85,650 will be considered the rebound against the decline from 87,395 to 82,593, and that rebound would already be finished. The support from the Gann angle line 2/1 below (79,800–80,100) needs special attention—this is the line that determines market strength versus weakness.
Time-wise, we need to watch early October and early November. After the pullback that began at 87,395 ends, BTC will continue to rise. The exact time when the adjustment ends will be followed up later based on the BTC structure across larger and smaller timeframes—everyone, please stay tuned. $BTC
{future}(BTCUSDT)
#BTC走势分析
Am I possibly the first blogger to say that the BTC bear market has ended?
In the June posts and videos, I mentioned that BTC’s interim low would occur around the end of June to early July on the Gann timeline, with the endpoint at 58,000; then after that, BTC dropped to 57,800 on July 1 ✅
And also possibly the first blogger on the whole internet to say that BTC would start to pull back after 87,395?
Starting in mid-September, I repeatedly emphasized that a pullback is about to begin—at least a daily-chart-level pullback targeting the rise from 74,967 to 87,395. Then we saw that the pullback that began at 87,395 has already been ongoing for a week ✅
Maybe I’m still the earliest blogger to catch the adjustment endpoint:
In yesterday’s post, we said that BTC breaking above 86,380 would allow us to assume that the pullback of the red segment shown in the chart has already ended. Today, the high reached 85,650, then it pulled back—so we do not yet assume that the adjustment is over.
Going forward, if there are no highs above 85,650, then 82,593–85,650 will be considered the rebound against the decline from 87,395 to 82,593, and that rebound would already be finished. The support from the Gann angle line 2/1 below (79,800–80,100) needs special attention—this is the line that determines market strength versus weakness.
Time-wise, we need to watch early October and early November. After the pullback that began at 87,395 ends, BTC will continue to rise. The exact time when the adjustment ends will be followed up later based on the BTC structure across larger and smaller timeframes—everyone, please stay tuned. $BTC
#BTC走势分析
In the June posts and videos, I mentioned that BTC’s interim low would occur around the end of June to early July on the Gann timeline, with the endpoint at 58,000; then after that, BTC dropped to 57,800 on July 1 ✅
And also possibly the first blogger on the whole internet to say that BTC would start to pull back after 87,395?
Starting in mid-September, I repeatedly emphasized that a pullback is about to begin—at least a daily-chart-level pullback targeting the rise from 74,967 to 87,395. Then we saw that the pullback that began at 87,395 has already been ongoing for a week ✅
Maybe I’m still the earliest blogger to catch the adjustment endpoint:
In yesterday’s post, we said that BTC breaking above 86,380 would allow us to assume that the pullback of the red segment shown in the chart has already ended. Today, the high reached 85,650, then it pulled back—so we do not yet assume that the adjustment is over.
Going forward, if there are no highs above 85,650, then 82,593–85,650 will be considered the rebound against the decline from 87,395 to 82,593, and that rebound would already be finished. The support from the Gann angle line 2/1 below (79,800–80,100) needs special attention—this is the line that determines market strength versus weakness.
Time-wise, we need to watch early October and early November. After the pullback that began at 87,395 ends, BTC will continue to rise. The exact time when the adjustment ends will be followed up later based on the BTC structure across larger and smaller timeframes—everyone, please stay tuned. $BTC
#BTC走势分析
4.1k
·
--
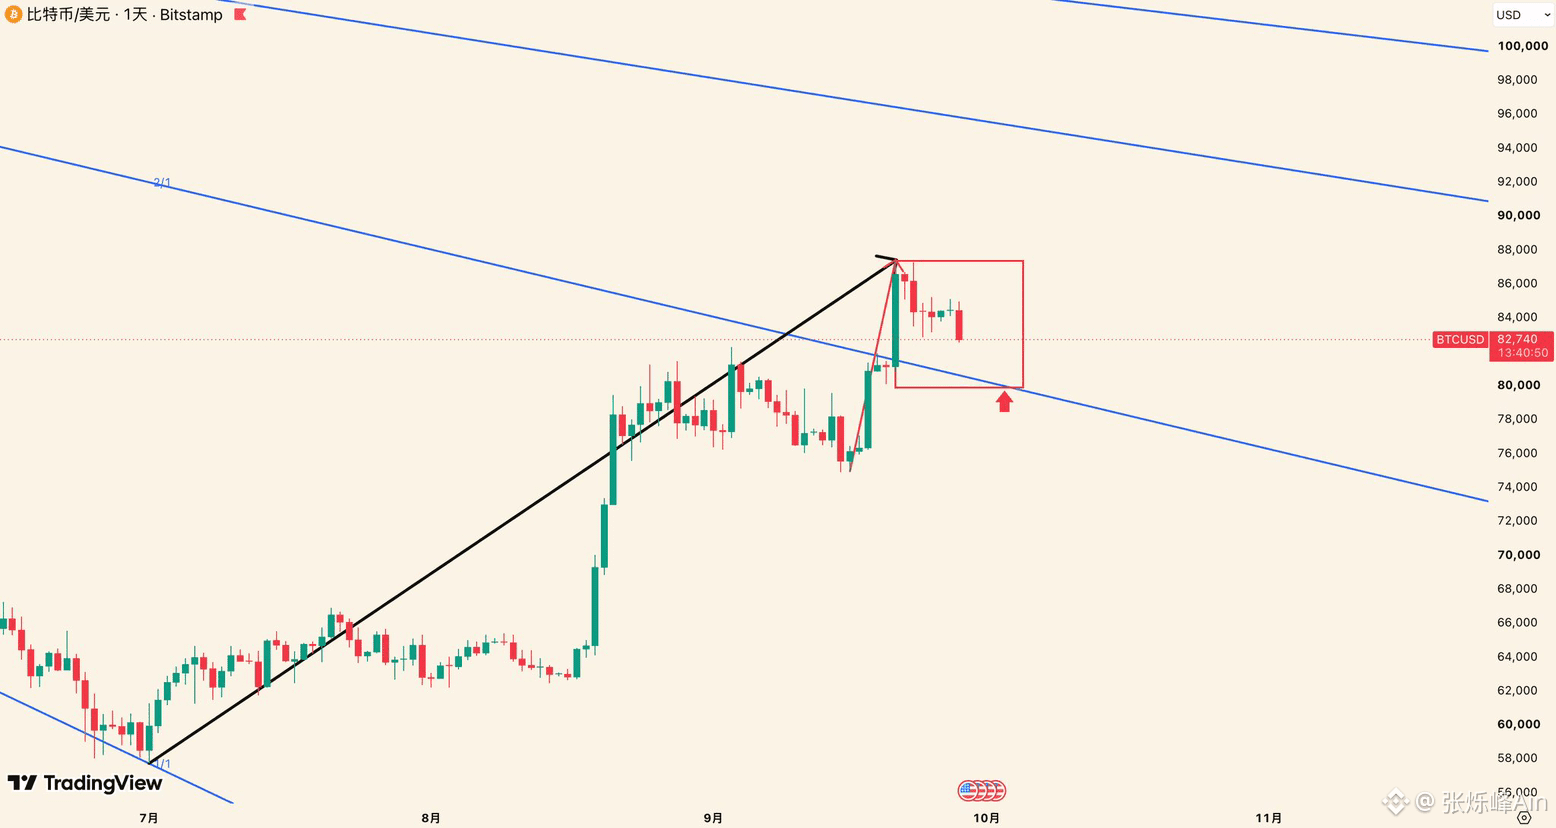
BTC has been running since 87395 on a callback. The Gann angle lines 2/1 are the strength/weakness watershed.
Since we proposed in our June videos that July 1 is a cyclical low point, BTC has risen 51.2% from 57800.
On September 24, we handled long positions on altcoin perpetual contracts and the high-cost spot buys that had chased longs earlier, and additionally opened shorts on BTC and ETH. We took profit on the shorts yesterday; the profit wasn’t large—so it’s more of a short-term swing.
The observation level below is still 2/1 (79900-80300). Whether this area can act as support directly determines if the decline that started at 87395 is a pullback only for the red segment or a full pullback of the entire black segment.
For the possible end time of the pullback, refer to early October / early November. At that time, judge whether the pullback has ended based on the specific structure.
I’ve said more than once that BTC’s trend is certain. However, as time passes, this view may be questioned by more and more people, and I won’t be surprised. Those who can capture the next wave that exceeds the rise from 57800-87395 are destined to be a minority—because the 80/20 rule will always apply.$BTC
{future}(BTCUSDT)
#BTC走势分析
BTC has been running since 87395 on a callback. The Gann angle lines 2/1 are the strength/weakness watershed.
Since we proposed in our June videos that July 1 is a cyclical low point, BTC has risen 51.2% from 57800.
On September 24, we handled long positions on altcoin perpetual contracts and the high-cost spot buys that had chased longs earlier, and additionally opened shorts on BTC and ETH. We took profit on the shorts yesterday; the profit wasn’t large—so it’s more of a short-term swing.
The observation level below is still 2/1 (79900-80300). Whether this area can act as support directly determines if the decline that started at 87395 is a pullback only for the red segment or a full pullback of the entire black segment.
For the possible end time of the pullback, refer to early October / early November. At that time, judge whether the pullback has ended based on the specific structure.
I’ve said more than once that BTC’s trend is certain. However, as time passes, this view may be questioned by more and more people, and I won’t be surprised. Those who can capture the next wave that exceeds the rise from 57800-87395 are destined to be a minority—because the 80/20 rule will always apply.$BTC
#BTC走势分析
Since we proposed in our June videos that July 1 is a cyclical low point, BTC has risen 51.2% from 57800.
On September 24, we handled long positions on altcoin perpetual contracts and the high-cost spot buys that had chased longs earlier, and additionally opened shorts on BTC and ETH. We took profit on the shorts yesterday; the profit wasn’t large—so it’s more of a short-term swing.
The observation level below is still 2/1 (79900-80300). Whether this area can act as support directly determines if the decline that started at 87395 is a pullback only for the red segment or a full pullback of the entire black segment.
For the possible end time of the pullback, refer to early October / early November. At that time, judge whether the pullback has ended based on the specific structure.
I’ve said more than once that BTC’s trend is certain. However, as time passes, this view may be questioned by more and more people, and I won’t be surprised. Those who can capture the next wave that exceeds the rise from 57800-87395 are destined to be a minority—because the 80/20 rule will always apply.$BTC
#BTC走势分析

2
1.3k
·
--
#BTC #ETH Will there be new highs?
#XAU #Gold When will the pullback that started from 4697 end?
#SPCX #SNDK How should we handle next week’s US stocks?
#BTC #ETH Will there be new highs?
#XAU #Gold When will the pullback that started from 4697 end?
#SPCX #SNDK How should we handle next week’s US stocks?
#XAU #Gold When will the pullback that started from 4697 end?
#SPCX #SNDK How should we handle next week’s US stocks?
1
1.1k
·
--
A week has passed, and the calls we made in our previous video are gradually coming to fruition:
In the Sept 20 video, we said that the adjustment for $BTC might already have ended at 74,968; subsequent tweets followed up on this view again—breaking 80,000 confirmed the adjustment was complete. Then we saw BTC break above 80,000 and peak at 87,396✅
As for the storage stocks represented by $SNDK : our view was that the rebound was not yet over, and afterward, both Sandisk, Micron, and Hynix all broke above the Sept 17 high✅
$SPCX also played out as expected: for now, the first wave of the rebound that started with 104 occurrences has ended, and it has begun entering a correction targeting this leg of the rally.
Next week we’ll move into October. Whether in the US stock market or crypto, both are at a crossroads:
How far can this round of BTC’s uptrend still go?
After the SPCX correction ends, how will the next segment of the market move?
The Nasdaq has already made a new high, while the S&P is still a bit off; will gold see another wave of upside comparable to the move in the 3942–4697 range?
In the new video tomorrow afternoon, I’ll follow up on all of the above—walking through from the bigger timeframe to the smaller ones—and share the latest trend assessments along with my ideas for what to do next.
Since the update in 2025, we’ve been continuously updating the market developments for Bitcoin, gold, and the US stock market. Our weekly video analysis is designed to help everyone understand which stage each asset is in and what to expect next. New friends, feel free to follow; and longtime friends, please like and save the video.
On Sept 27, see you then 🐼
{future}(BTCUSDT)
A week has passed, and the calls we made in our previous video are gradually coming to fruition:
In the Sept 20 video, we said that the adjustment for $BTC might already have ended at 74,968; subsequent tweets followed up on this view again—breaking 80,000 confirmed the adjustment was complete. Then we saw BTC break above 80,000 and peak at 87,396✅
As for the storage stocks represented by $SNDK : our view was that the rebound was not yet over, and afterward, both Sandisk, Micron, and Hynix all broke above the Sept 17 high✅
$SPCX also played out as expected: for now, the first wave of the rebound that started with 104 occurrences has ended, and it has begun entering a correction targeting this leg of the rally.
Next week we’ll move into October. Whether in the US stock market or crypto, both are at a crossroads:
How far can this round of BTC’s uptrend still go?
After the SPCX correction ends, how will the next segment of the market move?
The Nasdaq has already made a new high, while the S&P is still a bit off; will gold see another wave of upside comparable to the move in the 3942–4697 range?
In the new video tomorrow afternoon, I’ll follow up on all of the above—walking through from the bigger timeframe to the smaller ones—and share the latest trend assessments along with my ideas for what to do next.
Since the update in 2025, we’ve been continuously updating the market developments for Bitcoin, gold, and the US stock market. Our weekly video analysis is designed to help everyone understand which stage each asset is in and what to expect next. New friends, feel free to follow; and longtime friends, please like and save the video.
On Sept 27, see you then 🐼
In the Sept 20 video, we said that the adjustment for $BTC might already have ended at 74,968; subsequent tweets followed up on this view again—breaking 80,000 confirmed the adjustment was complete. Then we saw BTC break above 80,000 and peak at 87,396✅
As for the storage stocks represented by $SNDK : our view was that the rebound was not yet over, and afterward, both Sandisk, Micron, and Hynix all broke above the Sept 17 high✅
$SPCX also played out as expected: for now, the first wave of the rebound that started with 104 occurrences has ended, and it has begun entering a correction targeting this leg of the rally.
Next week we’ll move into October. Whether in the US stock market or crypto, both are at a crossroads:
How far can this round of BTC’s uptrend still go?
After the SPCX correction ends, how will the next segment of the market move?
The Nasdaq has already made a new high, while the S&P is still a bit off; will gold see another wave of upside comparable to the move in the 3942–4697 range?
In the new video tomorrow afternoon, I’ll follow up on all of the above—walking through from the bigger timeframe to the smaller ones—and share the latest trend assessments along with my ideas for what to do next.
Since the update in 2025, we’ve been continuously updating the market developments for Bitcoin, gold, and the US stock market. Our weekly video analysis is designed to help everyone understand which stage each asset is in and what to expect next. New friends, feel free to follow; and longtime friends, please like and save the video.
On Sept 27, see you then 🐼

1.1k
·
--
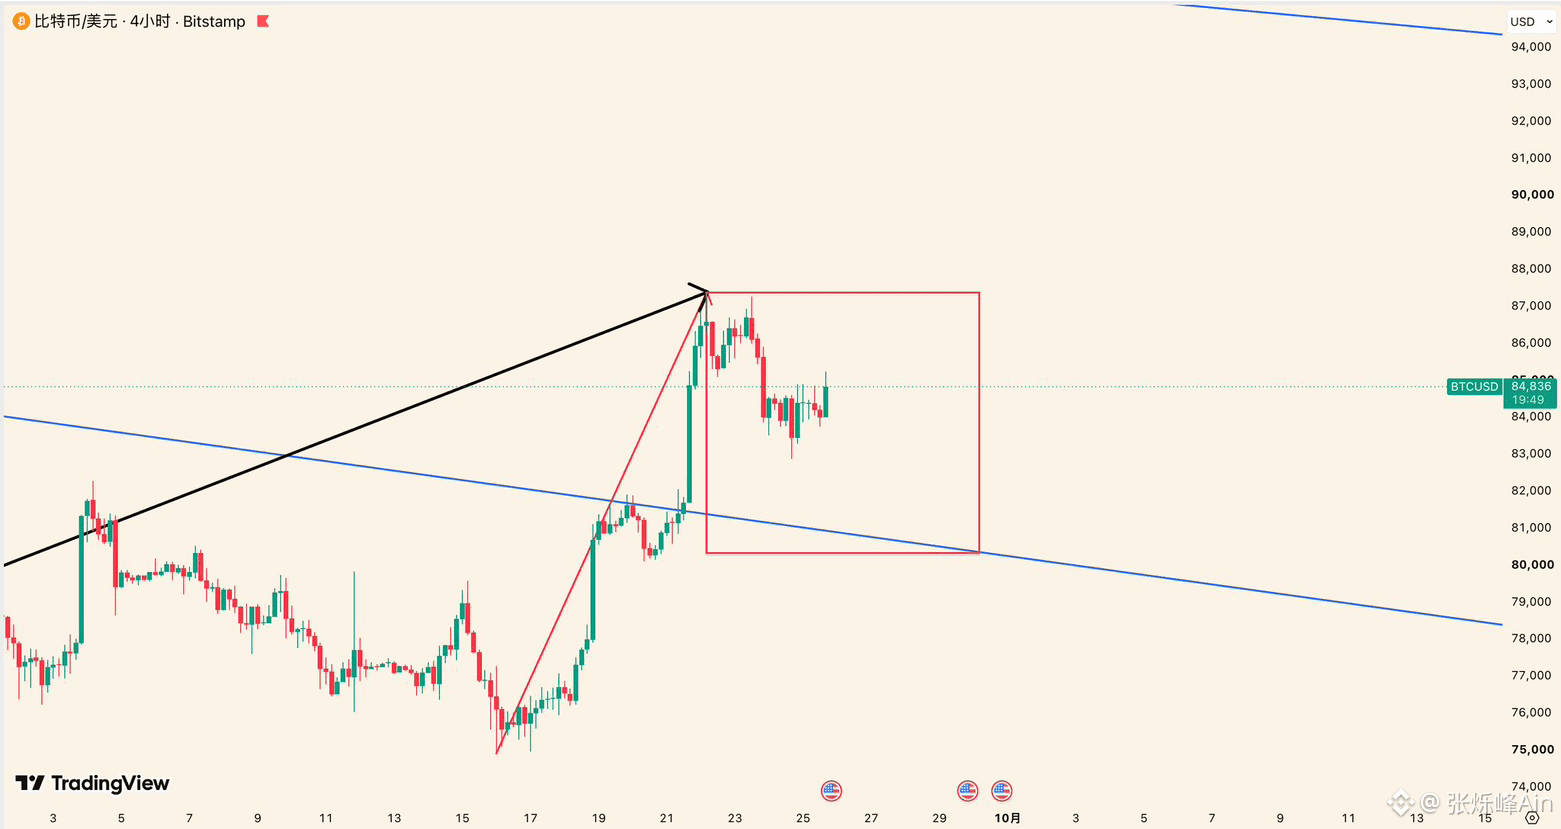
In the tweet on September 23, it said that when BTC broke below 84,500, it marked the start of a pullback for the uptrend from 74,967–87,395. After BTC broke 84,500, it then fell to 82,874—exactly landing within our target range of 83,400–82,600.
Since BTC has risen from 82,874 by more than 2,000 points+, what should we look at next?
In the video on Sunday, it was mentioned that the blue Gann angle line 2/1 in the chart (currently at 80,300–80,700) is the bull–bear boundary. As long as BTC can hold above it, the decline starting from 87,395 can be treated as a pullback against the rise in the red segment shown in the chart—this pullback is at a daily-chart level. Once the end of the pullback is found, the next upward move has the potential to test 89,800.
If BTC breaks below the blue Gann angle line 2/1 and cannot reclaim it, then the pullback expands into the entire uptrend that started from 57,800—this is at a weekly-chart level.
Tracking the smaller timeframes every day is meant to help everyone understand how BTC’s market is progressing. Compared with trying to catch every opportunity on the small timeframe, it’s clearly easier to profit by finding chances to ride the larger timeframe trend.
Over the past year, using Gann theory we successfully called the bull top in October 2025, and the stage low point—57,800 on July 1, 2026—has also been verified. There are countless turning points at the next level as well.
My medium- to long-term buy/sell strategy and short-term swing updates are synchronized in real time in the 🐼 channel. If you’re interested, please ➡️$BTC
{future}(BTCUSDT)
#BTC走势分析
In the tweet on September 23, it said that when BTC broke below 84,500, it marked the start of a pullback for the uptrend from 74,967–87,395. After BTC broke 84,500, it then fell to 82,874—exactly landing within our target range of 83,400–82,600.
Since BTC has risen from 82,874 by more than 2,000 points+, what should we look at next?
In the video on Sunday, it was mentioned that the blue Gann angle line 2/1 in the chart (currently at 80,300–80,700) is the bull–bear boundary. As long as BTC can hold above it, the decline starting from 87,395 can be treated as a pullback against the rise in the red segment shown in the chart—this pullback is at a daily-chart level. Once the end of the pullback is found, the next upward move has the potential to test 89,800.
If BTC breaks below the blue Gann angle line 2/1 and cannot reclaim it, then the pullback expands into the entire uptrend that started from 57,800—this is at a weekly-chart level.
Tracking the smaller timeframes every day is meant to help everyone understand how BTC’s market is progressing. Compared with trying to catch every opportunity on the small timeframe, it’s clearly easier to profit by finding chances to ride the larger timeframe trend.
Over the past year, using Gann theory we successfully called the bull top in October 2025, and the stage low point—57,800 on July 1, 2026—has also been verified. There are countless turning points at the next level as well.
My medium- to long-term buy/sell strategy and short-term swing updates are synchronized in real time in the 🐼 channel. If you’re interested, please ➡️$BTC
#BTC走势分析
Since BTC has risen from 82,874 by more than 2,000 points+, what should we look at next?
In the video on Sunday, it was mentioned that the blue Gann angle line 2/1 in the chart (currently at 80,300–80,700) is the bull–bear boundary. As long as BTC can hold above it, the decline starting from 87,395 can be treated as a pullback against the rise in the red segment shown in the chart—this pullback is at a daily-chart level. Once the end of the pullback is found, the next upward move has the potential to test 89,800.
If BTC breaks below the blue Gann angle line 2/1 and cannot reclaim it, then the pullback expands into the entire uptrend that started from 57,800—this is at a weekly-chart level.
Tracking the smaller timeframes every day is meant to help everyone understand how BTC’s market is progressing. Compared with trying to catch every opportunity on the small timeframe, it’s clearly easier to profit by finding chances to ride the larger timeframe trend.
Over the past year, using Gann theory we successfully called the bull top in October 2025, and the stage low point—57,800 on July 1, 2026—has also been verified. There are countless turning points at the next level as well.
My medium- to long-term buy/sell strategy and short-term swing updates are synchronized in real time in the 🐼 channel. If you’re interested, please ➡️$BTC
#BTC走势分析
1.4k
·
--
BTC up is over? Will the bear return or will there be a correction?
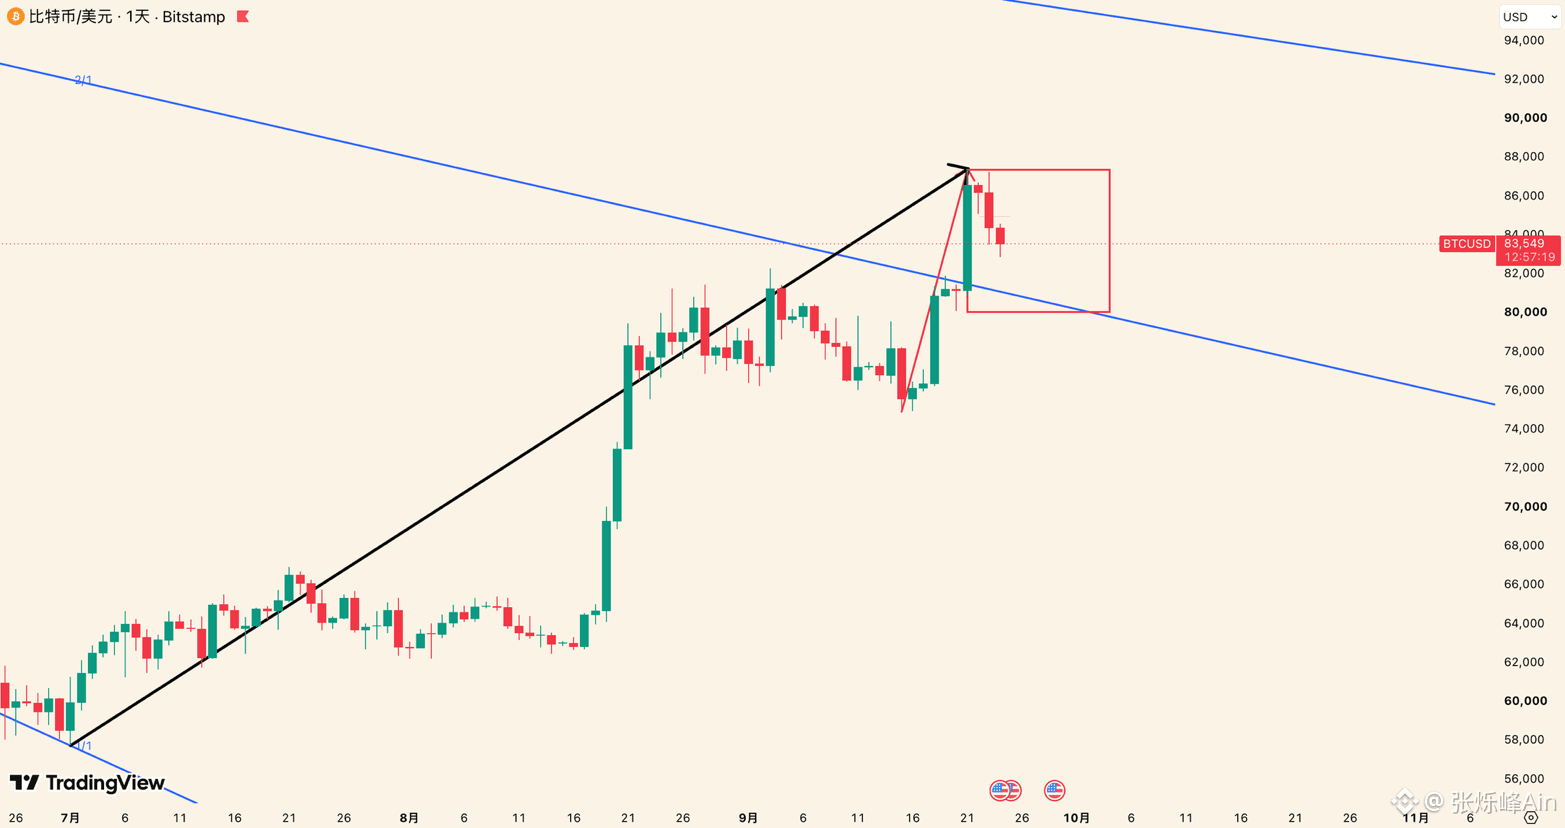
As mentioned in yesterday’s post, if BTC breaks below 84,500, it means a correction may have started. Today afternoon, BTC dropped to the support zone of 82,600–83,400 and then stopped falling. The price action over the coming days is very important—it will determine the market outlook for October and November.
If BTC still can’t hold above 85,000 for a long time, it means that at least the pullback of the rally from 74,967 to 87,395 has already begun. This pullback from 74,967 to 87,395 should not break the Enneagram angle line 2/1 (80,300–80,900). If it breaks below this range and cannot reclaim it, you should be cautious that the situation may escalate to a larger pullback covering the entire black segment shown in the chart.
From the July 1 low of 57,800, the black-segment rally lasted 82 days and the gain reached 51.84%. We captured most of this upswing, and we also did additional contract swing trades. The upcoming correction is an opportunity—after you find the correction’s turning point, the next wave of upward movement is likely to exceed the black segment.
$BTC
{future}(BTCUSDT)
#BTC走势分析
BTC up is over? Will the bear return or will there be a correction?
As mentioned in yesterday’s post, if BTC breaks below 84,500, it means a correction may have started. Today afternoon, BTC dropped to the support zone of 82,600–83,400 and then stopped falling. The price action over the coming days is very important—it will determine the market outlook for October and November.
If BTC still can’t hold above 85,000 for a long time, it means that at least the pullback of the rally from 74,967 to 87,395 has already begun. This pullback from 74,967 to 87,395 should not break the Enneagram angle line 2/1 (80,300–80,900). If it breaks below this range and cannot reclaim it, you should be cautious that the situation may escalate to a larger pullback covering the entire black segment shown in the chart.
From the July 1 low of 57,800, the black-segment rally lasted 82 days and the gain reached 51.84%. We captured most of this upswing, and we also did additional contract swing trades. The upcoming correction is an opportunity—after you find the correction’s turning point, the next wave of upward movement is likely to exceed the black segment.
$BTC
#BTC走势分析
As mentioned in yesterday’s post, if BTC breaks below 84,500, it means a correction may have started. Today afternoon, BTC dropped to the support zone of 82,600–83,400 and then stopped falling. The price action over the coming days is very important—it will determine the market outlook for October and November.
If BTC still can’t hold above 85,000 for a long time, it means that at least the pullback of the rally from 74,967 to 87,395 has already begun. This pullback from 74,967 to 87,395 should not break the Enneagram angle line 2/1 (80,300–80,900). If it breaks below this range and cannot reclaim it, you should be cautious that the situation may escalate to a larger pullback covering the entire black segment shown in the chart.
From the July 1 low of 57,800, the black-segment rally lasted 82 days and the gain reached 51.84%. We captured most of this upswing, and we also did additional contract swing trades. The upcoming correction is an opportunity—after you find the correction’s turning point, the next wave of upward movement is likely to exceed the black segment.
$BTC
#BTC走势分析
1
3
1.7k
·
--
“BTC Important Update❗️” How did I identify that this round of adjustment ended early?In our tweet on September 18, we said that once BTC breaks through and holds above 80,000, the entire upward adjustment covering 57,800—82,300 could be confirmed as having ended on the right side.
This kind of situation—where the adjustment doesn’t reach the level generally expected by the market and ends early—isn’t unfamiliar. As shown in Figure 1, we experienced an almost identical structure once in 2024.
Then on the evening of September 18, BTC not only broke through and held above 80,000, but also moved upward to break through the Gann angle line 2/1 corresponding to the entire downtrend range of 126,200—57,800. After the breakout, it also completed the support/resistance flip.
“BTC Important Update❗️” How did I identify that this round of adjustment ended early?
In our tweet on September 18, we said that once BTC breaks through and holds above 80,000, the entire upward adjustment covering 57,800—82,300 could be confirmed as having ended on the right side.
This kind of situation—where the adjustment doesn’t reach the level generally expected by the market and ends early—isn’t unfamiliar. As shown in Figure 1, we experienced an almost identical structure once in 2024.
Then on the evening of September 18, BTC not only broke through and held above 80,000, but also moved upward to break through the Gann angle line 2/1 corresponding to the entire downtrend range of 126,200—57,800. After the breakout, it also completed the support/resistance flip.
This kind of situation—where the adjustment doesn’t reach the level generally expected by the market and ends early—isn’t unfamiliar. As shown in Figure 1, we experienced an almost identical structure once in 2024.
Then on the evening of September 18, BTC not only broke through and held above 80,000, but also moved upward to break through the Gann angle line 2/1 corresponding to the entire downtrend range of 126,200—57,800. After the breakout, it also completed the support/resistance flip.
2
2.6k
·
--
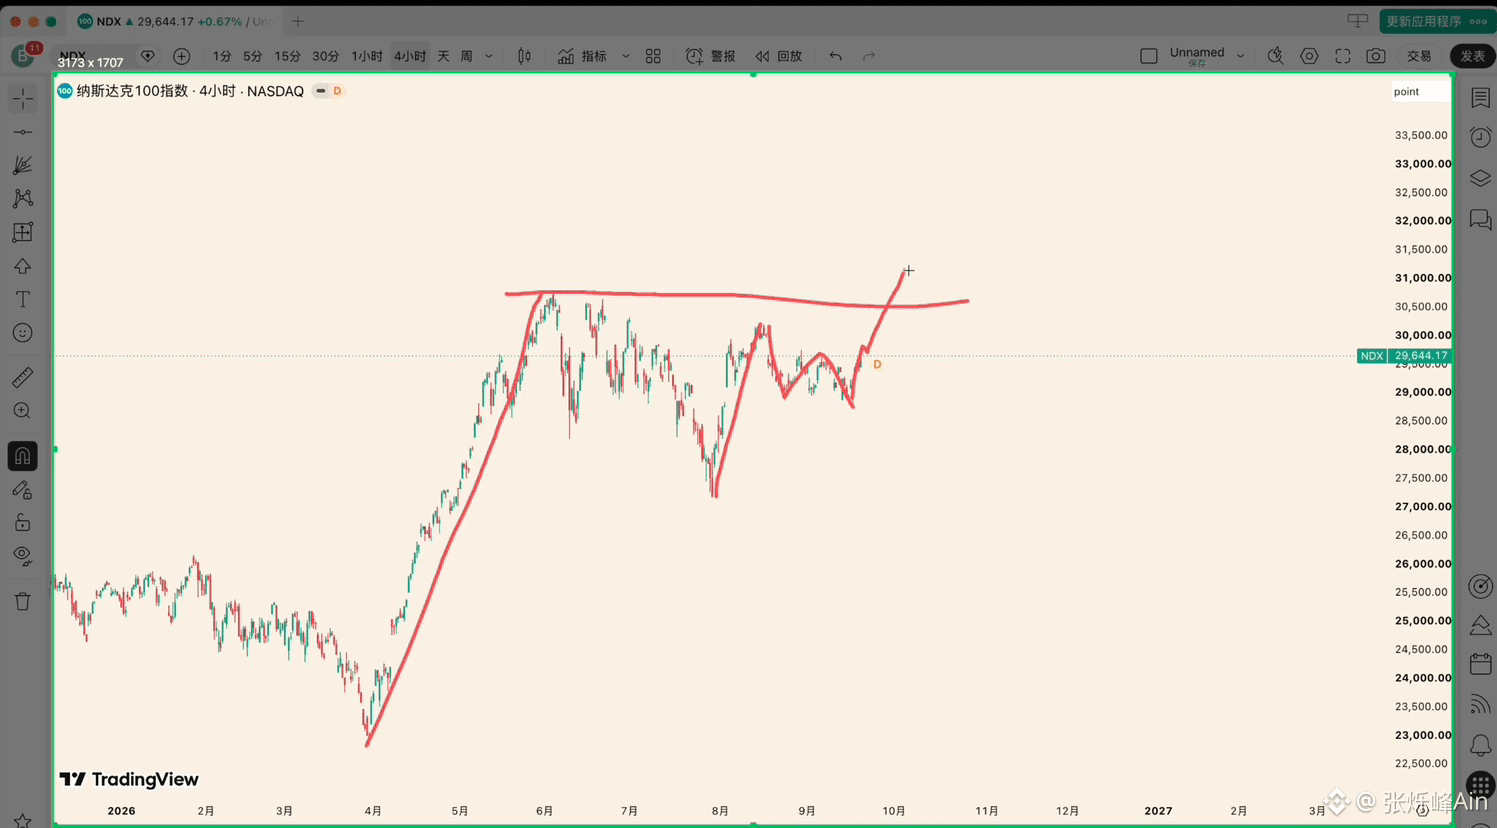
As shown in Figure 1, in the video from September 20 we said that the adjustment for the Nasdaq 100 index (NDX) has ended, and that this week would break to new highs. Only three days have passed, and we have seen new highs with our own eyes ✅
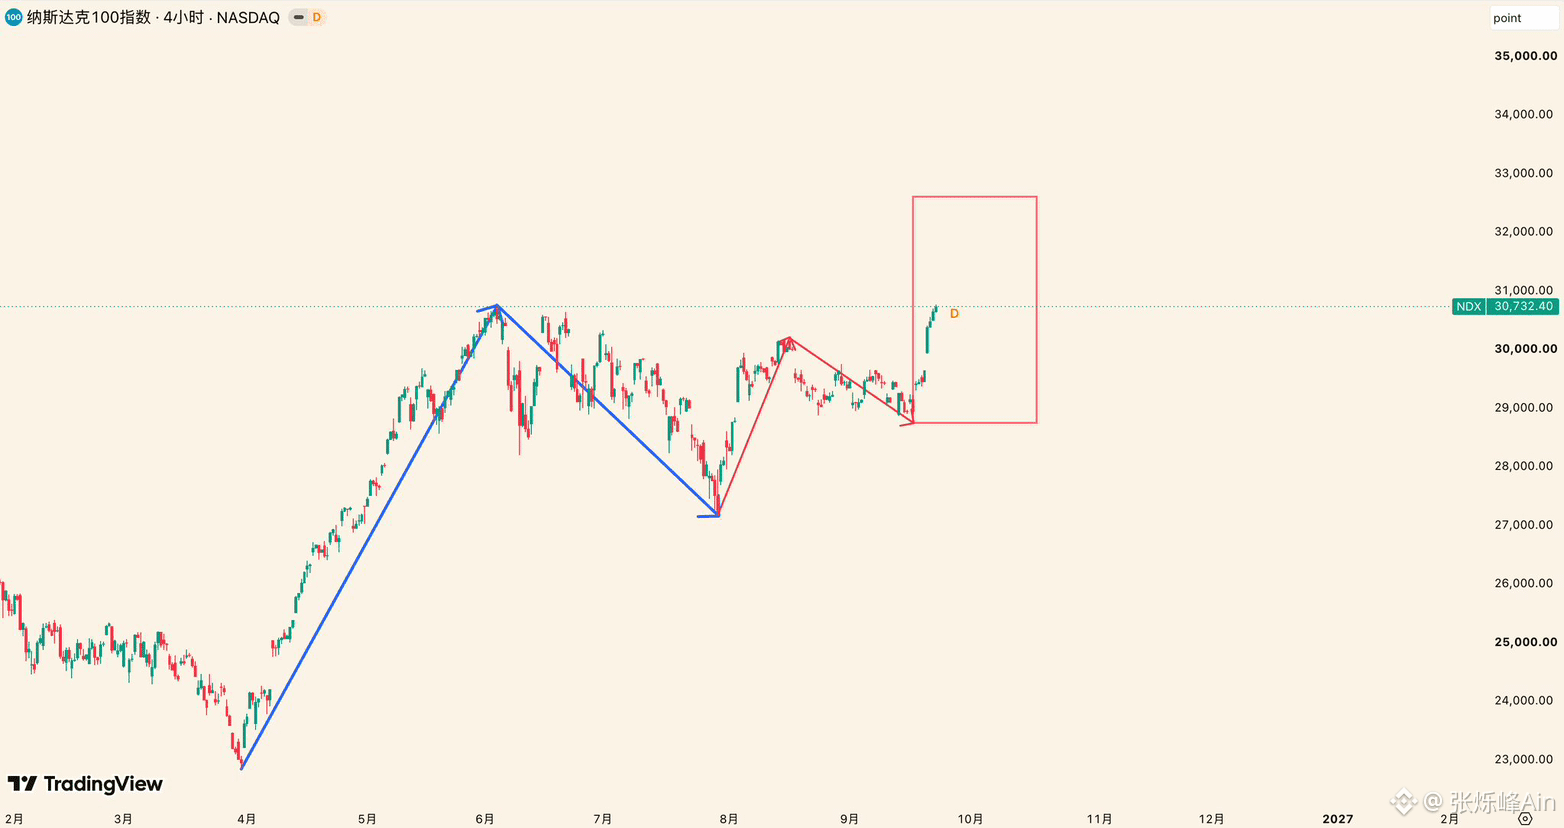
As shown in Figure 2, the blue segment of the Nasdaq in this chart represents a weekly-level uptrend. 30762–27176 is the pullback against it, and the pullback ended on July 30. Along this path, 27176 is the starting point of the next round of the weekly-level uptrend.
On a smaller timeframe, we regard 27176–30195.72 as a daily-level uptrend. 30195.72–28753.29 is the pullback against it, and that pullback has already ended. The uptrend starting from 28753.29 is the same as the move from 27176–30195.72, and it still belongs to the daily-level.
Summary: Whether starting from the weekly timeframe or the daily timeframe, the Nasdaq is in an uptrend. As long as it can stay above 30,000, this rally still has momentum. Only if it breaks below 30,000 will a daily-level pullback begin. After the pullback, it will still continue higher, because the weekly-level uptrend that started from 27176 has not ended yet.
As shown in Figure 1, in the video from September 20 we said that the adjustment for the Nasdaq 100 index (NDX) has ended, and that this week would break to new highs. Only three days have passed, and we have seen new highs with our own eyes ✅
As shown in Figure 2, the blue segment of the Nasdaq in this chart represents a weekly-level uptrend. 30762–27176 is the pullback against it, and the pullback ended on July 30. Along this path, 27176 is the starting point of the next round of the weekly-level uptrend.
On a smaller timeframe, we regard 27176–30195.72 as a daily-level uptrend. 30195.72–28753.29 is the pullback against it, and that pullback has already ended. The uptrend starting from 28753.29 is the same as the move from 27176–30195.72, and it still belongs to the daily-level.
Summary: Whether starting from the weekly timeframe or the daily timeframe, the Nasdaq is in an uptrend. As long as it can stay above 30,000, this rally still has momentum. Only if it breaks below 30,000 will a daily-level pullback begin. After the pullback, it will still continue higher, because the weekly-level uptrend that started from 27176 has not ended yet.
As shown in Figure 2, the blue segment of the Nasdaq in this chart represents a weekly-level uptrend. 30762–27176 is the pullback against it, and the pullback ended on July 30. Along this path, 27176 is the starting point of the next round of the weekly-level uptrend.
On a smaller timeframe, we regard 27176–30195.72 as a daily-level uptrend. 30195.72–28753.29 is the pullback against it, and that pullback has already ended. The uptrend starting from 28753.29 is the same as the move from 27176–30195.72, and it still belongs to the daily-level.
Summary: Whether starting from the weekly timeframe or the daily timeframe, the Nasdaq is in an uptrend. As long as it can stay above 30,000, this rally still has momentum. Only if it breaks below 30,000 will a daily-level pullback begin. After the pullback, it will still continue higher, because the weekly-level uptrend that started from 27176 has not ended yet.
3.8k
·
--
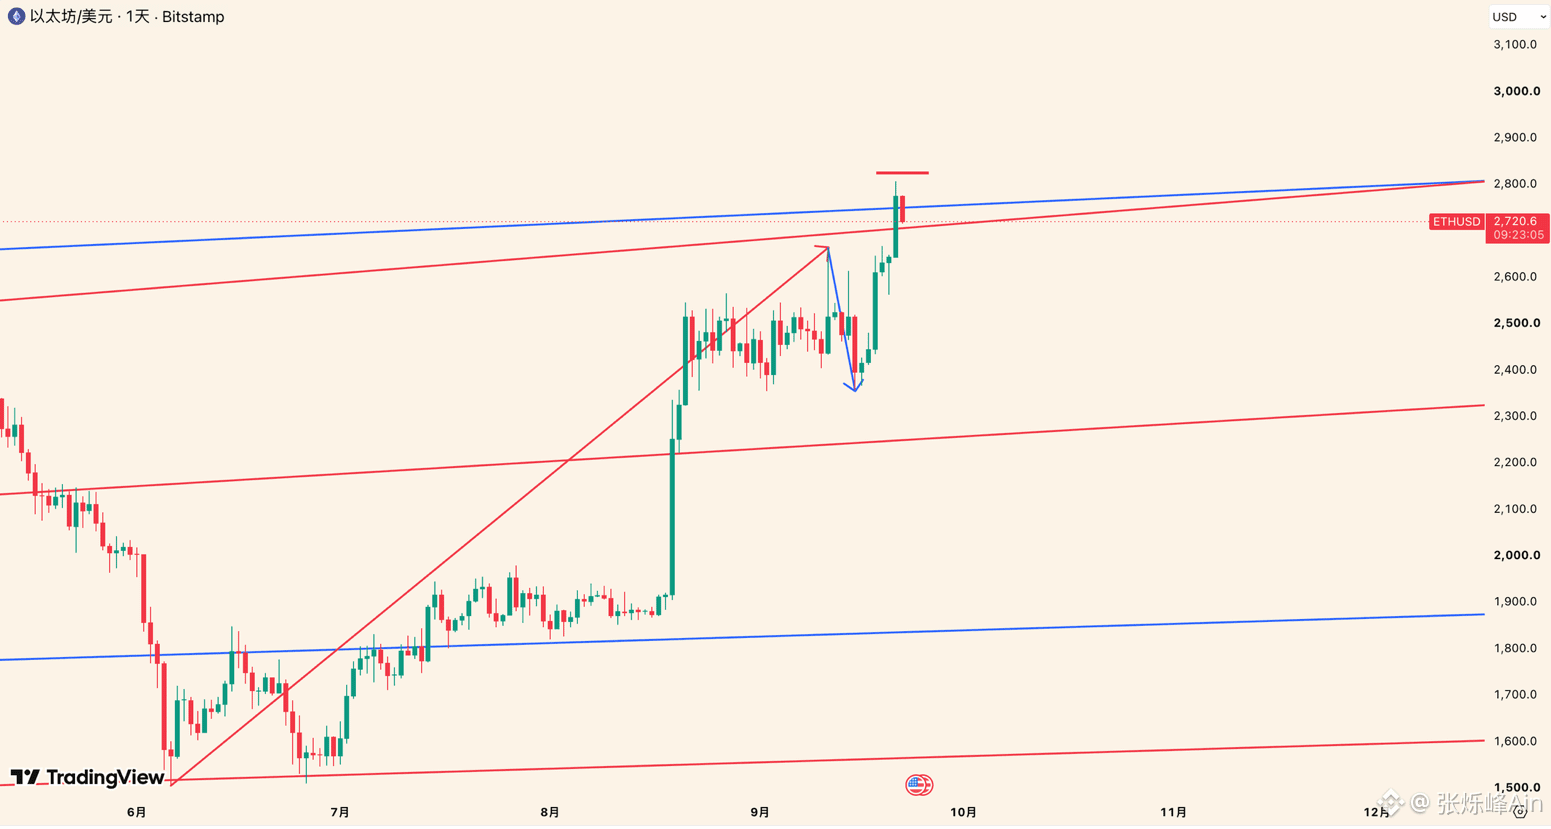
As early as May, when $ETH was still in a downward trend, we identified the downside end at 1500. After that, ETH fell to 1505. By the end of June, we indicated that as long as 1505 was not broken, the downtrend would be basically confirmed to have ended. As of early yesterday morning, ETH’s gain had already reached 86%+. Even friends who just bought in last week are now in profit. So how should we look at the upcoming market?
As shown in Figure 1, the red segment of $ETH represents an uptrend at the daily timeframe level, while the blue segment is a retracement against it. Along this path, 2357 serves as the retracement endpoint. From that point onward, the next move is an uptrend at the same level as the red segment.
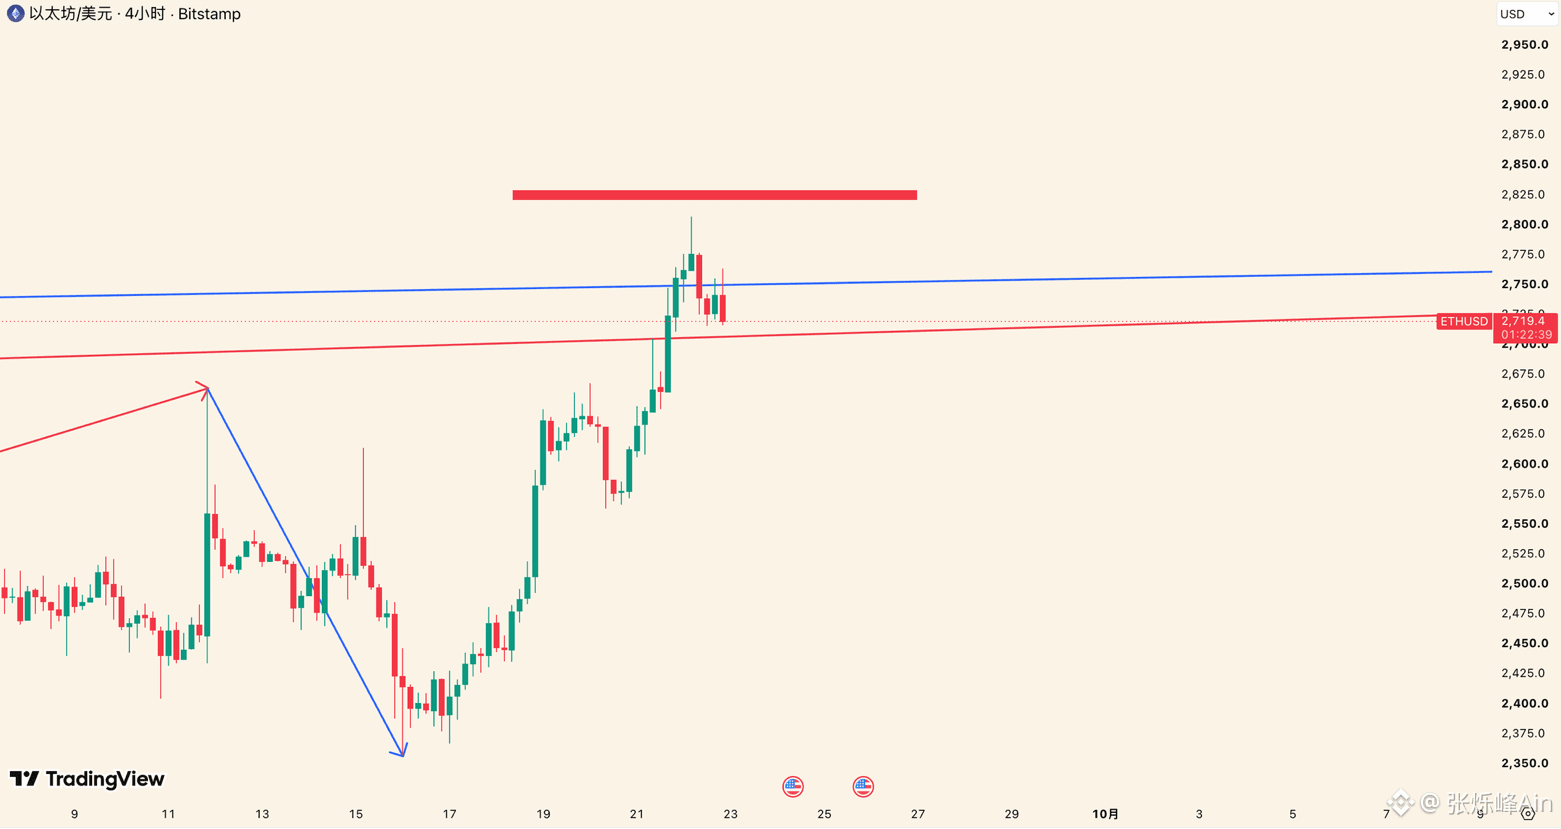
As shown in Figure 2, after ETH broke through our first target zone of 2720–2750 in the early morning, it rose to a high of 2807. Now it has pulled back to around 2720. We will observe whether this level can act as support. As long as the daily candlestick body does not fall below 2706, the decline from 2807 is merely a retracement within the ongoing uptrend—and it is a strong retracement. Along this path, there is still upward momentum.
The observation point below 2706 is at 2635. If this level breaks, it proves that this retracement is targeting the entire uptrend that began from 2357. After finding the retracement endpoint, the price will continue to rise. #eth $ETH
{future}(ETHUSDT)
As early as May, when $ETH was still in a downward trend, we identified the downside end at 1500. After that, ETH fell to 1505. By the end of June, we indicated that as long as 1505 was not broken, the downtrend would be basically confirmed to have ended. As of early yesterday morning, ETH’s gain had already reached 86%+. Even friends who just bought in last week are now in profit. So how should we look at the upcoming market?
As shown in Figure 1, the red segment of $ETH represents an uptrend at the daily timeframe level, while the blue segment is a retracement against it. Along this path, 2357 serves as the retracement endpoint. From that point onward, the next move is an uptrend at the same level as the red segment.
As shown in Figure 2, after ETH broke through our first target zone of 2720–2750 in the early morning, it rose to a high of 2807. Now it has pulled back to around 2720. We will observe whether this level can act as support. As long as the daily candlestick body does not fall below 2706, the decline from 2807 is merely a retracement within the ongoing uptrend—and it is a strong retracement. Along this path, there is still upward momentum.
The observation point below 2706 is at 2635. If this level breaks, it proves that this retracement is targeting the entire uptrend that began from 2357. After finding the retracement endpoint, the price will continue to rise. #eth $ETH
As shown in Figure 1, the red segment of $ETH represents an uptrend at the daily timeframe level, while the blue segment is a retracement against it. Along this path, 2357 serves as the retracement endpoint. From that point onward, the next move is an uptrend at the same level as the red segment.
As shown in Figure 2, after ETH broke through our first target zone of 2720–2750 in the early morning, it rose to a high of 2807. Now it has pulled back to around 2720. We will observe whether this level can act as support. As long as the daily candlestick body does not fall below 2706, the decline from 2807 is merely a retracement within the ongoing uptrend—and it is a strong retracement. Along this path, there is still upward momentum.
The observation point below 2706 is at 2635. If this level breaks, it proves that this retracement is targeting the entire uptrend that began from 2357. After finding the retracement endpoint, the price will continue to rise. #eth $ETH
1
2.2k
·
--
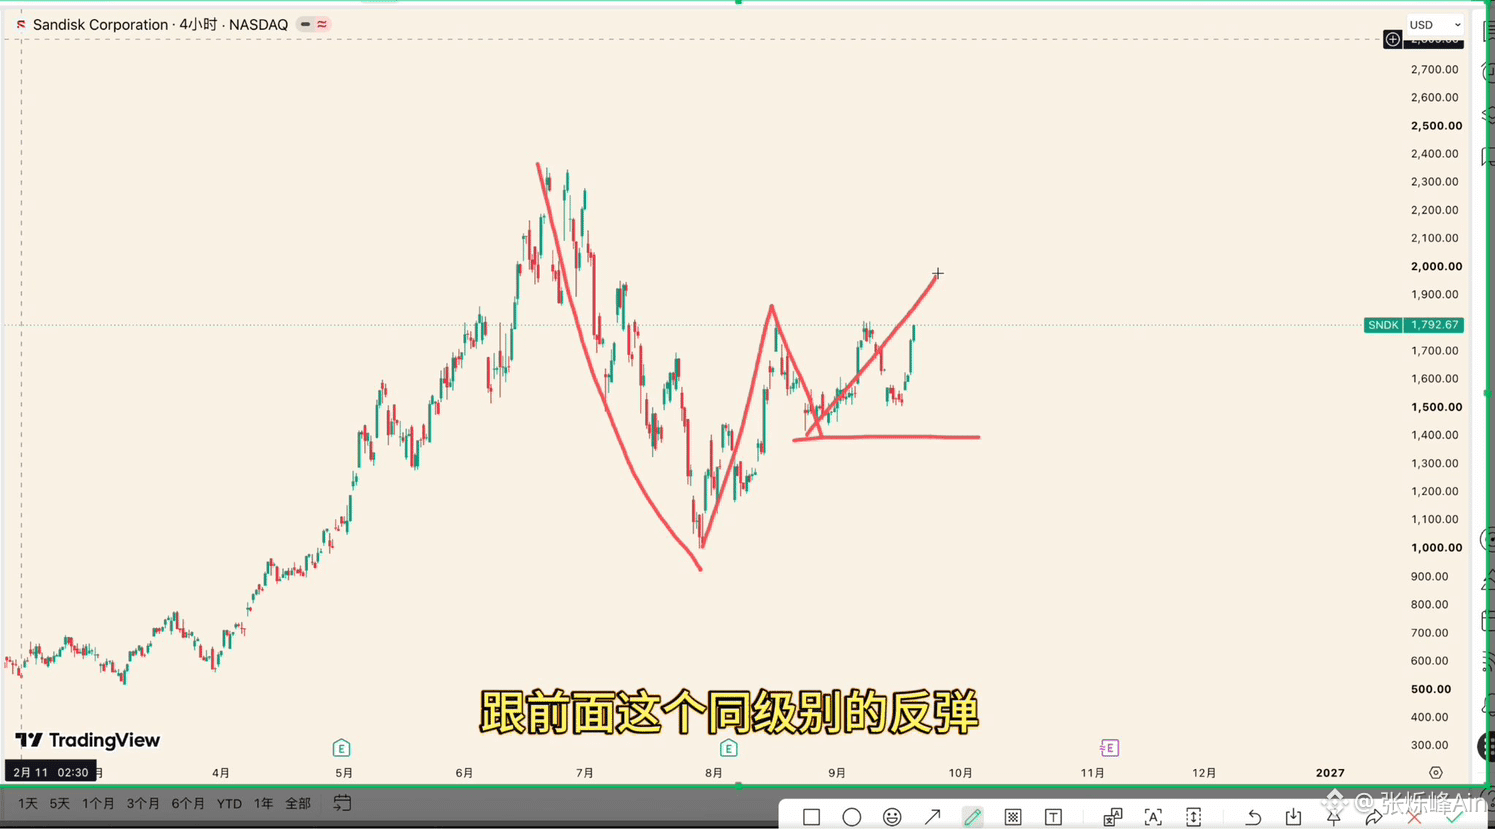
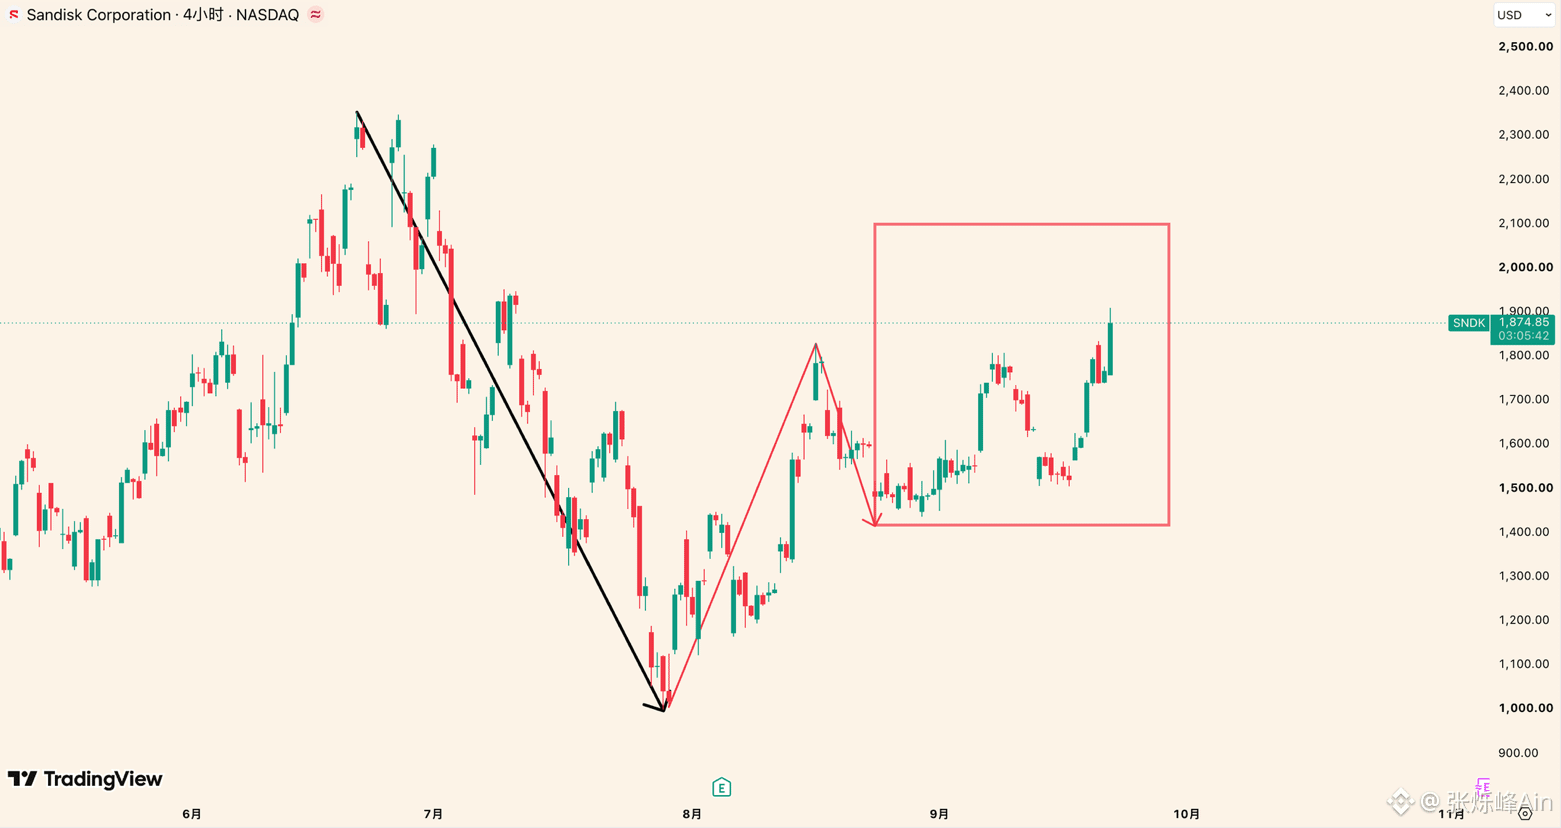
Hit SNDK again 📈. At the end of July, we said the daily-level selloff from SanDisk was temporarily over, and that there should be at least one daily-level rebound afterward. Then SanDisk surged by 83%. ✅
On August 17, we indicated that the first wave of the rebound had ended. The pullback target was around 1400, and then SanDisk completed its adjustment at 1416 and continued higher. So far, the gain has reached 34%+ ✅
The key observation levels above remain 1946 and 2068. Going forward, we’ll watch how price reacts to the critical resistance levels. The structure has changed—I’ll update you as we go. Stay tuned.#sndk $SNDK
{future}(SNDKUSDT)
Hit SNDK again 📈. At the end of July, we said the daily-level selloff from SanDisk was temporarily over, and that there should be at least one daily-level rebound afterward. Then SanDisk surged by 83%. ✅
On August 17, we indicated that the first wave of the rebound had ended. The pullback target was around 1400, and then SanDisk completed its adjustment at 1416 and continued higher. So far, the gain has reached 34%+ ✅
The key observation levels above remain 1946 and 2068. Going forward, we’ll watch how price reacts to the critical resistance levels. The structure has changed—I’ll update you as we go. Stay tuned.#sndk $SNDK
On August 17, we indicated that the first wave of the rebound had ended. The pullback target was around 1400, and then SanDisk completed its adjustment at 1416 and continued higher. So far, the gain has reached 34%+ ✅
The key observation levels above remain 1946 and 2068. Going forward, we’ll watch how price reacts to the critical resistance levels. The structure has changed—I’ll update you as we go. Stay tuned.#sndk $SNDK
1.3k
·
--
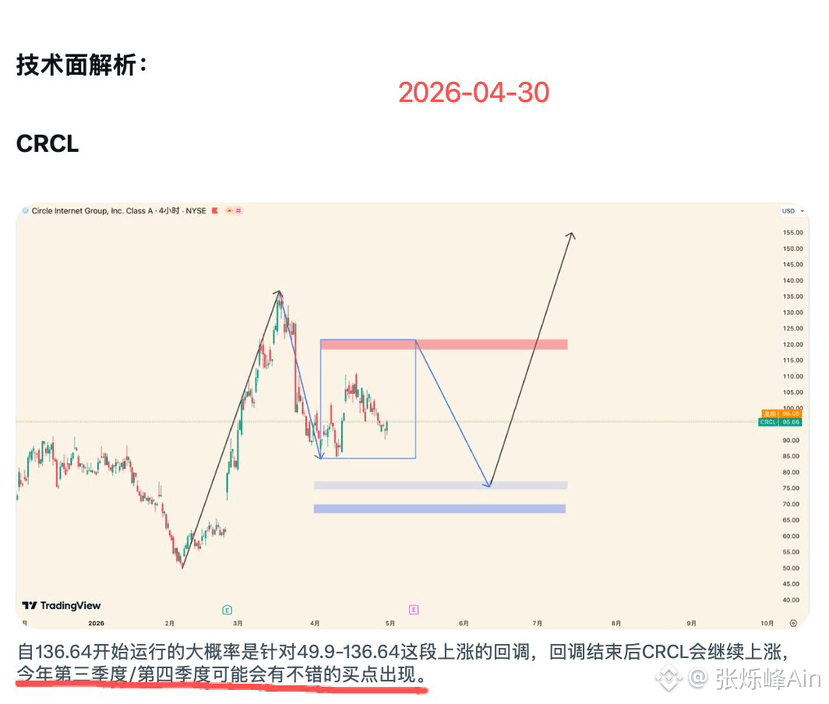
As shown in Figure 1, in my technical analysis at a major level of the encrypted concept stocks special article dated April 30, I analyzed $CRCL. Nearly five months have passed, and this viewpoint has already been preliminarily validated. Today we’ll do a follow-up:
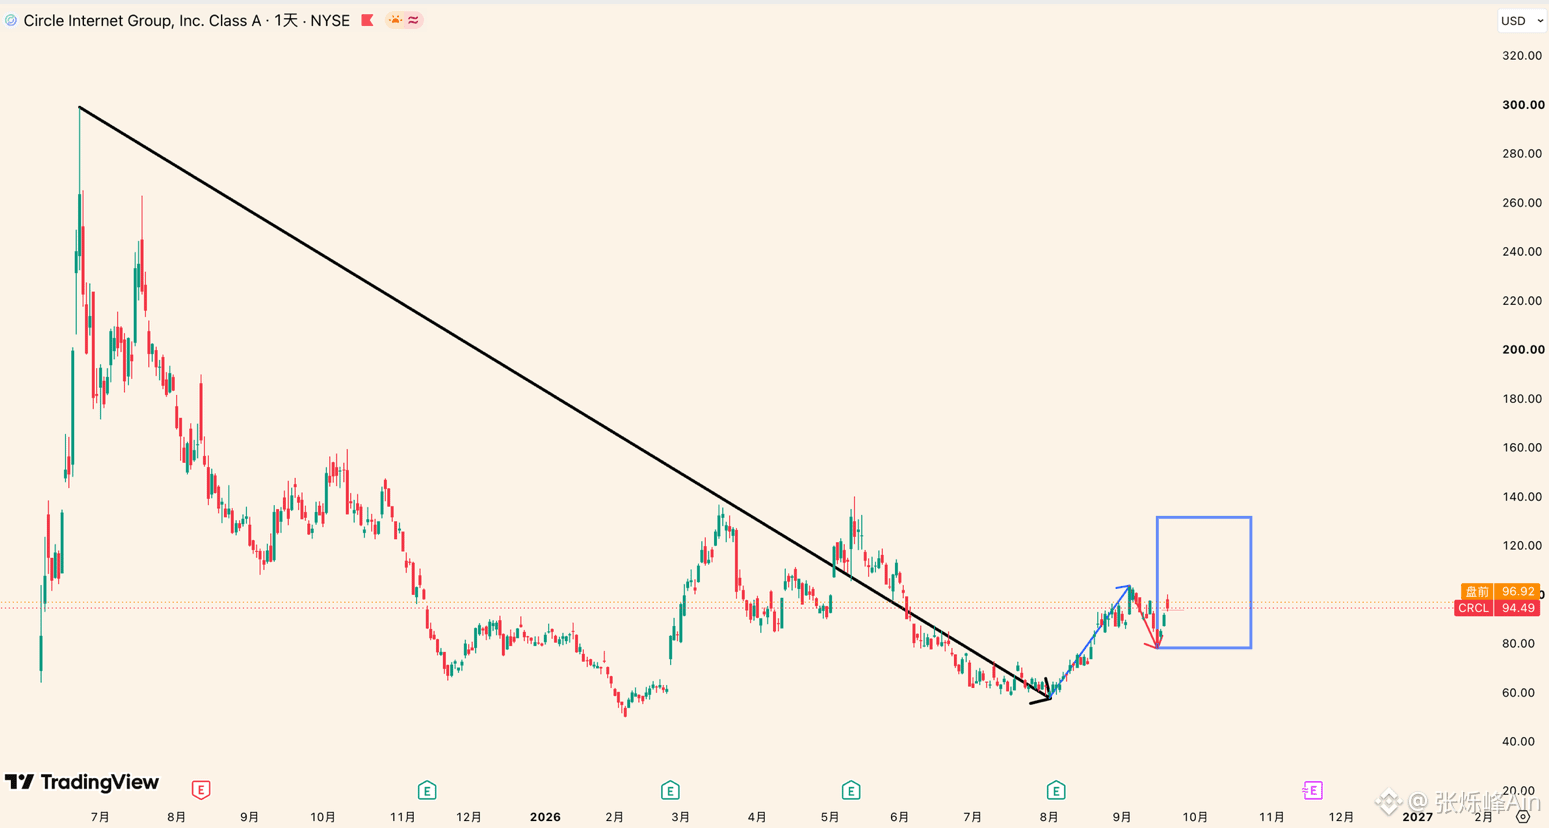
As shown in Figure 2, the CRCL monthly-level pullback may have already ended on August 3. From 57.84, what has started running is a new round of monthly-level upward movement—so let’s call it a bull market.
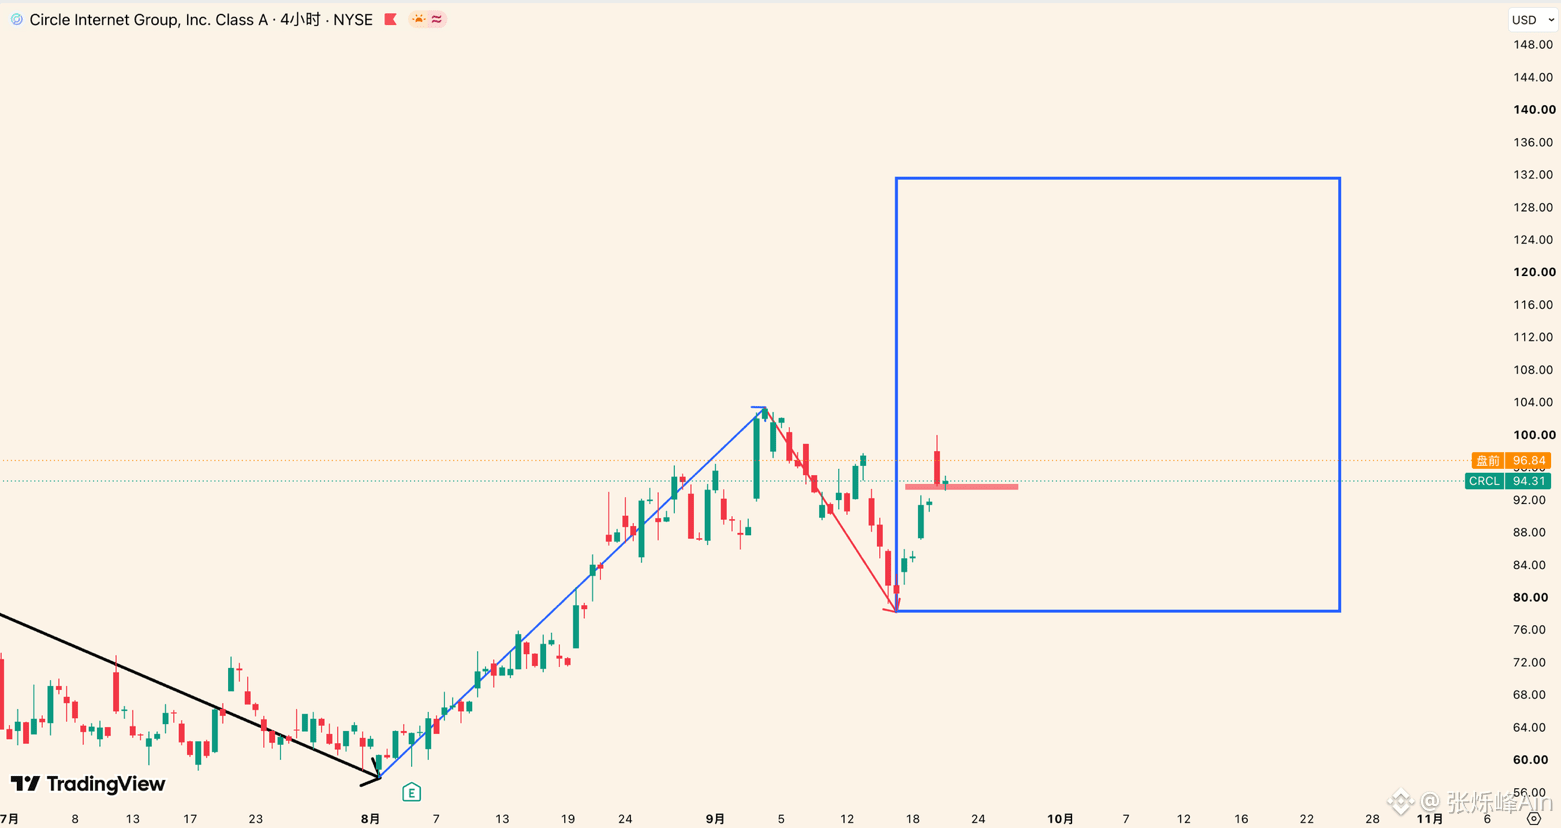
We narrow the timeframe level. As shown in Figure 3, the blue segment is the first wave of daily-level uptrend. As long as it does not break down below 86, the rally still has momentum. If it breaks below 86, it may begin running a pullback targeting the move that started from 78.26. More and more evidence shows that what started from 78.26 is a new round of daily-level uptrend, the same as the 58.66–103.28 range.
Big trends guide smaller levels, and smaller levels confirm the big trend. We started building positions in CRCL during June–July, with a combined average price of over 70. On September 17 we added positions again at 81; on September 21 we added a third time; and today we also made some adjustments.
If you can’t understand the trend, then follow the people who can— even for new friends who joined just last week, CRCL now already has a profit of 16%. When most people who can’t read the trend finally reach the pillow, then daybreak will be here.
As shown in Figure 1, in my technical analysis at a major level of the encrypted concept stocks special article dated April 30, I analyzed $CRCL. Nearly five months have passed, and this viewpoint has already been preliminarily validated. Today we’ll do a follow-up:
As shown in Figure 2, the CRCL monthly-level pullback may have already ended on August 3. From 57.84, what has started running is a new round of monthly-level upward movement—so let’s call it a bull market.
We narrow the timeframe level. As shown in Figure 3, the blue segment is the first wave of daily-level uptrend. As long as it does not break down below 86, the rally still has momentum. If it breaks below 86, it may begin running a pullback targeting the move that started from 78.26. More and more evidence shows that what started from 78.26 is a new round of daily-level uptrend, the same as the 58.66–103.28 range.
Big trends guide smaller levels, and smaller levels confirm the big trend. We started building positions in CRCL during June–July, with a combined average price of over 70. On September 17 we added positions again at 81; on September 21 we added a third time; and today we also made some adjustments.
If you can’t understand the trend, then follow the people who can— even for new friends who joined just last week, CRCL now already has a profit of 16%. When most people who can’t read the trend finally reach the pillow, then daybreak will be here.
As shown in Figure 2, the CRCL monthly-level pullback may have already ended on August 3. From 57.84, what has started running is a new round of monthly-level upward movement—so let’s call it a bull market.
We narrow the timeframe level. As shown in Figure 3, the blue segment is the first wave of daily-level uptrend. As long as it does not break down below 86, the rally still has momentum. If it breaks below 86, it may begin running a pullback targeting the move that started from 78.26. More and more evidence shows that what started from 78.26 is a new round of daily-level uptrend, the same as the 58.66–103.28 range.
Big trends guide smaller levels, and smaller levels confirm the big trend. We started building positions in CRCL during June–July, with a combined average price of over 70. On September 17 we added positions again at 81; on September 21 we added a third time; and today we also made some adjustments.
If you can’t understand the trend, then follow the people who can— even for new friends who joined just last week, CRCL now already has a profit of 16%. When most people who can’t read the trend finally reach the pillow, then daybreak will be here.
1
1
1.9k
·
--
This post shares my views on MSTR and the current crypto market—its value is very high. I suggest you like and save it first, then watch carefully.A bull market is created out of doubt.
Not all of it is doubt—it's the majority people's doubts. Put more plainly, it's the doubts of most retail investors.
By the time most retail investors stop doubting and start truly believing that a bull market is here, the first big leg up is often already close to its end.
Then the next weekly-level pullback will make them doubt again: Has the bull market already ended?
When those who doubt start to become more numerous again, the market begins moving forward once more.
Back and forth like this. A bull market is born amid doubt, and it often ends with conviction.
As shown in Figure 1, the MSTR monthly-level correction may have ended on June 27, 2026. This is a correction at the monthly timeframe. After the monthly-level correction ends, the market moves up on the monthly timeframe.
This post shares my views on MSTR and the current crypto market—its value is very high. I suggest you like and save it first, then watch carefully.
A bull market is created out of doubt.
Not all of it is doubt—it's the majority people's doubts. Put more plainly, it's the doubts of most retail investors.
By the time most retail investors stop doubting and start truly believing that a bull market is here, the first big leg up is often already close to its end.
Then the next weekly-level pullback will make them doubt again: Has the bull market already ended?
When those who doubt start to become more numerous again, the market begins moving forward once more.
Back and forth like this. A bull market is born amid doubt, and it often ends with conviction.
As shown in Figure 1, the MSTR monthly-level correction may have ended on June 27, 2026. This is a correction at the monthly timeframe. After the monthly-level correction ends, the market moves up on the monthly timeframe.
Not all of it is doubt—it's the majority people's doubts. Put more plainly, it's the doubts of most retail investors.
By the time most retail investors stop doubting and start truly believing that a bull market is here, the first big leg up is often already close to its end.
Then the next weekly-level pullback will make them doubt again: Has the bull market already ended?
When those who doubt start to become more numerous again, the market begins moving forward once more.
Back and forth like this. A bull market is born amid doubt, and it often ends with conviction.
As shown in Figure 1, the MSTR monthly-level correction may have ended on June 27, 2026. This is a correction at the monthly timeframe. After the monthly-level correction ends, the market moves up on the monthly timeframe.
511
·
--
The more critical the key nodes are, the more deceptive the market behavior becomes. To gauge a trader’s level, just look at how they handled the recent market.
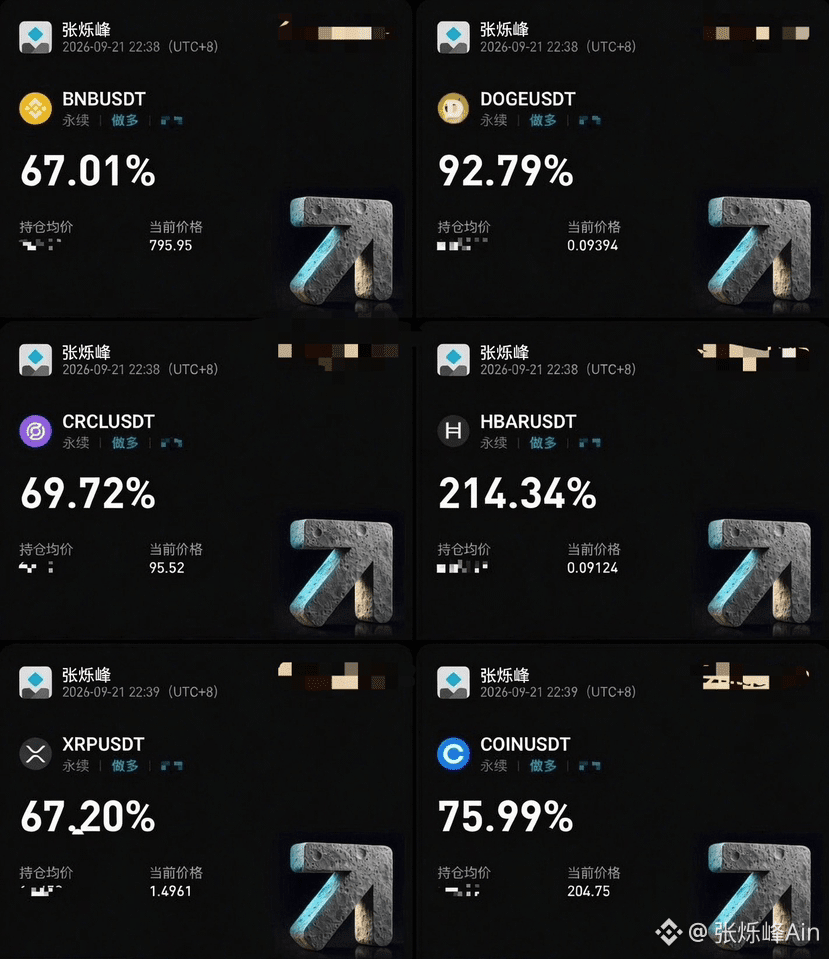
Figure 1 shows the logic behind the insider notification from 9/19 to 9/20 regarding boarding certain small-cap (altcoin) projects:
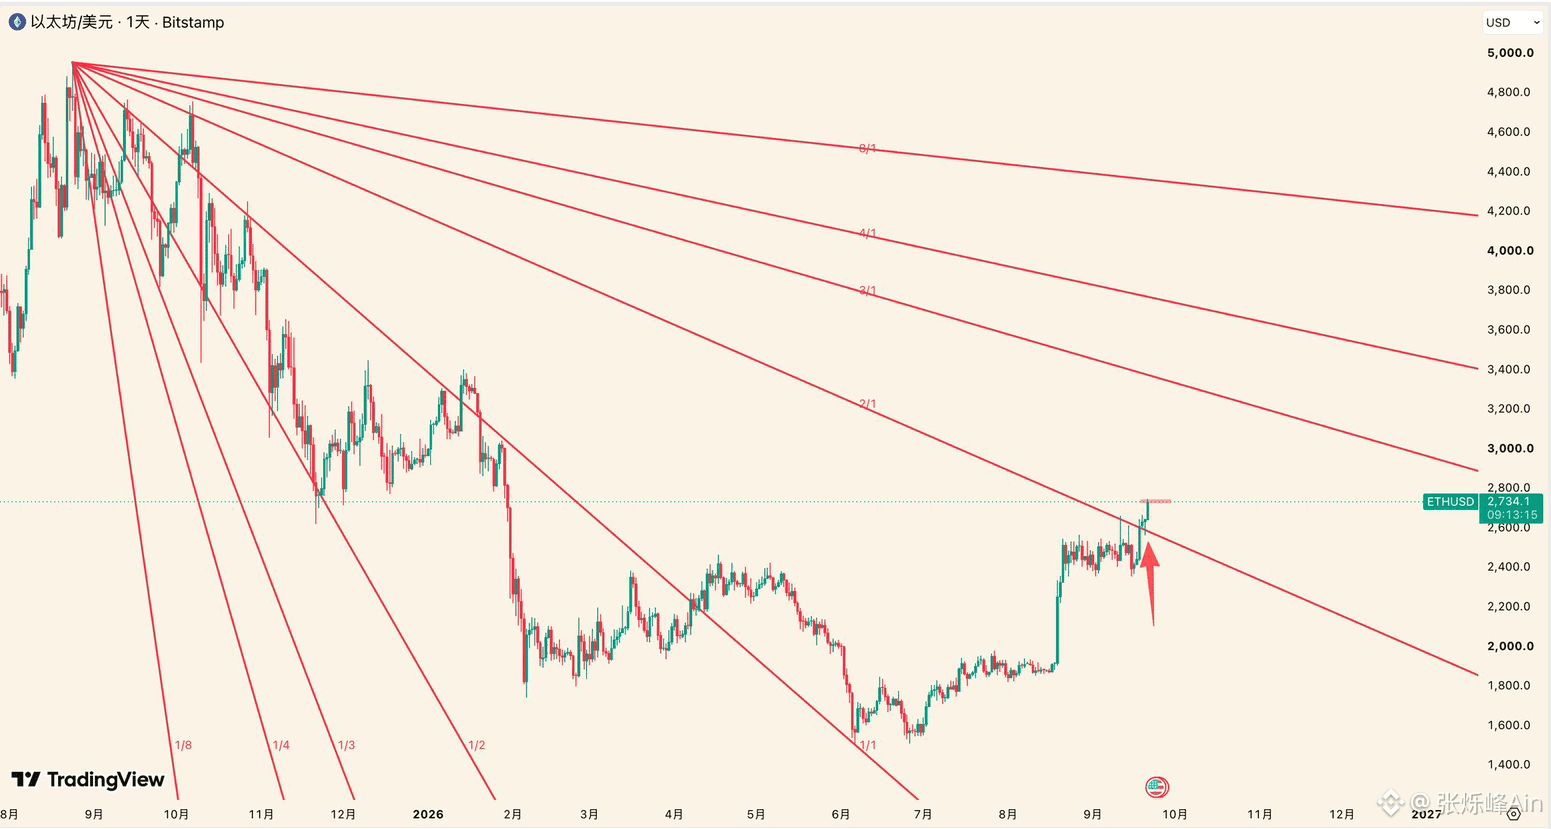
When we talk about altcoins, we definitely have to mention the altcoin king, Ethereum. ETH’s pace is slightly slower than BTC, but it has also already moved above the Gann angle line 2/1 of the entire downswing. Therefore, we keep the same viewpoint as in yesterday’s video:
As shown in Figure 3, this week’s ETH still has momentum for upside as long as it can maintain above the Gann angle line 2/1. After the 2730–2750 resistance zone is broken and holds, the next nearby resistance levels above are at 2820–2830. Breaking both consecutively will open up the upside space, with 3320 needing key attention.
Even if 2730–2750 faces rejection, as long as there is no major pullback, it will not affect the overall trend. #XRP上涨8% #苹果谷歌招募稳定币与代币化存款人才 $BTC
{future}(BTCUSDT)
$ETH
{future}(ETHUSDT)
The more critical the key nodes are, the more deceptive the market behavior becomes. To gauge a trader’s level, just look at how they handled the recent market.
Figure 1 shows the logic behind the insider notification from 9/19 to 9/20 regarding boarding certain small-cap (altcoin) projects:
When we talk about altcoins, we definitely have to mention the altcoin king, Ethereum. ETH’s pace is slightly slower than BTC, but it has also already moved above the Gann angle line 2/1 of the entire downswing. Therefore, we keep the same viewpoint as in yesterday’s video:
As shown in Figure 3, this week’s ETH still has momentum for upside as long as it can maintain above the Gann angle line 2/1. After the 2730–2750 resistance zone is broken and holds, the next nearby resistance levels above are at 2820–2830. Breaking both consecutively will open up the upside space, with 3320 needing key attention.
Even if 2730–2750 faces rejection, as long as there is no major pullback, it will not affect the overall trend. #XRP上涨8% #苹果谷歌招募稳定币与代币化存款人才 $BTC
$ETH
Figure 1 shows the logic behind the insider notification from 9/19 to 9/20 regarding boarding certain small-cap (altcoin) projects:
When we talk about altcoins, we definitely have to mention the altcoin king, Ethereum. ETH’s pace is slightly slower than BTC, but it has also already moved above the Gann angle line 2/1 of the entire downswing. Therefore, we keep the same viewpoint as in yesterday’s video:
As shown in Figure 3, this week’s ETH still has momentum for upside as long as it can maintain above the Gann angle line 2/1. After the 2730–2750 resistance zone is broken and holds, the next nearby resistance levels above are at 2820–2830. Breaking both consecutively will open up the upside space, with 3320 needing key attention.
Even if 2730–2750 faces rejection, as long as there is no major pullback, it will not affect the overall trend. #XRP上涨8% #苹果谷歌招募稳定币与代币化存款人才 $BTC
$ETH

431
·
--
In the tweets on September 18, we said that once BTC breaks above 80,000, we need to consider that 82300–74967 is the entirety of the correction; along this path, what operates at 74967 may be a new upswing.
In the video yesterday, I directly stated my view—an uptrend has already formed. Once it breaks the bull-bear boundary line 2/1, it will strengthen.
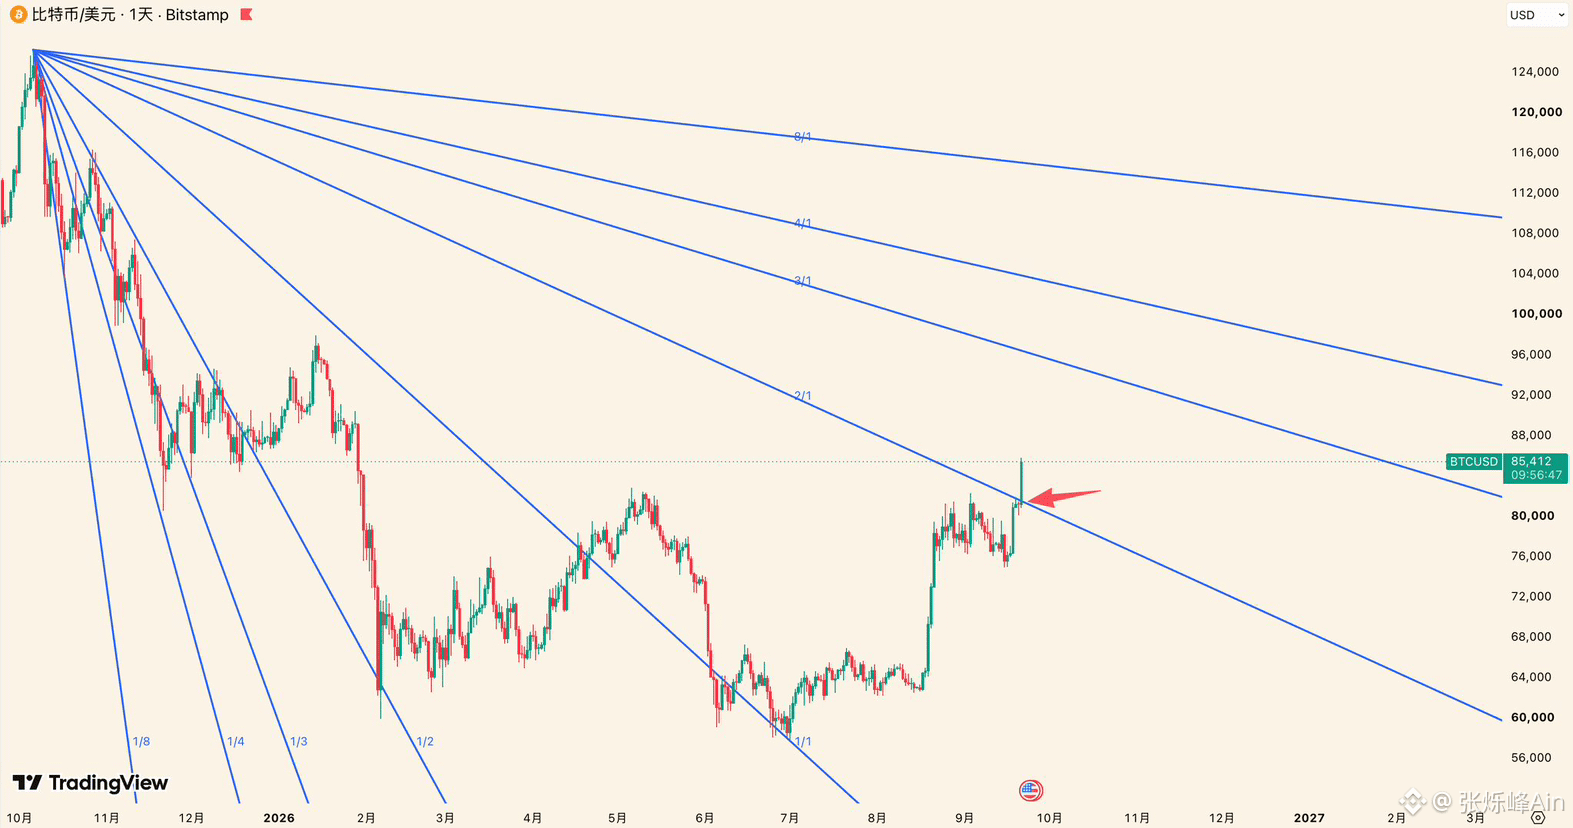
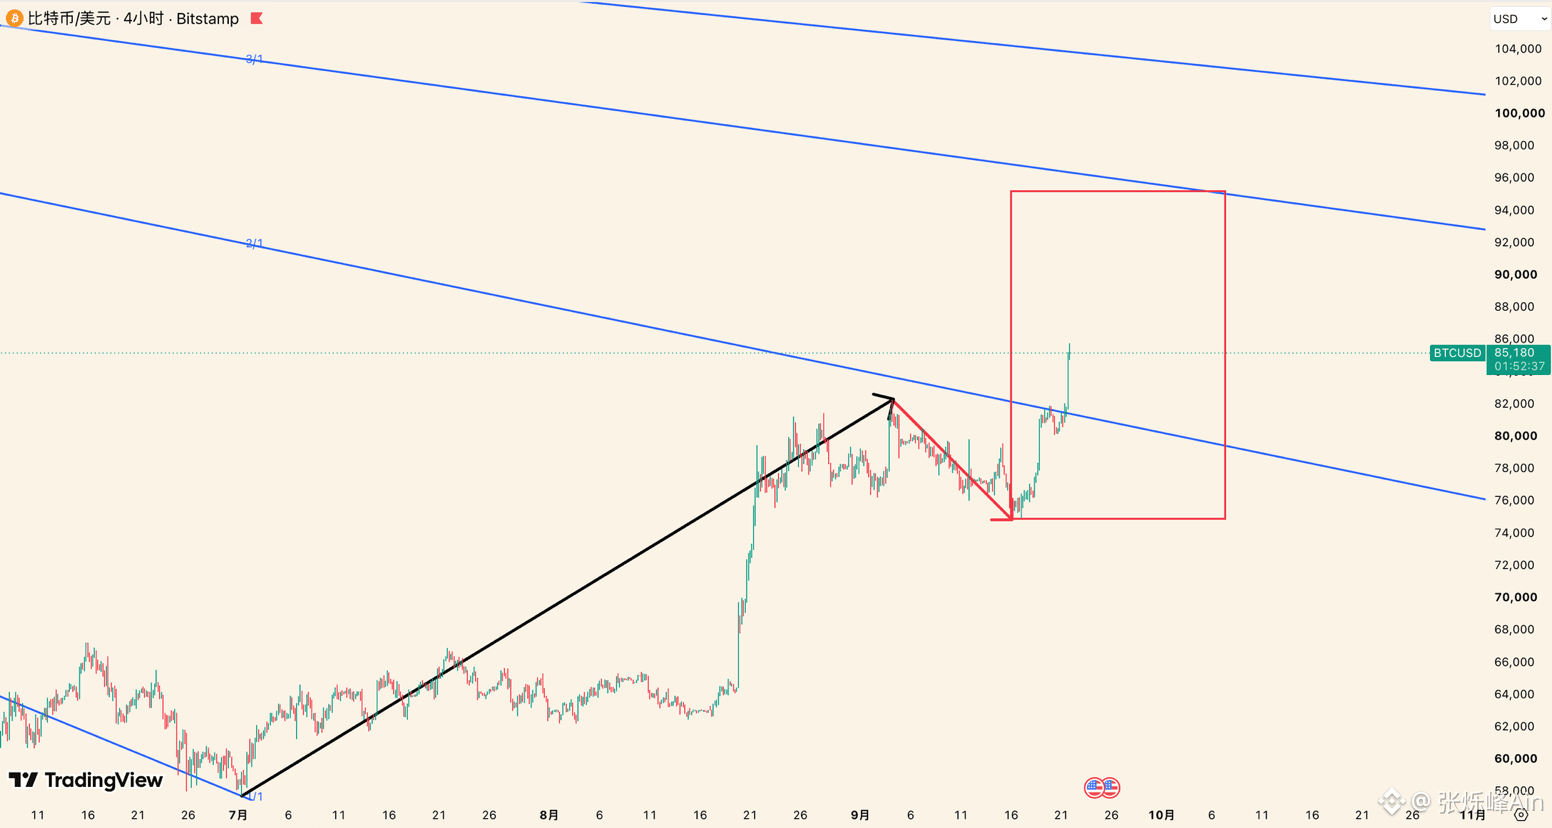
As shown in Figure 1, BTC officially broke above 2/1 today, and then quickly surged to 85,845—this perfectly matches our expectations! So how should we look at what comes next?
As long as it can hold above 2/1 (81,500–81,800), then the upswing that started from 74,967 will not end in the short term. The most recent resistance levels above are around 90,000, and then 92,000.
We first proposed that Bitcoin’s bull market is about to end on September 14, 2025, and we predicted that the excellent buy-the-dip point during this bear market would appear in 2026 Q3/Q4. At the end of June, we pinpointed that timing to July 1, and then ✅ 57,800 appeared.
Once a trend is formed, it won’t easily change. Real-time market analysis and trading ideas will be synchronized to the 🐼 group. ➡️$BTC
{future}(BTCUSDT)
#BTC走势分析
In the tweets on September 18, we said that once BTC breaks above 80,000, we need to consider that 82300–74967 is the entirety of the correction; along this path, what operates at 74967 may be a new upswing.
In the video yesterday, I directly stated my view—an uptrend has already formed. Once it breaks the bull-bear boundary line 2/1, it will strengthen.
As shown in Figure 1, BTC officially broke above 2/1 today, and then quickly surged to 85,845—this perfectly matches our expectations! So how should we look at what comes next?
As long as it can hold above 2/1 (81,500–81,800), then the upswing that started from 74,967 will not end in the short term. The most recent resistance levels above are around 90,000, and then 92,000.
We first proposed that Bitcoin’s bull market is about to end on September 14, 2025, and we predicted that the excellent buy-the-dip point during this bear market would appear in 2026 Q3/Q4. At the end of June, we pinpointed that timing to July 1, and then ✅ 57,800 appeared.
Once a trend is formed, it won’t easily change. Real-time market analysis and trading ideas will be synchronized to the 🐼 group. ➡️$BTC
#BTC走势分析
In the video yesterday, I directly stated my view—an uptrend has already formed. Once it breaks the bull-bear boundary line 2/1, it will strengthen.
As shown in Figure 1, BTC officially broke above 2/1 today, and then quickly surged to 85,845—this perfectly matches our expectations! So how should we look at what comes next?
As long as it can hold above 2/1 (81,500–81,800), then the upswing that started from 74,967 will not end in the short term. The most recent resistance levels above are around 90,000, and then 92,000.
We first proposed that Bitcoin’s bull market is about to end on September 14, 2025, and we predicted that the excellent buy-the-dip point during this bear market would appear in 2026 Q3/Q4. At the end of June, we pinpointed that timing to July 1, and then ✅ 57,800 appeared.
Once a trend is formed, it won’t easily change. Real-time market analysis and trading ideas will be synchronized to the 🐼 group. ➡️$BTC
#BTC走势分析
2.6k
Log in to explore more content
Join global crypto users on Binance Square
⚡️ Get latest and useful information about crypto.
💬 Trusted by the world’s largest crypto exchange.
👍 Discover real insights from verified creators.
Email / Phone number
Trending Topics
BinanceLaunchesBinanceIntelligence
65,887 views
841 Discussing
🚨 BINANCE JUST PUT AI DIRECTLY INSIDE THE EXCHANGE — AND THIS COULD CHANGE HOW RETAIL TRADES.
Binance has officially launched Binance Intelligence, a new AI layer built into the Binance ecosystem. It combines three products:
Binance AI for everyday users,
Binance AI Pro for automated trading workflows,
and Agent OS for developers building financial agents.
The part traders should care about?
Binance AI can surface market briefs, smart alerts, PnL recaps and personalized information, while AI Pro is designed to turn a plain-English trading idea into a visual strategy workflow.
That means the next phase of exchange competition may not be:
lowest fees vs deepest liquidity.
It could be:
who gives traders the best AI execution layer.
If Binance Intelligence actually drives heavier user activity, automated strategies and higher trading frequency, watch $BNB first.
AI adoption ↑
→ Binance engagement ↑
→ trading activity ↑
→ ecosystem narrative strengthens.
The catalyst I’d watch now:
global rollout + AI Pro launch + measurable user adoption.
Because once AI stops just telling you what the market is doing…
…and starts helping build the trade itself?
That’s when this gets much bigger than another chatbot. 👀
#binancelaunchesbinanceintelligence #EvernorthXRPTreasuryCompletesSPACMerger #ADAGains10%Above$0.27 #ETHUp70%InQ3ButLiquidityFalls #EthStakingExitQueueHits2026High
KimHotbae
·24 Likes
·29.7k views
StriveBuys2000BTCFor$169M
233 views
33 Discussing
EvernorthXRPTreasuryCompletesSPACMerger
53,840 views
605 Discussing