
Phonedi
3 Posts

Phonedi
Report
Block User
Open Trade
Occasional Trader
4.5 Years
25 Following
10 Followers
11 Liked
Posts
Portfolio
·
--
🚨 BITCOIN TODAY (12/11): OPPORTUNITY OR CORRECTION PRESSURE?
📊 BTC Update:
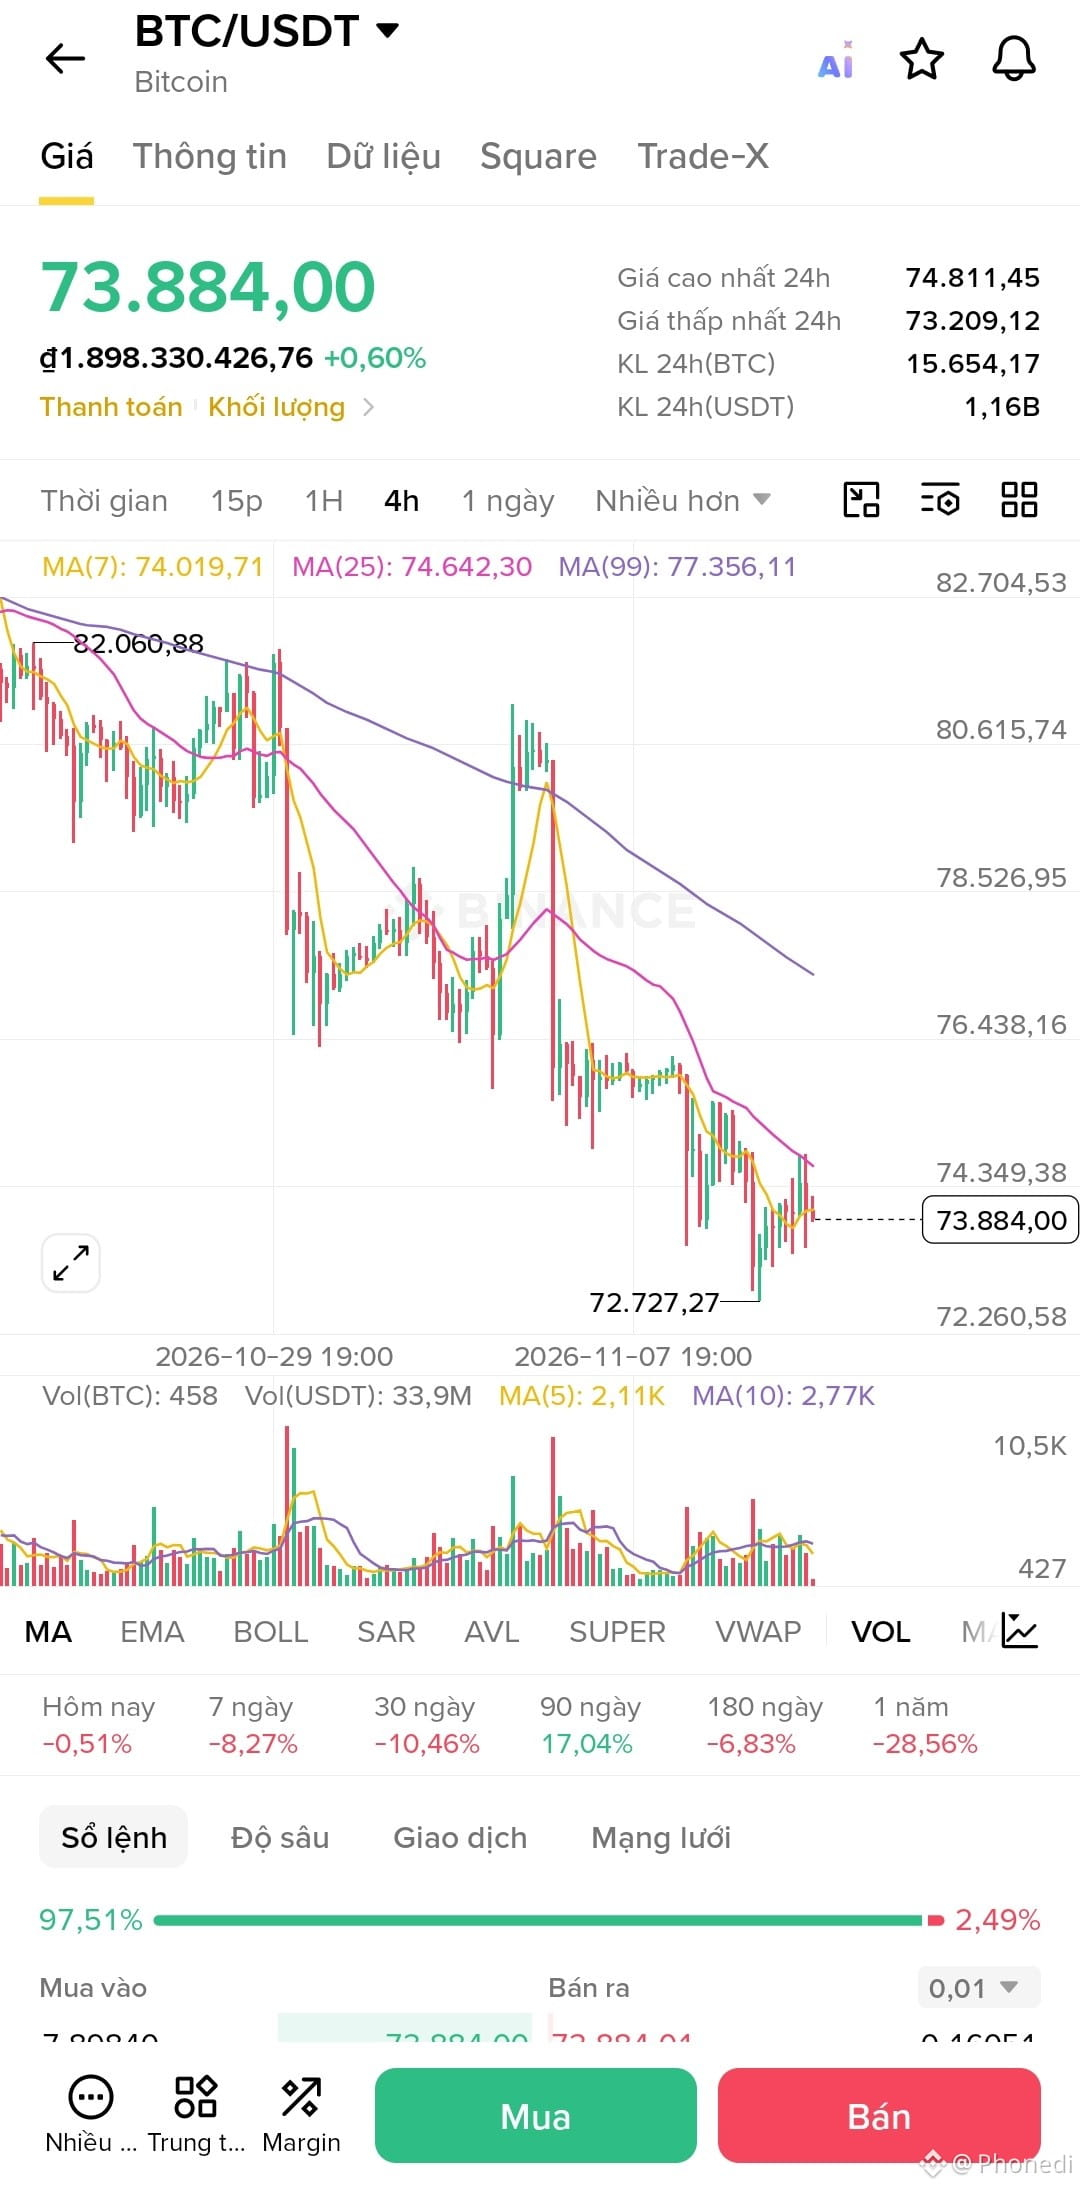
BTC price: around $73,900.
24-hour change: +0.42%.
7-day change: -8.09%.
24-hour range: $73,184–$74,771.
🔎 Market outlook:
BTC is seeing a slight recovery after a sharp correction. However, the short-term trend still needs further confirmation.
👀 3 things to watch:
Can BTC hold its current price range?
Will buying volume continue to increase?
Will buyers have enough strength to push BTC above the nearby resistance zone?
💡 My take: Don’t rush to FOMO. Watch how the price reacts and manage your risk before making any decisions.
👇 Where do you think BTC will go next?
🟢 UP 📈 or 🔴 DOWN 📉?
#BTC #Bitcoin #Crypto #BinanceSquare #BitcoinAnalysis
🚨 BITCOIN TODAY (12/11): OPPORTUNITY OR CORRECTION PRESSURE?
📊 BTC Update:
BTC price: around $73,900.
24-hour change: +0.42%.
7-day change: -8.09%.
24-hour range: $73,184–$74,771.
🔎 Market outlook:
BTC is seeing a slight recovery after a sharp correction. However, the short-term trend still needs further confirmation.
👀 3 things to watch:
Can BTC hold its current price range?
Will buying volume continue to increase?
Will buyers have enough strength to push BTC above the nearby resistance zone?
💡 My take: Don’t rush to FOMO. Watch how the price reacts and manage your risk before making any decisions.
👇 Where do you think BTC will go next?
🟢 UP 📈 or 🔴 DOWN 📉?
#BTC #Bitcoin #Crypto #BinanceSquare #BitcoinAnalysis
📊 BTC Update:
BTC price: around $73,900.
24-hour change: +0.42%.
7-day change: -8.09%.
24-hour range: $73,184–$74,771.
🔎 Market outlook:
BTC is seeing a slight recovery after a sharp correction. However, the short-term trend still needs further confirmation.
👀 3 things to watch:
Can BTC hold its current price range?
Will buying volume continue to increase?
Will buyers have enough strength to push BTC above the nearby resistance zone?
💡 My take: Don’t rush to FOMO. Watch how the price reacts and manage your risk before making any decisions.
👇 Where do you think BTC will go next?
🟢 UP 📈 or 🔴 DOWN 📉?
#BTC #Bitcoin #Crypto #BinanceSquare #BitcoinAnalysis
1
270
·
--
Bearish
{future}(BTCUSDT)
$🚨 ALERT: $BTC AT THE $73,000 LEVEL: BEAR TRAP OR THE NEXT CRASH?
The market is holding its breath as $BTC retests the critical $73,000–$73,350 support zone on the 4H chart, under pressure from U.S. CPI inflation data.
From a technical perspective, price action is caught between two conflicting signals:
• Reversal signal: The RSI (14) has fallen to 32, near oversold territory. History shows that selling pressure often suddenly weakens at this level, potentially triggering a technical rebound.
• Trend pressure: The short-term downtrend remains intact, with price below both the EMA 50 (yellow) and EMA 200 (purple) momentum lines.
🎯 2 POSSIBLE SCENARIOS:
• Scenario 1 (Bulls): If the 4H candle forms a long lower wick and holds above $73,000, the nearest rebound target would be the $74,500 resistance level.
• Scenario 2 (Bears): If the 4H candle closes decisively below $73,000, the next liquidity zone to watch is $70,000–$71,500.
⚠️ This is technical analysis, not investment advice.
👇 What’s your view? Is it time to BUY THE DIP or STAY ON THE SIDELINES and watch? Comment below and let’s discuss!
#bitcoin #BTC #TradingStrategies #Write2Earn! #CryptoAnalysis"
$🚨 ALERT: $BTC AT THE $73,000 LEVEL: BEAR TRAP OR THE NEXT CRASH?
The market is holding its breath as $BTC retests the critical $73,000–$73,350 support zone on the 4H chart, under pressure from U.S. CPI inflation data.
From a technical perspective, price action is caught between two conflicting signals:
• Reversal signal: The RSI (14) has fallen to 32, near oversold territory. History shows that selling pressure often suddenly weakens at this level, potentially triggering a technical rebound.
• Trend pressure: The short-term downtrend remains intact, with price below both the EMA 50 (yellow) and EMA 200 (purple) momentum lines.
🎯 2 POSSIBLE SCENARIOS:
• Scenario 1 (Bulls): If the 4H candle forms a long lower wick and holds above $73,000, the nearest rebound target would be the $74,500 resistance level.
• Scenario 2 (Bears): If the 4H candle closes decisively below $73,000, the next liquidity zone to watch is $70,000–$71,500.
⚠️ This is technical analysis, not investment advice.
👇 What’s your view? Is it time to BUY THE DIP or STAY ON THE SIDELINES and watch? Comment below and let’s discuss!
#bitcoin #BTC #TradingStrategies #Write2Earn! #CryptoAnalysis"
The market is holding its breath as $BTC retests the critical $73,000–$73,350 support zone on the 4H chart, under pressure from U.S. CPI inflation data.
From a technical perspective, price action is caught between two conflicting signals:
• Reversal signal: The RSI (14) has fallen to 32, near oversold territory. History shows that selling pressure often suddenly weakens at this level, potentially triggering a technical rebound.
• Trend pressure: The short-term downtrend remains intact, with price below both the EMA 50 (yellow) and EMA 200 (purple) momentum lines.
🎯 2 POSSIBLE SCENARIOS:
• Scenario 1 (Bulls): If the 4H candle forms a long lower wick and holds above $73,000, the nearest rebound target would be the $74,500 resistance level.
• Scenario 2 (Bears): If the 4H candle closes decisively below $73,000, the next liquidity zone to watch is $70,000–$71,500.
⚠️ This is technical analysis, not investment advice.
👇 What’s your view? Is it time to BUY THE DIP or STAY ON THE SIDELINES and watch? Comment below and let’s discuss!
#bitcoin #BTC #TradingStrategies #Write2Earn! #CryptoAnalysis"
BTC tăng
47%
BTC giảm
53%
32 votes • Voting closed
1
919
·
--
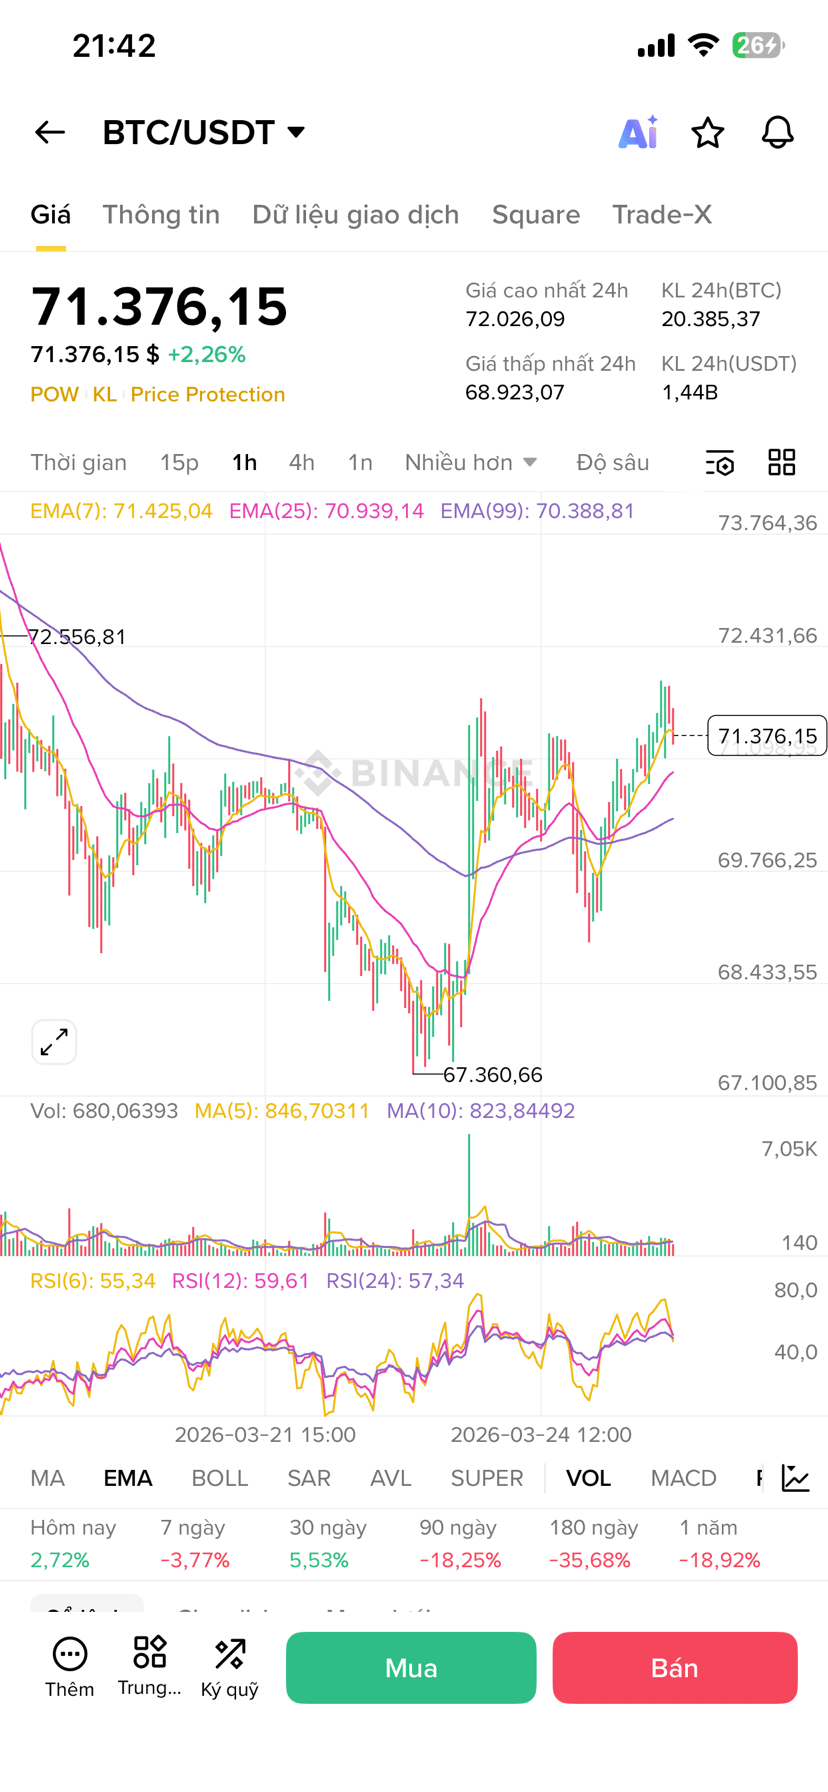
📊 Current price: ~71,3xx USDT
📈 Trend: Recovering after a sharp drop, currently testing an important resistance zone.
🔥 Key points:
EMAs are stacked bullishly → mildly bullish signal
RSI ~55–60 → buying pressure is steady but not surging
Price is being capped in the 71.8k–72.5k zone
🎯 Scenarios:
👉 If it breaks above 72k decisively: it could head toward 73k–74k
👉 If rejected: it could easily retest 70k–69.5k
⚠️ Note:
The market is still moving sideways, with no clear uptrend yet → avoid FOMO!
💡 Strategy ideas:
Go long if the price pulls back to the 70k zone
Take a short-term short if there's a strong rejection signal at 72k
Wait for a clear breakout for a safer entry
📌 Are you leaning LONG or SHORT? Comment below 👇$BTC
{spot}(BTCUSDT)
📊 Current price: ~71,3xx USDT
📈 Trend: Recovering after a sharp drop, currently testing an important resistance zone.
🔥 Key points:
EMAs are stacked bullishly → mildly bullish signal
RSI ~55–60 → buying pressure is steady but not surging
Price is being capped in the 71.8k–72.5k zone
🎯 Scenarios:
👉 If it breaks above 72k decisively: it could head toward 73k–74k
👉 If rejected: it could easily retest 70k–69.5k
⚠️ Note:
The market is still moving sideways, with no clear uptrend yet → avoid FOMO!
💡 Strategy ideas:
Go long if the price pulls back to the 70k zone
Take a short-term short if there's a strong rejection signal at 72k
Wait for a clear breakout for a safer entry
📌 Are you leaning LONG or SHORT? Comment below 👇$BTC
📈 Trend: Recovering after a sharp drop, currently testing an important resistance zone.
🔥 Key points:
EMAs are stacked bullishly → mildly bullish signal
RSI ~55–60 → buying pressure is steady but not surging
Price is being capped in the 71.8k–72.5k zone
🎯 Scenarios:
👉 If it breaks above 72k decisively: it could head toward 73k–74k
👉 If rejected: it could easily retest 70k–69.5k
⚠️ Note:
The market is still moving sideways, with no clear uptrend yet → avoid FOMO!
💡 Strategy ideas:
Go long if the price pulls back to the 70k zone
Take a short-term short if there's a strong rejection signal at 72k
Wait for a clear breakout for a safer entry
📌 Are you leaning LONG or SHORT? Comment below 👇$BTC
9
232
Log in to explore more content
Join global crypto users on Binance Square
⚡️ Get latest and useful information about crypto.
💬 Trusted by the world’s largest crypto exchange.
👍 Discover real insights from verified creators.
Email / Phone number
Trending Topics
HuangExitNvidiaStrategyInFocus
52,515 views
743 Discussing
STOCKS | Nvidia’s Jensen Huang Resigns, Colette Kress Named as Interim CEO
Binance News
·20 Likes
·26.4k views
AnthropicRejectsIPODelayValuationinQuestion
635,137 views
5,041 Discussing
BitMineReports$6.3BNetLossForFiscal2026
6,039 views
93 Discussing