
陳夕觀察
203 Posts

陳夕觀察
Report
Block User
关注全球资产、宏观、美股、Crypto与Web3。用一张图拆解市场逻辑、交易方法与风险管理。

牛来 Holder
High-Frequency Trader
2 Years
75 Following
167 Followers
76 Liked
Posts
All
Videos
·
--
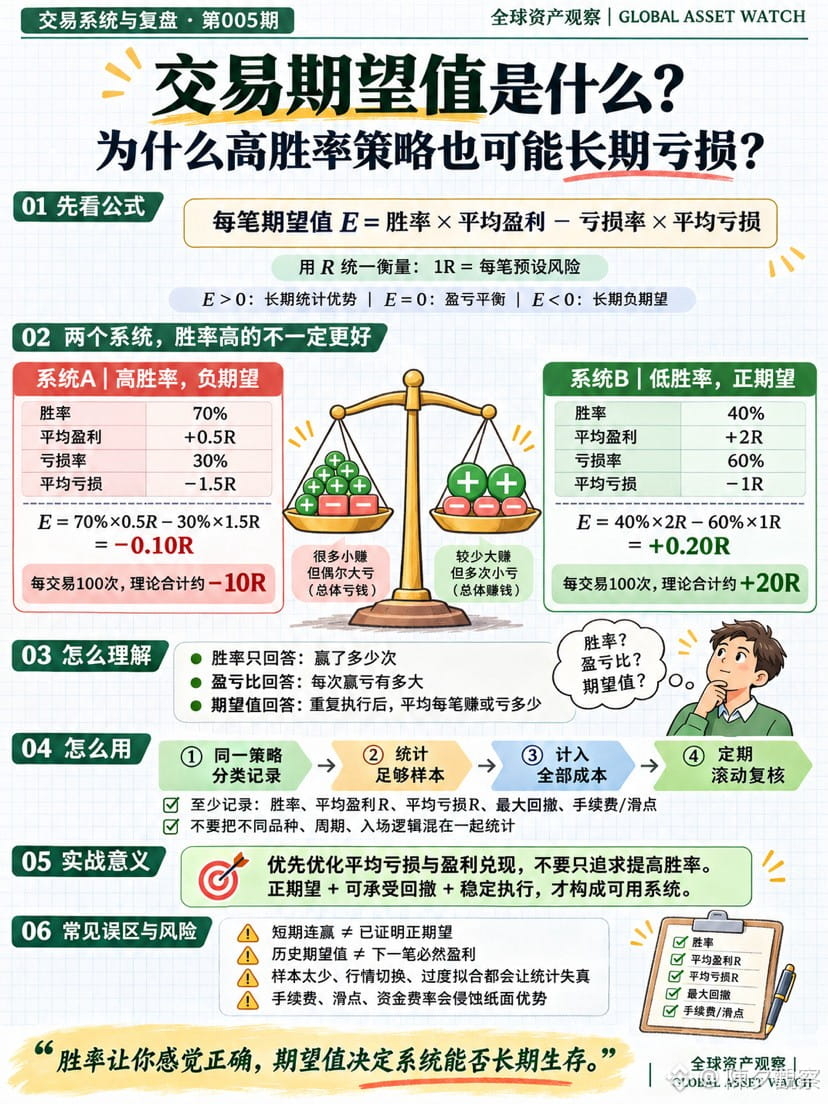
What is trading expectancy? Why can a high-win-rate strategy still lose money over the long term?
📊 Why can a 70% win rate still result in long-term losses?
Win rate reflects only how often you win; it does not account for the size of each gain or loss.
Expectancy per trade = win rate × average win − loss rate × average loss
Example:
System A: 70% win rate, average win 0.5R, average loss 1.5R
Expectancy = 70% × 0.5R − 30% × 1.5R = −0.10R
System B: 40% win rate, average win 2R, average loss 1R
Expectancy = 40% × 2R − 60% × 1R = +0.20R
A high win rate does not necessarily mean an edge, and a low win rate does not mean a strategy is ineffective. Long-term results depend on the combination of win rate, average win, and average loss. CME examples also show that a system with a 40% win rate can still have positive expectancy if its average win is significantly larger than its average loss.
When reviewing the same strategy, track:
Win rate and loss rate
Average win in R and average loss in R
Expectancy per trade
Maximum drawdown
Commissions, slippage, and cost of capital
Use a sufficiently large sample and update it on a rolling basis. A short winning streak does not prove positive expectancy, and historical statistics do not guarantee that the next trade will be profitable.
Win rate creates a sense of being right; expectancy determines whether a system can survive over the long term.
Next episode | Monday · Macro Finance Class · Episode 006
“What is the yield curve? Why should both an inversion and a subsequent steepening raise concern?”
$BTC
{future}(BTCUSDT)
What is trading expectancy? Why can a high-win-rate strategy still lose money over the long term?
📊 Why can a 70% win rate still result in long-term losses?
Win rate reflects only how often you win; it does not account for the size of each gain or loss.
Expectancy per trade = win rate × average win − loss rate × average loss
Example:
System A: 70% win rate, average win 0.5R, average loss 1.5R
Expectancy = 70% × 0.5R − 30% × 1.5R = −0.10R
System B: 40% win rate, average win 2R, average loss 1R
Expectancy = 40% × 2R − 60% × 1R = +0.20R
A high win rate does not necessarily mean an edge, and a low win rate does not mean a strategy is ineffective. Long-term results depend on the combination of win rate, average win, and average loss. CME examples also show that a system with a 40% win rate can still have positive expectancy if its average win is significantly larger than its average loss.
When reviewing the same strategy, track:
Win rate and loss rate
Average win in R and average loss in R
Expectancy per trade
Maximum drawdown
Commissions, slippage, and cost of capital
Use a sufficiently large sample and update it on a rolling basis. A short winning streak does not prove positive expectancy, and historical statistics do not guarantee that the next trade will be profitable.
Win rate creates a sense of being right; expectancy determines whether a system can survive over the long term.
Next episode | Monday · Macro Finance Class · Episode 006
“What is the yield curve? Why should both an inversion and a subsequent steepening raise concern?”
$BTC
📊 Why can a 70% win rate still result in long-term losses?
Win rate reflects only how often you win; it does not account for the size of each gain or loss.
Expectancy per trade = win rate × average win − loss rate × average loss
Example:
System A: 70% win rate, average win 0.5R, average loss 1.5R
Expectancy = 70% × 0.5R − 30% × 1.5R = −0.10R
System B: 40% win rate, average win 2R, average loss 1R
Expectancy = 40% × 2R − 60% × 1R = +0.20R
A high win rate does not necessarily mean an edge, and a low win rate does not mean a strategy is ineffective. Long-term results depend on the combination of win rate, average win, and average loss. CME examples also show that a system with a 40% win rate can still have positive expectancy if its average win is significantly larger than its average loss.
When reviewing the same strategy, track:
Win rate and loss rate
Average win in R and average loss in R
Expectancy per trade
Maximum drawdown
Commissions, slippage, and cost of capital
Use a sufficiently large sample and update it on a rolling basis. A short winning streak does not prove positive expectancy, and historical statistics do not guarantee that the next trade will be profitable.
Win rate creates a sense of being right; expectancy determines whether a system can survive over the long term.
Next episode | Monday · Macro Finance Class · Episode 006
“What is the yield curve? Why should both an inversion and a subsequent steepening raise concern?”
$BTC
167
·
--
Verified

Article
November 8 Financial Morning BriefingA weekend roundup of 10 key stories in global politics, conflict, technology, and crypto markets.
01|U.S. Military Action in the Gulf of Oman
The U.S. military says it damaged a cargo ship attempting to breach Iran’s naval blockade. Maritime transport security is once again in the spotlight.
02|Another Tanker Incident Reported in the Strait of Hormuz
Iranian officials say two tankers struck mines and caught fire. The extent of the damage is still being verified. Risks to oil transport remain in focus.
03|Conflict in Yemen Escalates Further
The Houthis say airstrikes killed 33 people. The claim has not been independently verified, and risks to shipping in the Red Sea remain.
November 8 Financial Morning Briefing
A weekend roundup of 10 key stories in global politics, conflict, technology, and crypto markets.
01|U.S. Military Action in the Gulf of Oman
The U.S. military says it damaged a cargo ship attempting to breach Iran’s naval blockade. Maritime transport security is once again in the spotlight.
02|Another Tanker Incident Reported in the Strait of Hormuz
Iranian officials say two tankers struck mines and caught fire. The extent of the damage is still being verified. Risks to oil transport remain in focus.
03|Conflict in Yemen Escalates Further
The Houthis say airstrikes killed 33 people. The claim has not been independently verified, and risks to shipping in the Red Sea remain.
01|U.S. Military Action in the Gulf of Oman
The U.S. military says it damaged a cargo ship attempting to breach Iran’s naval blockade. Maritime transport security is once again in the spotlight.
02|Another Tanker Incident Reported in the Strait of Hormuz
Iranian officials say two tankers struck mines and caught fire. The extent of the damage is still being verified. Risks to oil transport remain in focus.
03|Conflict in Yemen Escalates Further
The Houthis say airstrikes killed 33 people. The claim has not been independently verified, and risks to shipping in the Red Sea remain.
1
675
·
--

Article
November 7 Financial Evening Briefing15 key points on global macroeconomics, gold, AI, energy, and international markets
01|China’s foreign exchange reserves rebound
China’s foreign exchange reserves stood at about $3.405 trillion at the end of October, up $4.9 billion from the previous month. Changes in the renminbi exchange rate and the valuation of overseas assets merit attention.
02|China’s central bank buys gold for 24 consecutive months
It added about 25.8 tonnes in October, bringing official gold reserves to 78.3 million ounces. Central bank gold purchases remain an important long-term factor in the gold market.
03|Renminbi appreciation draws policy attention
The renminbi recently rose to a roughly four-year high, prompting the central bank to take measures to moderate the pace of appreciation. Exchange-rate stability and export competitiveness are key concerns.
November 7 Financial Evening Briefing
15 key points on global macroeconomics, gold, AI, energy, and international markets
01|China’s foreign exchange reserves rebound
China’s foreign exchange reserves stood at about $3.405 trillion at the end of October, up $4.9 billion from the previous month. Changes in the renminbi exchange rate and the valuation of overseas assets merit attention.
02|China’s central bank buys gold for 24 consecutive months
It added about 25.8 tonnes in October, bringing official gold reserves to 78.3 million ounces. Central bank gold purchases remain an important long-term factor in the gold market.
03|Renminbi appreciation draws policy attention
The renminbi recently rose to a roughly four-year high, prompting the central bank to take measures to moderate the pace of appreciation. Exchange-rate stability and export competitiveness are key concerns.
01|China’s foreign exchange reserves rebound
China’s foreign exchange reserves stood at about $3.405 trillion at the end of October, up $4.9 billion from the previous month. Changes in the renminbi exchange rate and the valuation of overseas assets merit attention.
02|China’s central bank buys gold for 24 consecutive months
It added about 25.8 tonnes in October, bringing official gold reserves to 78.3 million ounces. Central bank gold purchases remain an important long-term factor in the gold market.
03|Renminbi appreciation draws policy attention
The renminbi recently rose to a roughly four-year high, prompting the central bank to take measures to moderate the pace of appreciation. Exchange-rate stability and export competitiveness are key concerns.
50
·
--

Article
U.S. Weighs Tighter Data Center Regulations: Is the AI Boom Starting to Face New Headwinds?The AI industry is facing a new reality: computing capacity can continue to expand, but electricity, water resources, and regulatory approvals may not keep pace.
Recently, discussions in the U.S. about regulating AI data centers have intensified. With the midterm elections over, Democrats are preparing to push for stricter regulations on AI and data centers in 2027.
This could become a new factor affecting the global AI industry, following chip supply and energy shortages.
1. What is the U.S. preparing to restrict?
On November 4, the U.S. technology policy organization Chamber of Progress submitted policy recommendations to Democratic leaders in Congress, focusing on three areas:
U.S. Weighs Tighter Data Center Regulations: Is the AI Boom Starting to Face New Headwinds?
The AI industry is facing a new reality: computing capacity can continue to expand, but electricity, water resources, and regulatory approvals may not keep pace.
Recently, discussions in the U.S. about regulating AI data centers have intensified. With the midterm elections over, Democrats are preparing to push for stricter regulations on AI and data centers in 2027.
This could become a new factor affecting the global AI industry, following chip supply and energy shortages.
1. What is the U.S. preparing to restrict?
On November 4, the U.S. technology policy organization Chamber of Progress submitted policy recommendations to Democratic leaders in Congress, focusing on three areas:
Recently, discussions in the U.S. about regulating AI data centers have intensified. With the midterm elections over, Democrats are preparing to push for stricter regulations on AI and data centers in 2027.
This could become a new factor affecting the global AI industry, following chip supply and energy shortages.
1. What is the U.S. preparing to restrict?
On November 4, the U.S. technology policy organization Chamber of Progress submitted policy recommendations to Democratic leaders in Congress, focusing on three areas:
78
·
--
Bullish
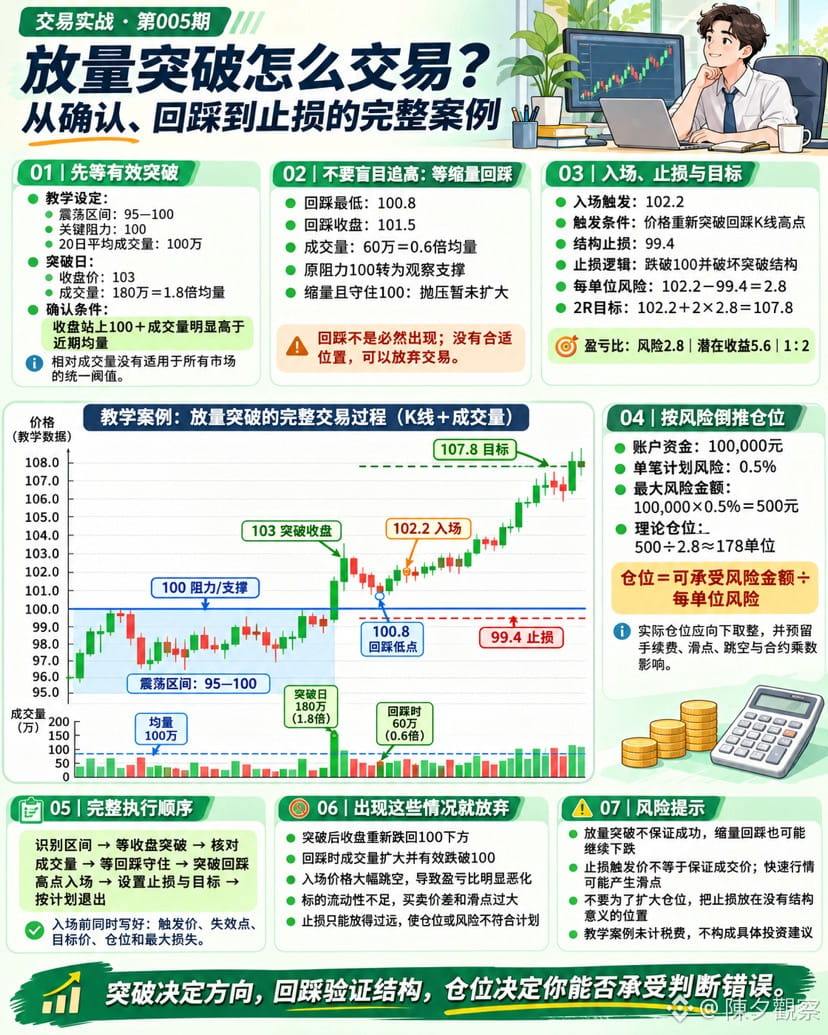
After a high-volume breakout, should you chase the price or wait for a pullback?
This episode breaks down an actionable process using a complete case study:
The price ranged between 95 and 100, then broke out on high volume, closing at 103. It subsequently pulled back on lower volume, held above the former resistance at 100, and triggered an entry when it broke above the high of the pullback candle. Volume can help assess participation in a breakout, but it cannot guarantee that the breakout will succeed.
Case plan:
Entry trigger: 102.2
Structural stop-loss: 99.4
Risk per unit: 2.8
2R target: 107.8
Account balance: 100,000 yuan
Risk per trade: 0.5% (500 yuan)
Theoretical position size: 500 ÷ 2.8 ≈ 178 units
Set the stop-loss based on market structure, then calculate position size according to your risk tolerance. Before placing an order, clearly define the trigger conditions, stop-loss, and target.
Note: The stop-loss trigger price is not a guaranteed execution price. Fast-moving markets, price gaps, and insufficient liquidity can cause slippage.
Breakouts set the direction, pullbacks test the structure, and position size determines whether you can withstand being wrong.
Sources: CME Position Sizing|CME Trading Plan|Schwab Volume Indicators|Investor.gov Stop Order Explanation
Coming next|Sunday · Trading Systems and Review · Episode 005
“What Is the Expectancy of a Trade? Why Can Even High-Win-Rate Strategies Lose Money Over the Long Term?”
{future}(BTCUSDT)
After a high-volume breakout, should you chase the price or wait for a pullback?
This episode breaks down an actionable process using a complete case study:
The price ranged between 95 and 100, then broke out on high volume, closing at 103. It subsequently pulled back on lower volume, held above the former resistance at 100, and triggered an entry when it broke above the high of the pullback candle. Volume can help assess participation in a breakout, but it cannot guarantee that the breakout will succeed.
Case plan:
Entry trigger: 102.2
Structural stop-loss: 99.4
Risk per unit: 2.8
2R target: 107.8
Account balance: 100,000 yuan
Risk per trade: 0.5% (500 yuan)
Theoretical position size: 500 ÷ 2.8 ≈ 178 units
Set the stop-loss based on market structure, then calculate position size according to your risk tolerance. Before placing an order, clearly define the trigger conditions, stop-loss, and target.
Note: The stop-loss trigger price is not a guaranteed execution price. Fast-moving markets, price gaps, and insufficient liquidity can cause slippage.
Breakouts set the direction, pullbacks test the structure, and position size determines whether you can withstand being wrong.
Sources: CME Position Sizing|CME Trading Plan|Schwab Volume Indicators|Investor.gov Stop Order Explanation
Coming next|Sunday · Trading Systems and Review · Episode 005
“What Is the Expectancy of a Trade? Why Can Even High-Win-Rate Strategies Lose Money Over the Long Term?”
This episode breaks down an actionable process using a complete case study:
The price ranged between 95 and 100, then broke out on high volume, closing at 103. It subsequently pulled back on lower volume, held above the former resistance at 100, and triggered an entry when it broke above the high of the pullback candle. Volume can help assess participation in a breakout, but it cannot guarantee that the breakout will succeed.
Case plan:
Entry trigger: 102.2
Structural stop-loss: 99.4
Risk per unit: 2.8
2R target: 107.8
Account balance: 100,000 yuan
Risk per trade: 0.5% (500 yuan)
Theoretical position size: 500 ÷ 2.8 ≈ 178 units
Set the stop-loss based on market structure, then calculate position size according to your risk tolerance. Before placing an order, clearly define the trigger conditions, stop-loss, and target.
Note: The stop-loss trigger price is not a guaranteed execution price. Fast-moving markets, price gaps, and insufficient liquidity can cause slippage.
Breakouts set the direction, pullbacks test the structure, and position size determines whether you can withstand being wrong.
Sources: CME Position Sizing|CME Trading Plan|Schwab Volume Indicators|Investor.gov Stop Order Explanation
Coming next|Sunday · Trading Systems and Review · Episode 005
“What Is the Expectancy of a Trade? Why Can Even High-Win-Rate Strategies Lose Money Over the Long Term?”
123
·
--

Article
2026.11.07 Financial Morning Brief01|Nasdaq rebounds, but weekly trend remains weak
The Nasdaq rose 1.09% on Friday but fell 3.4% for the week, marking its fourth consecutive weekly decline. The recovery in tech stocks has yet to confirm a trend reversal.
02|S&P 500 posts its worst weekly performance in over a year
Rebounded 0.31% on Friday, but fell 2.7% for the week. AI valuations and interest rate expectations continued to weigh on the market.
03|Dow and Nasdaq diverge
The Dow fell 0.46% on Friday, while the Nasdaq rose 1.09%. The rebound in tech stocks has yet to lift the broader market.
04|Semiconductor index rebounds 4.2%
The Philadelphia Semiconductor Index rebounded after plunging more than 12% the previous day, as short-term investors bought back in, but it has yet to recoup its losses.
2026.11.07 Financial Morning Brief
01|Nasdaq rebounds, but weekly trend remains weak
The Nasdaq rose 1.09% on Friday but fell 3.4% for the week, marking its fourth consecutive weekly decline. The recovery in tech stocks has yet to confirm a trend reversal.
02|S&P 500 posts its worst weekly performance in over a year
Rebounded 0.31% on Friday, but fell 2.7% for the week. AI valuations and interest rate expectations continued to weigh on the market.
03|Dow and Nasdaq diverge
The Dow fell 0.46% on Friday, while the Nasdaq rose 1.09%. The rebound in tech stocks has yet to lift the broader market.
04|Semiconductor index rebounds 4.2%
The Philadelphia Semiconductor Index rebounded after plunging more than 12% the previous day, as short-term investors bought back in, but it has yet to recoup its losses.
The Nasdaq rose 1.09% on Friday but fell 3.4% for the week, marking its fourth consecutive weekly decline. The recovery in tech stocks has yet to confirm a trend reversal.
02|S&P 500 posts its worst weekly performance in over a year
Rebounded 0.31% on Friday, but fell 2.7% for the week. AI valuations and interest rate expectations continued to weigh on the market.
03|Dow and Nasdaq diverge
The Dow fell 0.46% on Friday, while the Nasdaq rose 1.09%. The rebound in tech stocks has yet to lift the broader market.
04|Semiconductor index rebounds 4.2%
The Philadelphia Semiconductor Index rebounded after plunging more than 12% the previous day, as short-term investors bought back in, but it has yet to recoup its losses.
128
·
--

Article
2026.11.06 Financial Evening News01|U.S. nonfarm payrolls unexpectedly strong
Employment increased by 165,000 in October, far exceeding expectations of 65,000. Expectations of a December Fed rate hike have risen.
02|U.S. unemployment rate falls to 4.1%
Employment and unemployment improved at the same time. The U.S. economy remains resilient, and expectations for the interest rate path may continue to shift.
03|U.S. stock futures diverge after nonfarm payrolls report
21:31 snapshot: Nasdaq 100 futures rose 1.37%, S&P 500 futures rose 0.11%, and Dow futures fell 0.96%.
04|Canadian employment weakens
Employment fell by 4,700 in October, and the unemployment rate rose to 6.7%, in stark contrast with the U.S.
05|South Korean stock market triggers intraday circuit breaker
The KOSPI plunged as much as 8.8% before closing down 6.02%. The global AI supply chain came under concentrated selling pressure.
2026.11.06 Financial Evening News
01|U.S. nonfarm payrolls unexpectedly strong
Employment increased by 165,000 in October, far exceeding expectations of 65,000. Expectations of a December Fed rate hike have risen.
02|U.S. unemployment rate falls to 4.1%
Employment and unemployment improved at the same time. The U.S. economy remains resilient, and expectations for the interest rate path may continue to shift.
03|U.S. stock futures diverge after nonfarm payrolls report
21:31 snapshot: Nasdaq 100 futures rose 1.37%, S&P 500 futures rose 0.11%, and Dow futures fell 0.96%.
04|Canadian employment weakens
Employment fell by 4,700 in October, and the unemployment rate rose to 6.7%, in stark contrast with the U.S.
05|South Korean stock market triggers intraday circuit breaker
The KOSPI plunged as much as 8.8% before closing down 6.02%. The global AI supply chain came under concentrated selling pressure.
Employment increased by 165,000 in October, far exceeding expectations of 65,000. Expectations of a December Fed rate hike have risen.
02|U.S. unemployment rate falls to 4.1%
Employment and unemployment improved at the same time. The U.S. economy remains resilient, and expectations for the interest rate path may continue to shift.
03|U.S. stock futures diverge after nonfarm payrolls report
21:31 snapshot: Nasdaq 100 futures rose 1.37%, S&P 500 futures rose 0.11%, and Dow futures fell 0.96%.
04|Canadian employment weakens
Employment fell by 4,700 in October, and the unemployment rate rose to 6.7%, in stark contrast with the U.S.
05|South Korean stock market triggers intraday circuit breaker
The KOSPI plunged as much as 8.8% before closing down 6.02%. The global AI supply chain came under concentrated selling pressure.
313
·
--
The Trump family’s token has fallen more than 60% this year, and now it’s launching a buyback! Can WLFI reverse its decline with buybacks?
World Liberty Financial, co-founded by members of the Trump family, announced the launch of a buyback program for its WLFI governance token. Initial funding may come from revenue related to USD1 stablecoin reserves, among other sources. WLFI fell about 10% after the U.S. midterm elections and is down more than 60% so far this year.
The Trump family’s token has fallen more than 60% this year, and now it’s launching a buyback! Can WLFI reverse its decline with buybacks?
World Liberty Financial, co-founded by members of the Trump family, announced the launch of a buyback program for its WLFI governance token. Initial funding may come from revenue related to USD1 stablecoin reserves, among other sources. WLFI fell about 10% after the U.S. midterm elections and is down more than 60% so far this year.
World Liberty Financial, co-founded by members of the Trump family, announced the launch of a buyback program for its WLFI governance token. Initial funding may come from revenue related to USD1 stablecoin reserves, among other sources. WLFI fell about 10% after the U.S. midterm elections and is down more than 60% so far this year.
165
·
--
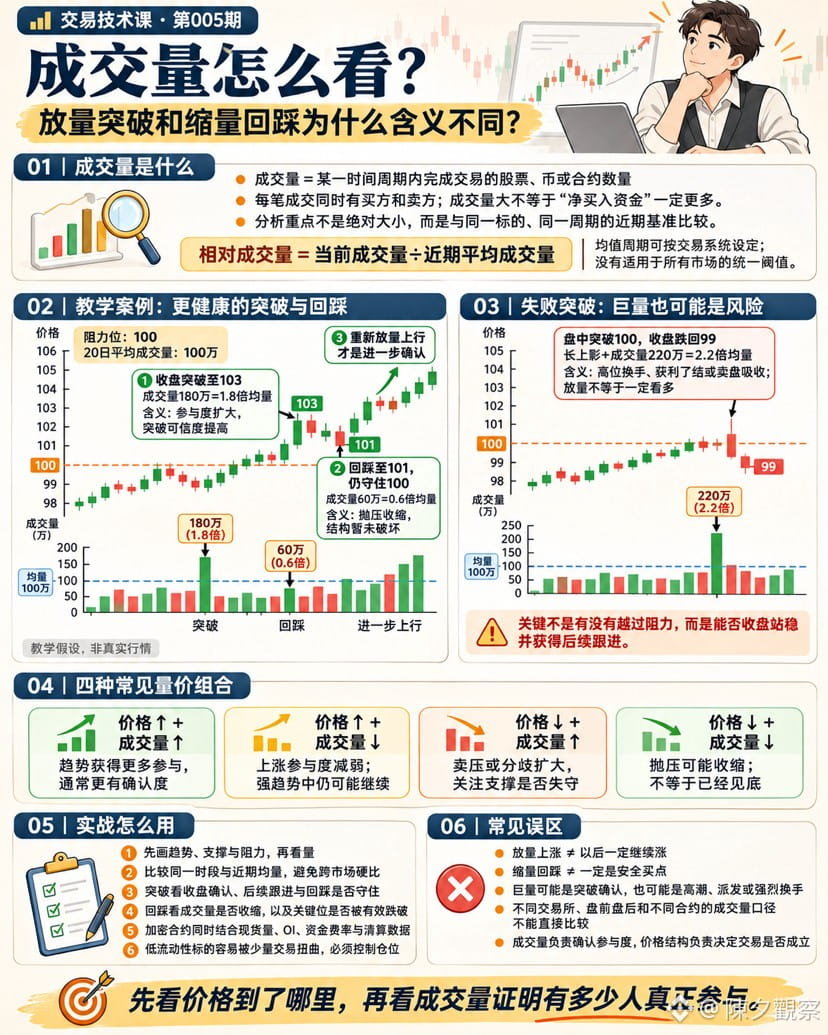
How should you read trading volume? Why do breakouts on high volume and pullbacks on low volume mean different things?
📊 Why is high volume when breaking resistance and low volume when retesting support usually considered a healthier price-volume structure?
Trading volume is the number of shares, coins, or contracts traded during a given period. Every trade has both a buyer and a seller, so high volume does not necessarily mean there is more net buying.
The focus is not on absolute values, but on how volume compares with the recent baseline for the same asset and timeframe:
Relative volume = Current volume ÷ Recent average volume
Example from the chart:
Resistance: 100
20-day average volume: 1 million
Closes above resistance at 103, with volume of 1.8 million (1.8× average volume)
Pulls back to 101 and holds above 100, with volume falling to 600,000 (0.6× average volume)
A breakout on high volume indicates that more traders are participating, which usually makes the breakout more credible. A pullback on low volume may reflect weaker selling interest. However, these are only confirmation signals and cannot guarantee that the price will continue rising.
If the price breaks above 100 intraday but leaves a long upper wick and closes back at 99, even volume at 2.2× average may indicate heavy turnover near the highs, profit-taking, or selling being absorbed—not a valid breakout.
Order of analysis: First check the price level → then confirm the close → observe volume → wait for follow-through or a pullback.
Common price-volume combinations:
Price rises + volume increases: Participation expands, usually providing stronger trend confirmation
Price rises + volume decreases: Participation weakens, but the price may still rise in a strong trend
Price falls + volume increases: Selling pressure or disagreement intensifies
Price falls + volume decreases: Selling pressure may be easing, but this does not mean the price has bottomed
Breakouts, trends, and reversal patterns are usually better confirmed when accompanied by rising volume, but technical patterns remain probabilistic signals.
⚠️ In crypto markets, distinguish spot volume from contract volume, and consider OI, funding rates, and liquidation data. Volume figures from different exchanges, pre-market and after-hours sessions, and different contracts are not directly comparable.
Check the price level first, then use volume to verify the degree of actual participation.
📅 Coming next
Saturday|Trading in Practice|Episode 005
《How to Trade a Breakout on High Volume: A Complete Case Study from Confirmation and Retest to Stop-Loss》
{future}(BTCUSDT)
How should you read trading volume? Why do breakouts on high volume and pullbacks on low volume mean different things?
📊 Why is high volume when breaking resistance and low volume when retesting support usually considered a healthier price-volume structure?
Trading volume is the number of shares, coins, or contracts traded during a given period. Every trade has both a buyer and a seller, so high volume does not necessarily mean there is more net buying.
The focus is not on absolute values, but on how volume compares with the recent baseline for the same asset and timeframe:
Relative volume = Current volume ÷ Recent average volume
Example from the chart:
Resistance: 100
20-day average volume: 1 million
Closes above resistance at 103, with volume of 1.8 million (1.8× average volume)
Pulls back to 101 and holds above 100, with volume falling to 600,000 (0.6× average volume)
A breakout on high volume indicates that more traders are participating, which usually makes the breakout more credible. A pullback on low volume may reflect weaker selling interest. However, these are only confirmation signals and cannot guarantee that the price will continue rising.
If the price breaks above 100 intraday but leaves a long upper wick and closes back at 99, even volume at 2.2× average may indicate heavy turnover near the highs, profit-taking, or selling being absorbed—not a valid breakout.
Order of analysis: First check the price level → then confirm the close → observe volume → wait for follow-through or a pullback.
Common price-volume combinations:
Price rises + volume increases: Participation expands, usually providing stronger trend confirmation
Price rises + volume decreases: Participation weakens, but the price may still rise in a strong trend
Price falls + volume increases: Selling pressure or disagreement intensifies
Price falls + volume decreases: Selling pressure may be easing, but this does not mean the price has bottomed
Breakouts, trends, and reversal patterns are usually better confirmed when accompanied by rising volume, but technical patterns remain probabilistic signals.
⚠️ In crypto markets, distinguish spot volume from contract volume, and consider OI, funding rates, and liquidation data. Volume figures from different exchanges, pre-market and after-hours sessions, and different contracts are not directly comparable.
Check the price level first, then use volume to verify the degree of actual participation.
📅 Coming next
Saturday|Trading in Practice|Episode 005
《How to Trade a Breakout on High Volume: A Complete Case Study from Confirmation and Retest to Stop-Loss》
📊 Why is high volume when breaking resistance and low volume when retesting support usually considered a healthier price-volume structure?
Trading volume is the number of shares, coins, or contracts traded during a given period. Every trade has both a buyer and a seller, so high volume does not necessarily mean there is more net buying.
The focus is not on absolute values, but on how volume compares with the recent baseline for the same asset and timeframe:
Relative volume = Current volume ÷ Recent average volume
Example from the chart:
Resistance: 100
20-day average volume: 1 million
Closes above resistance at 103, with volume of 1.8 million (1.8× average volume)
Pulls back to 101 and holds above 100, with volume falling to 600,000 (0.6× average volume)
A breakout on high volume indicates that more traders are participating, which usually makes the breakout more credible. A pullback on low volume may reflect weaker selling interest. However, these are only confirmation signals and cannot guarantee that the price will continue rising.
If the price breaks above 100 intraday but leaves a long upper wick and closes back at 99, even volume at 2.2× average may indicate heavy turnover near the highs, profit-taking, or selling being absorbed—not a valid breakout.
Order of analysis: First check the price level → then confirm the close → observe volume → wait for follow-through or a pullback.
Common price-volume combinations:
Price rises + volume increases: Participation expands, usually providing stronger trend confirmation
Price rises + volume decreases: Participation weakens, but the price may still rise in a strong trend
Price falls + volume increases: Selling pressure or disagreement intensifies
Price falls + volume decreases: Selling pressure may be easing, but this does not mean the price has bottomed
Breakouts, trends, and reversal patterns are usually better confirmed when accompanied by rising volume, but technical patterns remain probabilistic signals.
⚠️ In crypto markets, distinguish spot volume from contract volume, and consider OI, funding rates, and liquidation data. Volume figures from different exchanges, pre-market and after-hours sessions, and different contracts are not directly comparable.
Check the price level first, then use volume to verify the degree of actual participation.
📅 Coming next
Saturday|Trading in Practice|Episode 005
《How to Trade a Breakout on High Volume: A Complete Case Study from Confirmation and Retest to Stop-Loss》
133
·
--

Article
2026.11.06 Financial Morning Brief01 | Nasdaq plunges 5.52%, enters correction territory
U.S. technology stocks came under heavy selling pressure. The Nasdaq closed at 24,315, down more than 10% from its October high. Expectations for AI investment are being repriced.
02 | S&P 500 and Dow both plunge
The S&P 500 fell 4.36%, while the Dow dropped 3.44%. The post-midterm election rally was quickly reversed.
03 | Semiconductor index plunges more than 12%
The Philadelphia Semiconductor Index suffered a rare, sharp single-day decline. Chip, memory, and AI infrastructure stocks were the main sources of selling pressure.
04 | Nvidia and AMD plunge
Nvidia fell about 9.3%, while AMD dropped more than 17%. The market is reassessing the growth of AI infrastructure and the returns on investment.
2026.11.06 Financial Morning Brief
01 | Nasdaq plunges 5.52%, enters correction territory
U.S. technology stocks came under heavy selling pressure. The Nasdaq closed at 24,315, down more than 10% from its October high. Expectations for AI investment are being repriced.
02 | S&P 500 and Dow both plunge
The S&P 500 fell 4.36%, while the Dow dropped 3.44%. The post-midterm election rally was quickly reversed.
03 | Semiconductor index plunges more than 12%
The Philadelphia Semiconductor Index suffered a rare, sharp single-day decline. Chip, memory, and AI infrastructure stocks were the main sources of selling pressure.
04 | Nvidia and AMD plunge
Nvidia fell about 9.3%, while AMD dropped more than 17%. The market is reassessing the growth of AI infrastructure and the returns on investment.
U.S. technology stocks came under heavy selling pressure. The Nasdaq closed at 24,315, down more than 10% from its October high. Expectations for AI investment are being repriced.
02 | S&P 500 and Dow both plunge
The S&P 500 fell 4.36%, while the Dow dropped 3.44%. The post-midterm election rally was quickly reversed.
03 | Semiconductor index plunges more than 12%
The Philadelphia Semiconductor Index suffered a rare, sharp single-day decline. Chip, memory, and AI infrastructure stocks were the main sources of selling pressure.
04 | Nvidia and AMD plunge
Nvidia fell about 9.3%, while AMD dropped more than 17%. The market is reassessing the growth of AI infrastructure and the returns on investment.
216
·
--

Article
2026.11.05 Financial Evening News01|Bank of England raises rates to 4%
The Bank of England voted 8–1 to raise interest rates by 25 basis points, the first hike in more than three years. Energy-driven inflationary pressures remain significant.
02|UK may continue raising interest rates
The governor said further rate hikes may still be possible if the Middle East conflict continues to push up energy prices.
03|UK inflation forecast revised upward
Inflation is expected to reach 4.8% in the second quarter of 2027, and could rise to 6.2% in a more severe oil-price shock scenario.
04|South Korean stocks plunge 5.3%
The KOSPI closed down 5.3%. Semiconductor stocks came under pressure amid market concerns over tighter US regulation of AI data centers.
05|Japanese stocks fall 1.8%
The Nikkei 225 fell about 1.8%. AI hardware stocks weakened, as funds rotated into other sectors.
2026.11.05 Financial Evening News
01|Bank of England raises rates to 4%
The Bank of England voted 8–1 to raise interest rates by 25 basis points, the first hike in more than three years. Energy-driven inflationary pressures remain significant.
02|UK may continue raising interest rates
The governor said further rate hikes may still be possible if the Middle East conflict continues to push up energy prices.
03|UK inflation forecast revised upward
Inflation is expected to reach 4.8% in the second quarter of 2027, and could rise to 6.2% in a more severe oil-price shock scenario.
04|South Korean stocks plunge 5.3%
The KOSPI closed down 5.3%. Semiconductor stocks came under pressure amid market concerns over tighter US regulation of AI data centers.
05|Japanese stocks fall 1.8%
The Nikkei 225 fell about 1.8%. AI hardware stocks weakened, as funds rotated into other sectors.
The Bank of England voted 8–1 to raise interest rates by 25 basis points, the first hike in more than three years. Energy-driven inflationary pressures remain significant.
02|UK may continue raising interest rates
The governor said further rate hikes may still be possible if the Middle East conflict continues to push up energy prices.
03|UK inflation forecast revised upward
Inflation is expected to reach 4.8% in the second quarter of 2027, and could rise to 6.2% in a more severe oil-price shock scenario.
04|South Korean stocks plunge 5.3%
The KOSPI closed down 5.3%. Semiconductor stocks came under pressure amid market concerns over tighter US regulation of AI data centers.
05|Japanese stocks fall 1.8%
The Nikkei 225 fell about 1.8%. AI hardware stocks weakened, as funds rotated into other sectors.
73
·
--
Verified

Article
$16 Million in ZEC Could Be Permanently Locked! Zcash’s Most Important Upgrade Yet: A Boon or a Risk?A technical upgrade originally intended to speed up transactions could leave approximately $16 million worth of crypto assets unable to be transferred.
Privacy coin Zcash (ZEC) is about to undergo the NU7 network upgrade. But the most controversial aspect of this upgrade isn’t the performance boost—it’s that some longtime users may never be able to move their assets again.
What happened?
According to Zcash’s official upgrade schedule, NU7 will activate on mainnet when it reaches block height 3,543,405, which is expected around November 5–6.
After the upgrade, Zcash will completely disable transfers from the legacy Sprout privacy pool.
$16 Million in ZEC Could Be Permanently Locked! Zcash’s Most Important Upgrade Yet: A Boon or a Risk?
A technical upgrade originally intended to speed up transactions could leave approximately $16 million worth of crypto assets unable to be transferred.
Privacy coin Zcash (ZEC) is about to undergo the NU7 network upgrade. But the most controversial aspect of this upgrade isn’t the performance boost—it’s that some longtime users may never be able to move their assets again.
What happened?
According to Zcash’s official upgrade schedule, NU7 will activate on mainnet when it reaches block height 3,543,405, which is expected around November 5–6.
After the upgrade, Zcash will completely disable transfers from the legacy Sprout privacy pool.
Privacy coin Zcash (ZEC) is about to undergo the NU7 network upgrade. But the most controversial aspect of this upgrade isn’t the performance boost—it’s that some longtime users may never be able to move their assets again.
What happened?
According to Zcash’s official upgrade schedule, NU7 will activate on mainnet when it reaches block height 3,543,405, which is expected around November 5–6.
After the upgrade, Zcash will completely disable transfers from the legacy Sprout privacy pool.
1
1.5k
·
--
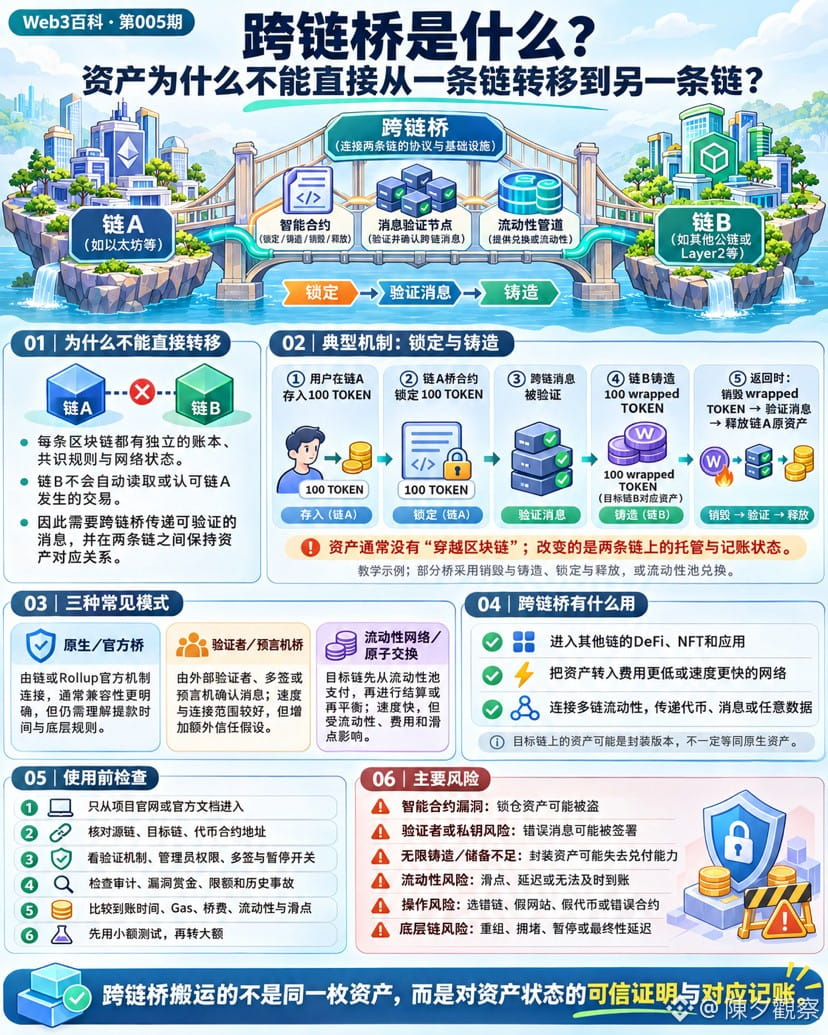
What is a cross-chain bridge? Why can’t assets move directly from one blockchain to another?
🌉 When assets are transferred to another chain, does the same token really “pass through” the blockchain?
Usually, no.
Each blockchain has its own ledger, consensus rules, and network state. Chain B does not automatically read or recognize transactions on Chain A, so assets cannot simply be copied over like files.
Here’s a common example of the “lock and mint” model:
Assets deposited on Chain A → Bridge contract locks them → Cross-chain message is verified → Corresponding assets are minted on Chain B
Suppose a user transfers 100 TOKEN across chains:
The bridge contract on Chain A locks 100 TOKEN
Validators or an on-chain mechanism confirm the deposit
100 wrapped TOKEN are minted on Chain B
When returning, the wrapped TOKEN are burned
After the message is verified, the original assets are released on Chain A
A cross-chain bridge changes the custody and accounting states on the two chains; the original assets do not actually leave the source chain. Different bridges may also use models such as burn and mint, lock and release, or liquidity-pool swaps.
Common types of cross-chain bridges include:
Native/official bridges: Connect chains through mechanisms provided by a blockchain or Rollup’s official team
Validator/oracle bridges: Rely on external validators, multisigs, or oracles to verify messages
Liquidity networks: Pay out from a liquidity pool on the destination chain first, then settle or rebalance later
Cross-chain bridges expand the ways assets and applications can be used, but they also introduce additional trust assumptions. Key risks include smart contract vulnerabilities, validator private-key leaks, incorrectly signed messages, unlimited minting, insufficient reserves, depleted liquidity, and wrapped assets losing their ability to be redeemed.
Before using a bridge, at a minimum check:
Whether you accessed it through the project’s official website or documentation
Whether the source chain, destination chain, and token contract are correct
Who verifies cross-chain messages and what permissions administrators have
Whether it has been audited, and whether it has a pause switch and transfer limits
Arrival time, gas, bridge fees, liquidity, and slippage
Start with a small test transfer the first time you use it
⚠️ Wrapped assets on the destination chain are not necessarily equivalent to native assets. A bridge’s security depends on its weakest verification, contract, or custody component.
A cross-chain bridge does not move the same asset; it carries a trusted proof of the asset’s status and records the corresponding accounting entries.
Coming up next
Friday | Trading Technicals | Episode 005
“How do you read trading volume? Why do breakouts on rising volume and pullbacks on falling volume mean different things?”
#
What is a cross-chain bridge? Why can’t assets move directly from one blockchain to another?
🌉 When assets are transferred to another chain, does the same token really “pass through” the blockchain?
Usually, no.
Each blockchain has its own ledger, consensus rules, and network state. Chain B does not automatically read or recognize transactions on Chain A, so assets cannot simply be copied over like files.
Here’s a common example of the “lock and mint” model:
Assets deposited on Chain A → Bridge contract locks them → Cross-chain message is verified → Corresponding assets are minted on Chain B
Suppose a user transfers 100 TOKEN across chains:
The bridge contract on Chain A locks 100 TOKEN
Validators or an on-chain mechanism confirm the deposit
100 wrapped TOKEN are minted on Chain B
When returning, the wrapped TOKEN are burned
After the message is verified, the original assets are released on Chain A
A cross-chain bridge changes the custody and accounting states on the two chains; the original assets do not actually leave the source chain. Different bridges may also use models such as burn and mint, lock and release, or liquidity-pool swaps.
Common types of cross-chain bridges include:
Native/official bridges: Connect chains through mechanisms provided by a blockchain or Rollup’s official team
Validator/oracle bridges: Rely on external validators, multisigs, or oracles to verify messages
Liquidity networks: Pay out from a liquidity pool on the destination chain first, then settle or rebalance later
Cross-chain bridges expand the ways assets and applications can be used, but they also introduce additional trust assumptions. Key risks include smart contract vulnerabilities, validator private-key leaks, incorrectly signed messages, unlimited minting, insufficient reserves, depleted liquidity, and wrapped assets losing their ability to be redeemed.
Before using a bridge, at a minimum check:
Whether you accessed it through the project’s official website or documentation
Whether the source chain, destination chain, and token contract are correct
Who verifies cross-chain messages and what permissions administrators have
Whether it has been audited, and whether it has a pause switch and transfer limits
Arrival time, gas, bridge fees, liquidity, and slippage
Start with a small test transfer the first time you use it
⚠️ Wrapped assets on the destination chain are not necessarily equivalent to native assets. A bridge’s security depends on its weakest verification, contract, or custody component.
A cross-chain bridge does not move the same asset; it carries a trusted proof of the asset’s status and records the corresponding accounting entries.
Coming up next
Friday | Trading Technicals | Episode 005
“How do you read trading volume? Why do breakouts on rising volume and pullbacks on falling volume mean different things?”
#
🌉 When assets are transferred to another chain, does the same token really “pass through” the blockchain?
Usually, no.
Each blockchain has its own ledger, consensus rules, and network state. Chain B does not automatically read or recognize transactions on Chain A, so assets cannot simply be copied over like files.
Here’s a common example of the “lock and mint” model:
Assets deposited on Chain A → Bridge contract locks them → Cross-chain message is verified → Corresponding assets are minted on Chain B
Suppose a user transfers 100 TOKEN across chains:
The bridge contract on Chain A locks 100 TOKEN
Validators or an on-chain mechanism confirm the deposit
100 wrapped TOKEN are minted on Chain B
When returning, the wrapped TOKEN are burned
After the message is verified, the original assets are released on Chain A
A cross-chain bridge changes the custody and accounting states on the two chains; the original assets do not actually leave the source chain. Different bridges may also use models such as burn and mint, lock and release, or liquidity-pool swaps.
Common types of cross-chain bridges include:
Native/official bridges: Connect chains through mechanisms provided by a blockchain or Rollup’s official team
Validator/oracle bridges: Rely on external validators, multisigs, or oracles to verify messages
Liquidity networks: Pay out from a liquidity pool on the destination chain first, then settle or rebalance later
Cross-chain bridges expand the ways assets and applications can be used, but they also introduce additional trust assumptions. Key risks include smart contract vulnerabilities, validator private-key leaks, incorrectly signed messages, unlimited minting, insufficient reserves, depleted liquidity, and wrapped assets losing their ability to be redeemed.
Before using a bridge, at a minimum check:
Whether you accessed it through the project’s official website or documentation
Whether the source chain, destination chain, and token contract are correct
Who verifies cross-chain messages and what permissions administrators have
Whether it has been audited, and whether it has a pause switch and transfer limits
Arrival time, gas, bridge fees, liquidity, and slippage
Start with a small test transfer the first time you use it
⚠️ Wrapped assets on the destination chain are not necessarily equivalent to native assets. A bridge’s security depends on its weakest verification, contract, or custody component.
A cross-chain bridge does not move the same asset; it carries a trusted proof of the asset’s status and records the corresponding accounting entries.
Coming up next
Friday | Trading Technicals | Episode 005
“How do you read trading volume? Why do breakouts on rising volume and pullbacks on falling volume mean different things?”
#
52
·
--

Article
Financial Morning Briefing — November 5, 20261. U.S. stocks surge, Dow jumps 1,569 points
U.S. stocks rebounded strongly after the midterm elections. The Dow rose about 3%, the S&P 500 gained 1.6%, and the Nasdaq climbed 1.4%. Performance varied widely across the technology sector.
2. Consumer stocks lead gains, energy stocks plunge
The S&P 500 consumer discretionary sector rose 4.3%, while the energy sector fell 4.8%. The sharp drop in oil prices is reshaping earnings expectations across industries.
3. U.S. defense stocks under pressure
Defense contractors such as Lockheed Martin and RTX fell. Markets are concerned that the new Congress will increase scrutiny of the massive defense budget.
4. Solar ETF surges nearly 6%
After the midterm elections, markets reassessed the outlook for clean energy policy. The Invesco Solar ETF rose nearly 6%.
Financial Morning Briefing — November 5, 2026
1. U.S. stocks surge, Dow jumps 1,569 points
U.S. stocks rebounded strongly after the midterm elections. The Dow rose about 3%, the S&P 500 gained 1.6%, and the Nasdaq climbed 1.4%. Performance varied widely across the technology sector.
2. Consumer stocks lead gains, energy stocks plunge
The S&P 500 consumer discretionary sector rose 4.3%, while the energy sector fell 4.8%. The sharp drop in oil prices is reshaping earnings expectations across industries.
3. U.S. defense stocks under pressure
Defense contractors such as Lockheed Martin and RTX fell. Markets are concerned that the new Congress will increase scrutiny of the massive defense budget.
4. Solar ETF surges nearly 6%
After the midterm elections, markets reassessed the outlook for clean energy policy. The Invesco Solar ETF rose nearly 6%.
U.S. stocks rebounded strongly after the midterm elections. The Dow rose about 3%, the S&P 500 gained 1.6%, and the Nasdaq climbed 1.4%. Performance varied widely across the technology sector.
2. Consumer stocks lead gains, energy stocks plunge
The S&P 500 consumer discretionary sector rose 4.3%, while the energy sector fell 4.8%. The sharp drop in oil prices is reshaping earnings expectations across industries.
3. U.S. defense stocks under pressure
Defense contractors such as Lockheed Martin and RTX fell. Markets are concerned that the new Congress will increase scrutiny of the massive defense budget.
4. Solar ETF surges nearly 6%
After the midterm elections, markets reassessed the outlook for clean energy policy. The Invesco Solar ETF rose nearly 6%.
512
·
--
Verified

Article
2026.11.04 Financial Evening News1. U.S. midterm election results are in
The Democratic Party won control of both chambers of the U.S. Congress. Markets are reassessing AI regulation, fiscal spending, and cryptocurrency policy, while the dollar and Treasury yields fell.
2. The U.S. dollar falls to a one-month low
Reuters Asia trading data showed the U.S. dollar index briefly fell to 101.27, while the 10-year U.S. Treasury yield slipped to around 4.915%. Funds shifted to Treasuries and gold.
3. China’s central bank rolls out further policy support for the stock market
Applications for relending to support stock buybacks and share purchases exceeded 200 billion yuan, and the tool’s interest rate fell to 1%. Financing costs have declined, but actual lending remains to be seen.
2026.11.04 Financial Evening News
1. U.S. midterm election results are in
The Democratic Party won control of both chambers of the U.S. Congress. Markets are reassessing AI regulation, fiscal spending, and cryptocurrency policy, while the dollar and Treasury yields fell.
2. The U.S. dollar falls to a one-month low
Reuters Asia trading data showed the U.S. dollar index briefly fell to 101.27, while the 10-year U.S. Treasury yield slipped to around 4.915%. Funds shifted to Treasuries and gold.
3. China’s central bank rolls out further policy support for the stock market
Applications for relending to support stock buybacks and share purchases exceeded 200 billion yuan, and the tool’s interest rate fell to 1%. Financing costs have declined, but actual lending remains to be seen.
The Democratic Party won control of both chambers of the U.S. Congress. Markets are reassessing AI regulation, fiscal spending, and cryptocurrency policy, while the dollar and Treasury yields fell.
2. The U.S. dollar falls to a one-month low
Reuters Asia trading data showed the U.S. dollar index briefly fell to 101.27, while the 10-year U.S. Treasury yield slipped to around 4.915%. Funds shifted to Treasuries and gold.
3. China’s central bank rolls out further policy support for the stock market
Applications for relending to support stock buybacks and share purchases exceeded 200 billion yuan, and the tool’s interest rate fell to 1%. Financing costs have declined, but actual lending remains to be seen.
596
·
--

Article
🇺🇸 U.S. Midterm Elections: What Is the Market Expecting? Wall Street Is Repricing!An election is reshaping expectations in global capital markets.
The results of the 2026 U.S. midterm elections are in: Democrats won majorities in both the Senate and the House, breaking the Republican Party’s hold on the White House and Congress.
Markets reacted swiftly: Nasdaq futures briefly fell more than 2%, the dollar weakened, U.S. Treasuries attracted strong demand, gold rose more than 2%, and cryptocurrencies saw short-term volatility.
What truly deserves attention is not who won the election, but how U.S. economic policy will change over the next two years.
I. What is Wall Street most looking forward to?
Markets had expected political uncertainty to ease after the election, with attention shifting back to corporate earnings, economic growth, and Fed policy.
🇺🇸 U.S. Midterm Elections: What Is the Market Expecting? Wall Street Is Repricing!
An election is reshaping expectations in global capital markets.
The results of the 2026 U.S. midterm elections are in: Democrats won majorities in both the Senate and the House, breaking the Republican Party’s hold on the White House and Congress.
Markets reacted swiftly: Nasdaq futures briefly fell more than 2%, the dollar weakened, U.S. Treasuries attracted strong demand, gold rose more than 2%, and cryptocurrencies saw short-term volatility.
What truly deserves attention is not who won the election, but how U.S. economic policy will change over the next two years.
I. What is Wall Street most looking forward to?
Markets had expected political uncertainty to ease after the election, with attention shifting back to corporate earnings, economic growth, and Fed policy.
The results of the 2026 U.S. midterm elections are in: Democrats won majorities in both the Senate and the House, breaking the Republican Party’s hold on the White House and Congress.
Markets reacted swiftly: Nasdaq futures briefly fell more than 2%, the dollar weakened, U.S. Treasuries attracted strong demand, gold rose more than 2%, and cryptocurrencies saw short-term volatility.
What truly deserves attention is not who won the election, but how U.S. economic policy will change over the next two years.
I. What is Wall Street most looking forward to?
Markets had expected political uncertainty to ease after the election, with attention shifting back to corporate earnings, economic growth, and Fed policy.
258
·
--
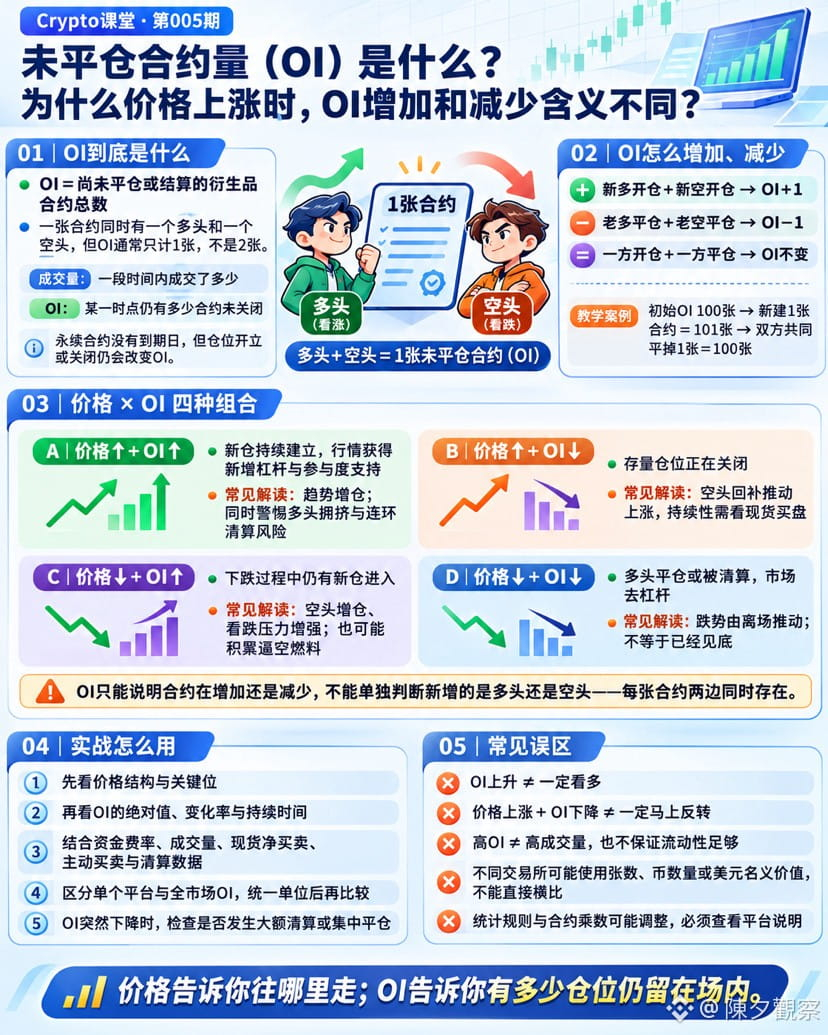
What is Open Interest (OI)? Why do increases and decreases in OI mean different things when prices rise?
📊 If prices are rising, why do increases and decreases in OI reflect completely different market structures?
Open Interest (OI) is the total number of derivatives contracts that have not yet been closed or settled.
Each contract has both a long and a short position, but OI usually counts it as just one contract:
New long opened + new short opened: OI increases
Existing long closed + existing short closed: OI decreases
One side opens a position + the other side closes: OI remains unchanged
Trading volume measures the amount traded over a period of time; OI reflects the number of contracts still in the market at a given point in time.
Common interpretations when looking at price movements alongside OI:
Price rises + OI increases: New positions are being opened, supporting the trend with additional participation, though leverage and the risk of crowded long positions may also increase
Price rises + OI decreases: Existing positions are being closed; the rise may be driven more by short covering
Price falls + OI increases: New positions are still being opened as prices fall, often indicating shorts adding to their positions, though this could also build the risk of a future short squeeze
Price falls + OI decreases: Long positions are being closed or liquidated. The market is deleveraging, but that does not mean the price has bottomed
A rise accompanied by increasing OI generally indicates greater participation from new capital than a rise accompanied by falling OI; the latter may be driven more by short covering.
⚠️ OI only shows whether the number of contracts is increasing or decreasing; on its own, it cannot tell whether the new positions are long or short. Every contract has both sides. In practice, you also need to consider funding rates, spot buying, aggressive trades, trading volume, and liquidation data.
Exchanges may use different units, such as the number of contracts, the number of coins, or notional value in dollars, and their calculation methods may also change. Make sure you are comparing like with like before making cross-exchange comparisons.
Price tells you which way the market is moving; OI tells you how many positions remain in the market.
📅 Coming next
Thursday|Web3 Encyclopedia|Issue 005
“What is a cross-chain bridge? Why can’t assets be transferred directly from one chain to another?”
What is Open Interest (OI)? Why do increases and decreases in OI mean different things when prices rise?
📊 If prices are rising, why do increases and decreases in OI reflect completely different market structures?
Open Interest (OI) is the total number of derivatives contracts that have not yet been closed or settled.
Each contract has both a long and a short position, but OI usually counts it as just one contract:
New long opened + new short opened: OI increases
Existing long closed + existing short closed: OI decreases
One side opens a position + the other side closes: OI remains unchanged
Trading volume measures the amount traded over a period of time; OI reflects the number of contracts still in the market at a given point in time.
Common interpretations when looking at price movements alongside OI:
Price rises + OI increases: New positions are being opened, supporting the trend with additional participation, though leverage and the risk of crowded long positions may also increase
Price rises + OI decreases: Existing positions are being closed; the rise may be driven more by short covering
Price falls + OI increases: New positions are still being opened as prices fall, often indicating shorts adding to their positions, though this could also build the risk of a future short squeeze
Price falls + OI decreases: Long positions are being closed or liquidated. The market is deleveraging, but that does not mean the price has bottomed
A rise accompanied by increasing OI generally indicates greater participation from new capital than a rise accompanied by falling OI; the latter may be driven more by short covering.
⚠️ OI only shows whether the number of contracts is increasing or decreasing; on its own, it cannot tell whether the new positions are long or short. Every contract has both sides. In practice, you also need to consider funding rates, spot buying, aggressive trades, trading volume, and liquidation data.
Exchanges may use different units, such as the number of contracts, the number of coins, or notional value in dollars, and their calculation methods may also change. Make sure you are comparing like with like before making cross-exchange comparisons.
Price tells you which way the market is moving; OI tells you how many positions remain in the market.
📅 Coming next
Thursday|Web3 Encyclopedia|Issue 005
“What is a cross-chain bridge? Why can’t assets be transferred directly from one chain to another?”
📊 If prices are rising, why do increases and decreases in OI reflect completely different market structures?
Open Interest (OI) is the total number of derivatives contracts that have not yet been closed or settled.
Each contract has both a long and a short position, but OI usually counts it as just one contract:
New long opened + new short opened: OI increases
Existing long closed + existing short closed: OI decreases
One side opens a position + the other side closes: OI remains unchanged
Trading volume measures the amount traded over a period of time; OI reflects the number of contracts still in the market at a given point in time.
Common interpretations when looking at price movements alongside OI:
Price rises + OI increases: New positions are being opened, supporting the trend with additional participation, though leverage and the risk of crowded long positions may also increase
Price rises + OI decreases: Existing positions are being closed; the rise may be driven more by short covering
Price falls + OI increases: New positions are still being opened as prices fall, often indicating shorts adding to their positions, though this could also build the risk of a future short squeeze
Price falls + OI decreases: Long positions are being closed or liquidated. The market is deleveraging, but that does not mean the price has bottomed
A rise accompanied by increasing OI generally indicates greater participation from new capital than a rise accompanied by falling OI; the latter may be driven more by short covering.
⚠️ OI only shows whether the number of contracts is increasing or decreasing; on its own, it cannot tell whether the new positions are long or short. Every contract has both sides. In practice, you also need to consider funding rates, spot buying, aggressive trades, trading volume, and liquidation data.
Exchanges may use different units, such as the number of contracts, the number of coins, or notional value in dollars, and their calculation methods may also change. Make sure you are comparing like with like before making cross-exchange comparisons.
Price tells you which way the market is moving; OI tells you how many positions remain in the market.
📅 Coming next
Thursday|Web3 Encyclopedia|Issue 005
“What is a cross-chain bridge? Why can’t assets be transferred directly from one chain to another?”
58
·
--

Article
Financial Morning Briefing — November 4, 202601|U.S. Employment Data Exceeds Expectations
JOLTS job openings rose to 7.523 million in September, well above market expectations. The labor market remains resilient, putting the Fed's interest rate path back in focus.
02|U.S. Layoffs Fall to an 18-Month Low
Layoffs fell to 1.641 million in September, while voluntary quits increased significantly. There are no signs yet of widespread deterioration in the labor market.
03|U.S. Midterm Elections Enter Vote-Counting Phase
Polling stations in some states are gradually closing, but control of Congress remains undecided. Expectations for fiscal policy, taxes, and AI regulation may shift with the election results.
04|Nasdaq Rebounds, Dow Falls
Financial Morning Briefing — November 4, 2026
01|U.S. Employment Data Exceeds Expectations
JOLTS job openings rose to 7.523 million in September, well above market expectations. The labor market remains resilient, putting the Fed's interest rate path back in focus.
02|U.S. Layoffs Fall to an 18-Month Low
Layoffs fell to 1.641 million in September, while voluntary quits increased significantly. There are no signs yet of widespread deterioration in the labor market.
03|U.S. Midterm Elections Enter Vote-Counting Phase
Polling stations in some states are gradually closing, but control of Congress remains undecided. Expectations for fiscal policy, taxes, and AI regulation may shift with the election results.
04|Nasdaq Rebounds, Dow Falls
JOLTS job openings rose to 7.523 million in September, well above market expectations. The labor market remains resilient, putting the Fed's interest rate path back in focus.
02|U.S. Layoffs Fall to an 18-Month Low
Layoffs fell to 1.641 million in September, while voluntary quits increased significantly. There are no signs yet of widespread deterioration in the labor market.
03|U.S. Midterm Elections Enter Vote-Counting Phase
Polling stations in some states are gradually closing, but control of Congress remains undecided. Expectations for fiscal policy, taxes, and AI regulation may shift with the election results.
04|Nasdaq Rebounds, Dow Falls
418
·
--

Article
Financial Evening Briefing — November 3, 202601|Reserve Bank of Australia raises rates to 4.85%
The Reserve Bank of Australia raised rates by another 25 basis points, bringing the policy rate to an 18-year high. The 6–3 vote and changes to the statement suggest the rate-hiking cycle may be nearing its end.
02|Reserve Bank of Australia warns inflation remains high
Inflation may reach 4.5% in the fourth quarter. High prices and slowing employment coexist, leaving policymakers in a dilemma.
03|China’s central bank adjusts the foreign exchange reserve requirement ratio
Effective November 15, the foreign exchange reserve requirement ratio will rise from 4% to 6%, interpreted by the market as a signal to curb the yuan’s rapid appreciation.
04|Yuan weakens intraday
After the policy announcement, the dollar rose to 6.6765 yuan onshore. Markets will watch the daily midpoint and changes in corporate foreign exchange settlements.
Financial Evening Briefing — November 3, 2026
01|Reserve Bank of Australia raises rates to 4.85%
The Reserve Bank of Australia raised rates by another 25 basis points, bringing the policy rate to an 18-year high. The 6–3 vote and changes to the statement suggest the rate-hiking cycle may be nearing its end.
02|Reserve Bank of Australia warns inflation remains high
Inflation may reach 4.5% in the fourth quarter. High prices and slowing employment coexist, leaving policymakers in a dilemma.
03|China’s central bank adjusts the foreign exchange reserve requirement ratio
Effective November 15, the foreign exchange reserve requirement ratio will rise from 4% to 6%, interpreted by the market as a signal to curb the yuan’s rapid appreciation.
04|Yuan weakens intraday
After the policy announcement, the dollar rose to 6.6765 yuan onshore. Markets will watch the daily midpoint and changes in corporate foreign exchange settlements.
The Reserve Bank of Australia raised rates by another 25 basis points, bringing the policy rate to an 18-year high. The 6–3 vote and changes to the statement suggest the rate-hiking cycle may be nearing its end.
02|Reserve Bank of Australia warns inflation remains high
Inflation may reach 4.5% in the fourth quarter. High prices and slowing employment coexist, leaving policymakers in a dilemma.
03|China’s central bank adjusts the foreign exchange reserve requirement ratio
Effective November 15, the foreign exchange reserve requirement ratio will rise from 4% to 6%, interpreted by the market as a signal to curb the yuan’s rapid appreciation.
04|Yuan weakens intraday
After the policy announcement, the dollar rose to 6.6765 yuan onshore. Markets will watch the daily midpoint and changes in corporate foreign exchange settlements.
527
·
--
Article
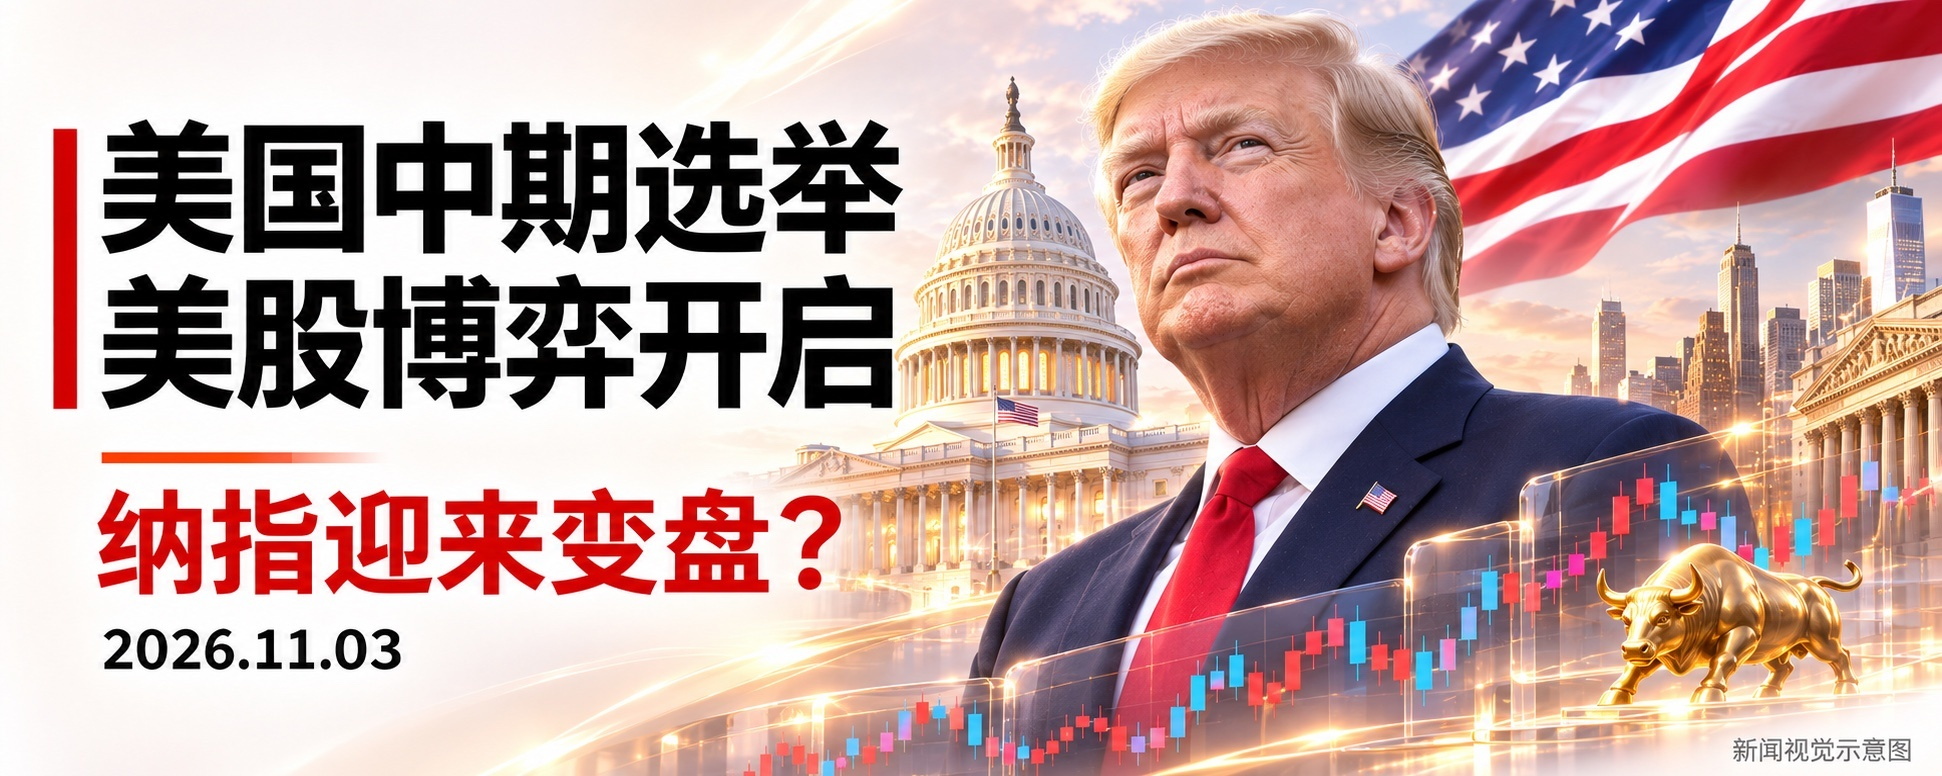
🇺🇸 Countdown to the U.S. midterm elections! The window for betting on U.S. stocks is open—will the Nasdaq see a reversal?The 2026 U.S. midterm elections are approaching their final showdown, and Wall Street is repricing for potential shifts in the political landscape.
On November 3 local time in the United States, the midterm elections officially got underway. All 435 seats in the House of Representatives and 35 Senate seats are up for voters to decide.
This will not only determine control of the U.S. Congress for the next two years, but could also affect the Trump administration’s fiscal policy, AI regulation, energy policy, and expectations in the capital markets.
📊 I. Latest election outlook: Republicans face pressure
According to a Reuters/Ipsos poll released on November 2:
Democratic support: 46%
🇺🇸 Countdown to the U.S. midterm elections! The window for betting on U.S. stocks is open—will the Nasdaq see a reversal?
The 2026 U.S. midterm elections are approaching their final showdown, and Wall Street is repricing for potential shifts in the political landscape.
On November 3 local time in the United States, the midterm elections officially got underway. All 435 seats in the House of Representatives and 35 Senate seats are up for voters to decide.
This will not only determine control of the U.S. Congress for the next two years, but could also affect the Trump administration’s fiscal policy, AI regulation, energy policy, and expectations in the capital markets.
📊 I. Latest election outlook: Republicans face pressure
According to a Reuters/Ipsos poll released on November 2:
Democratic support: 46%
On November 3 local time in the United States, the midterm elections officially got underway. All 435 seats in the House of Representatives and 35 Senate seats are up for voters to decide.
This will not only determine control of the U.S. Congress for the next two years, but could also affect the Trump administration’s fiscal policy, AI regulation, energy policy, and expectations in the capital markets.
📊 I. Latest election outlook: Republicans face pressure
According to a Reuters/Ipsos poll released on November 2:
Democratic support: 46%
60
Log in to explore more content
Join global crypto users on Binance Square
⚡️ Get latest and useful information about crypto.
💬 Trusted by the world’s largest crypto exchange.
👍 Discover real insights from verified creators.
Email / Phone number
Trending Topics
KeplrAdvisesSocialLoginUsersToTransferAssets
0 views
13 Discussing
🚨 $ONE Is Waking Up… Don't Miss The Next Move!
$ONE is showing strong buying pressure after bouncing from the 0.00180 support zone. Bulls are trying to reclaim 0.00200, and if buyers keep the momentum, this could be the start of another leg higher.
📈 Trade Plan
✅ Entry: 0.00198 – 0.00202 (or on a confirmed breakout above 0.00205)
🛑 Stop Loss: 0.00188
🎯 TP1: 0.00215
🎯 TP2: 0.00230
🎯 TP3: 0.00247
⚠️ If price loses 0.00188, wait for a fresh setup instead of forcing the trade.
This setup offers a solid risk-to-reward if the breakout confirms. Manage your risk and never enter without a stop loss.
Are you LONG or waiting for confirmation? 👇
#one #KeplrAdvisesSocialLoginUsersToTransferAssets #TetherPlans€28.8MForJuventusCapitalIncrease #JobsReportRaisesHikeOdds
Adeem Jutt
·4 Likes
·289 views
TetherPlans€28.8MForJuventusCapitalIncrease
7 views
15 Discussing
JobsReportRaisesHikeOdds
620,139 views
3,846 Discussing