

MOONRIDER TOP
3.1k Posts

MOONRIDER TOP
Report
Block User
4 Following
71 Followers
246 Liked
Posts
All
Quotes
Videos
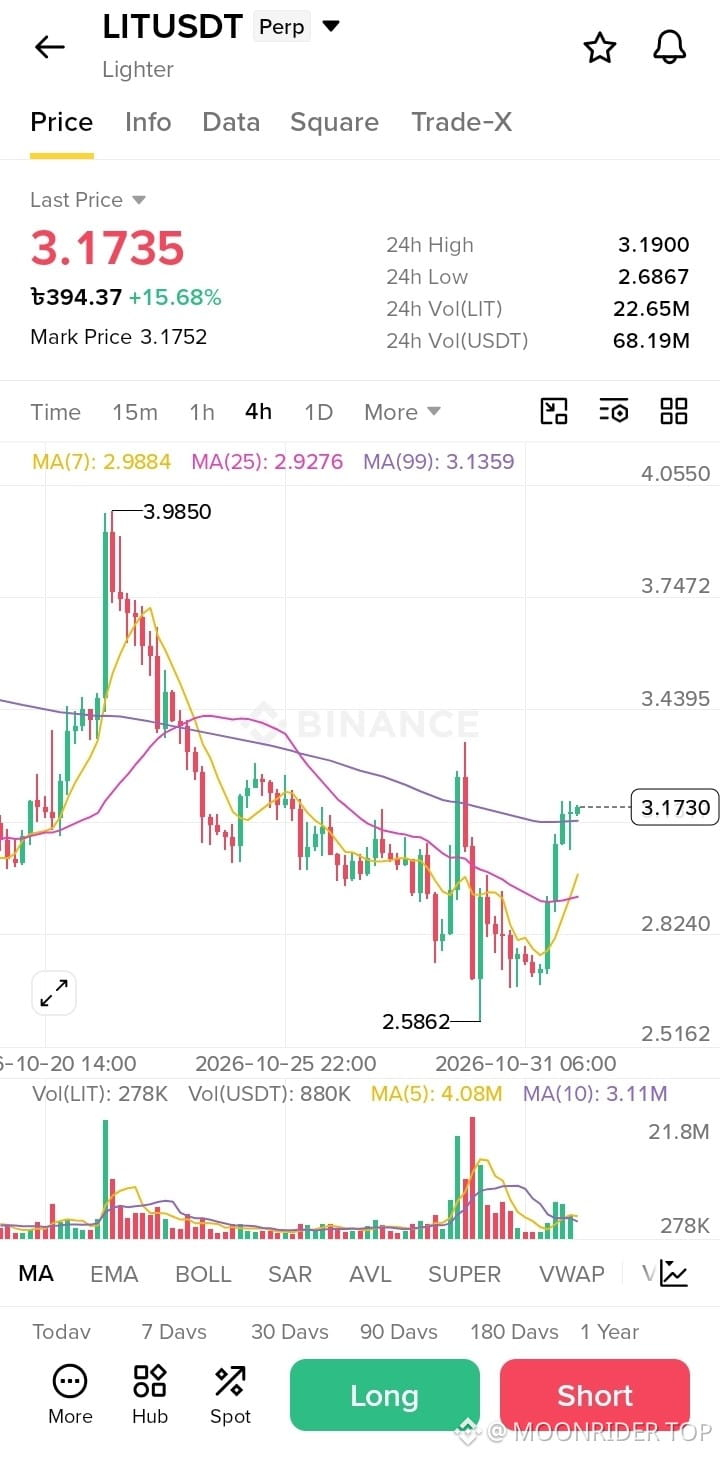
$LIT /USDT — LONG SIGNAL
Entry Zone: 3.12–3.18
Take Profit 1: 3.25
Take Profit 2: 3.44
Take Profit 3: 3.75
Stop Loss: 3.05
Support: 3.14 / 2.99
Resistance: 3.19 / 3.44
The 4H chart shows a strong recovery from 2.5862, with price moving above the 7, 25 and 99-period moving averages. A sustained move above 3.19 could open the way toward higher resistance.
Risk Management: Wait for confirmation above 3.19 before entering aggressively. A break below 3.05 weakens the setup.$LIT
{future}(LITUSDT)
$LIT /USDT — LONG SIGNAL
Entry Zone: 3.12–3.18
Take Profit 1: 3.25
Take Profit 2: 3.44
Take Profit 3: 3.75
Stop Loss: 3.05
Support: 3.14 / 2.99
Resistance: 3.19 / 3.44
The 4H chart shows a strong recovery from 2.5862, with price moving above the 7, 25 and 99-period moving averages. A sustained move above 3.19 could open the way toward higher resistance.
Risk Management: Wait for confirmation above 3.19 before entering aggressively. A break below 3.05 weakens the setup.$LIT
Entry Zone: 3.12–3.18
Take Profit 1: 3.25
Take Profit 2: 3.44
Take Profit 3: 3.75
Stop Loss: 3.05
Support: 3.14 / 2.99
Resistance: 3.19 / 3.44
The 4H chart shows a strong recovery from 2.5862, with price moving above the 7, 25 and 99-period moving averages. A sustained move above 3.19 could open the way toward higher resistance.
Risk Management: Wait for confirmation above 3.19 before entering aggressively. A break below 3.05 weakens the setup.$LIT
23
476
·
--
Bullish
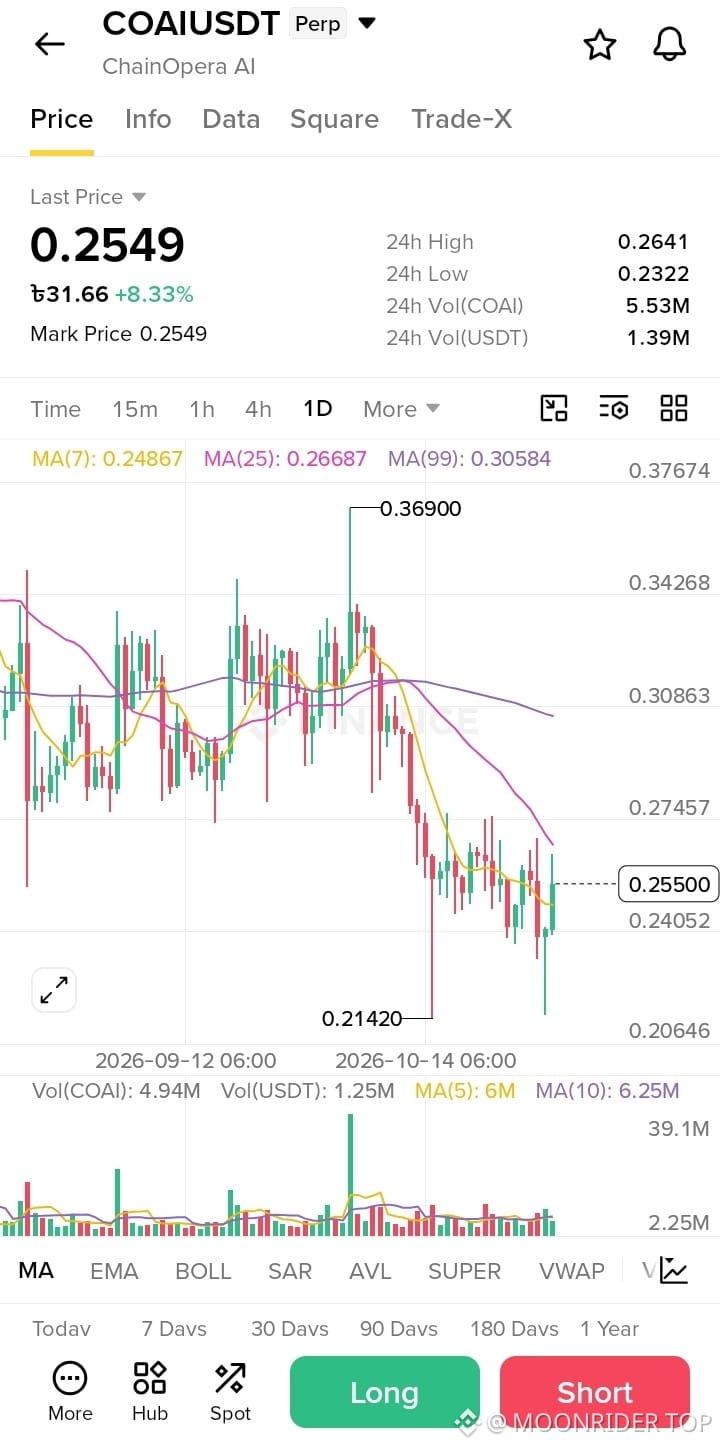
$COAI /USDT — LONG SIGNAL
Entry: $0.2500–$0.2550
Stop Loss: $0.2390
Take Profit:
TP1: $0.2640
TP2: $0.2750
TP3: $0.3050
Leverage: 3x–5x (Isolated)
Signal: LONG only after price holds above $0.2480. Invalidate the setup if price breaks below $0.2390.
Risk management is essential. This setup is based on the chart provided, not live market data.$COAI
{future}(COAIUSDT)
$COAI /USDT — LONG SIGNAL
Entry: $0.2500–$0.2550
Stop Loss: $0.2390
Take Profit:
TP1: $0.2640
TP2: $0.2750
TP3: $0.3050
Leverage: 3x–5x (Isolated)
Signal: LONG only after price holds above $0.2480. Invalidate the setup if price breaks below $0.2390.
Risk management is essential. This setup is based on the chart provided, not live market data.$COAI
Entry: $0.2500–$0.2550
Stop Loss: $0.2390
Take Profit:
TP1: $0.2640
TP2: $0.2750
TP3: $0.3050
Leverage: 3x–5x (Isolated)
Signal: LONG only after price holds above $0.2480. Invalidate the setup if price breaks below $0.2390.
Risk management is essential. This setup is based on the chart provided, not live market data.$COAI
45
1
773
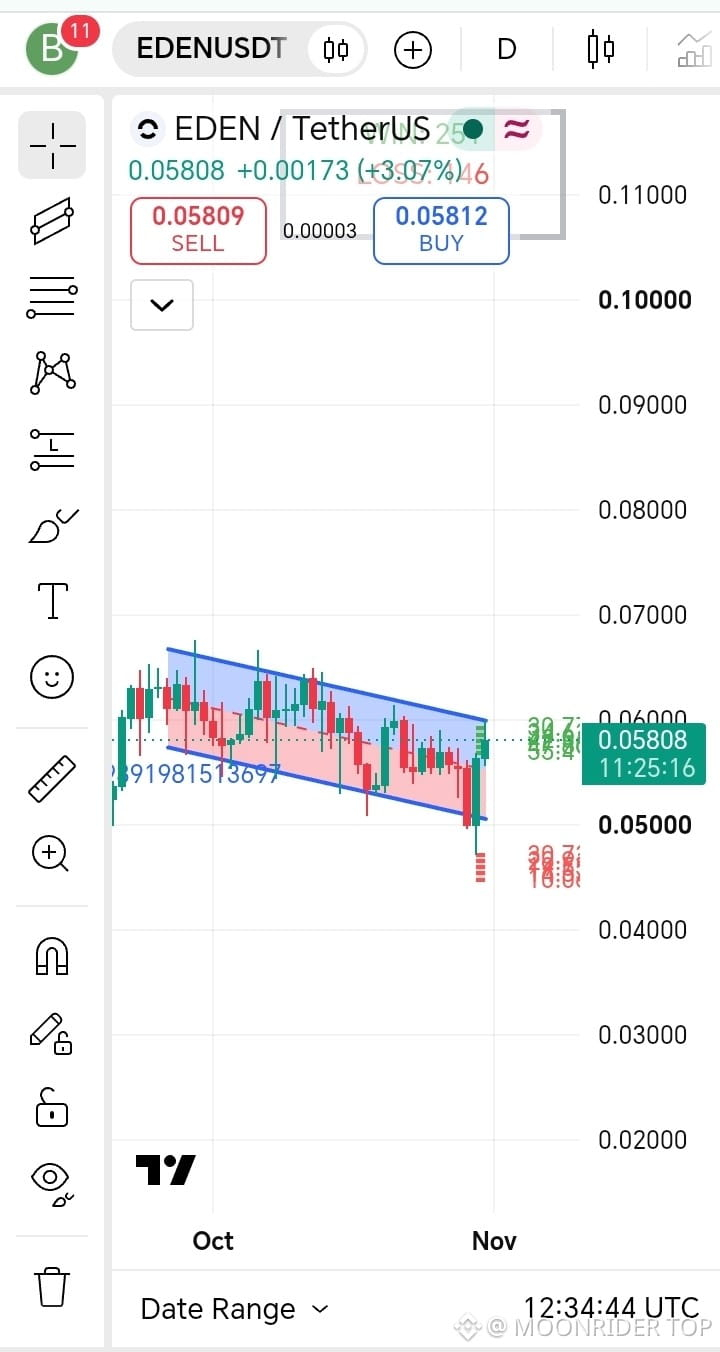
$EDEN /USDT: A BOUNCE INSIDE THE FALLING CHANNEL
EDEN has climbed back to $0.05808 after a sharp move below the lower boundary of its descending channel. The recovery is encouraging, but the broader chart still shows a series of lower highs. Buyers now have an opportunity to challenge the sellers who have controlled this structure.
THE CHART'S MESSAGE
The latest rebound has brought price back toward the channel's upper boundary. This is where the next reaction matters. A strong candle close above the channel, followed by a successful retest, would suggest that the recent recovery has more strength behind it. Another rejection could send price back toward the lower end of the range.
WHAT I'M WATCHING
- Resistance: $0.0600–$0.0610, followed by $0.0630–$0.0650.
- Support: $0.0550–$0.0560, with $0.0500 as the broader downside area.
- Liquidity: A move above the recent highs could attract breakout buyers, while a return below $0.0500 may expose the liquidity beneath the recent low.
TRADE IDEA
A long setup becomes more attractive after a confirmed channel breakout and a successful retest. If price fails at resistance and loses $0.0550, the recovery may weaken, making a move toward $0.0500 possible.
EDEN is showing signs of recovery, but the descending structure has not been decisively broken. Confirmation matters more than chasing the current candle.$EDEN
{future}(EDENUSDT)
$EDEN /USDT: A BOUNCE INSIDE THE FALLING CHANNEL
EDEN has climbed back to $0.05808 after a sharp move below the lower boundary of its descending channel. The recovery is encouraging, but the broader chart still shows a series of lower highs. Buyers now have an opportunity to challenge the sellers who have controlled this structure.
THE CHART'S MESSAGE
The latest rebound has brought price back toward the channel's upper boundary. This is where the next reaction matters. A strong candle close above the channel, followed by a successful retest, would suggest that the recent recovery has more strength behind it. Another rejection could send price back toward the lower end of the range.
WHAT I'M WATCHING
- Resistance: $0.0600–$0.0610, followed by $0.0630–$0.0650.
- Support: $0.0550–$0.0560, with $0.0500 as the broader downside area.
- Liquidity: A move above the recent highs could attract breakout buyers, while a return below $0.0500 may expose the liquidity beneath the recent low.
TRADE IDEA
A long setup becomes more attractive after a confirmed channel breakout and a successful retest. If price fails at resistance and loses $0.0550, the recovery may weaken, making a move toward $0.0500 possible.
EDEN is showing signs of recovery, but the descending structure has not been decisively broken. Confirmation matters more than chasing the current candle.$EDEN
EDEN has climbed back to $0.05808 after a sharp move below the lower boundary of its descending channel. The recovery is encouraging, but the broader chart still shows a series of lower highs. Buyers now have an opportunity to challenge the sellers who have controlled this structure.
THE CHART'S MESSAGE
The latest rebound has brought price back toward the channel's upper boundary. This is where the next reaction matters. A strong candle close above the channel, followed by a successful retest, would suggest that the recent recovery has more strength behind it. Another rejection could send price back toward the lower end of the range.
WHAT I'M WATCHING
- Resistance: $0.0600–$0.0610, followed by $0.0630–$0.0650.
- Support: $0.0550–$0.0560, with $0.0500 as the broader downside area.
- Liquidity: A move above the recent highs could attract breakout buyers, while a return below $0.0500 may expose the liquidity beneath the recent low.
TRADE IDEA
A long setup becomes more attractive after a confirmed channel breakout and a successful retest. If price fails at resistance and loses $0.0550, the recovery may weaken, making a move toward $0.0500 possible.
EDEN is showing signs of recovery, but the descending structure has not been decisively broken. Confirmation matters more than chasing the current candle.$EDEN
44
1k
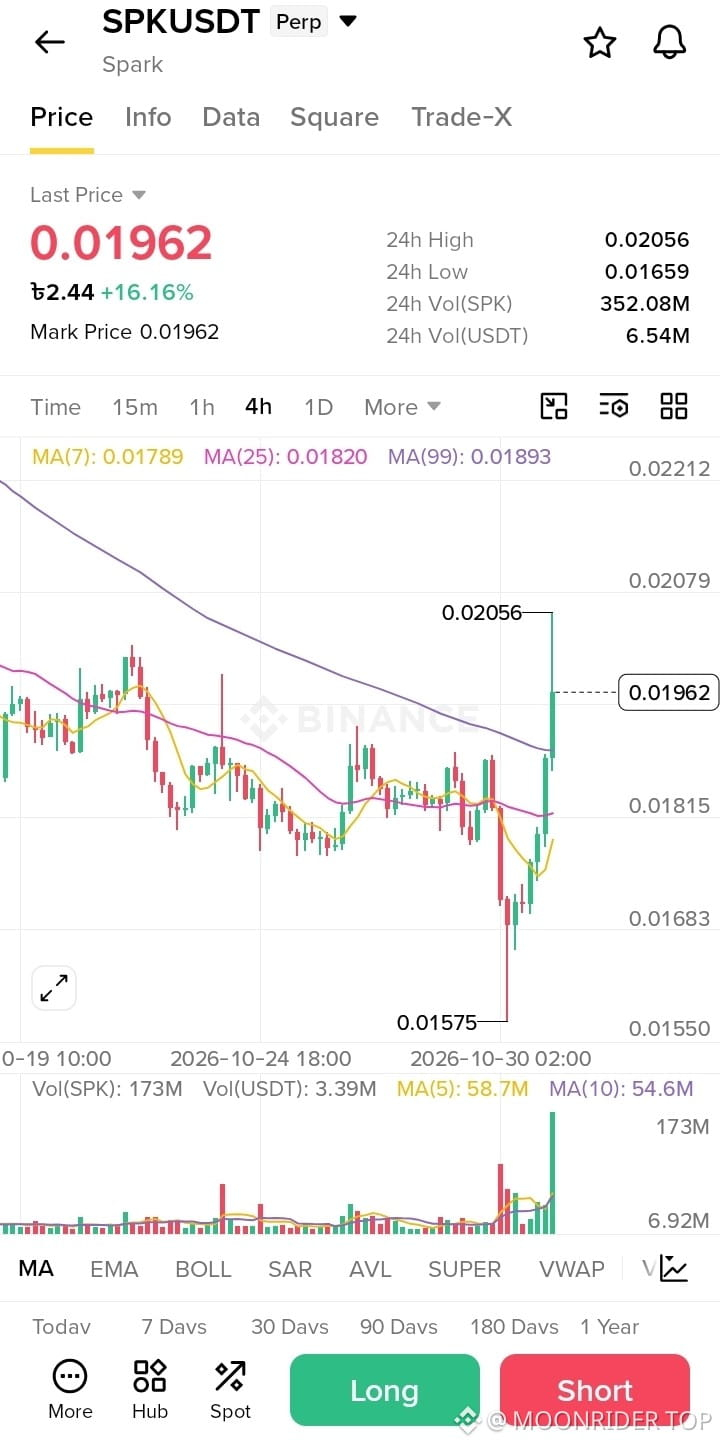
$SPK USDT is showing strong bullish momentum with a powerful breakout and increasing buying volume, signaling potential further upside.
🚀 SPKUSDT — LONG SIGNAL
🎯 Entry: 0.01900 – 0.01960
🛑 Stop Loss: 0.01800
💰 TP1: 0.02056 | TP2: 0.02080
💰 TP3: 0.02150 | TP4: 0.02212
Strong buying pressure and bullish momentum are supporting the upward move. Watch for a breakout above 0.02056 for further upside confirmation. Manage risk carefully.$SPK
{future}(SPKUSDT)
$SPK USDT is showing strong bullish momentum with a powerful breakout and increasing buying volume, signaling potential further upside.
🚀 SPKUSDT — LONG SIGNAL
🎯 Entry: 0.01900 – 0.01960
🛑 Stop Loss: 0.01800
💰 TP1: 0.02056 | TP2: 0.02080
💰 TP3: 0.02150 | TP4: 0.02212
Strong buying pressure and bullish momentum are supporting the upward move. Watch for a breakout above 0.02056 for further upside confirmation. Manage risk carefully.$SPK
🚀 SPKUSDT — LONG SIGNAL
🎯 Entry: 0.01900 – 0.01960
🛑 Stop Loss: 0.01800
💰 TP1: 0.02056 | TP2: 0.02080
💰 TP3: 0.02150 | TP4: 0.02212
Strong buying pressure and bullish momentum are supporting the upward move. Watch for a breakout above 0.02056 for further upside confirmation. Manage risk carefully.$SPK
26
811
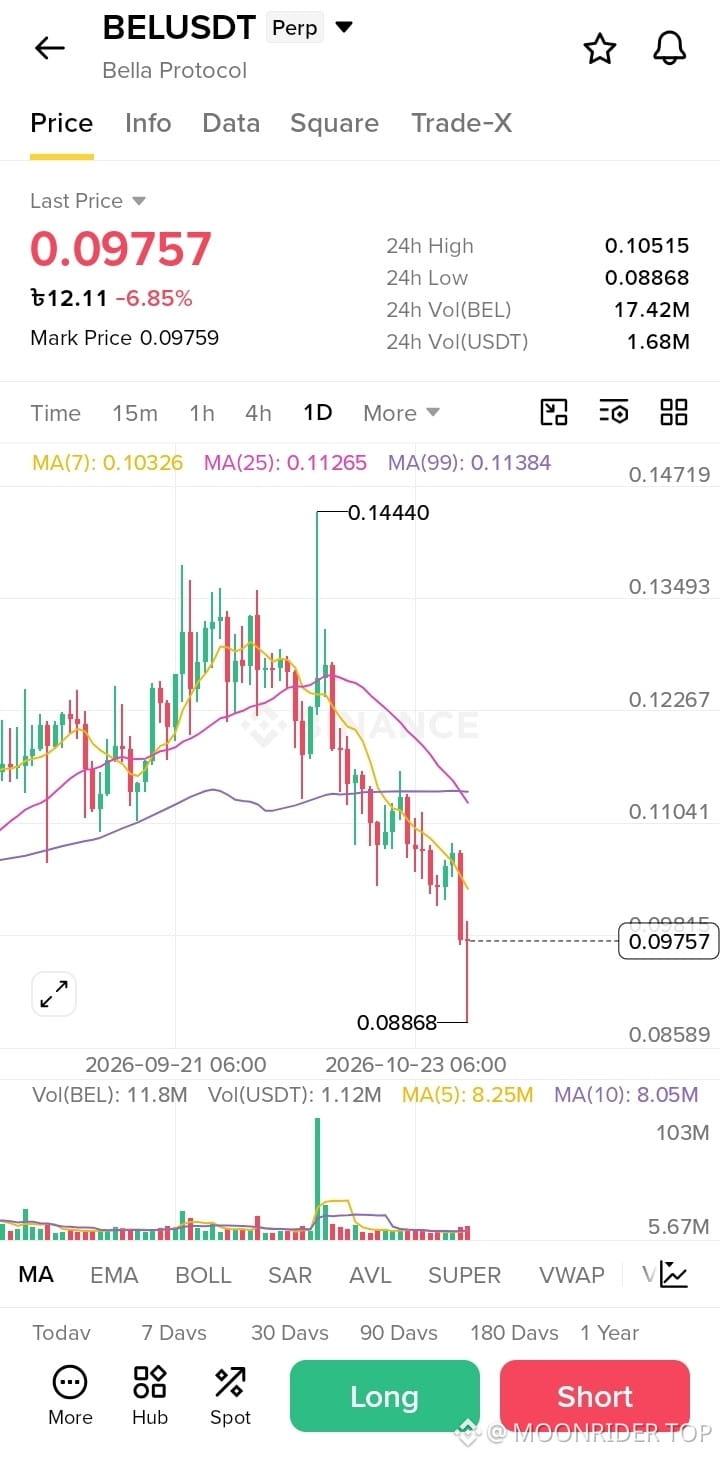
$BEL USDT is testing a major support zone, with potential for a bullish recovery if buyers step in.
🚀 BELUSDT — LONG SIGNAL
🎯 Entry: 0.09200 – 0.09700
🛑 Stop Loss: 0.08750
💰 TP1: 0.10330 | TP2: 0.11040
💰 TP3: 0.11265 | TP4: 0.12000
Watch for bullish confirmation before entry. Manage your risk and secure profits at resistance levels.$BEL
{future}(BELUSDT)
$BEL USDT is testing a major support zone, with potential for a bullish recovery if buyers step in.
🚀 BELUSDT — LONG SIGNAL
🎯 Entry: 0.09200 – 0.09700
🛑 Stop Loss: 0.08750
💰 TP1: 0.10330 | TP2: 0.11040
💰 TP3: 0.11265 | TP4: 0.12000
Watch for bullish confirmation before entry. Manage your risk and secure profits at resistance levels.$BEL
🚀 BELUSDT — LONG SIGNAL
🎯 Entry: 0.09200 – 0.09700
🛑 Stop Loss: 0.08750
💰 TP1: 0.10330 | TP2: 0.11040
💰 TP3: 0.11265 | TP4: 0.12000
Watch for bullish confirmation before entry. Manage your risk and secure profits at resistance levels.$BEL
41
896
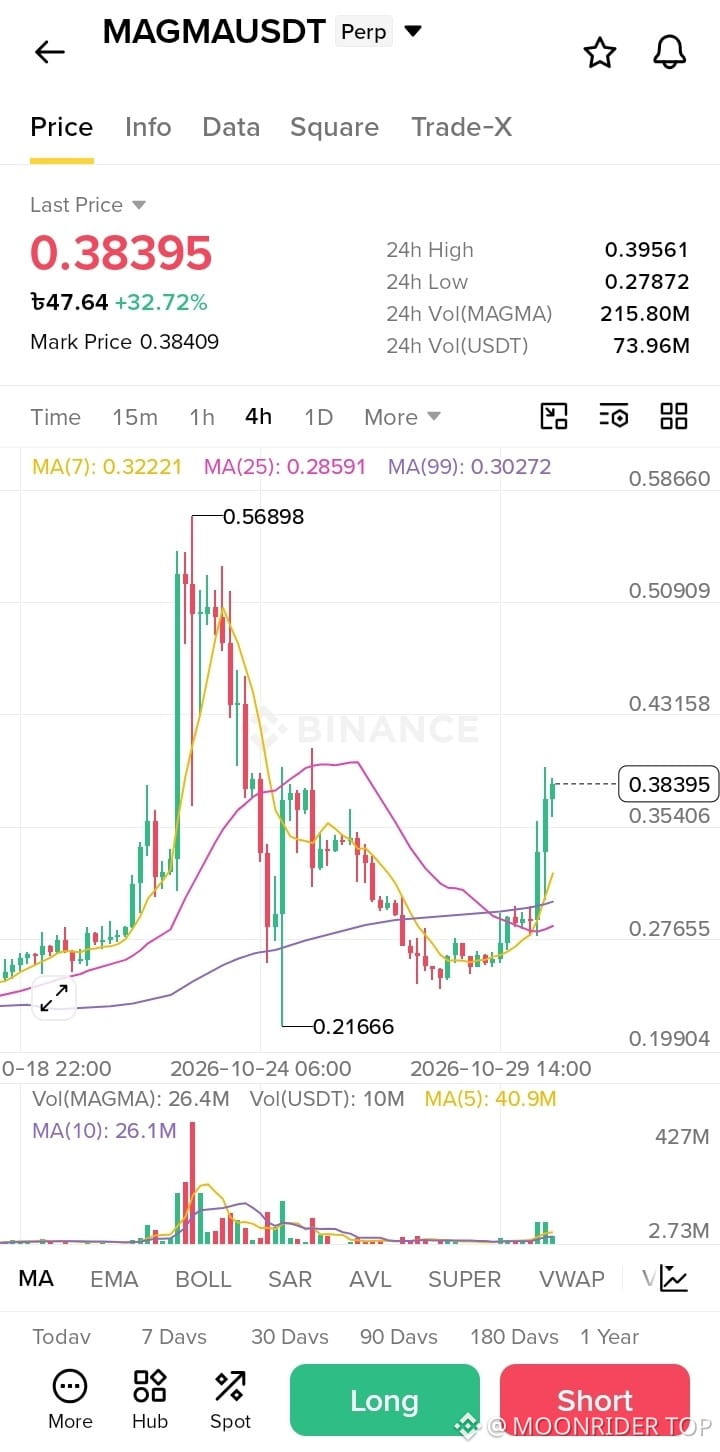
$MAGMA LONG SIGNAL
· Entry: Wait for pullback to 0.3200 - 0.3300 (Do not buy at current top).
· Target: 0.43 (First target), then 0.50.
· Stop Loss: 0.2800 (Strict).
· Reason: Strong momentum breakout, but currently overextended and needs a dip.
$MAGMA
{future}(MAGMAUSDT)
$MAGMA LONG SIGNAL
· Entry: Wait for pullback to 0.3200 - 0.3300 (Do not buy at current top).
· Target: 0.43 (First target), then 0.50.
· Stop Loss: 0.2800 (Strict).
· Reason: Strong momentum breakout, but currently overextended and needs a dip.
$MAGMA
· Entry: Wait for pullback to 0.3200 - 0.3300 (Do not buy at current top).
· Target: 0.43 (First target), then 0.50.
· Stop Loss: 0.2800 (Strict).
· Reason: Strong momentum breakout, but currently overextended and needs a dip.
$MAGMA
34
1.2k
·
--
Bullish
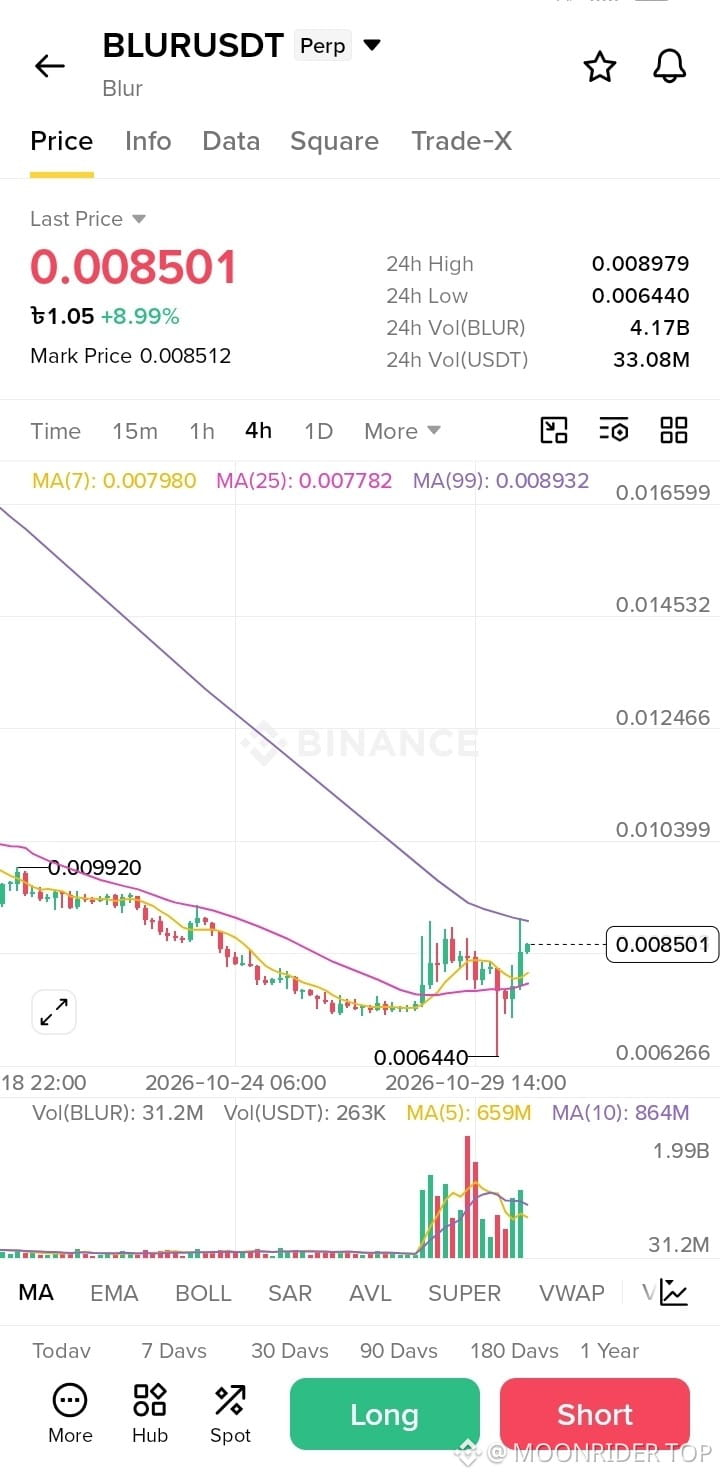
$BLUR rIt is likely due for a pullback (cool down).
· Entry Zone: Best to short if the price reaches 0.008800 - 0.009000.
· Target (Down): First target is 0.007800, then 0.006500.
· Stop Loss: Set it above 0.009300. If it breaks that, the down trend is invalid.$BLUR
{future}(BLURUSDT)
$BLUR rIt is likely due for a pullback (cool down).
· Entry Zone: Best to short if the price reaches 0.008800 - 0.009000.
· Target (Down): First target is 0.007800, then 0.006500.
· Stop Loss: Set it above 0.009300. If it breaks that, the down trend is invalid.$BLUR
· Entry Zone: Best to short if the price reaches 0.008800 - 0.009000.
· Target (Down): First target is 0.007800, then 0.006500.
· Stop Loss: Set it above 0.009300. If it breaks that, the down trend is invalid.$BLUR
43
2k
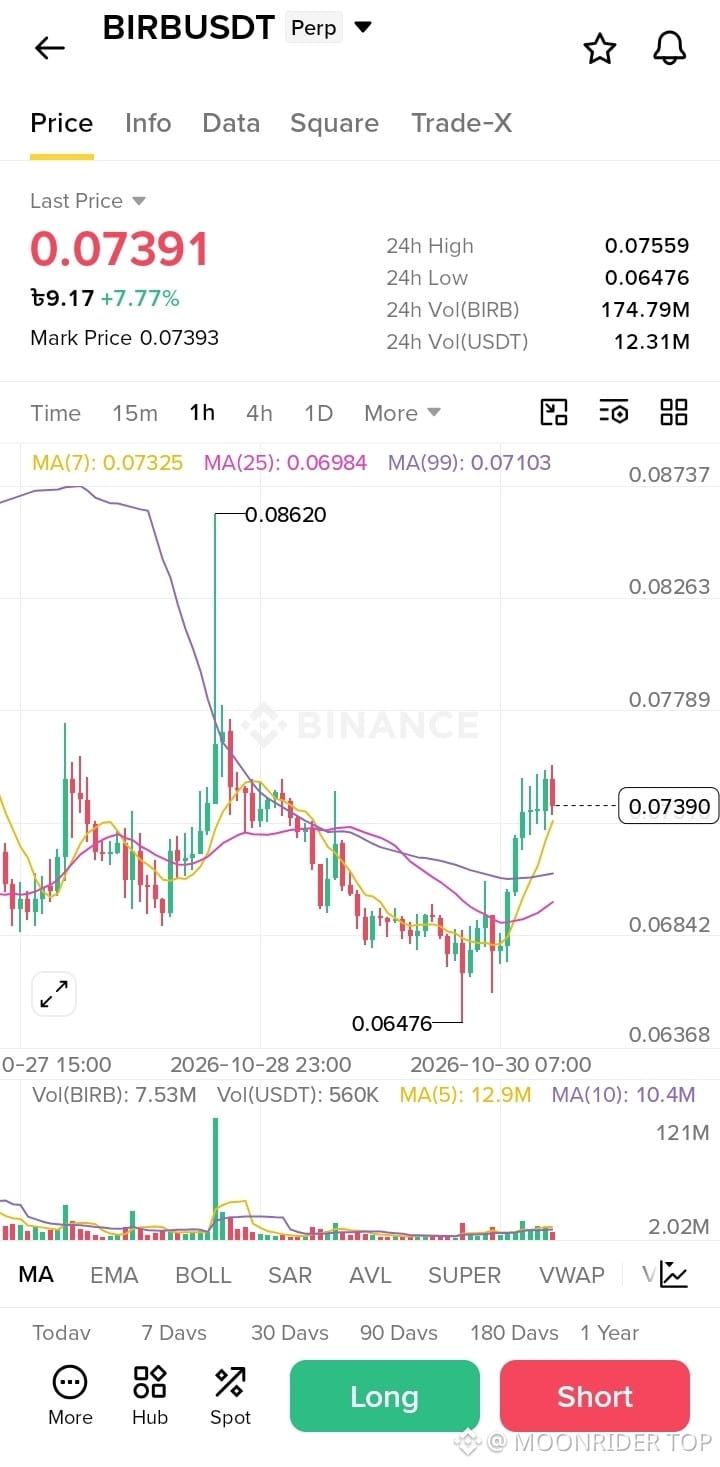
$BIRB Volume on the latest candle (7.53M) is below its recent averages (12.9M and 10.4M), so buyers have not shown strong conviction. The latest candle is also red, so a small pause is likely.
Setup 1: Pullback Long (preferred)
Entry: 0.07300–0.07250
Stop loss: below 0.07080
TP1: 0.07559
TP2: 0.07789
TP3: 0.08263
Reward vs risk: about 1.5x at TP1, 2.6x at TP2 and 5x at TP3
Why: The MA7 (0.07325) and a chart level near 0.07315 overlap in this zone, and the MA99 (0.07103) sits just below as backup. The stop goes under the MA99, so a failed$BIRB
{future}(BIRBUSDT)
$BIRB Volume on the latest candle (7.53M) is below its recent averages (12.9M and 10.4M), so buyers have not shown strong conviction. The latest candle is also red, so a small pause is likely.
Setup 1: Pullback Long (preferred)
Entry: 0.07300–0.07250
Stop loss: below 0.07080
TP1: 0.07559
TP2: 0.07789
TP3: 0.08263
Reward vs risk: about 1.5x at TP1, 2.6x at TP2 and 5x at TP3
Why: The MA7 (0.07325) and a chart level near 0.07315 overlap in this zone, and the MA99 (0.07103) sits just below as backup. The stop goes under the MA99, so a failed$BIRB
Setup 1: Pullback Long (preferred)
Entry: 0.07300–0.07250
Stop loss: below 0.07080
TP1: 0.07559
TP2: 0.07789
TP3: 0.08263
Reward vs risk: about 1.5x at TP1, 2.6x at TP2 and 5x at TP3
Why: The MA7 (0.07325) and a chart level near 0.07315 overlap in this zone, and the MA99 (0.07103) sits just below as backup. The stop goes under the MA99, so a failed$BIRB
21
927
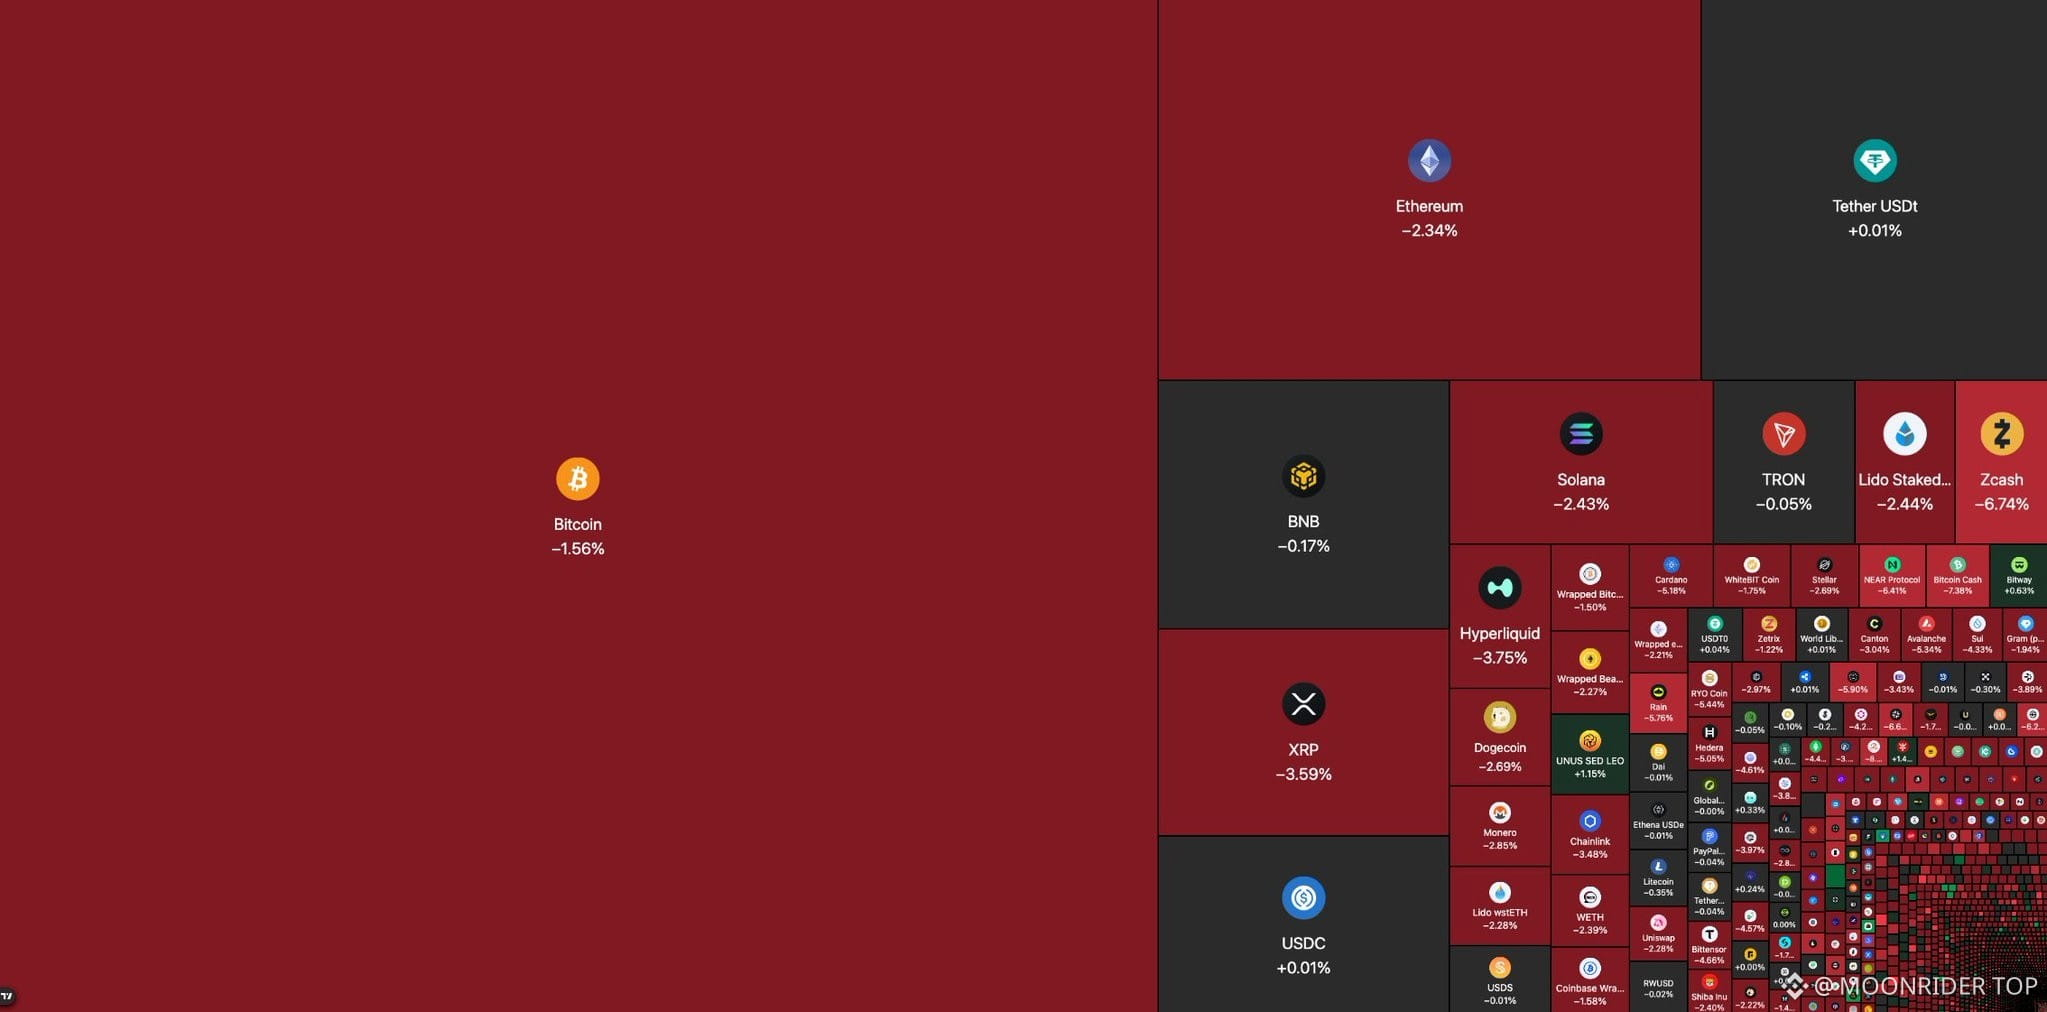
🚨 REKT: Over $356M in crypto positions were liquidated in the past 24 hours as $BTC fell below $80,000, with longs taking $207.7M of the hit.$BTC
{future}(BTCUSDT)
$SOL
{future}(SOLUSDT)
🚨 REKT: Over $356M in crypto positions were liquidated in the past 24 hours as $BTC fell below $80,000, with longs taking $207.7M of the hit.$BTC
$SOL
$SOL
56
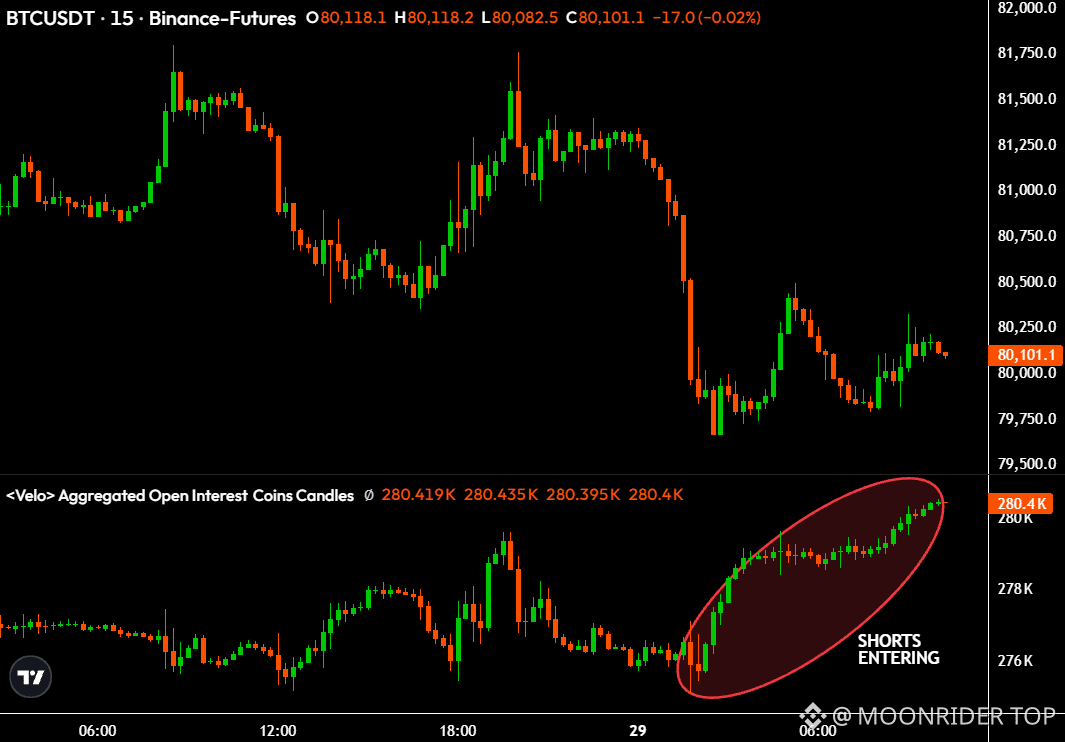
$BTC shorts are aggressively entering now.
PCE data is coming in 2 hours, and a soft print will squeeze the hell out of these bears.$BTC $BTC
{future}(BTCUSDT)
$BTC shorts are aggressively entering now.
PCE data is coming in 2 hours, and a soft print will squeeze the hell out of these bears.$BTC $BTC
PCE data is coming in 2 hours, and a soft print will squeeze the hell out of these bears.$BTC $BTC
63
·
--
Bullish
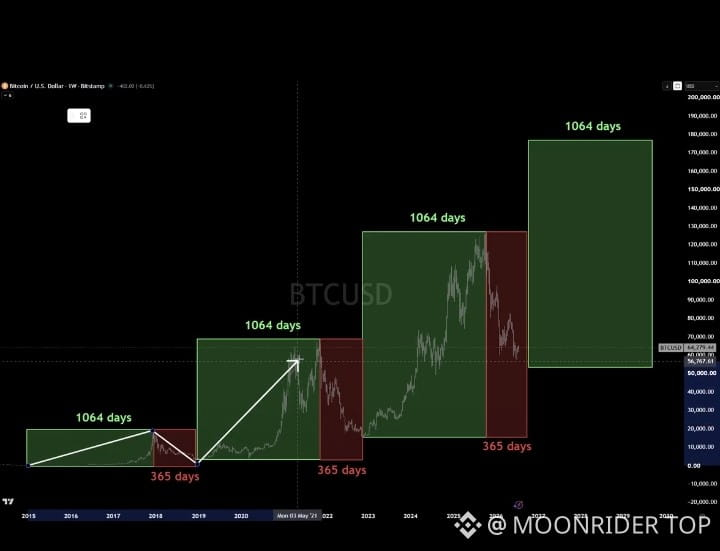
Bitcoin's cycle has never broken in a decade.
1,064 days up. 365 days down.
Same cycle, every time.
$BTC
{future}(BTCUSDT)
Bitcoin's cycle has never broken in a decade.
1,064 days up. 365 days down.
Same cycle, every time.
$BTC
1,064 days up. 365 days down.
Same cycle, every time.
$BTC
49
🚨 $ETH JUST ENDED A 5-YEAR ACCUMULATION
Ever since 2022, ETH has been stuck bouncing around inside one massive range
7 major touches. Every rally got sold into, every dip got scooped up and the range just kept flaring out wider
That's Jesse Livermore's "Accumulation Cylinder with Widening Mouth", the textbook structure that shows up right before a full-blown markup phase
Touch #7 near ~$1,500 was the last shakeout
Weak hands tapped out while whales quietly stacked bags
Now $ETH is back at $2,700 and the cylinder is fully formed
My 2026-2029 macro roadmap:
1. Light pullback to $2,300-$2,400
2. Retake the $4,950 ATH
3. Break out of the cylinder around $6,000
4. Markup run to $8,000+
5. Cycle peak at $10,000-$11,000
Bigger the base, bigger the move
4.5 years of accumulation doesn't resolve with a measly +30% pop
Most people will sit around waiting for "confirmation", then FOMO in at $5K
Don't end up as their exit liquidity
Hit the bell so you don't miss my next big call$ETH
{spot}(ETHUSDT)
🚨 $ETH JUST ENDED A 5-YEAR ACCUMULATION
Ever since 2022, ETH has been stuck bouncing around inside one massive range
7 major touches. Every rally got sold into, every dip got scooped up and the range just kept flaring out wider
That's Jesse Livermore's "Accumulation Cylinder with Widening Mouth", the textbook structure that shows up right before a full-blown markup phase
Touch #7 near ~$1,500 was the last shakeout
Weak hands tapped out while whales quietly stacked bags
Now $ETH is back at $2,700 and the cylinder is fully formed
My 2026-2029 macro roadmap:
1. Light pullback to $2,300-$2,400
2. Retake the $4,950 ATH
3. Break out of the cylinder around $6,000
4. Markup run to $8,000+
5. Cycle peak at $10,000-$11,000
Bigger the base, bigger the move
4.5 years of accumulation doesn't resolve with a measly +30% pop
Most people will sit around waiting for "confirmation", then FOMO in at $5K
Don't end up as their exit liquidity
Hit the bell so you don't miss my next big call$ETH
Ever since 2022, ETH has been stuck bouncing around inside one massive range
7 major touches. Every rally got sold into, every dip got scooped up and the range just kept flaring out wider
That's Jesse Livermore's "Accumulation Cylinder with Widening Mouth", the textbook structure that shows up right before a full-blown markup phase
Touch #7 near ~$1,500 was the last shakeout
Weak hands tapped out while whales quietly stacked bags
Now $ETH is back at $2,700 and the cylinder is fully formed
My 2026-2029 macro roadmap:
1. Light pullback to $2,300-$2,400
2. Retake the $4,950 ATH
3. Break out of the cylinder around $6,000
4. Markup run to $8,000+
5. Cycle peak at $10,000-$11,000
Bigger the base, bigger the move
4.5 years of accumulation doesn't resolve with a measly +30% pop
Most people will sit around waiting for "confirmation", then FOMO in at $5K
Don't end up as their exit liquidity
Hit the bell so you don't miss my next big call$ETH

98
🚨 JUST IN: Binance has officially filed for a crypto license in Brazil!
Another step toward expanding its presence in Latin America’s crypto market! 🚀$BNB
{spot}(BNBUSDT)
🚨 JUST IN: Binance has officially filed for a crypto license in Brazil!
Another step toward expanding its presence in Latin America’s crypto market! 🚀$BNB
Another step toward expanding its presence in Latin America’s crypto market! 🚀$BNB

89
·
--
Bullish
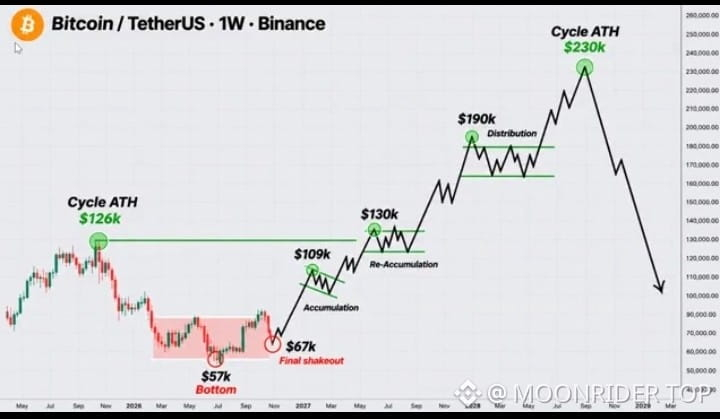
🚨 WARNING: 🚨 BITCOIN IS ABOUT TO MAKE ITS FINAL MOVE DOWN.
For weeks, I've been warning you about this exact setup.
$BTC has been stuck between $81K–$83K, and most traders STILL believe the next move is UP.
They're about to find themselves on the WRONG side of the market.
MY ROADMAP HASN'T CHANGED:
$82K → $75K → $67K → $71K → $109K
SAVE THIS POST.
You'll want to come back to it later.$BTC
{spot}(BTCUSDT)
🚨 WARNING: 🚨 BITCOIN IS ABOUT TO MAKE ITS FINAL MOVE DOWN.
For weeks, I've been warning you about this exact setup.
$BTC has been stuck between $81K–$83K, and most traders STILL believe the next move is UP.
They're about to find themselves on the WRONG side of the market.
MY ROADMAP HASN'T CHANGED:
$82K → $75K → $67K → $71K → $109K
SAVE THIS POST.
You'll want to come back to it later.$BTC
For weeks, I've been warning you about this exact setup.
$BTC has been stuck between $81K–$83K, and most traders STILL believe the next move is UP.
They're about to find themselves on the WRONG side of the market.
MY ROADMAP HASN'T CHANGED:
$82K → $75K → $67K → $71K → $109K
SAVE THIS POST.
You'll want to come back to it later.$BTC
58
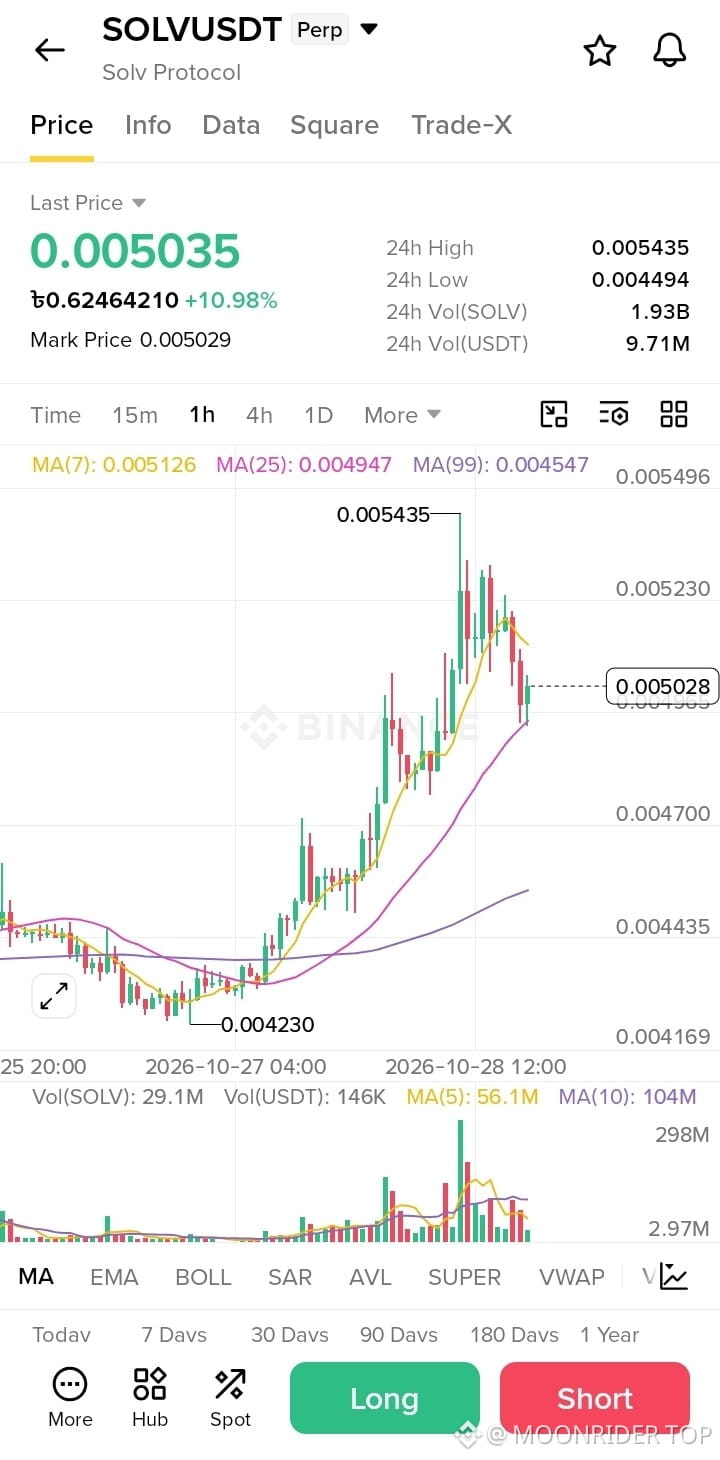
$SOLV USDT (Perp) Long Signal, 1-Hour Setup 1: Pullback Long (preferred)
Entry: 0.004990–0.004950
Stop loss: below 0.004880
TP1: 0.005126
TP2: 0.005230
TP3: 0.005435
Reward vs risk: about 1.7x at TP1, 2.9x at TP2 and 5x at TP3
Why: The MA25 (0.004947) and the chart level near 0.00496 overlap$SOLV
{future}(SOLVUSDT)
$SOLV USDT (Perp) Long Signal, 1-Hour Setup 1: Pullback Long (preferred)
Entry: 0.004990–0.004950
Stop loss: below 0.004880
TP1: 0.005126
TP2: 0.005230
TP3: 0.005435
Reward vs risk: about 1.7x at TP1, 2.9x at TP2 and 5x at TP3
Why: The MA25 (0.004947) and the chart level near 0.00496 overlap$SOLV
Entry: 0.004990–0.004950
Stop loss: below 0.004880
TP1: 0.005126
TP2: 0.005230
TP3: 0.005435
Reward vs risk: about 1.7x at TP1, 2.9x at TP2 and 5x at TP3
Why: The MA25 (0.004947) and the chart level near 0.00496 overlap$SOLV
35
653
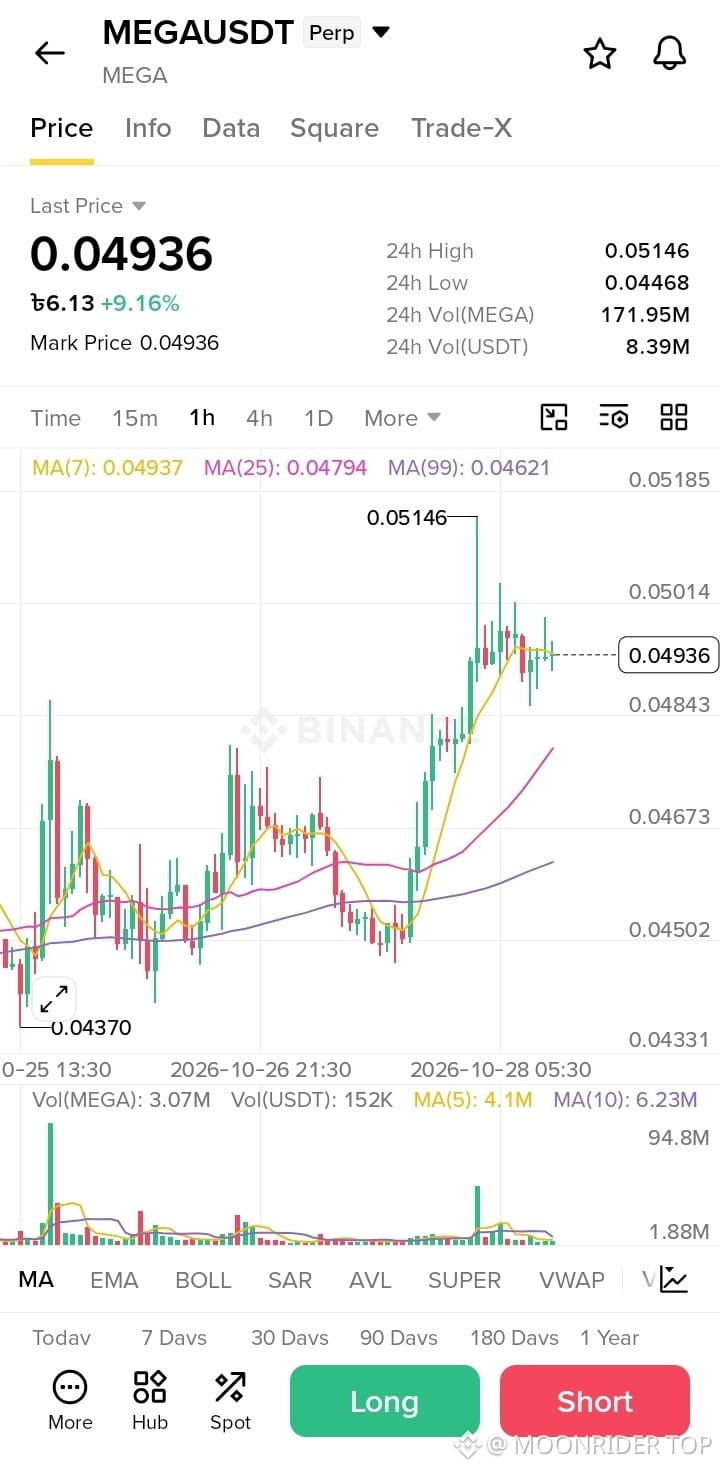
$MEGA Setup 1: Pullback Long (preferred)
Entry: 0.04880–0.04850
Stop loss: below 0.04760
TP1: 0.05014
TP2: 0.05146
TP3: 0.05185
Reward vs risk: about 1.4x at TP1 and 2.7x at TP2
Why: 0.04843 is a chart level and also the low of the recent consolidation, and the rising MA25 (0.04794) sits just below it. Two supports overlap, so the stop can stay tight.
Setup 2: Breakout Long (smaller size)
Trigger: a 1-hour candle closes above 0.05014
Entry: 0.05020–0.05040
Stop loss: below 0.04900
TP1: 0.05146
TP2: 0.05185
Reward vs risk: only about$MEGA
{future}(MEGAUSDT)
$MEGA Setup 1: Pullback Long (preferred)
Entry: 0.04880–0.04850
Stop loss: below 0.04760
TP1: 0.05014
TP2: 0.05146
TP3: 0.05185
Reward vs risk: about 1.4x at TP1 and 2.7x at TP2
Why: 0.04843 is a chart level and also the low of the recent consolidation, and the rising MA25 (0.04794) sits just below it. Two supports overlap, so the stop can stay tight.
Setup 2: Breakout Long (smaller size)
Trigger: a 1-hour candle closes above 0.05014
Entry: 0.05020–0.05040
Stop loss: below 0.04900
TP1: 0.05146
TP2: 0.05185
Reward vs risk: only about$MEGA
Entry: 0.04880–0.04850
Stop loss: below 0.04760
TP1: 0.05014
TP2: 0.05146
TP3: 0.05185
Reward vs risk: about 1.4x at TP1 and 2.7x at TP2
Why: 0.04843 is a chart level and also the low of the recent consolidation, and the rising MA25 (0.04794) sits just below it. Two supports overlap, so the stop can stay tight.
Setup 2: Breakout Long (smaller size)
Trigger: a 1-hour candle closes above 0.05014
Entry: 0.05020–0.05040
Stop loss: below 0.04900
TP1: 0.05146
TP2: 0.05185
Reward vs risk: only about$MEGA
40
1
1.4k
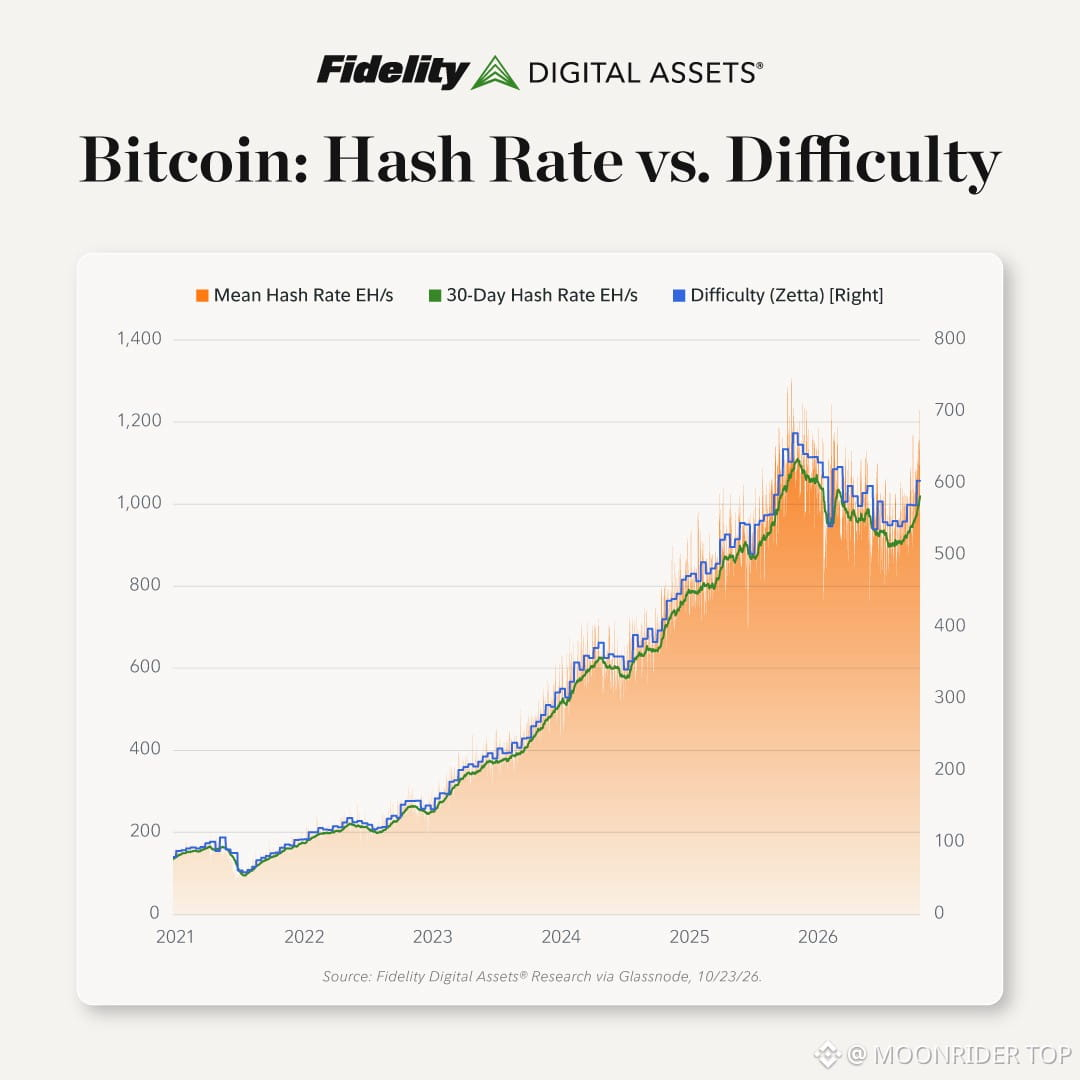
Bitcoin's price remains focused on rates, yields, and oil. Meanwhile, the network just hit a 7-month high in hash rate.
Different signals. Different horizons.
The market is looking for the next catalyst. Miners are committing capital.$BTC
{future}(BTCUSDT)
$XRP
{spot}(XRPUSDT)
Bitcoin's price remains focused on rates, yields, and oil. Meanwhile, the network just hit a 7-month high in hash rate.
Different signals. Different horizons.
The market is looking for the next catalyst. Miners are committing capital.$BTC
$XRP
Different signals. Different horizons.
The market is looking for the next catalyst. Miners are committing capital.$BTC
$XRP
100
·
--
Bullish
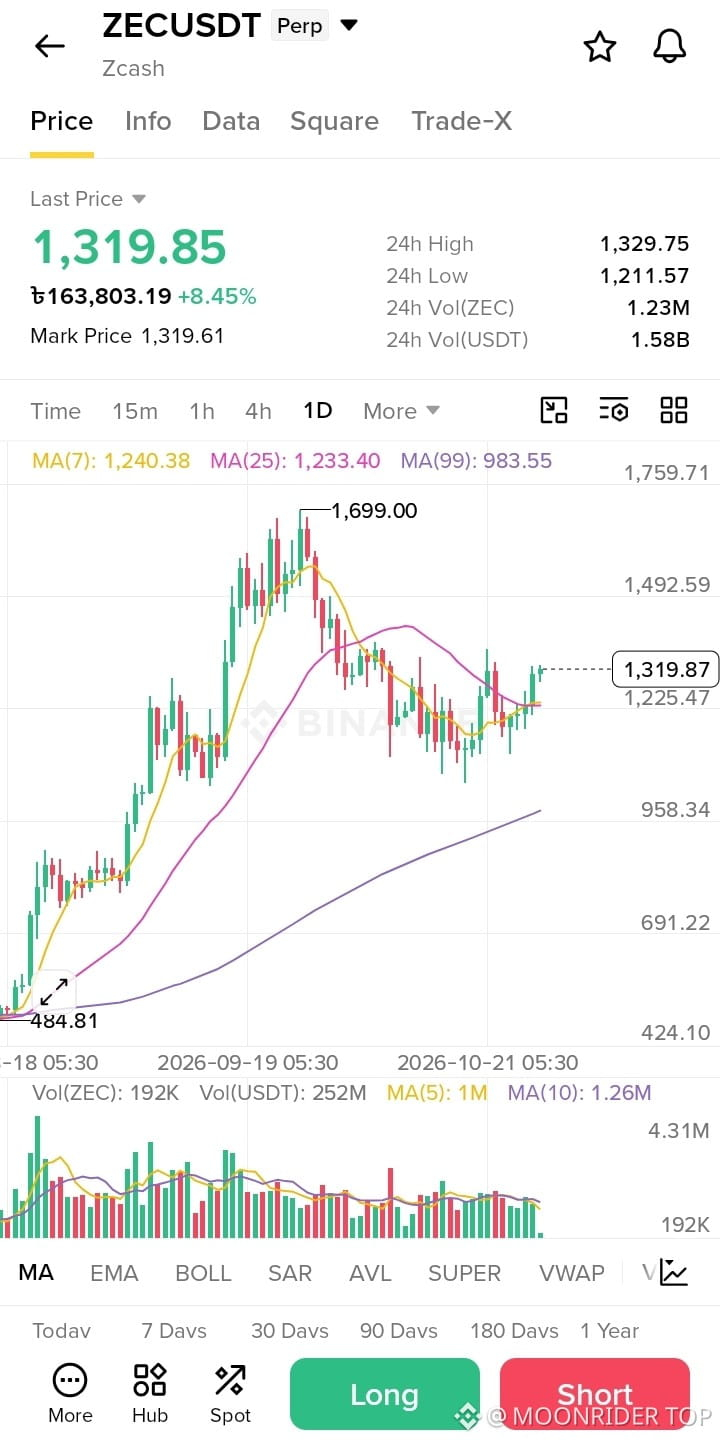
$ZEC /USDT LONG SIGNAL 📈Zcash (ZEC) is showing bullish
🟢 Trade Plan — LONG
📍 Entry Zone: $1,290 – $1,320
🎯 Target 1: $1,360
🎯 Target 2: $1,420
🎯 Target 3: $1,490
🛑 Stop Loss: $1,255
📊 Support Levels: $1,225 / $1,200
🚧 Resistance Levels: $1,330 / $1,360 / $1,420🚀
$ZEC
{future}(ZECUSDT)
$ZEC /USDT LONG SIGNAL 📈Zcash (ZEC) is showing bullish
🟢 Trade Plan — LONG
📍 Entry Zone: $1,290 – $1,320
🎯 Target 1: $1,360
🎯 Target 2: $1,420
🎯 Target 3: $1,490
🛑 Stop Loss: $1,255
📊 Support Levels: $1,225 / $1,200
🚧 Resistance Levels: $1,330 / $1,360 / $1,420🚀
$ZEC
🟢 Trade Plan — LONG
📍 Entry Zone: $1,290 – $1,320
🎯 Target 1: $1,360
🎯 Target 2: $1,420
🎯 Target 3: $1,490
🛑 Stop Loss: $1,255
📊 Support Levels: $1,225 / $1,200
🚧 Resistance Levels: $1,330 / $1,360 / $1,420🚀
$ZEC
32
1.8k
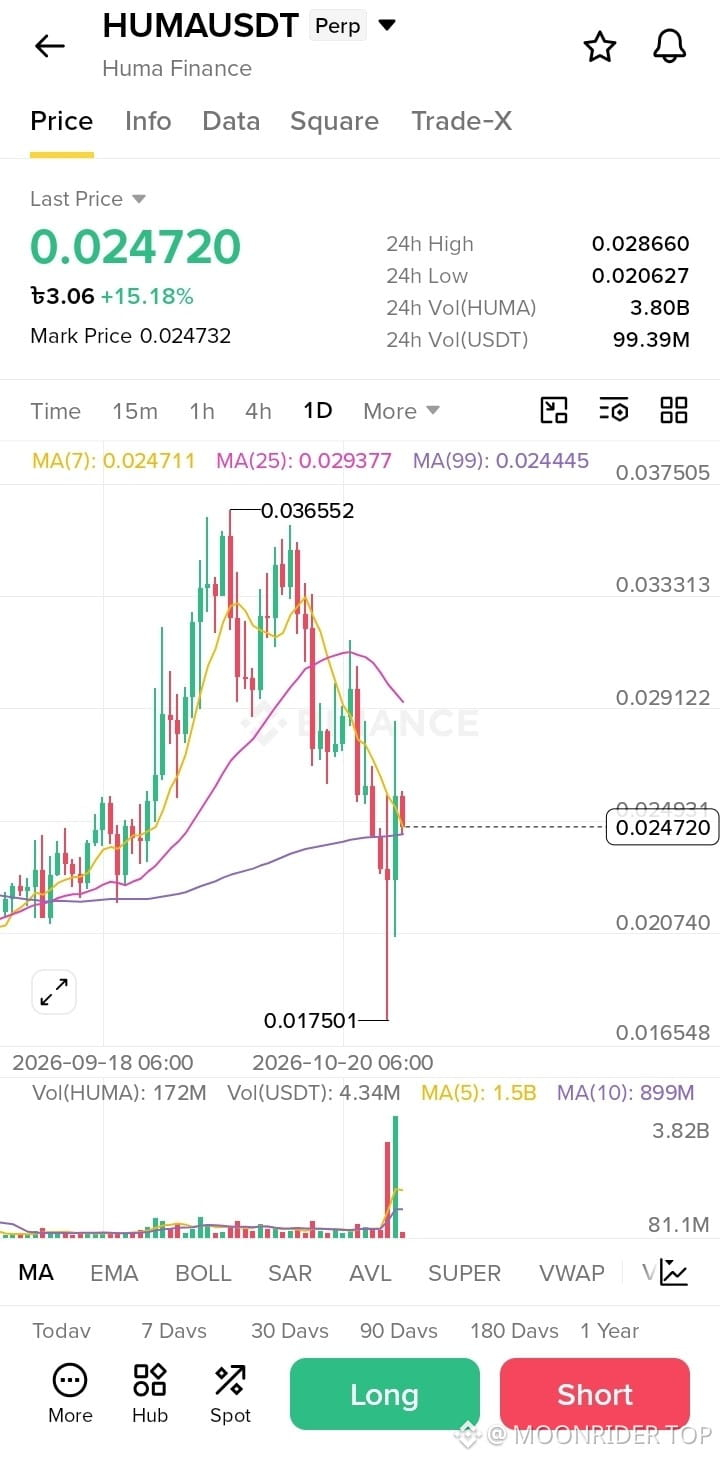
🚀 $HUMA /USDT — LONG SIGNAL
📊 TRADE PLAN — LONG
🟢 Entry Zone: 0.0240 – 0.0248
🎯 TP1: 0.0260
🎯 TP2: 0.0275
🎯 TP3: 0.0290
🎯 TP4: 0.0310
🛑 Stop Loss: 0.0228
📈 KEY SUPPORT LEVELS
Support 1: 0.0240
Support 2: 0.0220
Major Support: 0.0206$HUMA
{future}(HUMAUSDT)
🚀 $HUMA /USDT — LONG SIGNAL
📊 TRADE PLAN — LONG
🟢 Entry Zone: 0.0240 – 0.0248
🎯 TP1: 0.0260
🎯 TP2: 0.0275
🎯 TP3: 0.0290
🎯 TP4: 0.0310
🛑 Stop Loss: 0.0228
📈 KEY SUPPORT LEVELS
Support 1: 0.0240
Support 2: 0.0220
Major Support: 0.0206$HUMA
📊 TRADE PLAN — LONG
🟢 Entry Zone: 0.0240 – 0.0248
🎯 TP1: 0.0260
🎯 TP2: 0.0275
🎯 TP3: 0.0290
🎯 TP4: 0.0310
🛑 Stop Loss: 0.0228
📈 KEY SUPPORT LEVELS
Support 1: 0.0240
Support 2: 0.0220
Major Support: 0.0206$HUMA
31
1
2k
·
--
Bearish
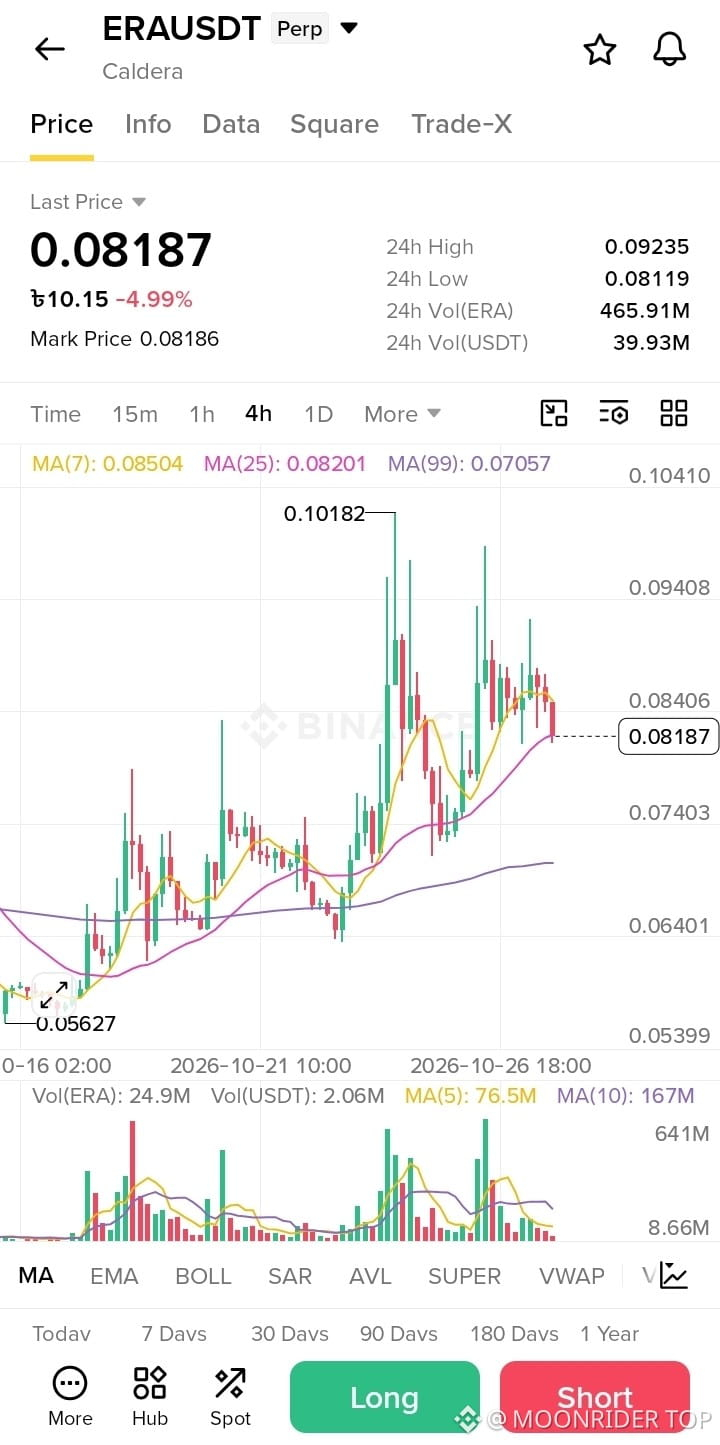
$ERA price is currently trading around 0.08187, and bearish momentum may continue if the key support levels fail to hold.
📉 Trade Plan — SHORT
🔹 Entry Zone: 0.0818 – 0.0825
🔹 Resistance 1: 0.0825
🔹 Resistance 2: 0.0850
🔹 Major Resistance: 0.0923
🎯 Take Profit (TP1): 0.0790
🎯 Take Profit (TP2): 0.0760
🎯 Take Profit (TP3): 0.0740
🛑 Stop Loss: 0.0855
📊 Technical Analysis:
Price is below MA(7) at 0.08504, indicating short-term weakness.
MA(25) at 0.08201 is a key level to watch.
Support near 0.0812 may determine the next move.
A breakdown below support could$ERA
{future}(ERAUSDT)
$XRP
{future}(XRPUSDT)
$ERA price is currently trading around 0.08187, and bearish momentum may continue if the key support levels fail to hold.
📉 Trade Plan — SHORT
🔹 Entry Zone: 0.0818 – 0.0825
🔹 Resistance 1: 0.0825
🔹 Resistance 2: 0.0850
🔹 Major Resistance: 0.0923
🎯 Take Profit (TP1): 0.0790
🎯 Take Profit (TP2): 0.0760
🎯 Take Profit (TP3): 0.0740
🛑 Stop Loss: 0.0855
📊 Technical Analysis:
Price is below MA(7) at 0.08504, indicating short-term weakness.
MA(25) at 0.08201 is a key level to watch.
Support near 0.0812 may determine the next move.
A breakdown below support could$ERA
$XRP
📉 Trade Plan — SHORT
🔹 Entry Zone: 0.0818 – 0.0825
🔹 Resistance 1: 0.0825
🔹 Resistance 2: 0.0850
🔹 Major Resistance: 0.0923
🎯 Take Profit (TP1): 0.0790
🎯 Take Profit (TP2): 0.0760
🎯 Take Profit (TP3): 0.0740
🛑 Stop Loss: 0.0855
📊 Technical Analysis:
Price is below MA(7) at 0.08504, indicating short-term weakness.
MA(25) at 0.08201 is a key level to watch.
Support near 0.0812 may determine the next move.
A breakdown below support could$ERA
$XRP
40
1
1.3k
Log in to explore more content
Join global crypto users on Binance Square
⚡️ Get latest and useful information about crypto.
💬 Trusted by the world’s largest crypto exchange.
👍 Discover real insights from verified creators.
Email / Phone number
Trending Topics
BinanceUpdatesProofofReservesAddresses
283 views
41 Discussing
Binance Adds New Wallet Addresses to Proof of Reserves, Shifts All Withdrawals There
Binance News
·9 Likes
·3.6k views
BinanceToResumePhaseOneOfWithdrawals
10,555 views
389 Discussing
BinanceHadAlreadyCovered$6BofHackLoss
1,719 views
54 Discussing