

Shahzad mugheera
977 Posts

Shahzad mugheera
Crypto lover 📊 Crypto Market Analyst | 📈 Charts • Trends • Setups🎯 Focused on Discipline, Research & Growth🚀 Learning. Trading. Evolving.
307 Following
4.2K+ Followers
538 Liked
Posts
All
Quotes
Live
PINNED

PINNED



Bilawal Ashiq
·
--
🧧🧧Claim Gift Repost pls 🎉🎉
$BNB
$BNB


兰汐kyL
·
--
$ETH $BTC #Many people ask me about market conditions. To be honest, I really can’t find any reason to be bearish right now. There’s a rule that’s been circulating in the crypto world: bull runs last three years and bear markets last one. This bear market we’re in started last October, so the cycle is almost coming to an end.💥
Many people are still afraid of the price falling, but remember—when a bear market is nearing its end, any pullback isn’t a collapse; it’s an opportunity for you to get on board. The bigger trend can only be bullish from here on out. Every drop is a window to build your position in batches.🚨
Of course, you can’t be blindly optimistic either. Don’t go all-in. Even if the overall trend turns bullish, there will definitely be plenty of consolidation and “shakeout” in between. The big players will keep moving back and forth to harvest leveraged traders repeatedly. Never take on extremely high leverage to hold a position. If a sudden negative catalyst hits, you can easily get liquidated.🔥#
The transition from bull to bear (and vice versa) won’t happen overnight. It’s not like once a bear market ends, prices will just surge nonstop. Hold your coins patiently—don’t let yourself get shaken out by short-term fluctuations. When the market moves, hold steady. When opportunities drop low enough to buy, have the courage to lay out your plan and stick to your own position limits.💥
The market always has uncertainty. No market prediction is 100% accurate. You must control how much capital you投入 and only participate with money you can afford to lose. Be mentally prepared for potential losses.💥#美国10年期美债收益率逼近5.3% #美元指数创2025年5月来新高
Many people are still afraid of the price falling, but remember—when a bear market is nearing its end, any pullback isn’t a collapse; it’s an opportunity for you to get on board. The bigger trend can only be bullish from here on out. Every drop is a window to build your position in batches.🚨
Of course, you can’t be blindly optimistic either. Don’t go all-in. Even if the overall trend turns bullish, there will definitely be plenty of consolidation and “shakeout” in between. The big players will keep moving back and forth to harvest leveraged traders repeatedly. Never take on extremely high leverage to hold a position. If a sudden negative catalyst hits, you can easily get liquidated.🔥#
The transition from bull to bear (and vice versa) won’t happen overnight. It’s not like once a bear market ends, prices will just surge nonstop. Hold your coins patiently—don’t let yourself get shaken out by short-term fluctuations. When the market moves, hold steady. When opportunities drop low enough to buy, have the courage to lay out your plan and stick to your own position limits.💥
The market always has uncertainty. No market prediction is 100% accurate. You must control how much capital you投入 and only participate with money you can afford to lose. Be mentally prepared for potential losses.💥#美国10年期美债收益率逼近5.3% #美元指数创2025年5月来新高



易琳Ten
·
--
Many people are trying to describe the major drawdown at the beginning of 2023,
attempting to fit today’s market conditions using historical price action.
But what I want to say is:
History can rhyme, but it doesn’t simply repeat.
I’m more inclined to believe that we are still in Stage D.
However, before the target area is fully reached, the market may not necessarily replicate that year’s deep drawdown.
So, you can reference history, but don’t let it constrain you.
Past price action can help us understand the market’s rhythm,
but it cannot become a script for predicting the future.
Price movements may look similar, but the rhythm may not be the same;
structure can be replicated, but the path won’t be exactly repeated.
What truly matters in trading isn’t finding a historical copy,
but continuously adjusting your judgment based on current price, structure, and changes in capital.
attempting to fit today’s market conditions using historical price action.
But what I want to say is:
History can rhyme, but it doesn’t simply repeat.
I’m more inclined to believe that we are still in Stage D.
However, before the target area is fully reached, the market may not necessarily replicate that year’s deep drawdown.
So, you can reference history, but don’t let it constrain you.
Past price action can help us understand the market’s rhythm,
but it cannot become a script for predicting the future.
Price movements may look similar, but the rhythm may not be the same;
structure can be replicated, but the path won’t be exactly repeated.
What truly matters in trading isn’t finding a historical copy,
but continuously adjusting your judgment based on current price, structure, and changes in capital.


Shaheen 69
·
--
LearnWithShaheen69
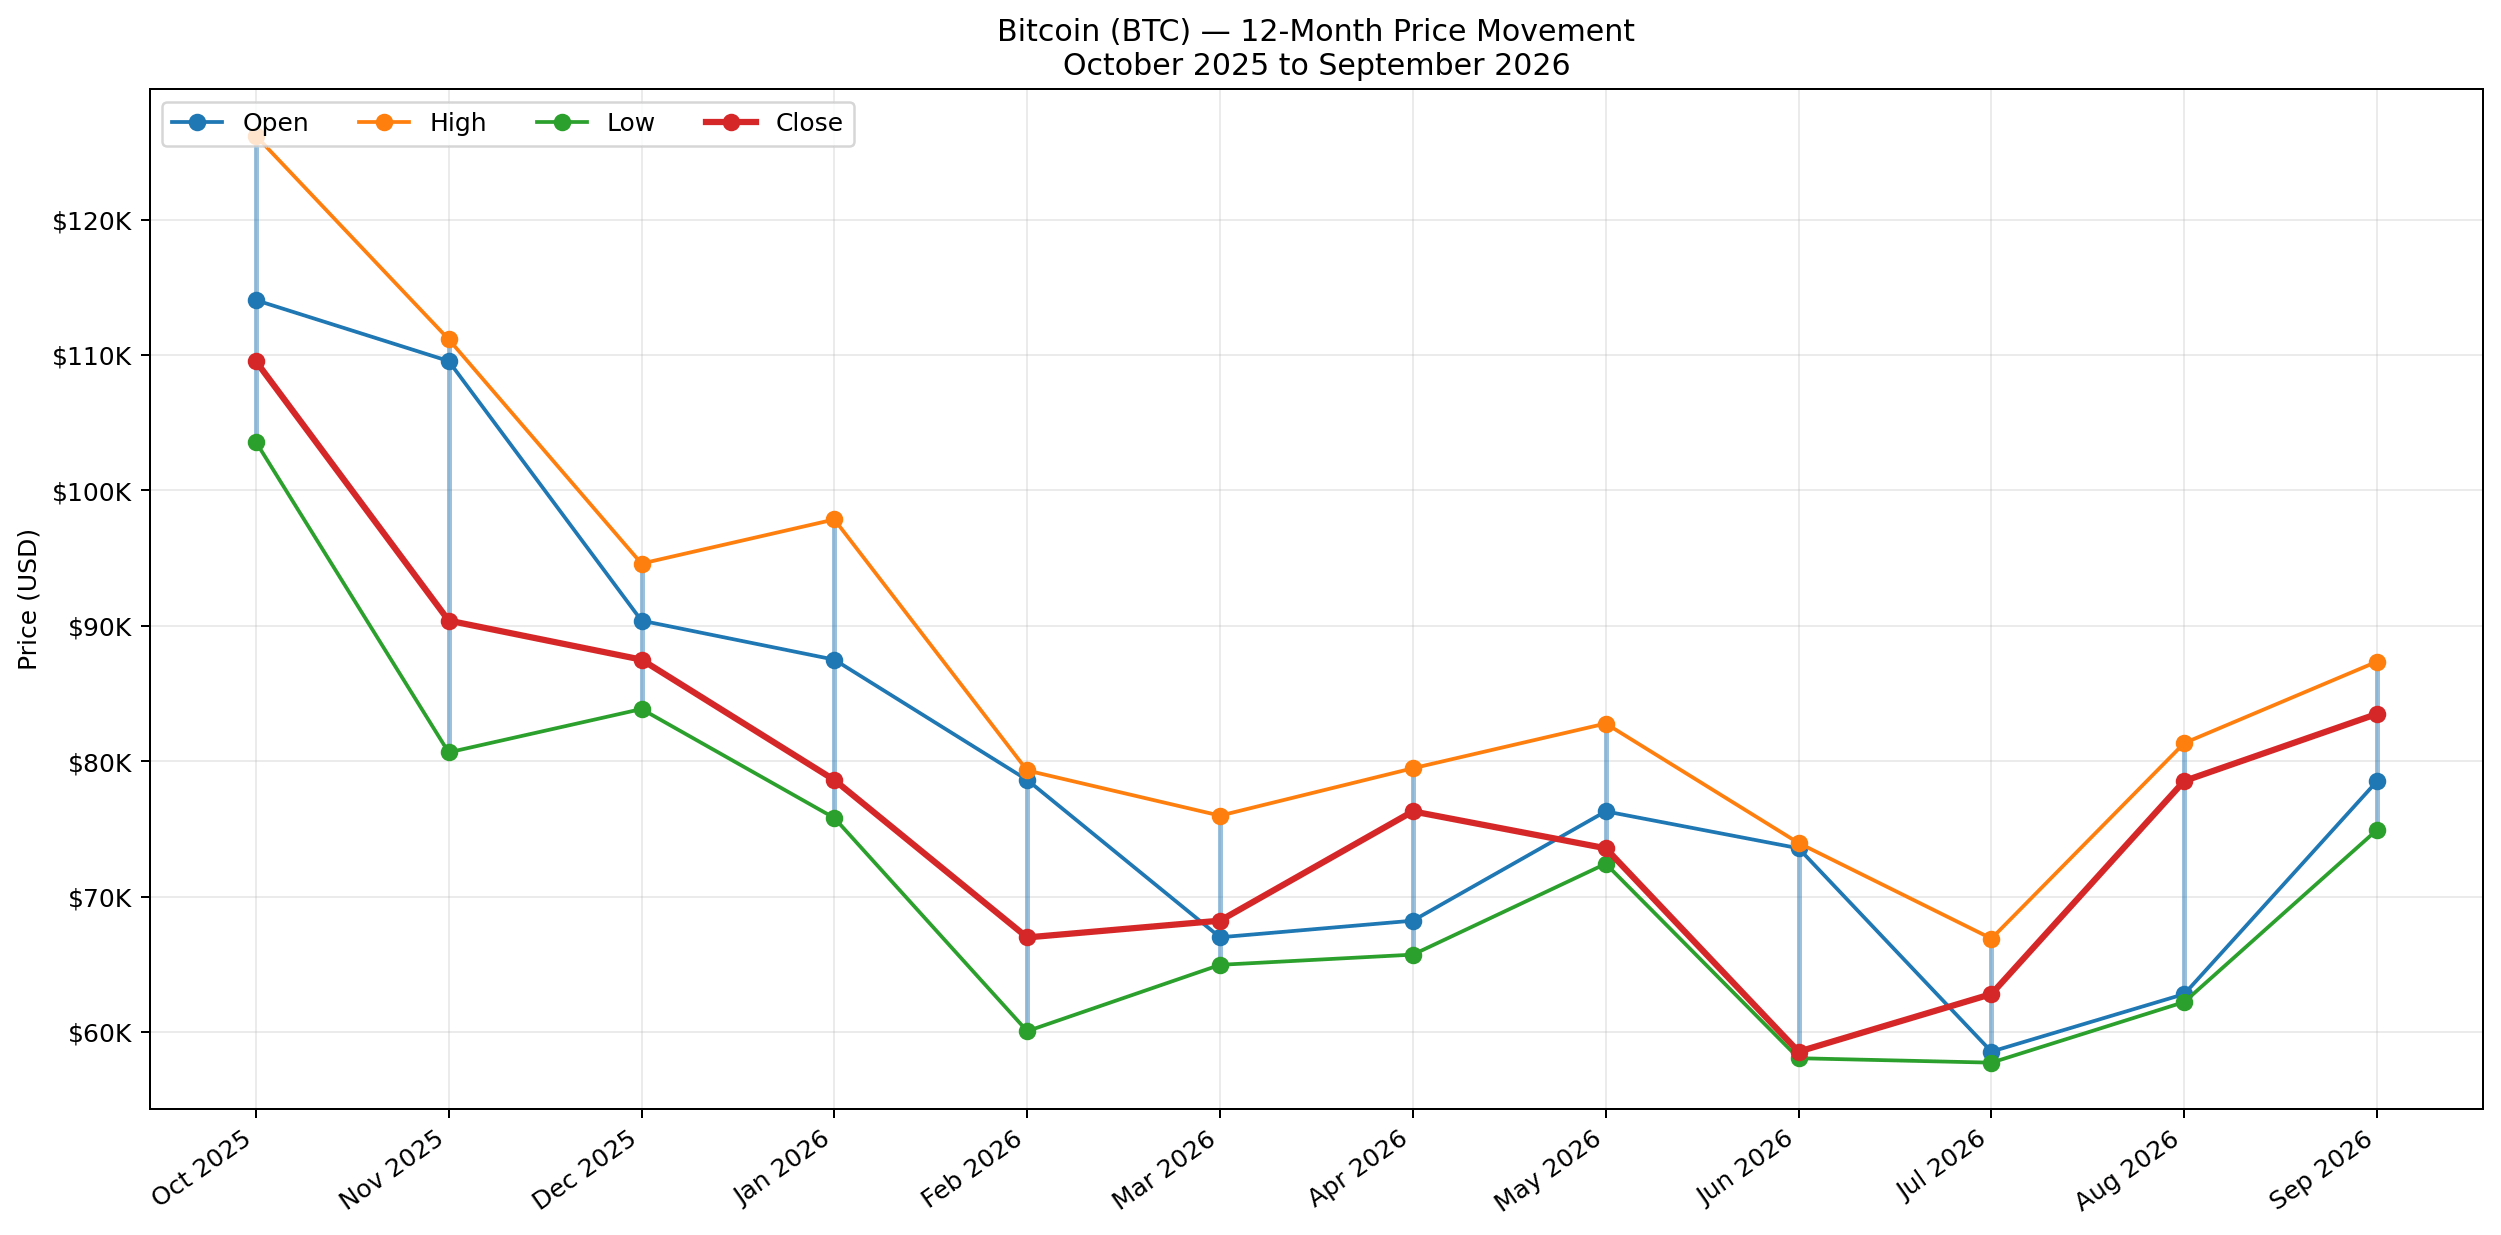
📊 BTC’s 1-Year Journey: From $126K ATH to $57K Low
Bitcoin’s one-year journey is a strong reminder of market volatility. From around $114K in October 2025 to an ATH near $126K, followed by a major correction, BTC showed how quickly sentiment can change.
My lesson: Don’t put your entire portfolio into one trade. Keep some funds in reserve, protect profits, use proper position sizing, and avoid emotional decisions. Markets will always give another opportunity—protecting your capital should come first.
$BTC
📊 BTC’s 1-Year Journey: From $126K ATH to $57K Low
Bitcoin’s one-year journey is a strong reminder of market volatility. From around $114K in October 2025 to an ATH near $126K, followed by a major correction, BTC showed how quickly sentiment can change.
My lesson: Don’t put your entire portfolio into one trade. Keep some funds in reserve, protect profits, use proper position sizing, and avoid emotional decisions. Markets will always give another opportunity—protecting your capital should come first.
$BTC

ETH_Tamim
·
--
Only you 🧧🎁🧧

Jamal 656
·
--
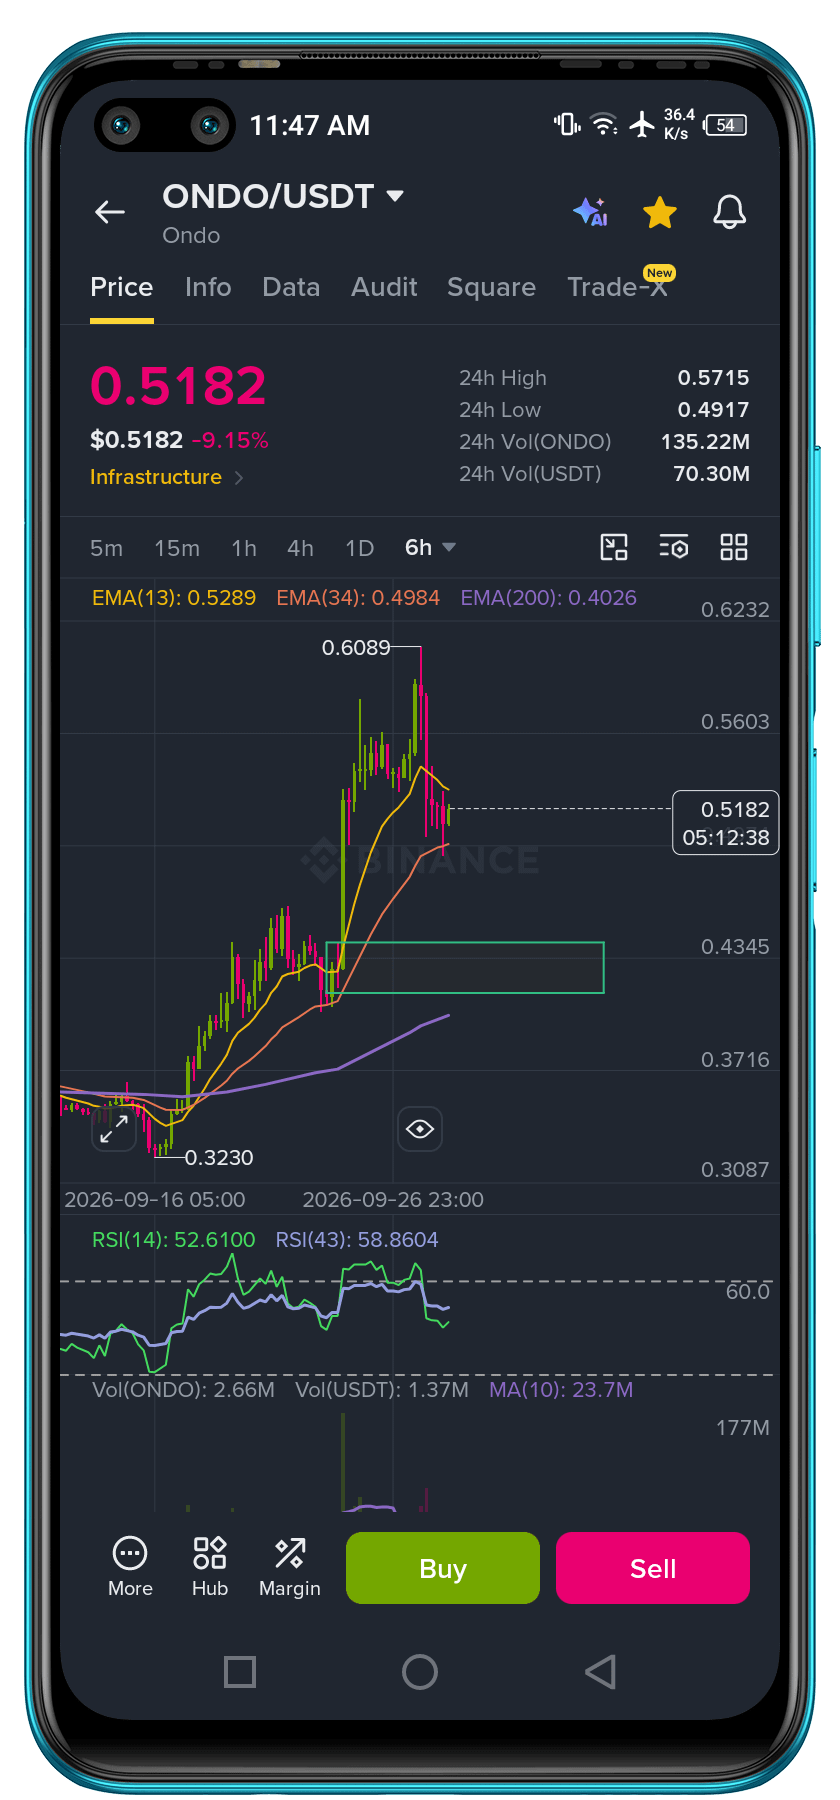
Fresh spot entry0.4250
$ONDO
Ans:g
#ONDO/USDT
$ONDO
Ans:g
#ONDO/USDT
易琳Ten
·
--
The courage to buy the dip, and the rationality to avoid the top.
How much you earn is decided by the market; how much you lose is determined by yourself.
How much you earn is decided by the market; how much you lose is determined by yourself.


ENTRY HUNTER⁷⁸⁹
·
--
$SOL REDBOX FOR ALL!! LOVE you guys!
REPOST the Post !!! & JOIN my chat group for more exciting REWARDS !!!!
$TRB will go 24-27
$APT will go 0.94
TREND is our friend !!
#AminulIYI
REPOST the Post !!! & JOIN my chat group for more exciting REWARDS !!!!
$TRB will go 24-27
$APT will go 0.94
TREND is our friend !!
#AminulIYI

兰汐kyL
·
--
A day of working hard to make money—chasing dogs, playing level one, thinking 🤔🤔, just makes me happy 😃😃😃😃😃😃. I’ve got 👉big red envelopes👉🧧🧧🧧🧧🧧🧧🧧 here—come claim them. Compete on speed with your hands,

Log in to explore more content