
Z行者Zynergy2
106 Posts

Z行者Zynergy2
Report
Block User
31 Following
181 Followers
76 Liked
Posts
All
Quotes
Videos
·
--
Article
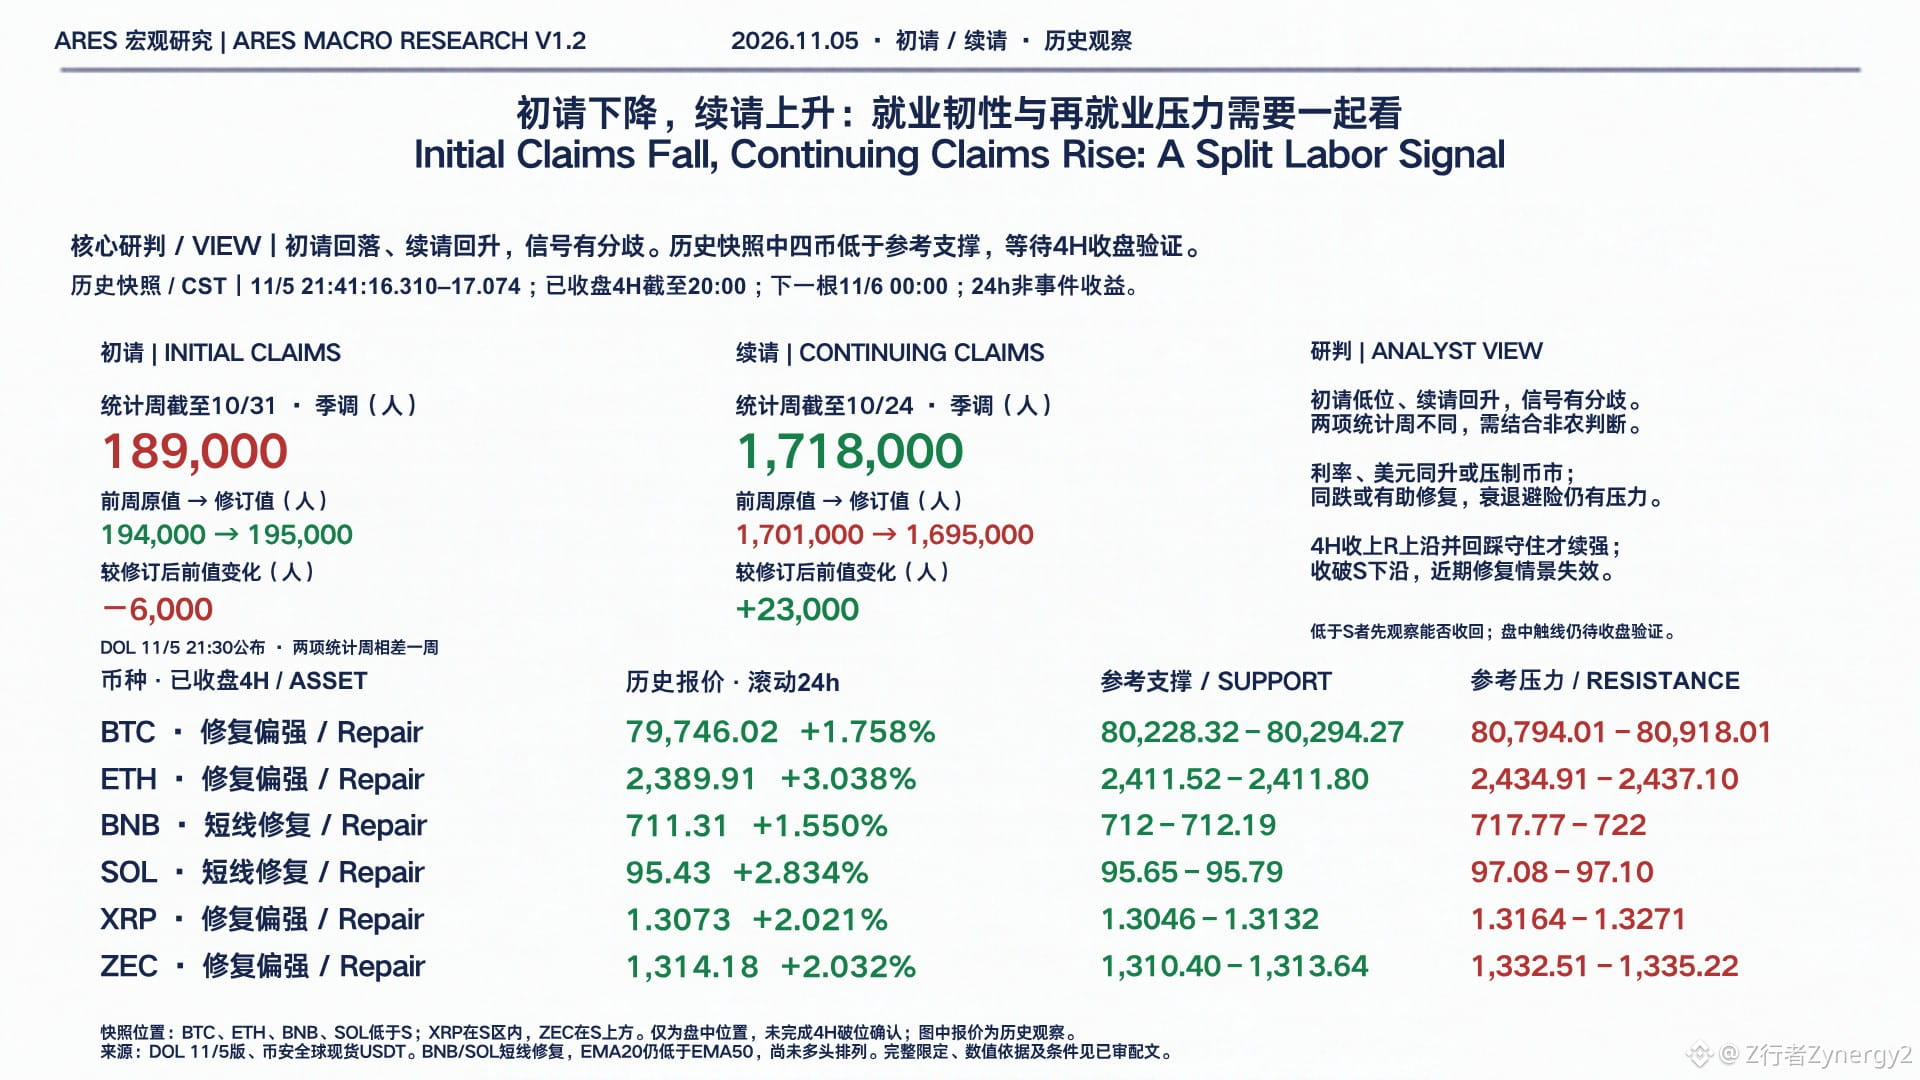
Initial claims fell, continuing claims rose: labor-market resilience and pressure to find new jobs need to be considered togetherInitial claims fell, continuing claims rose: labor-market resilience and pressure to find new jobs need to be considered together
Based on the U.S. Department of Labor's weekly report dated November 5, 2026: The department released the weekly jobless claims data on November 5 at 21:30 Beijing time (08:30 EST). The following is a retrospective analysis based on the figures officially released that day and market conditions at the time.
【Official fact: The two figures cover different statistical weeks】
For the week ending October 31, seasonally adjusted initial claims were 189,000, down 6,000 from the revised previous figure. The prior week was revised up from 194,000 to 195,000, and the four-week average of initial claims was 194,750.
For the week ending October 24, seasonally adjusted continuing claims were 1.718 million, up 23,000 from the revised previous figure. The prior week was revised down from 1.701 million to 1.695 million, and the four-week average of continuing claims was 1.7095 million. Continuing claims lag initial claims by one week, so the two should not be treated as net employment changes for the same statistical week.
Initial claims fell, continuing claims rose: labor-market resilience and pressure to find new jobs need to be considered together
Initial claims fell, continuing claims rose: labor-market resilience and pressure to find new jobs need to be considered together
Based on the U.S. Department of Labor's weekly report dated November 5, 2026: The department released the weekly jobless claims data on November 5 at 21:30 Beijing time (08:30 EST). The following is a retrospective analysis based on the figures officially released that day and market conditions at the time.
【Official fact: The two figures cover different statistical weeks】
For the week ending October 31, seasonally adjusted initial claims were 189,000, down 6,000 from the revised previous figure. The prior week was revised up from 194,000 to 195,000, and the four-week average of initial claims was 194,750.
For the week ending October 24, seasonally adjusted continuing claims were 1.718 million, up 23,000 from the revised previous figure. The prior week was revised down from 1.701 million to 1.695 million, and the four-week average of continuing claims was 1.7095 million. Continuing claims lag initial claims by one week, so the two should not be treated as net employment changes for the same statistical week.
Based on the U.S. Department of Labor's weekly report dated November 5, 2026: The department released the weekly jobless claims data on November 5 at 21:30 Beijing time (08:30 EST). The following is a retrospective analysis based on the figures officially released that day and market conditions at the time.
【Official fact: The two figures cover different statistical weeks】
For the week ending October 31, seasonally adjusted initial claims were 189,000, down 6,000 from the revised previous figure. The prior week was revised up from 194,000 to 195,000, and the four-week average of initial claims was 194,750.
For the week ending October 24, seasonally adjusted continuing claims were 1.718 million, up 23,000 from the revised previous figure. The prior week was revised down from 1.701 million to 1.695 million, and the four-week average of continuing claims was 1.7095 million. Continuing claims lag initial claims by one week, so the two should not be treated as net employment changes for the same statistical week.
374
·
--

Article
Why can interest rates affect the entire economy?If borrowing becomes cheaper, will businesses definitely expand? Suppose you run a shop, and the loan rate falls from 6% to 3%. Borrowing costs less, but your shop is getting fewer and fewer customers. Would you immediately borrow money to open a second location? You might wait and see. That’s why the economy doesn’t necessarily heat up right away after an interest rate cut.
Interest rates affect the cost of financing. When that cost falls, buying a home, purchasing equipment, and expanding a business usually become more attractive. But whether businesses are willing to borrow also depends on orders and profits; whether banks are willing to lend also depends on borrowers’ ability to repay. Only when financing turns into actual consumption and investment can demand grow, giving businesses more reason to hire and produce.
Why can interest rates affect the entire economy?
If borrowing becomes cheaper, will businesses definitely expand? Suppose you run a shop, and the loan rate falls from 6% to 3%. Borrowing costs less, but your shop is getting fewer and fewer customers. Would you immediately borrow money to open a second location? You might wait and see. That’s why the economy doesn’t necessarily heat up right away after an interest rate cut.
Interest rates affect the cost of financing. When that cost falls, buying a home, purchasing equipment, and expanding a business usually become more attractive. But whether businesses are willing to borrow also depends on orders and profits; whether banks are willing to lend also depends on borrowers’ ability to repay. Only when financing turns into actual consumption and investment can demand grow, giving businesses more reason to hire and produce.
Interest rates affect the cost of financing. When that cost falls, buying a home, purchasing equipment, and expanding a business usually become more attractive. But whether businesses are willing to borrow also depends on orders and profits; whether banks are willing to lend also depends on borrowers’ ability to repay. Only when financing turns into actual consumption and investment can demand grow, giving businesses more reason to hire and produce.
60
·
--
Verified
Article
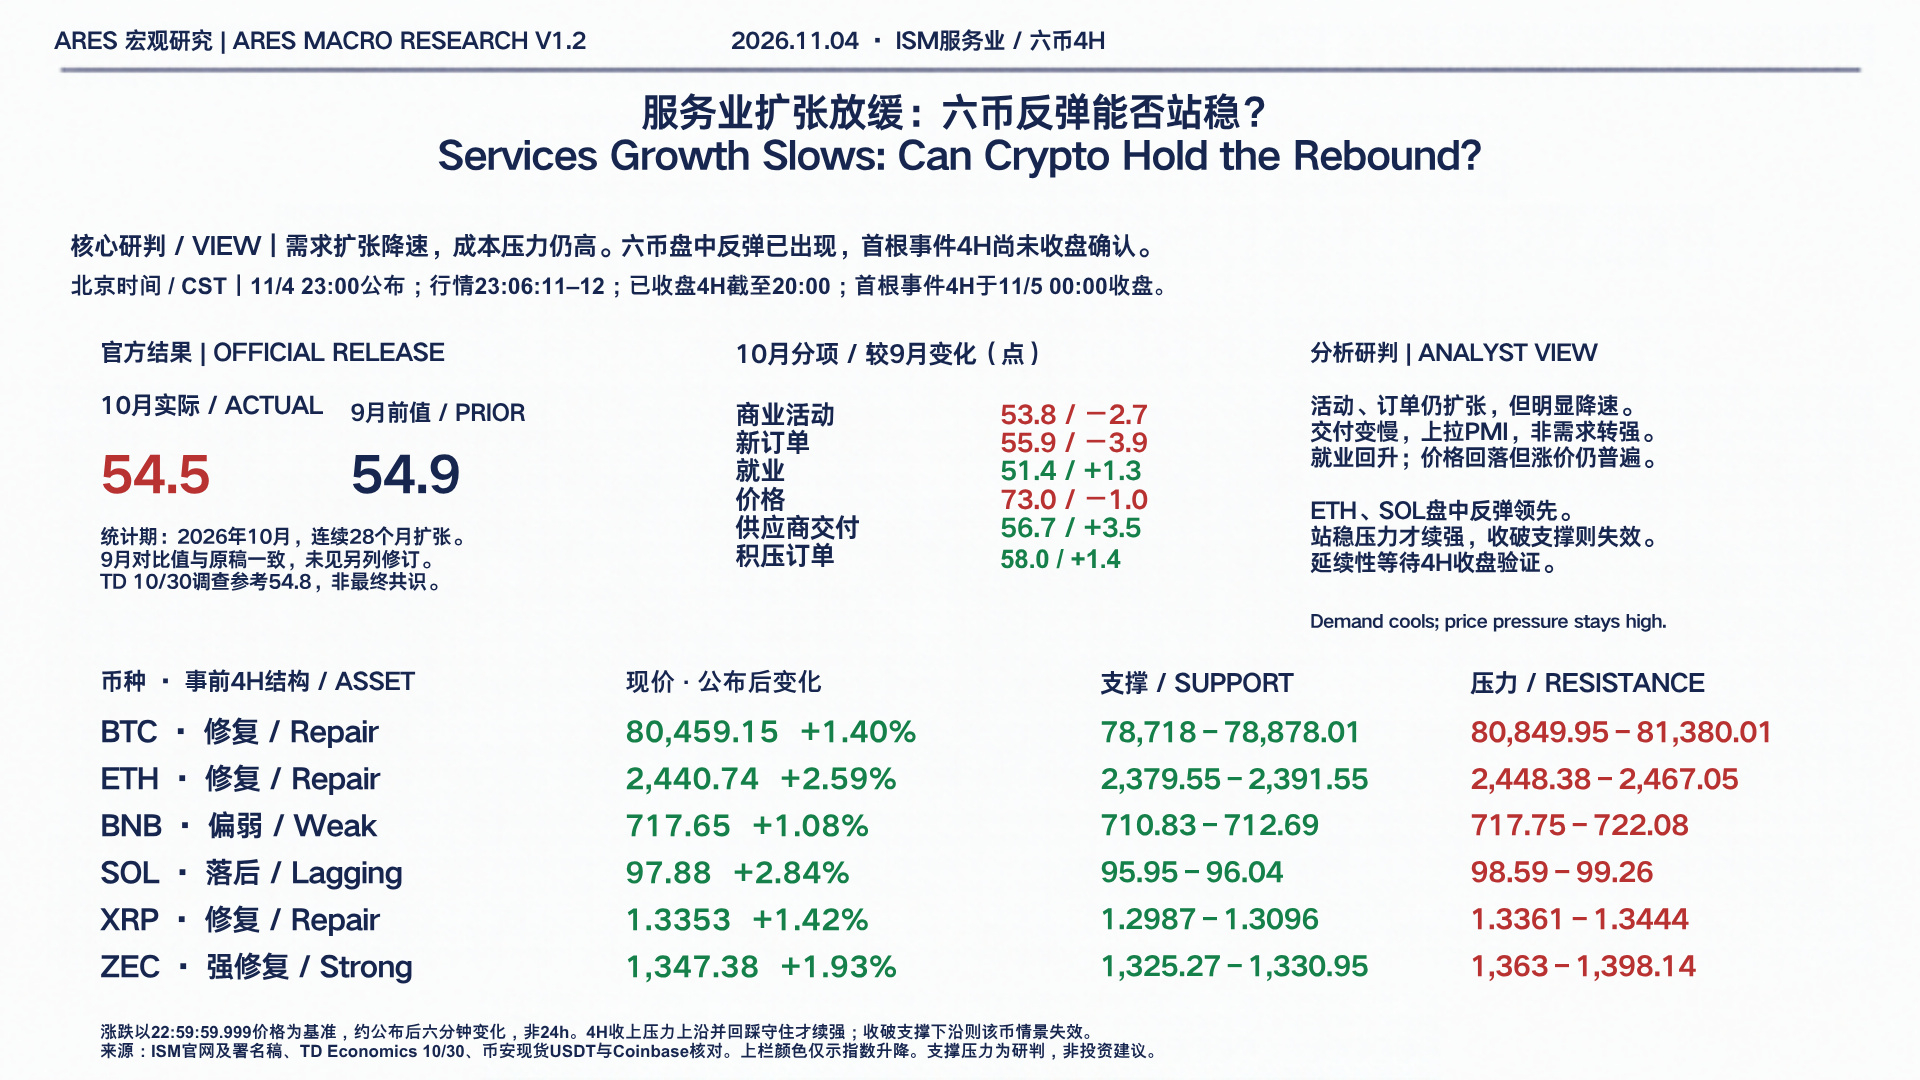
Services PMI falls to 54.5: Demand cools—can the six-currency rebound hold?The U.S. ISM Services PMI came in at 54.5 in October, down 0.4 index points from 54.9 in September. The services sector continued to expand, but at a slower pace. Release time: November 4 at 10:00 a.m. U.S. Eastern Standard Time / 11:00 p.m. Beijing time.
【Fact: Demand is slowing, while cost pressures remain high】
Business activity was 53.8 (previously 56.5) and new orders were 55.9 (59.8). Both remained above 50, but fell by 2.7 and 3.9 points, respectively. Employment was 51.4 (50.1), marking a second consecutive month of expansion. Prices were 73.0 (74.0), down 1 point, but still indicating that price increases remain widespread. 73 is not year-over-year inflation, nor does it mean costs have fallen.
Services PMI falls to 54.5: Demand cools—can the six-currency rebound hold?
The U.S. ISM Services PMI came in at 54.5 in October, down 0.4 index points from 54.9 in September. The services sector continued to expand, but at a slower pace. Release time: November 4 at 10:00 a.m. U.S. Eastern Standard Time / 11:00 p.m. Beijing time.
【Fact: Demand is slowing, while cost pressures remain high】
Business activity was 53.8 (previously 56.5) and new orders were 55.9 (59.8). Both remained above 50, but fell by 2.7 and 3.9 points, respectively. Employment was 51.4 (50.1), marking a second consecutive month of expansion. Prices were 73.0 (74.0), down 1 point, but still indicating that price increases remain widespread. 73 is not year-over-year inflation, nor does it mean costs have fallen.
【Fact: Demand is slowing, while cost pressures remain high】
Business activity was 53.8 (previously 56.5) and new orders were 55.9 (59.8). Both remained above 50, but fell by 2.7 and 3.9 points, respectively. Employment was 51.4 (50.1), marking a second consecutive month of expansion. Prices were 73.0 (74.0), down 1 point, but still indicating that price increases remain widespread. 73 is not year-over-year inflation, nor does it mean costs have fallen.
775
·
--
【Published after market open with a delay】This issue retains the Nov 4 22:07:28–29 ranking and the 22:08:46–47 market observation snapshot; these are not live quotes at the time of publication.
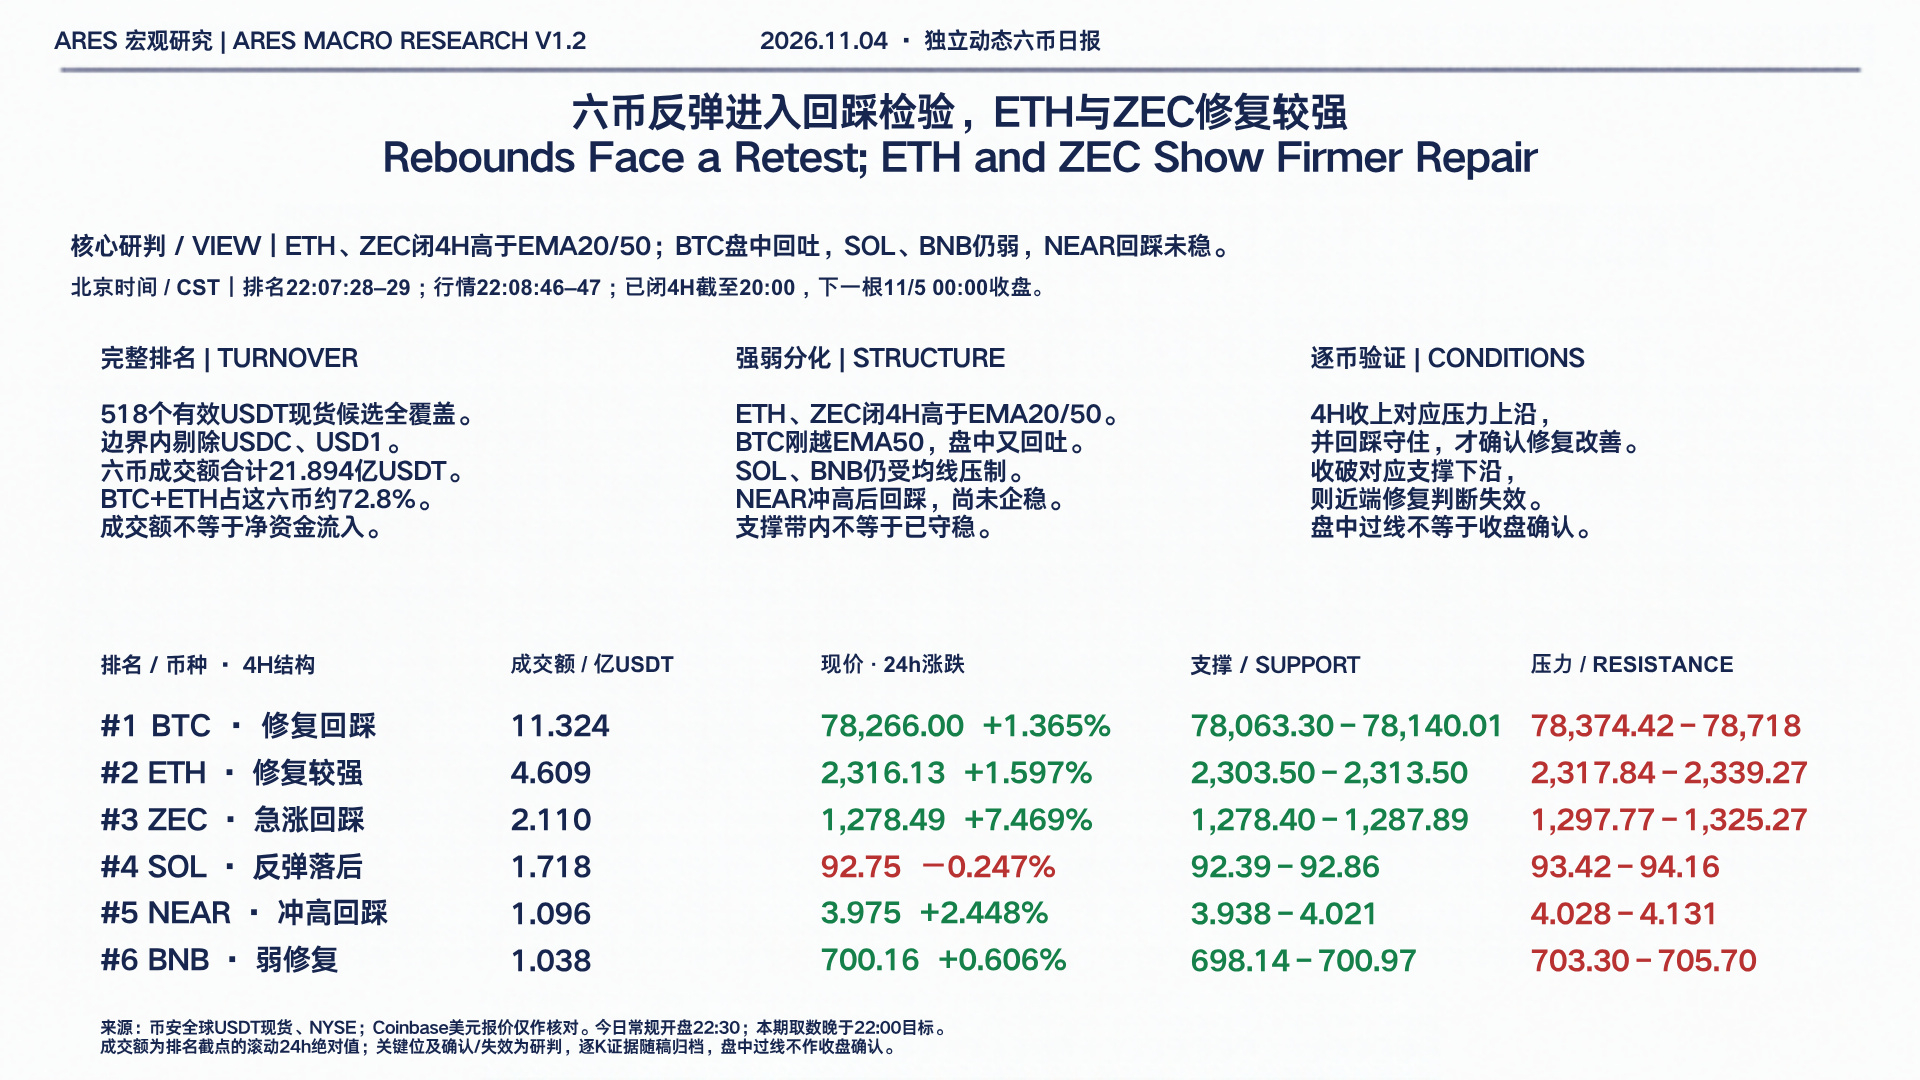
Six coins rebound and enter a pullback test: ETH and ZEC are stronger—who can hold support?
First, the assessment: this is not a broad-based shift to strength. The completed 4H recovery is more pronounced for ETH and ZEC; BTC has just moved above the sample EMA50, then given back ground intraday. SOL and BNB remain under moving-average pressure, while NEAR has pulled back after a surge. Entering a support band only means that demand is being tested; it does not mean support has held.
This issue ranks Binance global USDT spot pairs dynamically by rolling 24h trading volume. We fully retrieved metadata for 3,742 trading pairs and market data for all 3,745 pairs; 518 USDT candidates marked TRADING and available for spot trading were selected, all matched with no omissions or duplicates. There were 8 entries at the cutoff for sixth place. USDC and USD1 were excluded as stablecoins according to their issuers’ definitions; the remaining six are ordinary native tokens, not leveraged tokens.
The qualifying order is BTC, ETH, ZEC, SOL, NEAR, BNB. Combined trading volume for the six coins is 2.1894 billion USDT, with BTC and ETH accounting for 72.77% of the volume among the ranked coins. This reflects trading activity and concentration within the ranking, not net capital inflows or share of the entire market.
The ranking cutoff was Nov 4, 22:07:28–29 Beijing time; the quotes and rolling 24h changes below are from a separate snapshot at 22:08:46–47 and must not be treated as occurring at the same second or as event-related price changes.
①BTC|No. 1, volume: 1.1324 billion USDT; current price: 78,266.00, 24h +1.365%. Recovery pullback. Support: 78,063.30–78,140.01; resistance: 78,374.42–78,718. A 4H close above 78,718 followed by a successful retest would improve the outlook; a close below 78,063.30 invalidates the near-term recovery scenario.
②ETH|No. 2, 460.9 million; 2,316.13, +1.597%. Stronger recovery, nearing the lower edge of resistance. Support: 2,303.50–2,313.50; resistance: 2,317.84–2,339.27. A close above 2,339.27 followed by a successful retest would improve the outlook; a close below 2,303.50 invalidates it.
③ZEC|No. 3, 211.0 million; 1,278.49, +7.469%. Pulling back after a sharp rise, now within the support band and close to its lower edge. Support: 1,278.40–1,287.89; resistance: 1,297.77–1,325.27. A close above 1,325.27 followed by a successful retest would improve the outlook; a close below 1,278.40 invalidates it. It has the largest 24h gain among the ranked coins, which does not mean it is suitable to chase.
④SOL|No. 4, 171.8 million; 92.75, −0.247%. Lagging in the rebound, with an intraday pullback into the support band. Support: 92.39–92.86; resistance: 93.42–94.16. A close above 94.16 followed by a successful retest would improve the outlook; a close below 92.39 invalidates it.
⑤NEAR|No. 5, 109.6 million; 3.975, +2.448%. Pulling back after a surge; stabilization is not yet confirmed. Support: 3.938–4.021; resistance: 4.028–4.131. A close above 4.131 followed by a successful retest would improve the outlook; a close below 3.938 invalidates it.
⑥BNB|No. 6, 103.8 million; 700.16, +0.606%. Weak recovery, with an intraday pullback into the support band. Support: 698.14–700.97; resistance: 703.30–705.70. A close above 705.70 followed by a successful retest would improve the outlook; a close below 698.14 invalidates it.
All confirmations and invalidations refer to 4H closes; an intraday move across a level does not count as confirmation. The structure analysis uses UTC 4H candles, with the latest completed candle as of 20:00 Beijing time, and daily candles through 08:00 that day; the next 4H candle closes at 00:00 on Nov 5. Key levels are based on newly retrieved completed-candle highs and lows, prior-high retest zones, and the daily-chart context, with evidence for each endpoint archived; moving averages are used only as supplementary indicators. The descriptions of four coins as currently within their support bands apply only to the 22:08 observation snapshot.
The NYSE is open for regular trading today, with the regular session opening at 22:30 Beijing time. Data for this issue was collected later than the 22:00 target, so the above is a pre-market observation at the actual cutoff; it should be reassessed against subsequent closes and is not a definitive buy or sell instruction.
Sources: Binance global USDT spot; official stablecoin definitions from Circle and World Liberty Financial; Coinbase USD quotes used only for reasonableness checks; official NYSE calendar https://www.nyse.com/markets/hours-calendars .
【Published after market open with a delay】This issue retains the Nov 4 22:07:28–29 ranking and the 22:08:46–47 market observation snapshot; these are not live quotes at the time of publication.
Six coins rebound and enter a pullback test: ETH and ZEC are stronger—who can hold support?
First, the assessment: this is not a broad-based shift to strength. The completed 4H recovery is more pronounced for ETH and ZEC; BTC has just moved above the sample EMA50, then given back ground intraday. SOL and BNB remain under moving-average pressure, while NEAR has pulled back after a surge. Entering a support band only means that demand is being tested; it does not mean support has held.
This issue ranks Binance global USDT spot pairs dynamically by rolling 24h trading volume. We fully retrieved metadata for 3,742 trading pairs and market data for all 3,745 pairs; 518 USDT candidates marked TRADING and available for spot trading were selected, all matched with no omissions or duplicates. There were 8 entries at the cutoff for sixth place. USDC and USD1 were excluded as stablecoins according to their issuers’ definitions; the remaining six are ordinary native tokens, not leveraged tokens.
The qualifying order is BTC, ETH, ZEC, SOL, NEAR, BNB. Combined trading volume for the six coins is 2.1894 billion USDT, with BTC and ETH accounting for 72.77% of the volume among the ranked coins. This reflects trading activity and concentration within the ranking, not net capital inflows or share of the entire market.
The ranking cutoff was Nov 4, 22:07:28–29 Beijing time; the quotes and rolling 24h changes below are from a separate snapshot at 22:08:46–47 and must not be treated as occurring at the same second or as event-related price changes.
①BTC|No. 1, volume: 1.1324 billion USDT; current price: 78,266.00, 24h +1.365%. Recovery pullback. Support: 78,063.30–78,140.01; resistance: 78,374.42–78,718. A 4H close above 78,718 followed by a successful retest would improve the outlook; a close below 78,063.30 invalidates the near-term recovery scenario.
②ETH|No. 2, 460.9 million; 2,316.13, +1.597%. Stronger recovery, nearing the lower edge of resistance. Support: 2,303.50–2,313.50; resistance: 2,317.84–2,339.27. A close above 2,339.27 followed by a successful retest would improve the outlook; a close below 2,303.50 invalidates it.
③ZEC|No. 3, 211.0 million; 1,278.49, +7.469%. Pulling back after a sharp rise, now within the support band and close to its lower edge. Support: 1,278.40–1,287.89; resistance: 1,297.77–1,325.27. A close above 1,325.27 followed by a successful retest would improve the outlook; a close below 1,278.40 invalidates it. It has the largest 24h gain among the ranked coins, which does not mean it is suitable to chase.
④SOL|No. 4, 171.8 million; 92.75, −0.247%. Lagging in the rebound, with an intraday pullback into the support band. Support: 92.39–92.86; resistance: 93.42–94.16. A close above 94.16 followed by a successful retest would improve the outlook; a close below 92.39 invalidates it.
⑤NEAR|No. 5, 109.6 million; 3.975, +2.448%. Pulling back after a surge; stabilization is not yet confirmed. Support: 3.938–4.021; resistance: 4.028–4.131. A close above 4.131 followed by a successful retest would improve the outlook; a close below 3.938 invalidates it.
⑥BNB|No. 6, 103.8 million; 700.16, +0.606%. Weak recovery, with an intraday pullback into the support band. Support: 698.14–700.97; resistance: 703.30–705.70. A close above 705.70 followed by a successful retest would improve the outlook; a close below 698.14 invalidates it.
All confirmations and invalidations refer to 4H closes; an intraday move across a level does not count as confirmation. The structure analysis uses UTC 4H candles, with the latest completed candle as of 20:00 Beijing time, and daily candles through 08:00 that day; the next 4H candle closes at 00:00 on Nov 5. Key levels are based on newly retrieved completed-candle highs and lows, prior-high retest zones, and the daily-chart context, with evidence for each endpoint archived; moving averages are used only as supplementary indicators. The descriptions of four coins as currently within their support bands apply only to the 22:08 observation snapshot.
The NYSE is open for regular trading today, with the regular session opening at 22:30 Beijing time. Data for this issue was collected later than the 22:00 target, so the above is a pre-market observation at the actual cutoff; it should be reassessed against subsequent closes and is not a definitive buy or sell instruction.
Sources: Binance global USDT spot; official stablecoin definitions from Circle and World Liberty Financial; Coinbase USD quotes used only for reasonableness checks; official NYSE calendar https://www.nyse.com/markets/hours-calendars .
Six coins rebound and enter a pullback test: ETH and ZEC are stronger—who can hold support?
First, the assessment: this is not a broad-based shift to strength. The completed 4H recovery is more pronounced for ETH and ZEC; BTC has just moved above the sample EMA50, then given back ground intraday. SOL and BNB remain under moving-average pressure, while NEAR has pulled back after a surge. Entering a support band only means that demand is being tested; it does not mean support has held.
This issue ranks Binance global USDT spot pairs dynamically by rolling 24h trading volume. We fully retrieved metadata for 3,742 trading pairs and market data for all 3,745 pairs; 518 USDT candidates marked TRADING and available for spot trading were selected, all matched with no omissions or duplicates. There were 8 entries at the cutoff for sixth place. USDC and USD1 were excluded as stablecoins according to their issuers’ definitions; the remaining six are ordinary native tokens, not leveraged tokens.
The qualifying order is BTC, ETH, ZEC, SOL, NEAR, BNB. Combined trading volume for the six coins is 2.1894 billion USDT, with BTC and ETH accounting for 72.77% of the volume among the ranked coins. This reflects trading activity and concentration within the ranking, not net capital inflows or share of the entire market.
The ranking cutoff was Nov 4, 22:07:28–29 Beijing time; the quotes and rolling 24h changes below are from a separate snapshot at 22:08:46–47 and must not be treated as occurring at the same second or as event-related price changes.
①BTC|No. 1, volume: 1.1324 billion USDT; current price: 78,266.00, 24h +1.365%. Recovery pullback. Support: 78,063.30–78,140.01; resistance: 78,374.42–78,718. A 4H close above 78,718 followed by a successful retest would improve the outlook; a close below 78,063.30 invalidates the near-term recovery scenario.
②ETH|No. 2, 460.9 million; 2,316.13, +1.597%. Stronger recovery, nearing the lower edge of resistance. Support: 2,303.50–2,313.50; resistance: 2,317.84–2,339.27. A close above 2,339.27 followed by a successful retest would improve the outlook; a close below 2,303.50 invalidates it.
③ZEC|No. 3, 211.0 million; 1,278.49, +7.469%. Pulling back after a sharp rise, now within the support band and close to its lower edge. Support: 1,278.40–1,287.89; resistance: 1,297.77–1,325.27. A close above 1,325.27 followed by a successful retest would improve the outlook; a close below 1,278.40 invalidates it. It has the largest 24h gain among the ranked coins, which does not mean it is suitable to chase.
④SOL|No. 4, 171.8 million; 92.75, −0.247%. Lagging in the rebound, with an intraday pullback into the support band. Support: 92.39–92.86; resistance: 93.42–94.16. A close above 94.16 followed by a successful retest would improve the outlook; a close below 92.39 invalidates it.
⑤NEAR|No. 5, 109.6 million; 3.975, +2.448%. Pulling back after a surge; stabilization is not yet confirmed. Support: 3.938–4.021; resistance: 4.028–4.131. A close above 4.131 followed by a successful retest would improve the outlook; a close below 3.938 invalidates it.
⑥BNB|No. 6, 103.8 million; 700.16, +0.606%. Weak recovery, with an intraday pullback into the support band. Support: 698.14–700.97; resistance: 703.30–705.70. A close above 705.70 followed by a successful retest would improve the outlook; a close below 698.14 invalidates it.
All confirmations and invalidations refer to 4H closes; an intraday move across a level does not count as confirmation. The structure analysis uses UTC 4H candles, with the latest completed candle as of 20:00 Beijing time, and daily candles through 08:00 that day; the next 4H candle closes at 00:00 on Nov 5. Key levels are based on newly retrieved completed-candle highs and lows, prior-high retest zones, and the daily-chart context, with evidence for each endpoint archived; moving averages are used only as supplementary indicators. The descriptions of four coins as currently within their support bands apply only to the 22:08 observation snapshot.
The NYSE is open for regular trading today, with the regular session opening at 22:30 Beijing time. Data for this issue was collected later than the 22:00 target, so the above is a pre-market observation at the actual cutoff; it should be reassessed against subsequent closes and is not a definitive buy or sell instruction.
Sources: Binance global USDT spot; official stablecoin definitions from Circle and World Liberty Financial; Coinbase USD quotes used only for reasonableness checks; official NYSE calendar https://www.nyse.com/markets/hours-calendars .
587
·
--
Verified
Article
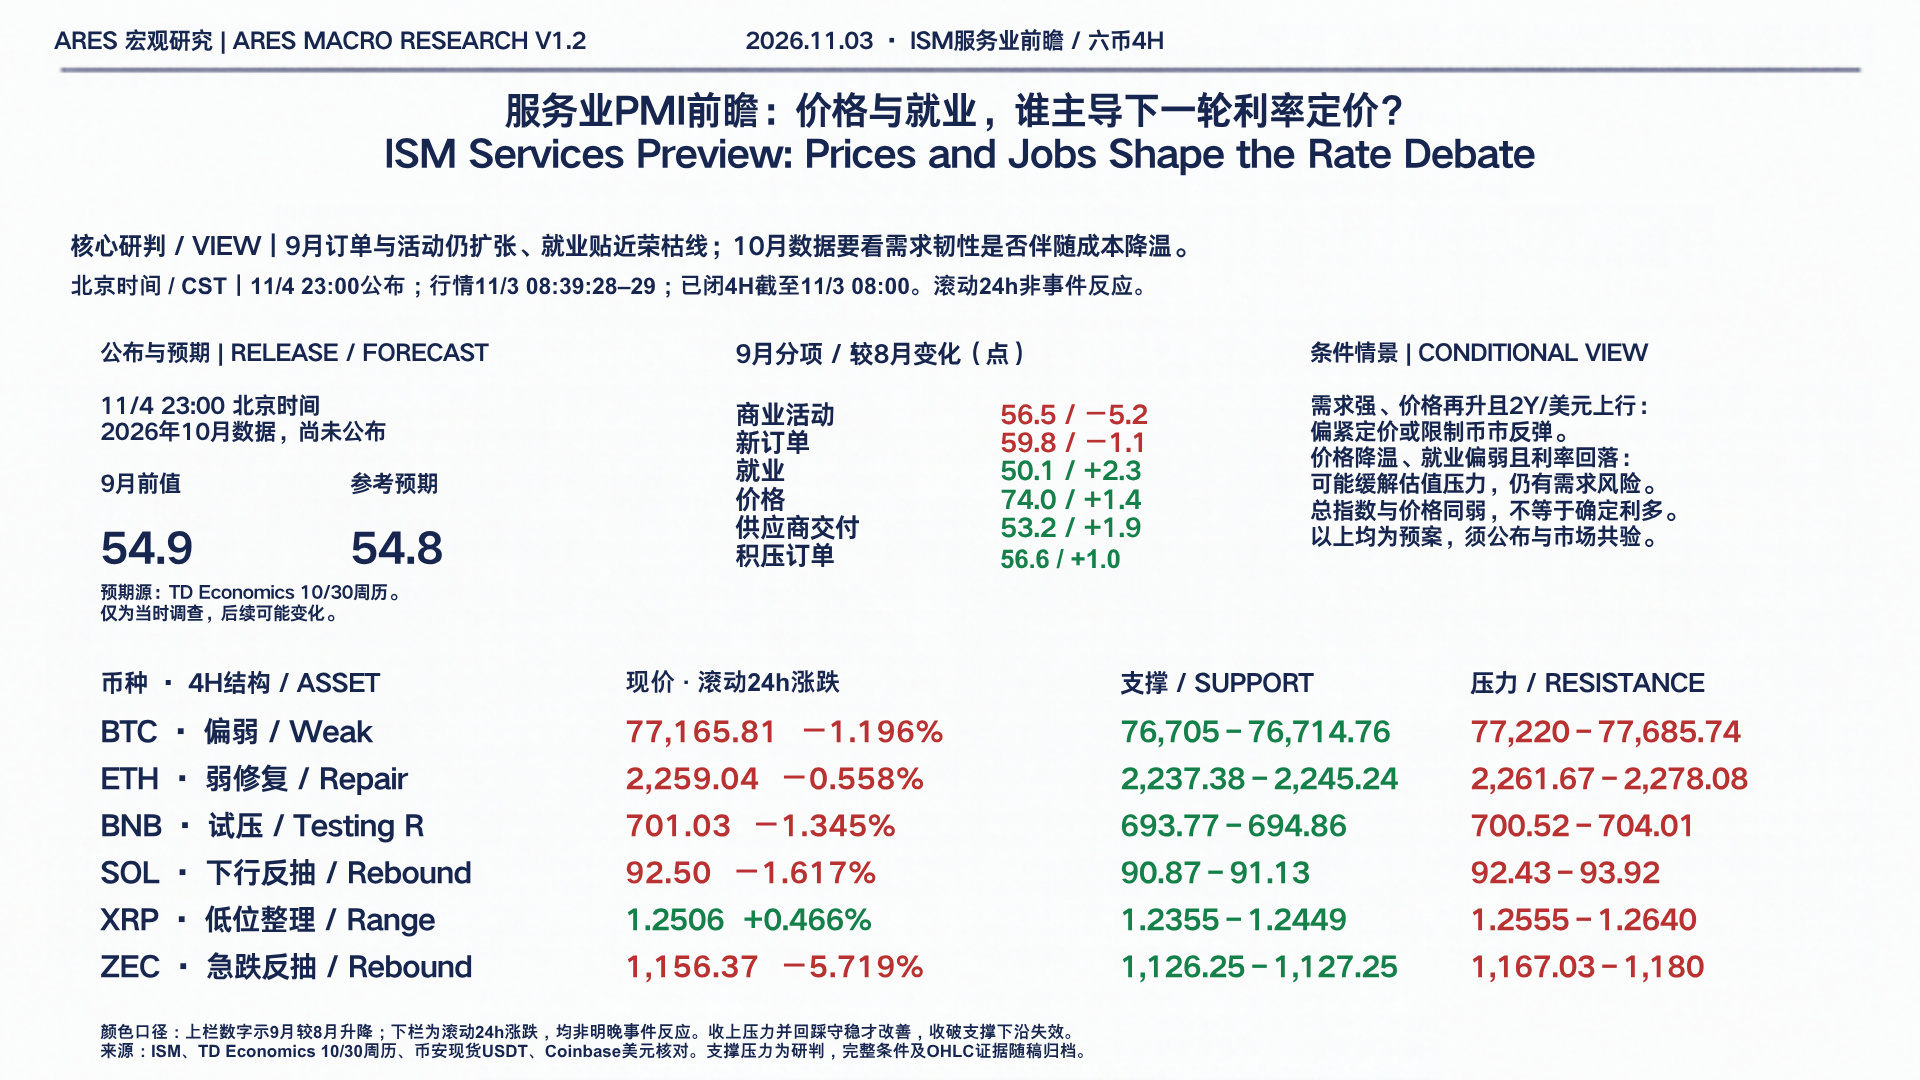
Services PMI at 23:00 tomorrow night: Will prices or employment drive the next round of rate pricing?The takeaway first: whether the headline index comes in above or below expectations alone is not enough to determine the crypto market’s direction. Tomorrow night, the key questions are whether demand can remain resilient, input costs can cool, and hiring will slip back into contraction. With crypto markets still structurally weak, softer data would not mean a rebound is confirmed.
【Event and facts】
At 23:00 Beijing time on November 4, ISM will release the October 2026 Services PMI, corresponding to 10:00 EST on November 4 in New York. The October actual reading has not yet been released.
The official September reading was 54.9, down 0.5 index points from 55.4 in August. Business activity was 56.5 (down 5.2 from August), new orders 59.8 (down 1.1), employment 50.1 (up 2.3), supplier deliveries 53.2 (up 1.9), prices 74.0 (up 1.4), and backlog of orders 56.6 (up 1.0). Demand is still expanding, but activity and orders are expanding more slowly. Employment has just returned to modest expansion, while cost pressures have spread further.
Services PMI at 23:00 tomorrow night: Will prices or employment drive the next round of rate pricing?
The takeaway first: whether the headline index comes in above or below expectations alone is not enough to determine the crypto market’s direction. Tomorrow night, the key questions are whether demand can remain resilient, input costs can cool, and hiring will slip back into contraction. With crypto markets still structurally weak, softer data would not mean a rebound is confirmed.
【Event and facts】
At 23:00 Beijing time on November 4, ISM will release the October 2026 Services PMI, corresponding to 10:00 EST on November 4 in New York. The October actual reading has not yet been released.
The official September reading was 54.9, down 0.5 index points from 55.4 in August. Business activity was 56.5 (down 5.2 from August), new orders 59.8 (down 1.1), employment 50.1 (up 2.3), supplier deliveries 53.2 (up 1.9), prices 74.0 (up 1.4), and backlog of orders 56.6 (up 1.0). Demand is still expanding, but activity and orders are expanding more slowly. Employment has just returned to modest expansion, while cost pressures have spread further.
【Event and facts】
At 23:00 Beijing time on November 4, ISM will release the October 2026 Services PMI, corresponding to 10:00 EST on November 4 in New York. The October actual reading has not yet been released.
The official September reading was 54.9, down 0.5 index points from 55.4 in August. Business activity was 56.5 (down 5.2 from August), new orders 59.8 (down 1.1), employment 50.1 (up 2.3), supplier deliveries 53.2 (up 1.9), prices 74.0 (up 1.4), and backlog of orders 56.6 (up 1.0). Demand is still expanding, but activity and orders are expanding more slowly. Employment has just returned to modest expansion, while cost pressures have spread further.
365
·
--
Verified
ISM Manufacturing Rises to 55.5: Six Coins Give Back Gains—Can Key Support Hold?
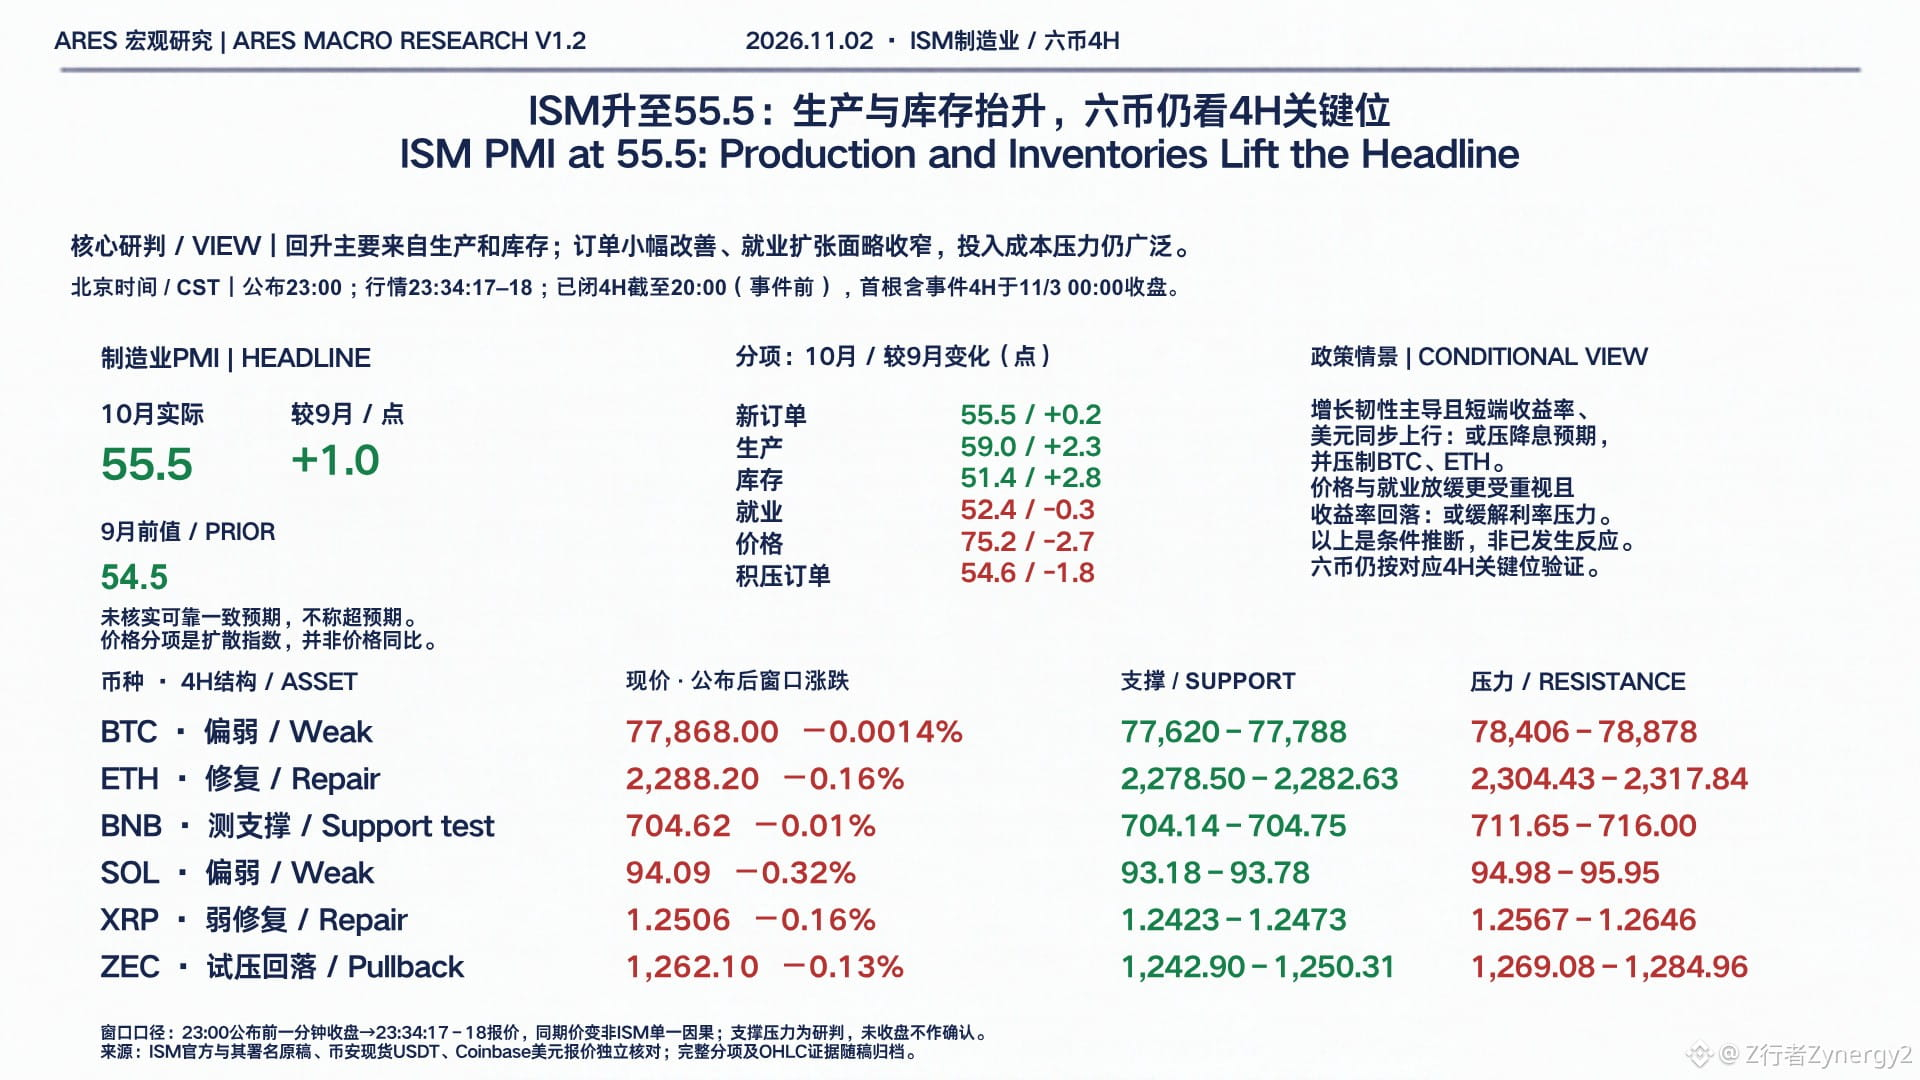
The October 2026 ISM Manufacturing report, released at 23:00 Beijing time on November 2, showed a PMI of 55.5, up 1.0 index point from 54.5 in September. The September figures in the official October table match those in the original September report item by item; no separate announcement of revisions to the prior figures was found for this release. A reliable consensus forecast has not been verified, so the result is not described as “above expectations” simply because it exceeded the prior reading.
Full component breakdown (October / September / change, with changes in index points):
New Orders 55.5 / 55.3 / +0.2;
Production 59.0 / 56.7 / +2.3;
Employment 52.4 / 52.7 / −0.3;
Supplier Deliveries 59.1 / 59.0 / +0.1;
Inventories 51.4 / 48.6 / +2.8;
Customers’ Inventories 41.6 / 41.6 / 0.0;
Prices 75.2 / 77.9 / −2.7;
Backlog of Orders 54.6 / 56.4 / −1.8;
New Export Orders 51.2 / 50.9 / +0.3;
Imports 52.9 / 51.0 / +1.9.
My assessment: Growth resilience has strengthened, but the improvement was not broad-based. The PMI is an equally weighted composite of five components: New Orders, Production, Employment, Supplier Deliveries, and Inventories. Production and Inventories were the main drivers of this month’s rise. Orders improved only slightly, while Backlog of Orders declined. Although the Employment index fell, it remained above 50, indicating a slight narrowing in the breadth of employment growth—not a decline in the number of jobs.
The Prices index fell from 77.9 to 75.2, indicating that price increases became somewhat less widespread, but pressure from input costs remains broad. A reading of 75.2 is not the year-over-year rate of price increases. The rise in the Supplier Deliveries index means deliveries are slower, and should not be interpreted solely as a measure of demand strength. Growth and cost signals coexist, and a single PMI report is not enough to infer the Federal Reserve’s next interest-rate move. This report has not verified the immediate response in U.S. Treasuries or the dollar, and does not claim that the market has already repriced policy.
Conditional analysis: If growth resilience drives pricing, and short-term Treasury yields and the dollar rise together, this could curb expectations for rate cuts and weigh on BTC and ETH. If greater attention is paid to a slowdown in the Prices and Employment components, and yields fall, that could ease interest-rate pressure. These are conditional scenarios, not market reactions that have already occurred.
Crypto market watch: From the one-minute candle close before the release to 23:34:17–18, earlier modest gains had been given back. BTC was nearly flat, while the other five coins edged lower. ZEC had entered its resistance zone intraday but has since fallen below its lower boundary; XRP is also currently below its first resistance. BNB is testing the interior of the 704.14–704.75 support zone, with no 4H close below it so far. The closed 4H structures for BTC, BNB, and SOL remain weak, while ETH is undergoing a short-term recovery. Price changes over the same period cannot be attributed to the ISM report alone, and are not rolling 24-hour changes.
Fixed key 4H levels for six coins (Binance spot USDT):
①BTC: Current price 77,868.00, window change −0.0014% (nearly flat); support 77,620–77,788.07, resistance 78,405.66–78,878.01. The near-term structure would improve only if a 4H candle closes above 78,878.01 and a retest holds the resistance zone; a close below 77,620 invalidates the recovery scenario.
②ETH: Current price 2,288.20, window change −0.16%; support 2,278.50–2,282.63, resistance 2,304.43–2,317.84. A recovery would have grounds to continue only if a candle closes above 2,317.84 and holds on a retest; a close below 2,278.50 invalidates it.
③BNB: Current price 704.62, window change −0.01%; support 704.14–704.75, resistance 711.65–716.00. The structure would improve only if a candle closes above 716 and holds on a retest; a close below 704.14 invalidates near-term support.
④SOL: Current price 94.09, window change −0.32%; support 93.18–93.78, resistance 94.98–95.95. The resistance would count as reclaimed only if a candle closes above 95.95 and holds on a retest; a close below 93.18 would mean weakness is continuing.
⑤XRP: Current price 1.2506, window change −0.16%; support 1.2423–1.2473, resistance 1.2567–1.2646. Merely entering the resistance zone does not constitute a breakout; a candle must close above 1.2646 and hold on a retest. A close below 1.2423 invalidates the near-term recovery.
⑥ZEC: Current price 1,262.10, window change −0.13%; reaction zone 1,242.90–1,250.31, resistance 1,269.08–1,284.96. It entered the resistance zone intraday but has since fallen below its lower boundary. The structure would improve only if a 4H candle closes above 1,284.96 and holds on a retest; a close below 1,242.90 invalidates it. The upper boundary of the reaction zone is the most recent closed 4H candle’s closing price; this is not described as a confirmed double bottom.
The market snapshot is from 23:34:17–18 Beijing time; the window’s baseline is the close of the 22:59 one-minute candle. The 4H structure consistently uses candles closed through 20:00 and therefore reflects the pre-event structure; the first 4H candle containing the event closes at 00:00 on November 3. Daily data uses closed candles only. Key levels and conditional trend scenarios are analytical judgments, not definitive trading instructions.
Sources: Official ISM October report https://www.ismworld.org/supply-management-news-and-reports/reports/ism-pmi-reports/pmi/october/ ; original September report https://www.ismworld.org/supply-management-news-and-reports/reports/ism-pmi-reports/pmi/september/ ; ISM-attributed original release https://www.prnewswire.com/news-releases/manufacturing-pmi-at-55-5-october-2026-ism-manufacturing-pmi-report-302925617.html ; Binance spot USDT, with Coinbase USD quotes used only as an independent reasonableness check.
ISM Manufacturing Rises to 55.5: Six Coins Give Back Gains—Can Key Support Hold?
The October 2026 ISM Manufacturing report, released at 23:00 Beijing time on November 2, showed a PMI of 55.5, up 1.0 index point from 54.5 in September. The September figures in the official October table match those in the original September report item by item; no separate announcement of revisions to the prior figures was found for this release. A reliable consensus forecast has not been verified, so the result is not described as “above expectations” simply because it exceeded the prior reading.
Full component breakdown (October / September / change, with changes in index points):
New Orders 55.5 / 55.3 / +0.2;
Production 59.0 / 56.7 / +2.3;
Employment 52.4 / 52.7 / −0.3;
Supplier Deliveries 59.1 / 59.0 / +0.1;
Inventories 51.4 / 48.6 / +2.8;
Customers’ Inventories 41.6 / 41.6 / 0.0;
Prices 75.2 / 77.9 / −2.7;
Backlog of Orders 54.6 / 56.4 / −1.8;
New Export Orders 51.2 / 50.9 / +0.3;
Imports 52.9 / 51.0 / +1.9.
My assessment: Growth resilience has strengthened, but the improvement was not broad-based. The PMI is an equally weighted composite of five components: New Orders, Production, Employment, Supplier Deliveries, and Inventories. Production and Inventories were the main drivers of this month’s rise. Orders improved only slightly, while Backlog of Orders declined. Although the Employment index fell, it remained above 50, indicating a slight narrowing in the breadth of employment growth—not a decline in the number of jobs.
The Prices index fell from 77.9 to 75.2, indicating that price increases became somewhat less widespread, but pressure from input costs remains broad. A reading of 75.2 is not the year-over-year rate of price increases. The rise in the Supplier Deliveries index means deliveries are slower, and should not be interpreted solely as a measure of demand strength. Growth and cost signals coexist, and a single PMI report is not enough to infer the Federal Reserve’s next interest-rate move. This report has not verified the immediate response in U.S. Treasuries or the dollar, and does not claim that the market has already repriced policy.
Conditional analysis: If growth resilience drives pricing, and short-term Treasury yields and the dollar rise together, this could curb expectations for rate cuts and weigh on BTC and ETH. If greater attention is paid to a slowdown in the Prices and Employment components, and yields fall, that could ease interest-rate pressure. These are conditional scenarios, not market reactions that have already occurred.
Crypto market watch: From the one-minute candle close before the release to 23:34:17–18, earlier modest gains had been given back. BTC was nearly flat, while the other five coins edged lower. ZEC had entered its resistance zone intraday but has since fallen below its lower boundary; XRP is also currently below its first resistance. BNB is testing the interior of the 704.14–704.75 support zone, with no 4H close below it so far. The closed 4H structures for BTC, BNB, and SOL remain weak, while ETH is undergoing a short-term recovery. Price changes over the same period cannot be attributed to the ISM report alone, and are not rolling 24-hour changes.
Fixed key 4H levels for six coins (Binance spot USDT):
①BTC: Current price 77,868.00, window change −0.0014% (nearly flat); support 77,620–77,788.07, resistance 78,405.66–78,878.01. The near-term structure would improve only if a 4H candle closes above 78,878.01 and a retest holds the resistance zone; a close below 77,620 invalidates the recovery scenario.
②ETH: Current price 2,288.20, window change −0.16%; support 2,278.50–2,282.63, resistance 2,304.43–2,317.84. A recovery would have grounds to continue only if a candle closes above 2,317.84 and holds on a retest; a close below 2,278.50 invalidates it.
③BNB: Current price 704.62, window change −0.01%; support 704.14–704.75, resistance 711.65–716.00. The structure would improve only if a candle closes above 716 and holds on a retest; a close below 704.14 invalidates near-term support.
④SOL: Current price 94.09, window change −0.32%; support 93.18–93.78, resistance 94.98–95.95. The resistance would count as reclaimed only if a candle closes above 95.95 and holds on a retest; a close below 93.18 would mean weakness is continuing.
⑤XRP: Current price 1.2506, window change −0.16%; support 1.2423–1.2473, resistance 1.2567–1.2646. Merely entering the resistance zone does not constitute a breakout; a candle must close above 1.2646 and hold on a retest. A close below 1.2423 invalidates the near-term recovery.
⑥ZEC: Current price 1,262.10, window change −0.13%; reaction zone 1,242.90–1,250.31, resistance 1,269.08–1,284.96. It entered the resistance zone intraday but has since fallen below its lower boundary. The structure would improve only if a 4H candle closes above 1,284.96 and holds on a retest; a close below 1,242.90 invalidates it. The upper boundary of the reaction zone is the most recent closed 4H candle’s closing price; this is not described as a confirmed double bottom.
The market snapshot is from 23:34:17–18 Beijing time; the window’s baseline is the close of the 22:59 one-minute candle. The 4H structure consistently uses candles closed through 20:00 and therefore reflects the pre-event structure; the first 4H candle containing the event closes at 00:00 on November 3. Daily data uses closed candles only. Key levels and conditional trend scenarios are analytical judgments, not definitive trading instructions.
Sources: Official ISM October report https://www.ismworld.org/supply-management-news-and-reports/reports/ism-pmi-reports/pmi/october/ ; original September report https://www.ismworld.org/supply-management-news-and-reports/reports/ism-pmi-reports/pmi/september/ ; ISM-attributed original release https://www.prnewswire.com/news-releases/manufacturing-pmi-at-55-5-october-2026-ism-manufacturing-pmi-report-302925617.html ; Binance spot USDT, with Coinbase USD quotes used only as an independent reasonableness check.
The October 2026 ISM Manufacturing report, released at 23:00 Beijing time on November 2, showed a PMI of 55.5, up 1.0 index point from 54.5 in September. The September figures in the official October table match those in the original September report item by item; no separate announcement of revisions to the prior figures was found for this release. A reliable consensus forecast has not been verified, so the result is not described as “above expectations” simply because it exceeded the prior reading.
Full component breakdown (October / September / change, with changes in index points):
New Orders 55.5 / 55.3 / +0.2;
Production 59.0 / 56.7 / +2.3;
Employment 52.4 / 52.7 / −0.3;
Supplier Deliveries 59.1 / 59.0 / +0.1;
Inventories 51.4 / 48.6 / +2.8;
Customers’ Inventories 41.6 / 41.6 / 0.0;
Prices 75.2 / 77.9 / −2.7;
Backlog of Orders 54.6 / 56.4 / −1.8;
New Export Orders 51.2 / 50.9 / +0.3;
Imports 52.9 / 51.0 / +1.9.
My assessment: Growth resilience has strengthened, but the improvement was not broad-based. The PMI is an equally weighted composite of five components: New Orders, Production, Employment, Supplier Deliveries, and Inventories. Production and Inventories were the main drivers of this month’s rise. Orders improved only slightly, while Backlog of Orders declined. Although the Employment index fell, it remained above 50, indicating a slight narrowing in the breadth of employment growth—not a decline in the number of jobs.
The Prices index fell from 77.9 to 75.2, indicating that price increases became somewhat less widespread, but pressure from input costs remains broad. A reading of 75.2 is not the year-over-year rate of price increases. The rise in the Supplier Deliveries index means deliveries are slower, and should not be interpreted solely as a measure of demand strength. Growth and cost signals coexist, and a single PMI report is not enough to infer the Federal Reserve’s next interest-rate move. This report has not verified the immediate response in U.S. Treasuries or the dollar, and does not claim that the market has already repriced policy.
Conditional analysis: If growth resilience drives pricing, and short-term Treasury yields and the dollar rise together, this could curb expectations for rate cuts and weigh on BTC and ETH. If greater attention is paid to a slowdown in the Prices and Employment components, and yields fall, that could ease interest-rate pressure. These are conditional scenarios, not market reactions that have already occurred.
Crypto market watch: From the one-minute candle close before the release to 23:34:17–18, earlier modest gains had been given back. BTC was nearly flat, while the other five coins edged lower. ZEC had entered its resistance zone intraday but has since fallen below its lower boundary; XRP is also currently below its first resistance. BNB is testing the interior of the 704.14–704.75 support zone, with no 4H close below it so far. The closed 4H structures for BTC, BNB, and SOL remain weak, while ETH is undergoing a short-term recovery. Price changes over the same period cannot be attributed to the ISM report alone, and are not rolling 24-hour changes.
Fixed key 4H levels for six coins (Binance spot USDT):
①BTC: Current price 77,868.00, window change −0.0014% (nearly flat); support 77,620–77,788.07, resistance 78,405.66–78,878.01. The near-term structure would improve only if a 4H candle closes above 78,878.01 and a retest holds the resistance zone; a close below 77,620 invalidates the recovery scenario.
②ETH: Current price 2,288.20, window change −0.16%; support 2,278.50–2,282.63, resistance 2,304.43–2,317.84. A recovery would have grounds to continue only if a candle closes above 2,317.84 and holds on a retest; a close below 2,278.50 invalidates it.
③BNB: Current price 704.62, window change −0.01%; support 704.14–704.75, resistance 711.65–716.00. The structure would improve only if a candle closes above 716 and holds on a retest; a close below 704.14 invalidates near-term support.
④SOL: Current price 94.09, window change −0.32%; support 93.18–93.78, resistance 94.98–95.95. The resistance would count as reclaimed only if a candle closes above 95.95 and holds on a retest; a close below 93.18 would mean weakness is continuing.
⑤XRP: Current price 1.2506, window change −0.16%; support 1.2423–1.2473, resistance 1.2567–1.2646. Merely entering the resistance zone does not constitute a breakout; a candle must close above 1.2646 and hold on a retest. A close below 1.2423 invalidates the near-term recovery.
⑥ZEC: Current price 1,262.10, window change −0.13%; reaction zone 1,242.90–1,250.31, resistance 1,269.08–1,284.96. It entered the resistance zone intraday but has since fallen below its lower boundary. The structure would improve only if a 4H candle closes above 1,284.96 and holds on a retest; a close below 1,242.90 invalidates it. The upper boundary of the reaction zone is the most recent closed 4H candle’s closing price; this is not described as a confirmed double bottom.
The market snapshot is from 23:34:17–18 Beijing time; the window’s baseline is the close of the 22:59 one-minute candle. The 4H structure consistently uses candles closed through 20:00 and therefore reflects the pre-event structure; the first 4H candle containing the event closes at 00:00 on November 3. Daily data uses closed candles only. Key levels and conditional trend scenarios are analytical judgments, not definitive trading instructions.
Sources: Official ISM October report https://www.ismworld.org/supply-management-news-and-reports/reports/ism-pmi-reports/pmi/october/ ; original September report https://www.ismworld.org/supply-management-news-and-reports/reports/ism-pmi-reports/pmi/september/ ; ISM-attributed original release https://www.prnewswire.com/news-releases/manufacturing-pmi-at-55-5-october-2026-ism-manufacturing-pmi-report-302925617.html ; Binance spot USDT, with Coinbase USD quotes used only as an independent reasonableness check.
592
·
--
Before the U.S. stock market opens, which of the top six by trading volume are recovering, and which remain weak?
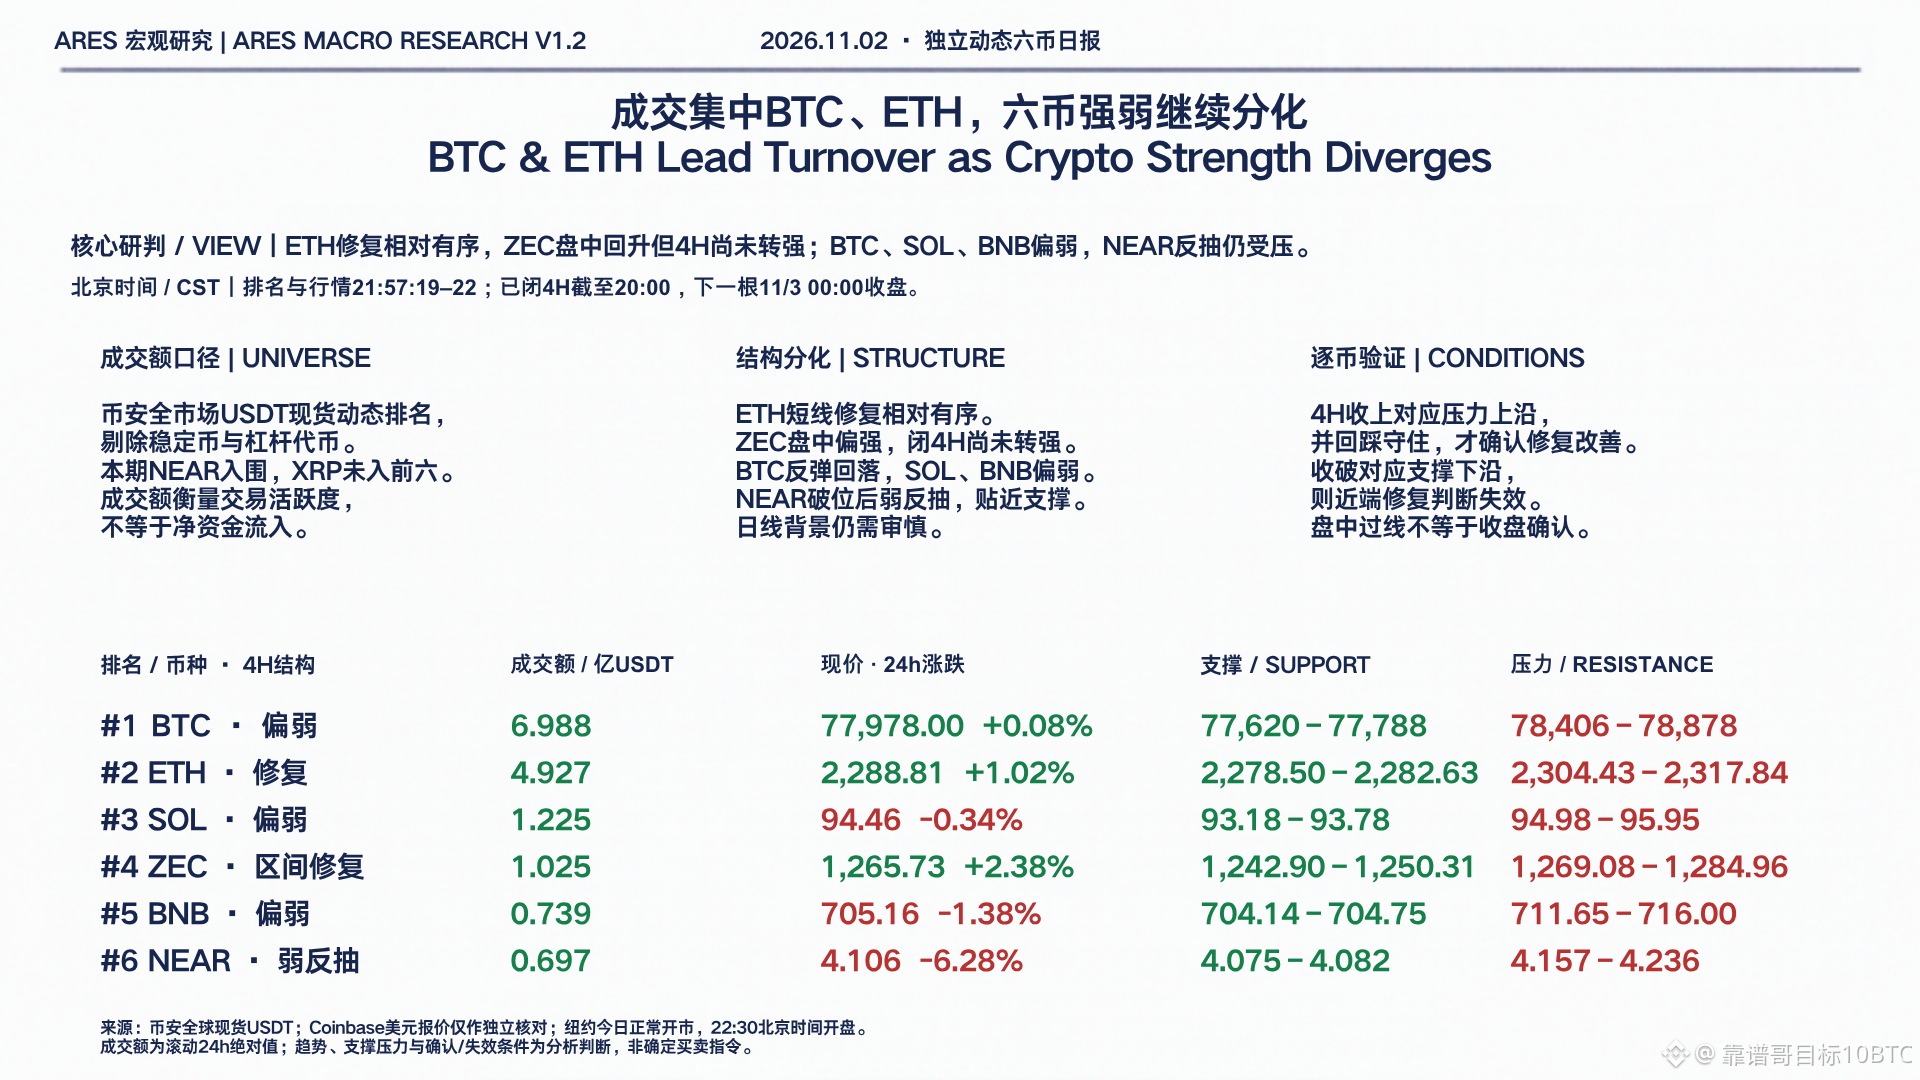
This edition dynamically selects the top six by rolling 24-hour trading volume on Binance Global USDT spot markets, excluding stablecoins and leveraged tokens. The six, in order, are BTC, ETH, SOL, ZEC, BNB, and NEAR. XRP did not make the top six this time; the list is determined by each asset’s ranking across the full market at the time of screening.
In the latest snapshot, BTC and ETH together account for about 76.37% of the trading volume among these six coins. Trading activity remains concentrated in the two major coins, but this interest has not translated into a broad-based rally: ETH’s short-term recovery is relatively orderly; ZEC rebounded intraday, but its two most recent closed 4H candles are still declining; BTC, SOL, and BNB have weak structures, while NEAR remains a weak rebound after breaking down. Trading volume is not the same as net capital inflows.
4H outlook for the six coins (all quoted in USDT):
① BTC: Support at 77,620–77,788.07; resistance at 78,405.66–78,878.01. The near-term structure would improve only if a 4H candle closes above 78,878.01 and a retest holds the resistance zone; a close below 77,620 would invalidate the rebound-recovery view.
② ETH: Support at 2,278.50–2,282.63; resistance at 2,304.43–2,317.84. The recovery would have a basis for continuation only if a candle closes above 2,317.84 and holds on a retest; a close below 2,278.50 would invalidate it.
③ SOL: Support at 93.18–93.78; resistance at 94.98–95.95. It would count as reclaiming resistance only if a candle closes above 95.95 and holds on a retest; a close below 93.18 would mean weakness continues.
④ ZEC: Reaction zone at 1,242.90–1,250.31; resistance at 1,269.08–1,284.96. Moving above 1,269.08 intraday merely means entering the resistance zone; the outlook would improve only if a 4H candle closes above 1,284.96 and holds on a retest. A close below 1,242.90 would invalidate the near-term recovery. The upper boundary of the reaction zone is the most recent closed 4H candle’s closing price; this is not being described as a confirmed double bottom.
⑤ BNB: Support at 704.14–704.75; resistance at 711.65–716.00. The outlook would improve only if a candle closes above 716 and holds on a retest; a close below 704.14 would invalidate near-term support.
⑥ NEAR: Support at 4.075–4.082; resistance at 4.157–4.236. The weak-rebound structure would improve only if price reclaims 4.236 and holds on a retest; a close below 4.075 would invalidate it. The next historical pivot level is 3.909.
All coin-by-coin confirmations above are conditional on a 4H close and a subsequent retest. An intraday break of a level does not count as confirmation, and none of this constitutes a definitive buy or sell instruction.
Data timestamp: Rankings and market data as of November 2, Beijing time, 21:57:19–22. The complete original ranking and verification of the sixth-place cutoff classification have been archived. The latest fully closed 4H candles are uniformly as of 20:00; the next candle closes at 00:00 on November 3. Daily-chart context uses closed-candle data only. Trading volume is rolling 24-hour volume, not volume during the U.S. stock market session that day.
The NYSE is open for normal trading today, with the regular session opening at 22:30 Beijing time.
Sources: Binance Global USDT spot; Coinbase USD quotes used only as an independent reasonableness check; official NYSE trading calendar.
Before the U.S. stock market opens, which of the top six by trading volume are recovering, and which remain weak?
This edition dynamically selects the top six by rolling 24-hour trading volume on Binance Global USDT spot markets, excluding stablecoins and leveraged tokens. The six, in order, are BTC, ETH, SOL, ZEC, BNB, and NEAR. XRP did not make the top six this time; the list is determined by each asset’s ranking across the full market at the time of screening.
In the latest snapshot, BTC and ETH together account for about 76.37% of the trading volume among these six coins. Trading activity remains concentrated in the two major coins, but this interest has not translated into a broad-based rally: ETH’s short-term recovery is relatively orderly; ZEC rebounded intraday, but its two most recent closed 4H candles are still declining; BTC, SOL, and BNB have weak structures, while NEAR remains a weak rebound after breaking down. Trading volume is not the same as net capital inflows.
4H outlook for the six coins (all quoted in USDT):
① BTC: Support at 77,620–77,788.07; resistance at 78,405.66–78,878.01. The near-term structure would improve only if a 4H candle closes above 78,878.01 and a retest holds the resistance zone; a close below 77,620 would invalidate the rebound-recovery view.
② ETH: Support at 2,278.50–2,282.63; resistance at 2,304.43–2,317.84. The recovery would have a basis for continuation only if a candle closes above 2,317.84 and holds on a retest; a close below 2,278.50 would invalidate it.
③ SOL: Support at 93.18–93.78; resistance at 94.98–95.95. It would count as reclaiming resistance only if a candle closes above 95.95 and holds on a retest; a close below 93.18 would mean weakness continues.
④ ZEC: Reaction zone at 1,242.90–1,250.31; resistance at 1,269.08–1,284.96. Moving above 1,269.08 intraday merely means entering the resistance zone; the outlook would improve only if a 4H candle closes above 1,284.96 and holds on a retest. A close below 1,242.90 would invalidate the near-term recovery. The upper boundary of the reaction zone is the most recent closed 4H candle’s closing price; this is not being described as a confirmed double bottom.
⑤ BNB: Support at 704.14–704.75; resistance at 711.65–716.00. The outlook would improve only if a candle closes above 716 and holds on a retest; a close below 704.14 would invalidate near-term support.
⑥ NEAR: Support at 4.075–4.082; resistance at 4.157–4.236. The weak-rebound structure would improve only if price reclaims 4.236 and holds on a retest; a close below 4.075 would invalidate it. The next historical pivot level is 3.909.
All coin-by-coin confirmations above are conditional on a 4H close and a subsequent retest. An intraday break of a level does not count as confirmation, and none of this constitutes a definitive buy or sell instruction.
Data timestamp: Rankings and market data as of November 2, Beijing time, 21:57:19–22. The complete original ranking and verification of the sixth-place cutoff classification have been archived. The latest fully closed 4H candles are uniformly as of 20:00; the next candle closes at 00:00 on November 3. Daily-chart context uses closed-candle data only. Trading volume is rolling 24-hour volume, not volume during the U.S. stock market session that day.
The NYSE is open for normal trading today, with the regular session opening at 22:30 Beijing time.
Sources: Binance Global USDT spot; Coinbase USD quotes used only as an independent reasonableness check; official NYSE trading calendar.
This edition dynamically selects the top six by rolling 24-hour trading volume on Binance Global USDT spot markets, excluding stablecoins and leveraged tokens. The six, in order, are BTC, ETH, SOL, ZEC, BNB, and NEAR. XRP did not make the top six this time; the list is determined by each asset’s ranking across the full market at the time of screening.
In the latest snapshot, BTC and ETH together account for about 76.37% of the trading volume among these six coins. Trading activity remains concentrated in the two major coins, but this interest has not translated into a broad-based rally: ETH’s short-term recovery is relatively orderly; ZEC rebounded intraday, but its two most recent closed 4H candles are still declining; BTC, SOL, and BNB have weak structures, while NEAR remains a weak rebound after breaking down. Trading volume is not the same as net capital inflows.
4H outlook for the six coins (all quoted in USDT):
① BTC: Support at 77,620–77,788.07; resistance at 78,405.66–78,878.01. The near-term structure would improve only if a 4H candle closes above 78,878.01 and a retest holds the resistance zone; a close below 77,620 would invalidate the rebound-recovery view.
② ETH: Support at 2,278.50–2,282.63; resistance at 2,304.43–2,317.84. The recovery would have a basis for continuation only if a candle closes above 2,317.84 and holds on a retest; a close below 2,278.50 would invalidate it.
③ SOL: Support at 93.18–93.78; resistance at 94.98–95.95. It would count as reclaiming resistance only if a candle closes above 95.95 and holds on a retest; a close below 93.18 would mean weakness continues.
④ ZEC: Reaction zone at 1,242.90–1,250.31; resistance at 1,269.08–1,284.96. Moving above 1,269.08 intraday merely means entering the resistance zone; the outlook would improve only if a 4H candle closes above 1,284.96 and holds on a retest. A close below 1,242.90 would invalidate the near-term recovery. The upper boundary of the reaction zone is the most recent closed 4H candle’s closing price; this is not being described as a confirmed double bottom.
⑤ BNB: Support at 704.14–704.75; resistance at 711.65–716.00. The outlook would improve only if a candle closes above 716 and holds on a retest; a close below 704.14 would invalidate near-term support.
⑥ NEAR: Support at 4.075–4.082; resistance at 4.157–4.236. The weak-rebound structure would improve only if price reclaims 4.236 and holds on a retest; a close below 4.075 would invalidate it. The next historical pivot level is 3.909.
All coin-by-coin confirmations above are conditional on a 4H close and a subsequent retest. An intraday break of a level does not count as confirmation, and none of this constitutes a definitive buy or sell instruction.
Data timestamp: Rankings and market data as of November 2, Beijing time, 21:57:19–22. The complete original ranking and verification of the sixth-place cutoff classification have been archived. The latest fully closed 4H candles are uniformly as of 20:00; the next candle closes at 00:00 on November 3. Daily-chart context uses closed-candle data only. Trading volume is rolling 24-hour volume, not volume during the U.S. stock market session that day.
The NYSE is open for normal trading today, with the regular session opening at 22:30 Beijing time.
Sources: Binance Global USDT spot; Coinbase USD quotes used only as an independent reasonableness check; official NYSE trading calendar.
2
1.4k
·
--
JOLTS Preview for Tomorrow Night: What to Watch Besides Job Openings?
[Known Data]
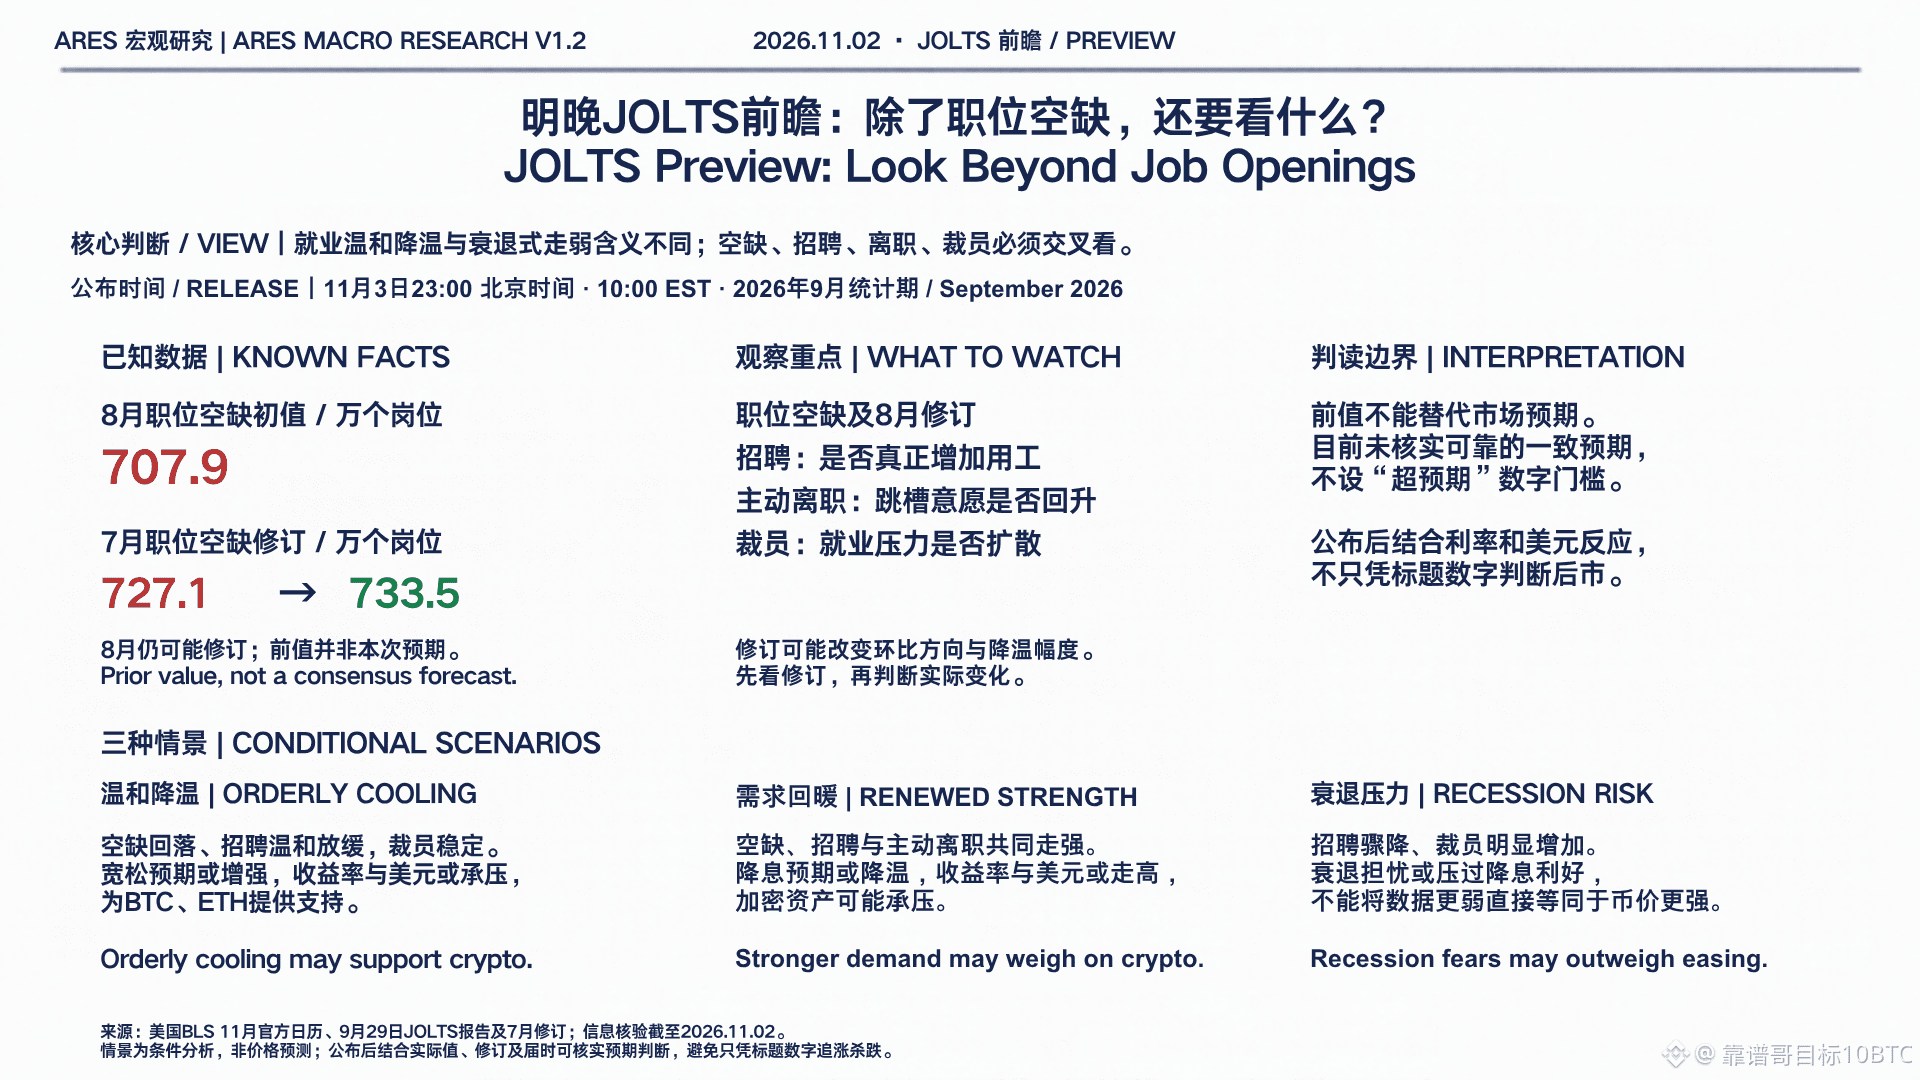
At 23:00 Beijing time on November 3, the U.S. will release the September 2026 JOLTS report. The preliminary August job openings figure was 7.079 million; July was revised up from 7.271 million to 7.335 million. The 7.079 million figure is the prior reading, not the market forecast for this release. No reliable consensus estimate has been verified, so no threshold for an “upside surprise” is being set.
[Key Things to Watch]
① Job openings and the August revision: Revisions could change the month-over-month direction and the extent of cooling.
② Hiring: Are businesses actually adding workers?
③ Quits: Is employees’ willingness to change jobs picking up again?
④ Layoffs: Is slowing labor demand spreading into employment pressures?
[Scenario Analysis]
If job openings decline and hiring slows moderately while layoffs remain stable, the market may grow more confident in expectations for looser monetary policy. Treasury yields and the dollar could come under pressure, supporting BTC and ETH.
If openings, hiring, and quits all strengthen, expectations for rate cuts may ease. Yields and the dollar could rise, putting pressure on crypto assets.
However, if hiring plunges and layoffs rise significantly, recession fears could outweigh the benefits of rate cuts. It should not be simplistically assumed that “the worse the data, the higher crypto prices will go.”
This is conditional analysis, not a price forecast. After the release, assess the results in light of revisions to prior readings, how the actual figures compare with market expectations that can be verified at the time, and the response of interest rates and the dollar. Avoid chasing rallies or selling off based only on headline figures.
Source: U.S. BLS, https://www.bls.gov/schedule/2026/11_sched.htm ; https://www.bls.gov/news.release/archives/jolts_09292026.htm . Information verified as of November 2, 2026.
JOLTS Preview for Tomorrow Night: What to Watch Besides Job Openings?
[Known Data]
At 23:00 Beijing time on November 3, the U.S. will release the September 2026 JOLTS report. The preliminary August job openings figure was 7.079 million; July was revised up from 7.271 million to 7.335 million. The 7.079 million figure is the prior reading, not the market forecast for this release. No reliable consensus estimate has been verified, so no threshold for an “upside surprise” is being set.
[Key Things to Watch]
① Job openings and the August revision: Revisions could change the month-over-month direction and the extent of cooling.
② Hiring: Are businesses actually adding workers?
③ Quits: Is employees’ willingness to change jobs picking up again?
④ Layoffs: Is slowing labor demand spreading into employment pressures?
[Scenario Analysis]
If job openings decline and hiring slows moderately while layoffs remain stable, the market may grow more confident in expectations for looser monetary policy. Treasury yields and the dollar could come under pressure, supporting BTC and ETH.
If openings, hiring, and quits all strengthen, expectations for rate cuts may ease. Yields and the dollar could rise, putting pressure on crypto assets.
However, if hiring plunges and layoffs rise significantly, recession fears could outweigh the benefits of rate cuts. It should not be simplistically assumed that “the worse the data, the higher crypto prices will go.”
This is conditional analysis, not a price forecast. After the release, assess the results in light of revisions to prior readings, how the actual figures compare with market expectations that can be verified at the time, and the response of interest rates and the dollar. Avoid chasing rallies or selling off based only on headline figures.
Source: U.S. BLS, https://www.bls.gov/schedule/2026/11_sched.htm ; https://www.bls.gov/news.release/archives/jolts_09292026.htm . Information verified as of November 2, 2026.
[Known Data]
At 23:00 Beijing time on November 3, the U.S. will release the September 2026 JOLTS report. The preliminary August job openings figure was 7.079 million; July was revised up from 7.271 million to 7.335 million. The 7.079 million figure is the prior reading, not the market forecast for this release. No reliable consensus estimate has been verified, so no threshold for an “upside surprise” is being set.
[Key Things to Watch]
① Job openings and the August revision: Revisions could change the month-over-month direction and the extent of cooling.
② Hiring: Are businesses actually adding workers?
③ Quits: Is employees’ willingness to change jobs picking up again?
④ Layoffs: Is slowing labor demand spreading into employment pressures?
[Scenario Analysis]
If job openings decline and hiring slows moderately while layoffs remain stable, the market may grow more confident in expectations for looser monetary policy. Treasury yields and the dollar could come under pressure, supporting BTC and ETH.
If openings, hiring, and quits all strengthen, expectations for rate cuts may ease. Yields and the dollar could rise, putting pressure on crypto assets.
However, if hiring plunges and layoffs rise significantly, recession fears could outweigh the benefits of rate cuts. It should not be simplistically assumed that “the worse the data, the higher crypto prices will go.”
This is conditional analysis, not a price forecast. After the release, assess the results in light of revisions to prior readings, how the actual figures compare with market expectations that can be verified at the time, and the response of interest rates and the dollar. Avoid chasing rallies or selling off based only on headline figures.
Source: U.S. BLS, https://www.bls.gov/schedule/2026/11_sched.htm ; https://www.bls.gov/news.release/archives/jolts_09292026.htm . Information verified as of November 2, 2026.
71
·
--
Binance says it has set aside over $6.34 billion. Can the six coins’ rebound hold?
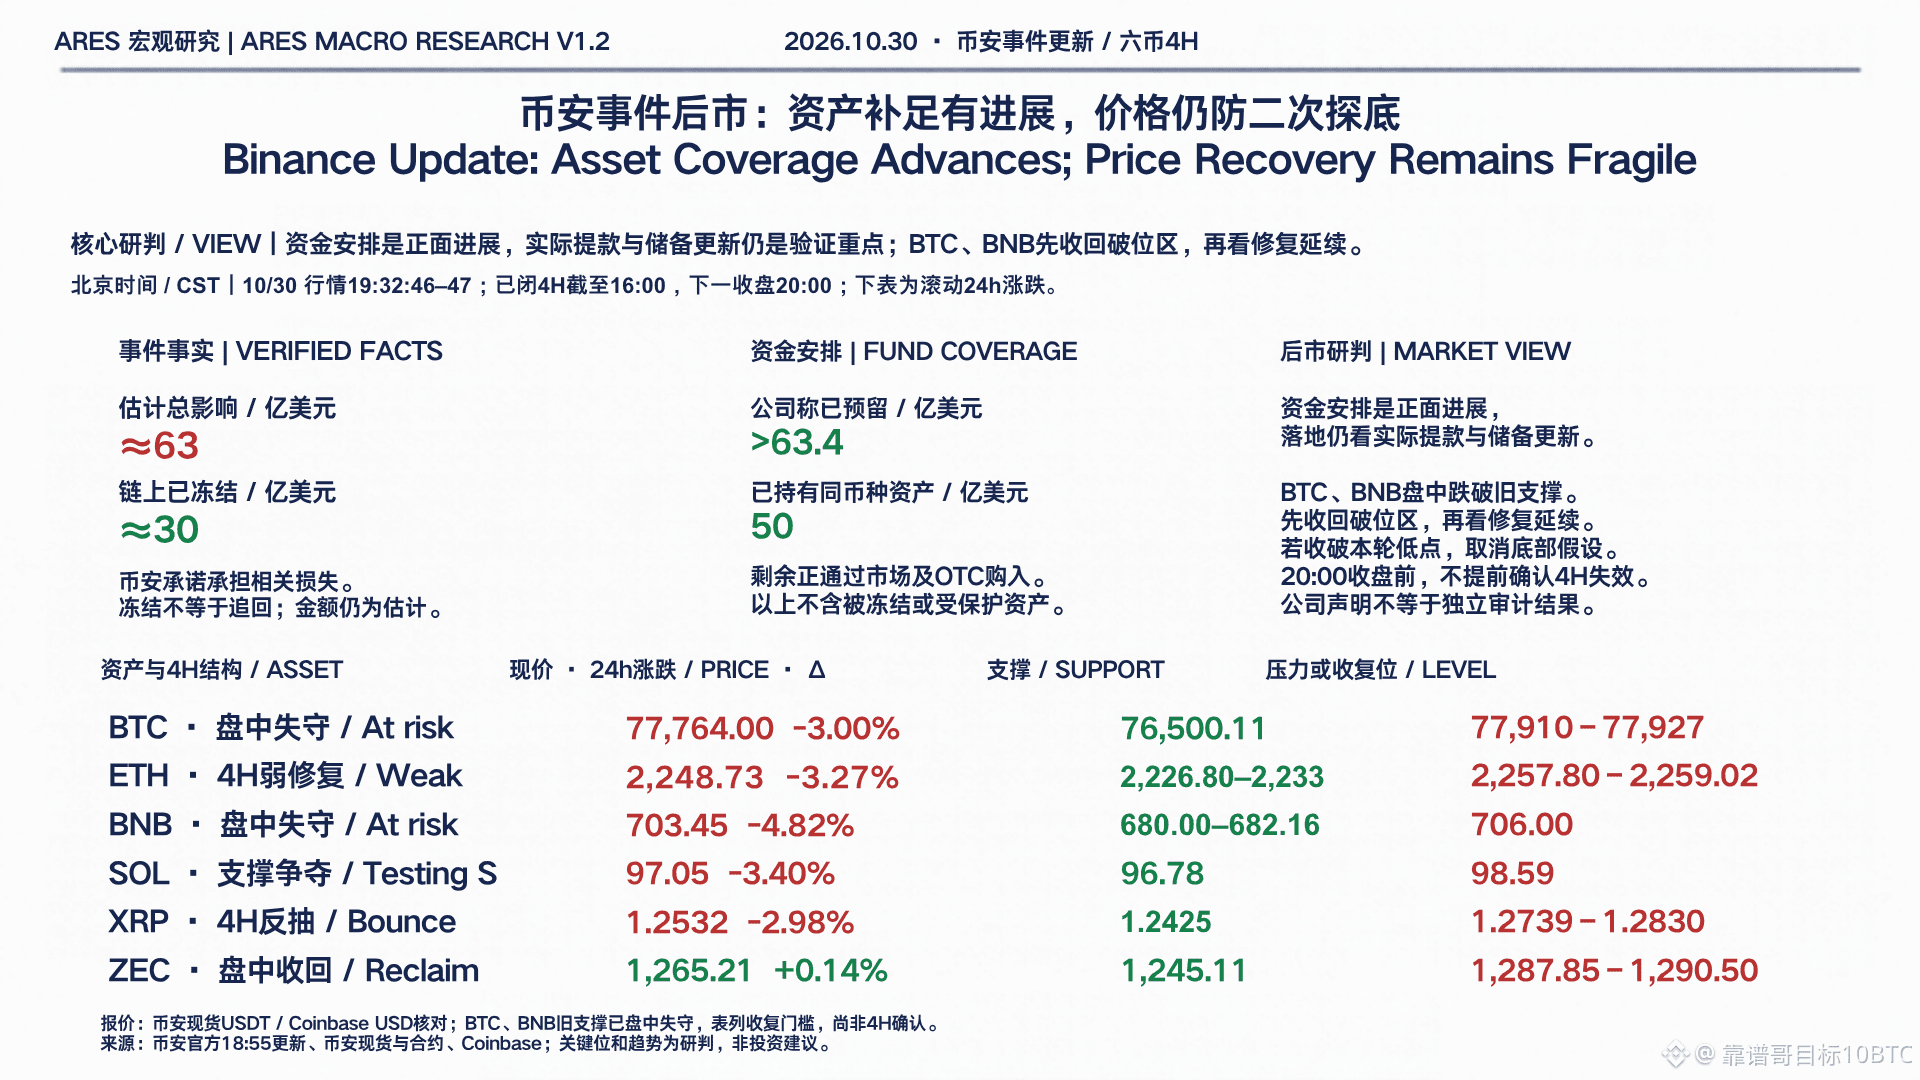
The official update at 18:55 brought a substantive development: Binance said it had set aside more than $6.34 billion in company funds, of which $5 billion is already held in affected assets in the same tokens. The remainder is being acquired through market and over-the-counter transactions. These funds do not include frozen or protected assets.
This improves expectations for loss coverage, but it remains a company disclosure and should not be treated as the conclusion of an independent audit. Nor does it mean compensation has been completed. Earlier estimates put the total impact at about $6.3 billion, with about $3 billion frozen; frozen does not mean recovered, and the two figures cannot simply be subtracted to arrive at a final net loss. The latest verified service update still says withdrawals are suspended. The next focus is the actual resumption of withdrawals and an updated proof of reserves.
My assessment: Setting aside funds is a positive development, but prices are still in a weak recovery phase. BTC and BNB fell below their original support levels intraday. First, watch whether they can reclaim those breakdown areas; if not, the rebound will remain under pressure from another test of the lows.
Key levels for six coins (Binance spot, USDT):
• BTC: 77,910–77,927 is the reclaim threshold. Only a 4H close above this range followed by a successful retest would put 78,804 in view; continued resistance points to 76,500.11.
• ETH: Support at 2,226.80–2,233; resistance at 2,257.80–2,259.02. A close below support points to 2,174.08; a close above resistance would open up recovery room toward 2,293–2,314.
• BNB: 706 is the first reclaim threshold. Only a reclaim and hold would put 720–722.08 in view; without a reclaim, first watch 698.46, then 680–682.16.
• SOL: 96.78 is the support line; 98.59 is the recovery threshold. A close below support points to 95 and 92.34; a close above resistance would put 99.26–99.94 in view.
• XRP: 1.2425 is support, and 1.2739–1.2830 is the resistance zone. The structure would improve only if a 4H candle closes above 1.2830 and holds on a retest; a close below support points to 1.2233 and 1.2002.
• ZEC: It has reclaimed 1,245.11 intraday, but remains below the 1,287.85–1,290.50 resistance zone. Only a sustained 4H move above resistance would put 1,308–1,329 in view; a close below support points to 1,223, then 1,207–1,180.
Open interest also offers no evidence that “leverage has been fully flushed out”: from October 29 at 20:00 to October 30 at 08:00 UTC, Binance USDT perpetual open interest, measured in units of the underlying coins, rose about 2.00% for BTC and fell about 0.31% for BNB. This reflects just one exchange and one contract basis, and cannot be used to determine the direction of new positions or the scale of liquidations across the entire market.
Market snapshot: October 30, 19:32:46–47 Beijing time. Current prices and rolling 24-hour changes are shown in the chart; those changes do not represent returns since the event occurred. The four-hour structure uses only candles closed by 16:00; the next candle closes at 20:00, and an intraday move through a key level does not constitute confirmation at the close. Key levels are analytical judgments, not investment advice.
Official fund update: https://x.com/binance/status/2116121748555153621
Official service update: https://x.com/binance/status/2116089661408108712
Market data: Binance spot and futures; Coinbase USD quotes used for independent cross-checking.
#币安 #BTC #BNB
Binance says it has set aside over $6.34 billion. Can the six coins’ rebound hold?
The official update at 18:55 brought a substantive development: Binance said it had set aside more than $6.34 billion in company funds, of which $5 billion is already held in affected assets in the same tokens. The remainder is being acquired through market and over-the-counter transactions. These funds do not include frozen or protected assets.
This improves expectations for loss coverage, but it remains a company disclosure and should not be treated as the conclusion of an independent audit. Nor does it mean compensation has been completed. Earlier estimates put the total impact at about $6.3 billion, with about $3 billion frozen; frozen does not mean recovered, and the two figures cannot simply be subtracted to arrive at a final net loss. The latest verified service update still says withdrawals are suspended. The next focus is the actual resumption of withdrawals and an updated proof of reserves.
My assessment: Setting aside funds is a positive development, but prices are still in a weak recovery phase. BTC and BNB fell below their original support levels intraday. First, watch whether they can reclaim those breakdown areas; if not, the rebound will remain under pressure from another test of the lows.
Key levels for six coins (Binance spot, USDT):
• BTC: 77,910–77,927 is the reclaim threshold. Only a 4H close above this range followed by a successful retest would put 78,804 in view; continued resistance points to 76,500.11.
• ETH: Support at 2,226.80–2,233; resistance at 2,257.80–2,259.02. A close below support points to 2,174.08; a close above resistance would open up recovery room toward 2,293–2,314.
• BNB: 706 is the first reclaim threshold. Only a reclaim and hold would put 720–722.08 in view; without a reclaim, first watch 698.46, then 680–682.16.
• SOL: 96.78 is the support line; 98.59 is the recovery threshold. A close below support points to 95 and 92.34; a close above resistance would put 99.26–99.94 in view.
• XRP: 1.2425 is support, and 1.2739–1.2830 is the resistance zone. The structure would improve only if a 4H candle closes above 1.2830 and holds on a retest; a close below support points to 1.2233 and 1.2002.
• ZEC: It has reclaimed 1,245.11 intraday, but remains below the 1,287.85–1,290.50 resistance zone. Only a sustained 4H move above resistance would put 1,308–1,329 in view; a close below support points to 1,223, then 1,207–1,180.
Open interest also offers no evidence that “leverage has been fully flushed out”: from October 29 at 20:00 to October 30 at 08:00 UTC, Binance USDT perpetual open interest, measured in units of the underlying coins, rose about 2.00% for BTC and fell about 0.31% for BNB. This reflects just one exchange and one contract basis, and cannot be used to determine the direction of new positions or the scale of liquidations across the entire market.
Market snapshot: October 30, 19:32:46–47 Beijing time. Current prices and rolling 24-hour changes are shown in the chart; those changes do not represent returns since the event occurred. The four-hour structure uses only candles closed by 16:00; the next candle closes at 20:00, and an intraday move through a key level does not constitute confirmation at the close. Key levels are analytical judgments, not investment advice.
Official fund update: https://x.com/binance/status/2116121748555153621
Official service update: https://x.com/binance/status/2116089661408108712
Market data: Binance spot and futures; Coinbase USD quotes used for independent cross-checking.
#币安 #BTC #BNB
The official update at 18:55 brought a substantive development: Binance said it had set aside more than $6.34 billion in company funds, of which $5 billion is already held in affected assets in the same tokens. The remainder is being acquired through market and over-the-counter transactions. These funds do not include frozen or protected assets.
This improves expectations for loss coverage, but it remains a company disclosure and should not be treated as the conclusion of an independent audit. Nor does it mean compensation has been completed. Earlier estimates put the total impact at about $6.3 billion, with about $3 billion frozen; frozen does not mean recovered, and the two figures cannot simply be subtracted to arrive at a final net loss. The latest verified service update still says withdrawals are suspended. The next focus is the actual resumption of withdrawals and an updated proof of reserves.
My assessment: Setting aside funds is a positive development, but prices are still in a weak recovery phase. BTC and BNB fell below their original support levels intraday. First, watch whether they can reclaim those breakdown areas; if not, the rebound will remain under pressure from another test of the lows.
Key levels for six coins (Binance spot, USDT):
• BTC: 77,910–77,927 is the reclaim threshold. Only a 4H close above this range followed by a successful retest would put 78,804 in view; continued resistance points to 76,500.11.
• ETH: Support at 2,226.80–2,233; resistance at 2,257.80–2,259.02. A close below support points to 2,174.08; a close above resistance would open up recovery room toward 2,293–2,314.
• BNB: 706 is the first reclaim threshold. Only a reclaim and hold would put 720–722.08 in view; without a reclaim, first watch 698.46, then 680–682.16.
• SOL: 96.78 is the support line; 98.59 is the recovery threshold. A close below support points to 95 and 92.34; a close above resistance would put 99.26–99.94 in view.
• XRP: 1.2425 is support, and 1.2739–1.2830 is the resistance zone. The structure would improve only if a 4H candle closes above 1.2830 and holds on a retest; a close below support points to 1.2233 and 1.2002.
• ZEC: It has reclaimed 1,245.11 intraday, but remains below the 1,287.85–1,290.50 resistance zone. Only a sustained 4H move above resistance would put 1,308–1,329 in view; a close below support points to 1,223, then 1,207–1,180.
Open interest also offers no evidence that “leverage has been fully flushed out”: from October 29 at 20:00 to October 30 at 08:00 UTC, Binance USDT perpetual open interest, measured in units of the underlying coins, rose about 2.00% for BTC and fell about 0.31% for BNB. This reflects just one exchange and one contract basis, and cannot be used to determine the direction of new positions or the scale of liquidations across the entire market.
Market snapshot: October 30, 19:32:46–47 Beijing time. Current prices and rolling 24-hour changes are shown in the chart; those changes do not represent returns since the event occurred. The four-hour structure uses only candles closed by 16:00; the next candle closes at 20:00, and an intraday move through a key level does not constitute confirmation at the close. Key levels are analytical judgments, not investment advice.
Official fund update: https://x.com/binance/status/2116121748555153621
Official service update: https://x.com/binance/status/2116089661408108712
Market data: Binance spot and futures; Coinbase USD quotes used for independent cross-checking.
#币安 #BTC #BNB
462
·
--
Verified
FOMC holds rates steady: Five coins rebound—who can break through resistance first?
The Fed kept the federal funds target rate at 3.75%–4.00%, with a 10–2 vote; Cook and Hammack favored a 25-basis-point hike. The statement noted that economic activity has been expanding at a solid pace, inflation remains elevated, job gains and labor supply have continued to move in tandem, and the unemployment rate has changed little. Holding rates steady does not necessarily mean a shift toward easing; that is our interpretation of the statement.
【Market snapshot | Beijing time 10/29 02:42:45–46】
The following are Binance spot USDT quotes; changes are relative to the 01:59 close before the decision, not 24-hour changes.
BTC 81,215.07, +0.44%
ETH 2,363.03, +0.77%
SOL 102.31, +0.63%
BNB 752.18, +0.37%
XRP 1.3311, +1.06%
【Four-hour structure and conditional outlook】
BTC: The rebound has yet to reclaim the 81,342–81,823 resistance zone; structural support below is 80,397.
ETH: Price has entered the 2,362–2,388 resistance zone. A four-hour close above it followed by a successful retest is needed to confirm that this zone has flipped from resistance to support; the original structural support is 2,323.20.
SOL: The rebound is recovering, but price still needs to reclaim 102.75–103.69; structural support below is 100.46.
BNB: Still within its range; support is 742–747, and resistance is 761.42–762.20. The current four-hour candle hit a low of 746.67 intraperiod, then rebounded after reaching the support zone.
XRP: Price has entered the 1.3251–1.3398 resistance zone; the current candle hit an intraperiod low of 1.3078, briefly fell below 1.3096, then recovered. It should not be described as having closed below that level on the four-hour chart. The next key development to watch is how price retests after breaking above resistance.
All five coins are up versus before the decision, and a rebound is underway. ETH and XRP have entered their prior resistance zones first, while BTC and SOL still need to reclaim key levels above. 04:00 Beijing time is the next four-hour close to watch. Reclaiming resistance and holding it on a retest would give the recovery room to continue; a close below support would invalidate the corresponding rebound outlook.
There is no new completed four-hour candle yet, so the original structural levels are not being moved around in response to minute-by-minute price changes. The support and resistance levels above are analytical reference points based on completed four-hour swing points and the daily chart context—not price targets that are guaranteed to be reached. Short-term price movements cannot be attributed to the FOMC alone. The policy section is based on the published statement and does not include the press conference.
Sources: Federal Reserve, Binance; cross-checked against Kraken USD quotes. Prices may differ across exchanges, quote currencies, and timestamps; they are not intended for precise return comparisons.
Fed statement: https://www.federalreserve.gov/newsevents/pressreleases/monetary20261028a.htm
Not investment advice.
Are you watching ETH and XRP break resistance, or waiting for BTC and SOL to follow?
#美联储 #BTC #Crypto Market
FOMC holds rates steady: Five coins rebound—who can break through resistance first?
The Fed kept the federal funds target rate at 3.75%–4.00%, with a 10–2 vote; Cook and Hammack favored a 25-basis-point hike. The statement noted that economic activity has been expanding at a solid pace, inflation remains elevated, job gains and labor supply have continued to move in tandem, and the unemployment rate has changed little. Holding rates steady does not necessarily mean a shift toward easing; that is our interpretation of the statement.
【Market snapshot | Beijing time 10/29 02:42:45–46】
The following are Binance spot USDT quotes; changes are relative to the 01:59 close before the decision, not 24-hour changes.
BTC 81,215.07, +0.44%
ETH 2,363.03, +0.77%
SOL 102.31, +0.63%
BNB 752.18, +0.37%
XRP 1.3311, +1.06%
【Four-hour structure and conditional outlook】
BTC: The rebound has yet to reclaim the 81,342–81,823 resistance zone; structural support below is 80,397.
ETH: Price has entered the 2,362–2,388 resistance zone. A four-hour close above it followed by a successful retest is needed to confirm that this zone has flipped from resistance to support; the original structural support is 2,323.20.
SOL: The rebound is recovering, but price still needs to reclaim 102.75–103.69; structural support below is 100.46.
BNB: Still within its range; support is 742–747, and resistance is 761.42–762.20. The current four-hour candle hit a low of 746.67 intraperiod, then rebounded after reaching the support zone.
XRP: Price has entered the 1.3251–1.3398 resistance zone; the current candle hit an intraperiod low of 1.3078, briefly fell below 1.3096, then recovered. It should not be described as having closed below that level on the four-hour chart. The next key development to watch is how price retests after breaking above resistance.
All five coins are up versus before the decision, and a rebound is underway. ETH and XRP have entered their prior resistance zones first, while BTC and SOL still need to reclaim key levels above. 04:00 Beijing time is the next four-hour close to watch. Reclaiming resistance and holding it on a retest would give the recovery room to continue; a close below support would invalidate the corresponding rebound outlook.
There is no new completed four-hour candle yet, so the original structural levels are not being moved around in response to minute-by-minute price changes. The support and resistance levels above are analytical reference points based on completed four-hour swing points and the daily chart context—not price targets that are guaranteed to be reached. Short-term price movements cannot be attributed to the FOMC alone. The policy section is based on the published statement and does not include the press conference.
Sources: Federal Reserve, Binance; cross-checked against Kraken USD quotes. Prices may differ across exchanges, quote currencies, and timestamps; they are not intended for precise return comparisons.
Fed statement: https://www.federalreserve.gov/newsevents/pressreleases/monetary20261028a.htm
Not investment advice.
Are you watching ETH and XRP break resistance, or waiting for BTC and SOL to follow?
#美联储 #BTC #Crypto Market
The Fed kept the federal funds target rate at 3.75%–4.00%, with a 10–2 vote; Cook and Hammack favored a 25-basis-point hike. The statement noted that economic activity has been expanding at a solid pace, inflation remains elevated, job gains and labor supply have continued to move in tandem, and the unemployment rate has changed little. Holding rates steady does not necessarily mean a shift toward easing; that is our interpretation of the statement.
【Market snapshot | Beijing time 10/29 02:42:45–46】
The following are Binance spot USDT quotes; changes are relative to the 01:59 close before the decision, not 24-hour changes.
BTC 81,215.07, +0.44%
ETH 2,363.03, +0.77%
SOL 102.31, +0.63%
BNB 752.18, +0.37%
XRP 1.3311, +1.06%
【Four-hour structure and conditional outlook】
BTC: The rebound has yet to reclaim the 81,342–81,823 resistance zone; structural support below is 80,397.
ETH: Price has entered the 2,362–2,388 resistance zone. A four-hour close above it followed by a successful retest is needed to confirm that this zone has flipped from resistance to support; the original structural support is 2,323.20.
SOL: The rebound is recovering, but price still needs to reclaim 102.75–103.69; structural support below is 100.46.
BNB: Still within its range; support is 742–747, and resistance is 761.42–762.20. The current four-hour candle hit a low of 746.67 intraperiod, then rebounded after reaching the support zone.
XRP: Price has entered the 1.3251–1.3398 resistance zone; the current candle hit an intraperiod low of 1.3078, briefly fell below 1.3096, then recovered. It should not be described as having closed below that level on the four-hour chart. The next key development to watch is how price retests after breaking above resistance.
All five coins are up versus before the decision, and a rebound is underway. ETH and XRP have entered their prior resistance zones first, while BTC and SOL still need to reclaim key levels above. 04:00 Beijing time is the next four-hour close to watch. Reclaiming resistance and holding it on a retest would give the recovery room to continue; a close below support would invalidate the corresponding rebound outlook.
There is no new completed four-hour candle yet, so the original structural levels are not being moved around in response to minute-by-minute price changes. The support and resistance levels above are analytical reference points based on completed four-hour swing points and the daily chart context—not price targets that are guaranteed to be reached. Short-term price movements cannot be attributed to the FOMC alone. The policy section is based on the published statement and does not include the press conference.
Sources: Federal Reserve, Binance; cross-checked against Kraken USD quotes. Prices may differ across exchanges, quote currencies, and timestamps; they are not intended for precise return comparisons.
Fed statement: https://www.federalreserve.gov/newsevents/pressreleases/monetary20261028a.htm
Not investment advice.
Are you watching ETH and XRP break resistance, or waiting for BTC and SOL to follow?
#美联储 #BTC #Crypto Market
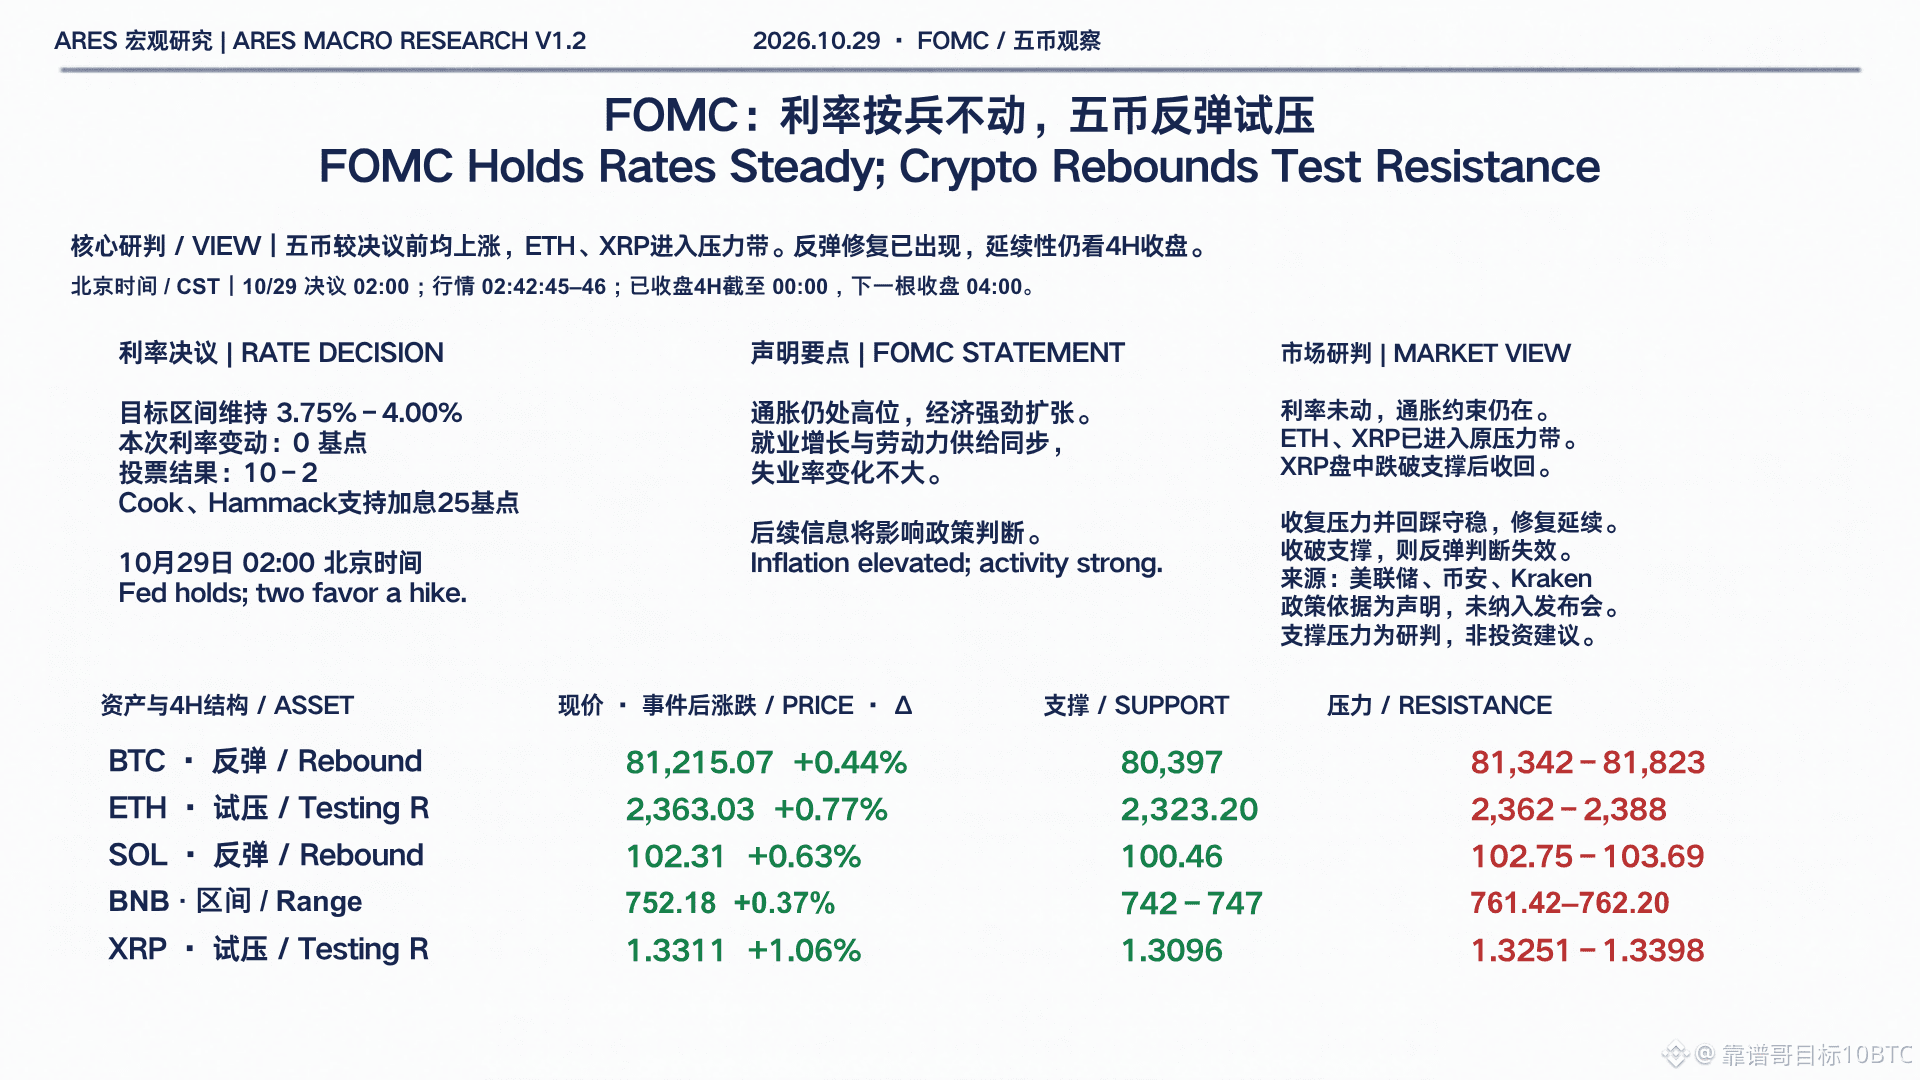
1
1.9k
·
--
Anthropic’s IPO: Are you buying the company’s value, or the price others may be willing to pay in the future?
Keynes’s “beauty contest” theory is fascinating when applied to AI valuations today: we’re judging the company while also guessing how others will judge it.
My take: revenue growth is worth watching, but ultimately, it comes down to whether profits materialize. Even with a great company, it’s worth asking: Is it worth this price?
#Anthropic #AI #IPO
Anthropic’s IPO: Are you buying the company’s value, or the price others may be willing to pay in the future?
Keynes’s “beauty contest” theory is fascinating when applied to AI valuations today: we’re judging the company while also guessing how others will judge it.
My take: revenue growth is worth watching, but ultimately, it comes down to whether profits materialize. Even with a great company, it’s worth asking: Is it worth this price?
#Anthropic #AI #IPO
Keynes’s “beauty contest” theory is fascinating when applied to AI valuations today: we’re judging the company while also guessing how others will judge it.
My take: revenue growth is worth watching, but ultimately, it comes down to whether profits materialize. Even with a great company, it’s worth asking: Is it worth this price?
#Anthropic #AI #IPO

72
·
--
After the US stock rebound, can SOL and BNB keep pace with Tesla’s recovery?
US stocks have recovered, but risk appetite across asset classes has yet to return in tandem. TSLA has reclaimed its recent prior high, while SOL’s daily highs continue to move lower and BNB remains range-bound.
My view: watch whether strength can continue, while using key levels to assess whether the crypto market is following suit.
• SOL: support at 98.6–100.0; resistance at 102.7–103.2 USDT.
• BNB: support at 732–735; resistance at 747–752 USDT.
• TSLA: support at $383–389; resistance at $397–400.
For crypto, wait for a 4-hour close above the level and a successful retest; use daily confirmation for TSLA. Watch for profit-taking near resistance. A close below support invalidates the original long thesis. These key levels are analytically derived zones, not guarantees.
On flows, BTC ETFs saw net inflows of $301.2 million from October 19–23, but a combined $773.5 million in outflows over the final two days; ETH ETFs recorded net outflows of $220.7 million over the same period. Weekly net inflows do not replace an assessment of turning points in flows. Some ETF data for October 26 is still missing and has not been included.
US stock data in the chart reflects the regular-session close on October 26; crypto prices are a snapshot taken at 10:37 Beijing time on October 27. The return periods differ, so the figures should not be ranked directly. Sources: Binance, Kraken, Yahoo Finance, Farside, and the Fed; see the chart for full methodology. This is research commentary, not personalized investment advice.
Which are you watching most closely: SOL reclaiming resistance, BNB breaking out of its range, or TSLA holding support?
After the US stock rebound, can SOL and BNB keep pace with Tesla’s recovery?
US stocks have recovered, but risk appetite across asset classes has yet to return in tandem. TSLA has reclaimed its recent prior high, while SOL’s daily highs continue to move lower and BNB remains range-bound.
My view: watch whether strength can continue, while using key levels to assess whether the crypto market is following suit.
• SOL: support at 98.6–100.0; resistance at 102.7–103.2 USDT.
• BNB: support at 732–735; resistance at 747–752 USDT.
• TSLA: support at $383–389; resistance at $397–400.
For crypto, wait for a 4-hour close above the level and a successful retest; use daily confirmation for TSLA. Watch for profit-taking near resistance. A close below support invalidates the original long thesis. These key levels are analytically derived zones, not guarantees.
On flows, BTC ETFs saw net inflows of $301.2 million from October 19–23, but a combined $773.5 million in outflows over the final two days; ETH ETFs recorded net outflows of $220.7 million over the same period. Weekly net inflows do not replace an assessment of turning points in flows. Some ETF data for October 26 is still missing and has not been included.
US stock data in the chart reflects the regular-session close on October 26; crypto prices are a snapshot taken at 10:37 Beijing time on October 27. The return periods differ, so the figures should not be ranked directly. Sources: Binance, Kraken, Yahoo Finance, Farside, and the Fed; see the chart for full methodology. This is research commentary, not personalized investment advice.
Which are you watching most closely: SOL reclaiming resistance, BNB breaking out of its range, or TSLA holding support?
US stocks have recovered, but risk appetite across asset classes has yet to return in tandem. TSLA has reclaimed its recent prior high, while SOL’s daily highs continue to move lower and BNB remains range-bound.
My view: watch whether strength can continue, while using key levels to assess whether the crypto market is following suit.
• SOL: support at 98.6–100.0; resistance at 102.7–103.2 USDT.
• BNB: support at 732–735; resistance at 747–752 USDT.
• TSLA: support at $383–389; resistance at $397–400.
For crypto, wait for a 4-hour close above the level and a successful retest; use daily confirmation for TSLA. Watch for profit-taking near resistance. A close below support invalidates the original long thesis. These key levels are analytically derived zones, not guarantees.
On flows, BTC ETFs saw net inflows of $301.2 million from October 19–23, but a combined $773.5 million in outflows over the final two days; ETH ETFs recorded net outflows of $220.7 million over the same period. Weekly net inflows do not replace an assessment of turning points in flows. Some ETF data for October 26 is still missing and has not been included.
US stock data in the chart reflects the regular-session close on October 26; crypto prices are a snapshot taken at 10:37 Beijing time on October 27. The return periods differ, so the figures should not be ranked directly. Sources: Binance, Kraken, Yahoo Finance, Farside, and the Fed; see the chart for full methodology. This is research commentary, not personalized investment advice.
Which are you watching most closely: SOL reclaiming resistance, BNB breaking out of its range, or TSLA holding support?
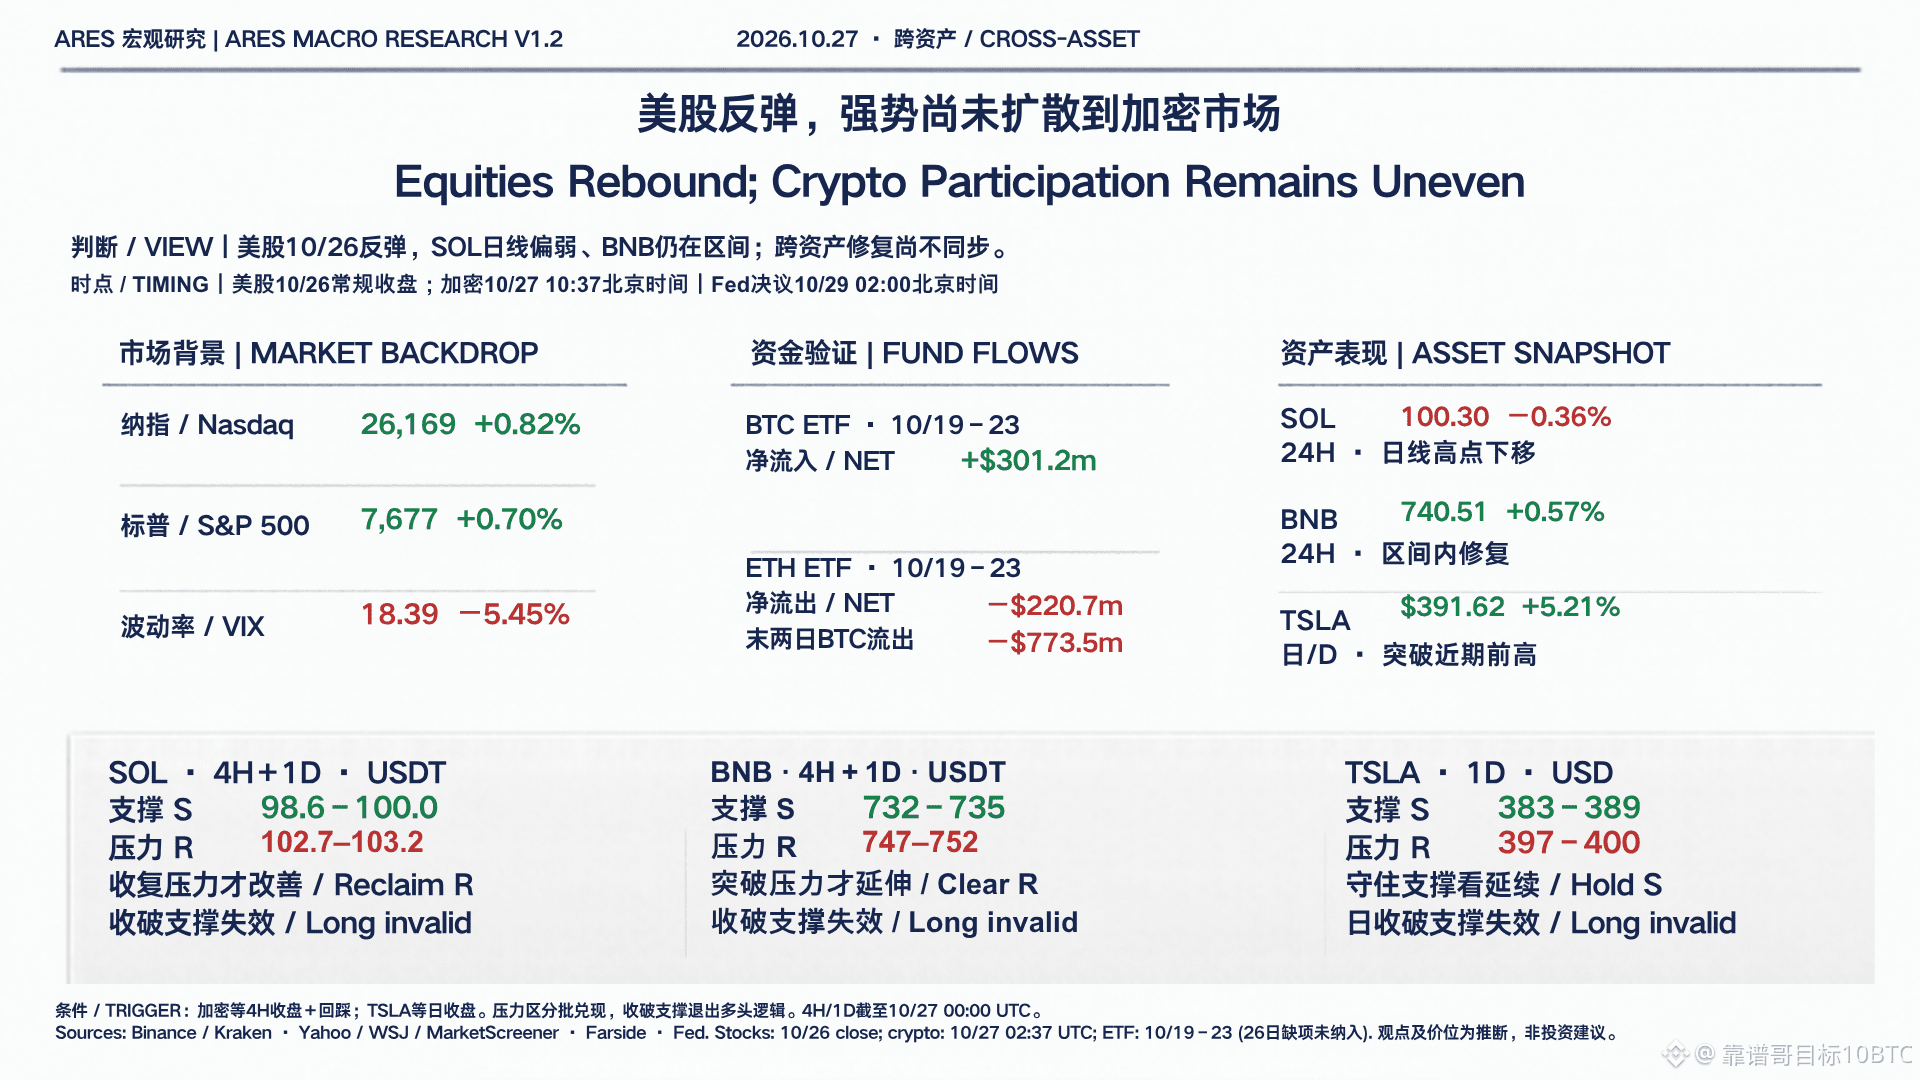
393
·
--
ARES Macro Research | Funds retreat first, prices move sideways: How convincing is the rebound at the $80,000 level?
My view: Continue to treat BTC and ETH as recovering within a range. ZEC is stronger in the short term, but localized strength is not enough to confirm a market-wide bull trend. Ahead of the Fed meeting, the key is whether flows and prices can move in the same direction again.
【Facts: Weekly net inflows masked withdrawals ahead of the weekend】
U.S. spot BTC ETFs recorded total net inflows of $301.2 million from October 19–23, but saw net outflows of $635.6 million and $137.9 million on the 22nd and 23rd, respectively—$773.5 million combined over the final two days. ETH ETFs recorded net outflows of $220.7 million for the same week.
This indicates that ETF flows weakened in the latter part of the week. A positive weekly total alone is not enough to conclude that buying pressure is strengthening steadily. ETF creations and redemptions are also not equivalent to spot trades executed at the same moment.
【Market snapshot | October 27, 10:23 Beijing time】
Binance spot USDT: BTC 80,001 (rolling 24-hour change: +0.44%); ETH 2,319 (+0.47%); ZEC 1,227 (+2.26%). Prices vary across exchanges.
【4-hour structure + daily-chart context | USDT】
BTC: Support 79,200–79,450 | Resistance 80,800–81,050.
Daily highs have been declining consecutively, and price has yet to reclaim the upper boundary. A 4-hour close above 81,050 followed by a successful retest would support an extended recovery; a close below 79,200 would invalidate support within the range.
ETH: Support 2,280–2,300 | Resistance 2,345–2,370.
Daily highs have also been moving lower. The quality of the rebound would improve only if ETH reclaims 2,370 on a 4-hour close and holds it on a retest; a close below 2,280 would signal a failed defense.
ZEC: Near-term support 1,210–1,220 | Resistance 1,255–1,270.
Daily lows have been rising consecutively, giving the short-term structure a relative advantage. A 4-hour breakout above 1,270 that holds would support continuation. A close below 1,210 would weaken its relative strength; next, watch 1,175–1,185. Relative strength is not a reason to chase higher prices unconditionally.
【Execution approach | Analytical inference】
The base case is continued back-and-forth trading within the range; avoid chasing a directional move in the middle of it. If trading a breakout, wait for a confirmed 4-hour close and a retest. Take profits in stages near resistance, and exit the long thesis if the corresponding support gives way. If price spikes higher but then closes back below resistance, treat it as a failed breakout and do not carry forward the original bullish view. Account for slippage when considering actual execution and stop-losses; key levels are not guarantees.
【Next verification point】
The Federal Reserve decision is scheduled for October 29 at 02:00 Beijing time, followed by a press conference at 02:30. Watch whether prices can hold above the upper boundary after the decision, and whether subsequent complete ETF data show that outflows are easing. A single news-driven spike does not confirm a trend.
Data methodology: Market prices are snapshots from Binance’s official API, with the magnitude cross-checked against Kraken’s concurrent USD spot prices. The structure analysis uses only completed 4-hour candles up to October 27, 08:00 Beijing time, and complete UTC daily candles. Support and resistance levels are research-derived zones. ETF data are based on the complete October 19–23 figures currently listed by Farside; the 26th is still incomplete and has been excluded. Figures may be revised later.
Sources: api.binance.com; api.kraken.com; farside.co.uk/btc/; farside.co.uk/eth/; federalreserve.gov/monetarypolicy/fomccalendars.htm.
Research opinion; not personalized investment advice.
ARES Macro Research | Funds retreat first, prices move sideways: How convincing is the rebound at the $80,000 level?
My view: Continue to treat BTC and ETH as recovering within a range. ZEC is stronger in the short term, but localized strength is not enough to confirm a market-wide bull trend. Ahead of the Fed meeting, the key is whether flows and prices can move in the same direction again.
【Facts: Weekly net inflows masked withdrawals ahead of the weekend】
U.S. spot BTC ETFs recorded total net inflows of $301.2 million from October 19–23, but saw net outflows of $635.6 million and $137.9 million on the 22nd and 23rd, respectively—$773.5 million combined over the final two days. ETH ETFs recorded net outflows of $220.7 million for the same week.
This indicates that ETF flows weakened in the latter part of the week. A positive weekly total alone is not enough to conclude that buying pressure is strengthening steadily. ETF creations and redemptions are also not equivalent to spot trades executed at the same moment.
【Market snapshot | October 27, 10:23 Beijing time】
Binance spot USDT: BTC 80,001 (rolling 24-hour change: +0.44%); ETH 2,319 (+0.47%); ZEC 1,227 (+2.26%). Prices vary across exchanges.
【4-hour structure + daily-chart context | USDT】
BTC: Support 79,200–79,450 | Resistance 80,800–81,050.
Daily highs have been declining consecutively, and price has yet to reclaim the upper boundary. A 4-hour close above 81,050 followed by a successful retest would support an extended recovery; a close below 79,200 would invalidate support within the range.
ETH: Support 2,280–2,300 | Resistance 2,345–2,370.
Daily highs have also been moving lower. The quality of the rebound would improve only if ETH reclaims 2,370 on a 4-hour close and holds it on a retest; a close below 2,280 would signal a failed defense.
ZEC: Near-term support 1,210–1,220 | Resistance 1,255–1,270.
Daily lows have been rising consecutively, giving the short-term structure a relative advantage. A 4-hour breakout above 1,270 that holds would support continuation. A close below 1,210 would weaken its relative strength; next, watch 1,175–1,185. Relative strength is not a reason to chase higher prices unconditionally.
【Execution approach | Analytical inference】
The base case is continued back-and-forth trading within the range; avoid chasing a directional move in the middle of it. If trading a breakout, wait for a confirmed 4-hour close and a retest. Take profits in stages near resistance, and exit the long thesis if the corresponding support gives way. If price spikes higher but then closes back below resistance, treat it as a failed breakout and do not carry forward the original bullish view. Account for slippage when considering actual execution and stop-losses; key levels are not guarantees.
【Next verification point】
The Federal Reserve decision is scheduled for October 29 at 02:00 Beijing time, followed by a press conference at 02:30. Watch whether prices can hold above the upper boundary after the decision, and whether subsequent complete ETF data show that outflows are easing. A single news-driven spike does not confirm a trend.
Data methodology: Market prices are snapshots from Binance’s official API, with the magnitude cross-checked against Kraken’s concurrent USD spot prices. The structure analysis uses only completed 4-hour candles up to October 27, 08:00 Beijing time, and complete UTC daily candles. Support and resistance levels are research-derived zones. ETF data are based on the complete October 19–23 figures currently listed by Farside; the 26th is still incomplete and has been excluded. Figures may be revised later.
Sources: api.binance.com; api.kraken.com; farside.co.uk/btc/; farside.co.uk/eth/; federalreserve.gov/monetarypolicy/fomccalendars.htm.
Research opinion; not personalized investment advice.
My view: Continue to treat BTC and ETH as recovering within a range. ZEC is stronger in the short term, but localized strength is not enough to confirm a market-wide bull trend. Ahead of the Fed meeting, the key is whether flows and prices can move in the same direction again.
【Facts: Weekly net inflows masked withdrawals ahead of the weekend】
U.S. spot BTC ETFs recorded total net inflows of $301.2 million from October 19–23, but saw net outflows of $635.6 million and $137.9 million on the 22nd and 23rd, respectively—$773.5 million combined over the final two days. ETH ETFs recorded net outflows of $220.7 million for the same week.
This indicates that ETF flows weakened in the latter part of the week. A positive weekly total alone is not enough to conclude that buying pressure is strengthening steadily. ETF creations and redemptions are also not equivalent to spot trades executed at the same moment.
【Market snapshot | October 27, 10:23 Beijing time】
Binance spot USDT: BTC 80,001 (rolling 24-hour change: +0.44%); ETH 2,319 (+0.47%); ZEC 1,227 (+2.26%). Prices vary across exchanges.
【4-hour structure + daily-chart context | USDT】
BTC: Support 79,200–79,450 | Resistance 80,800–81,050.
Daily highs have been declining consecutively, and price has yet to reclaim the upper boundary. A 4-hour close above 81,050 followed by a successful retest would support an extended recovery; a close below 79,200 would invalidate support within the range.
ETH: Support 2,280–2,300 | Resistance 2,345–2,370.
Daily highs have also been moving lower. The quality of the rebound would improve only if ETH reclaims 2,370 on a 4-hour close and holds it on a retest; a close below 2,280 would signal a failed defense.
ZEC: Near-term support 1,210–1,220 | Resistance 1,255–1,270.
Daily lows have been rising consecutively, giving the short-term structure a relative advantage. A 4-hour breakout above 1,270 that holds would support continuation. A close below 1,210 would weaken its relative strength; next, watch 1,175–1,185. Relative strength is not a reason to chase higher prices unconditionally.
【Execution approach | Analytical inference】
The base case is continued back-and-forth trading within the range; avoid chasing a directional move in the middle of it. If trading a breakout, wait for a confirmed 4-hour close and a retest. Take profits in stages near resistance, and exit the long thesis if the corresponding support gives way. If price spikes higher but then closes back below resistance, treat it as a failed breakout and do not carry forward the original bullish view. Account for slippage when considering actual execution and stop-losses; key levels are not guarantees.
【Next verification point】
The Federal Reserve decision is scheduled for October 29 at 02:00 Beijing time, followed by a press conference at 02:30. Watch whether prices can hold above the upper boundary after the decision, and whether subsequent complete ETF data show that outflows are easing. A single news-driven spike does not confirm a trend.
Data methodology: Market prices are snapshots from Binance’s official API, with the magnitude cross-checked against Kraken’s concurrent USD spot prices. The structure analysis uses only completed 4-hour candles up to October 27, 08:00 Beijing time, and complete UTC daily candles. Support and resistance levels are research-derived zones. ETF data are based on the complete October 19–23 figures currently listed by Farside; the 26th is still incomplete and has been excluded. Figures may be revised later.
Sources: api.binance.com; api.kraken.com; farside.co.uk/btc/; farside.co.uk/eth/; federalreserve.gov/monetarypolicy/fomccalendars.htm.
Research opinion; not personalized investment advice.
308
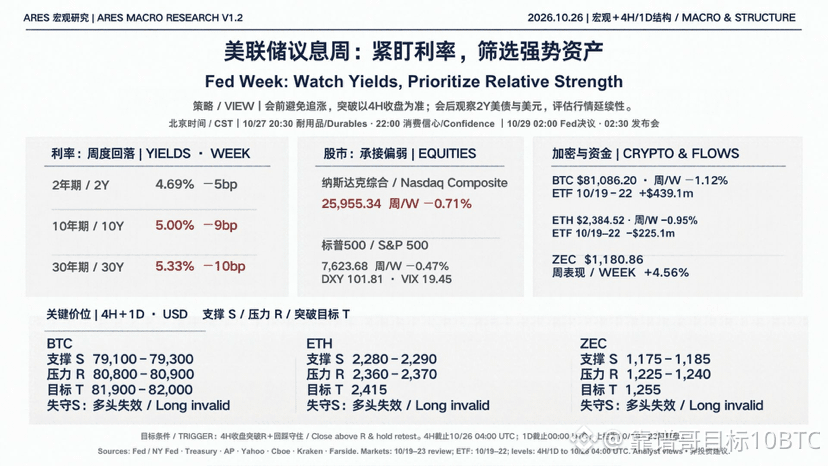
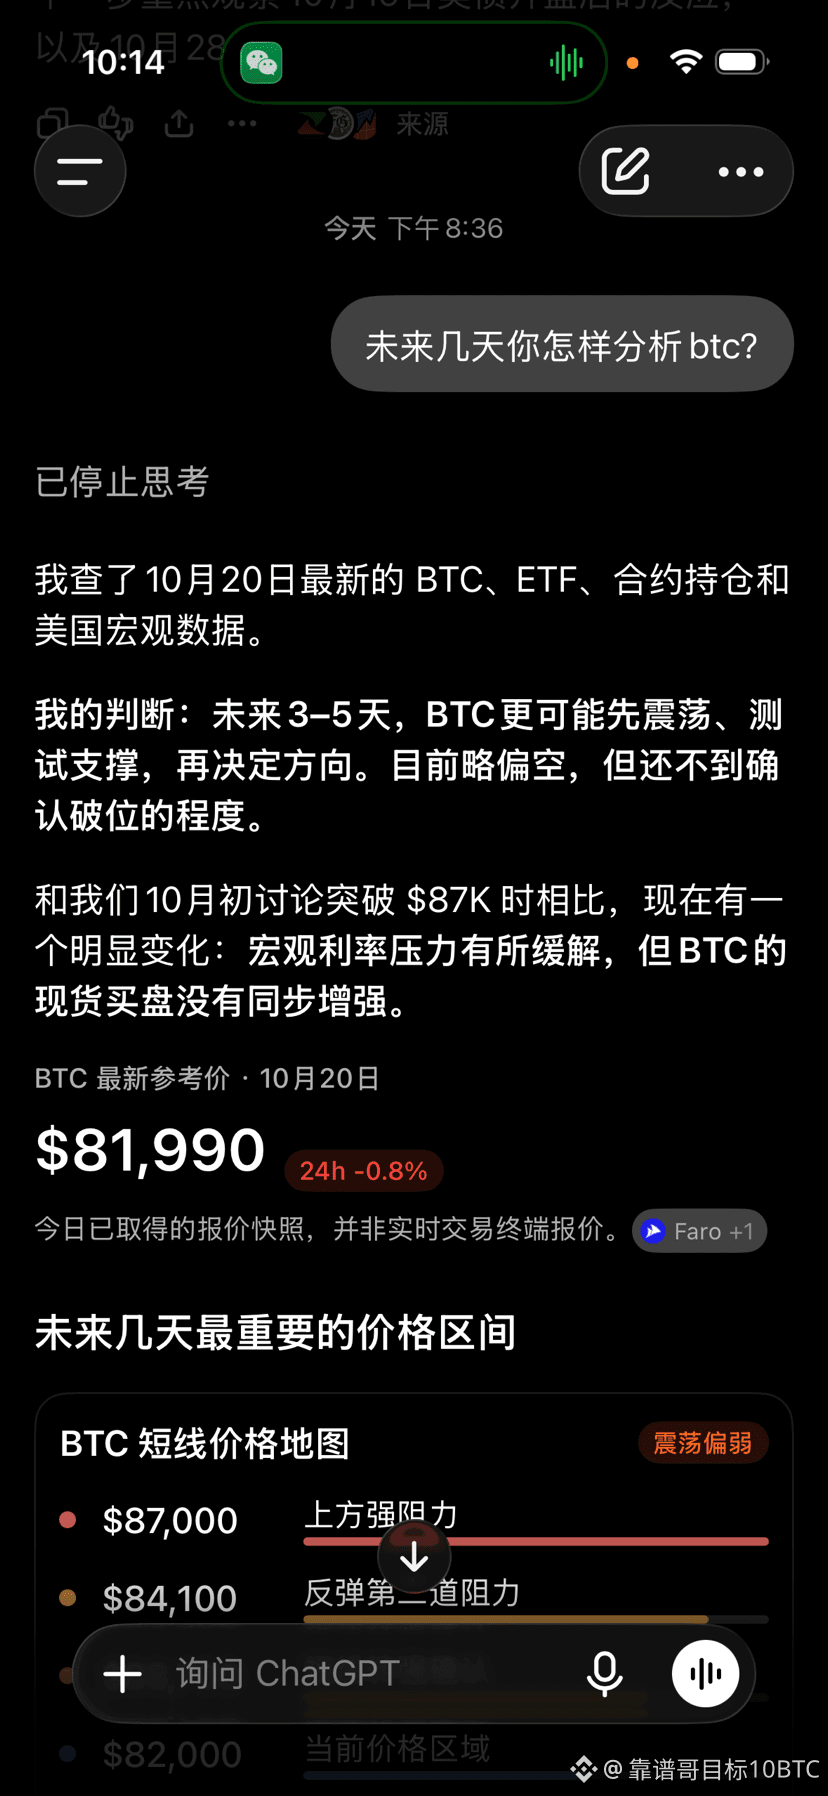
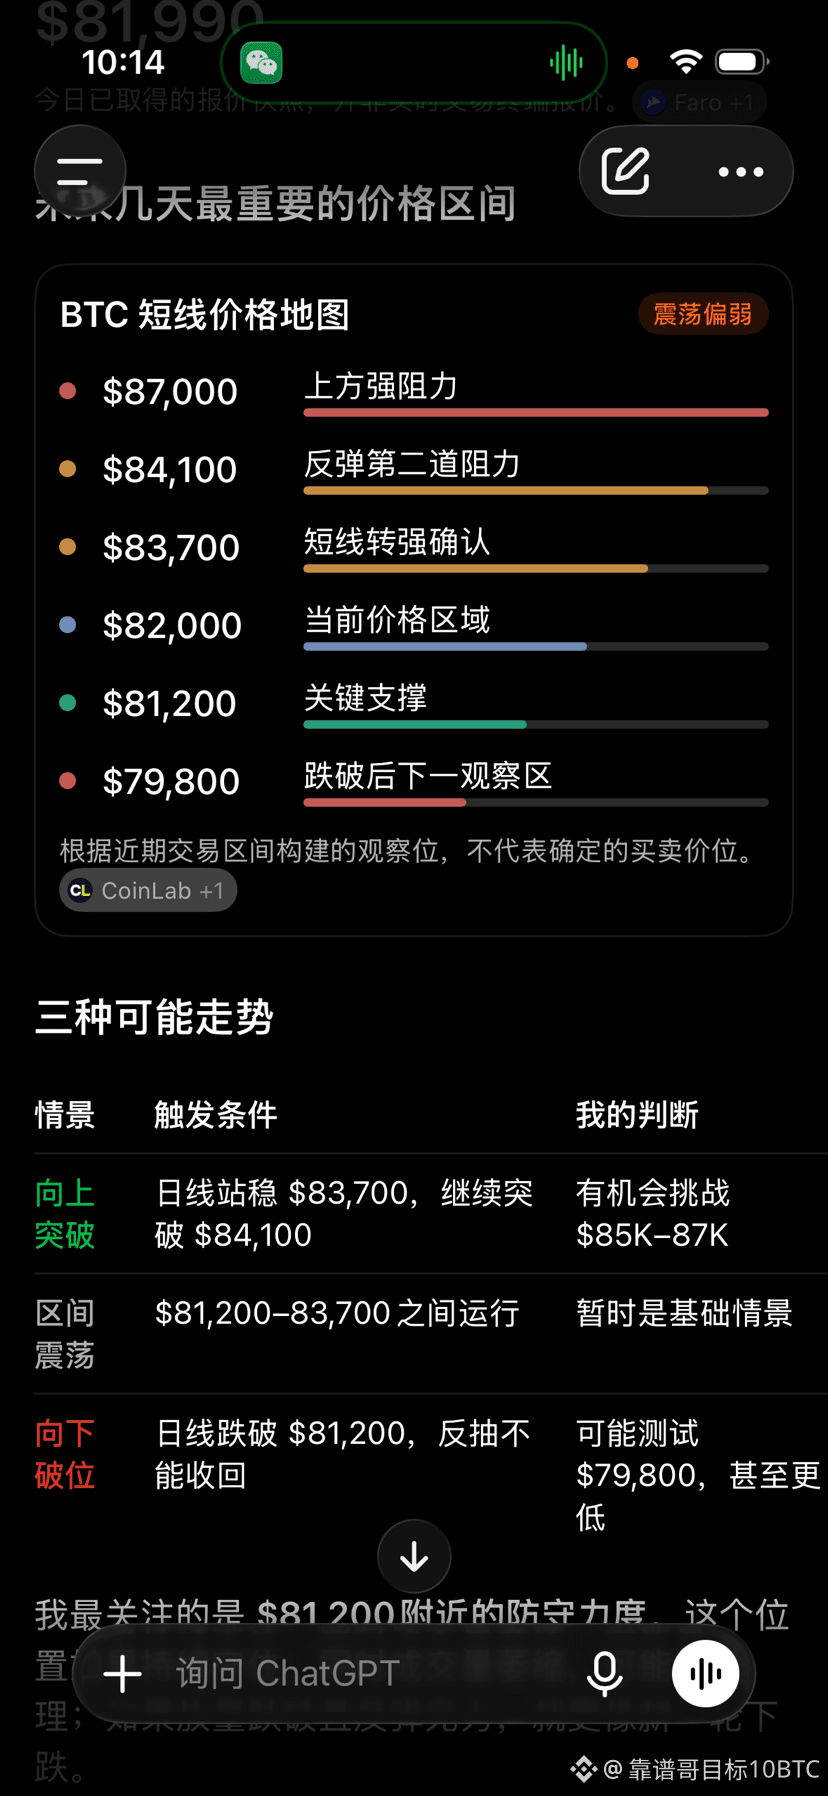
·
--
Bullish
The recently popular #LeanMuscleTheory in Web3 is pretty interesting.
How do I interpret it?
I think it has three layers.
First: a shift from competing over wealth to competing over personal appeal.
In the past, the crypto world often treated wealth, returns, and luxury cars as symbols of success. Now, appearance, physical condition, emotional support, and social skills are becoming another form of competitive edge.
Second: the body becomes a visible signal of self-discipline.
Wealth can come from luck, but maintaining a healthy physique usually takes long-term effort. What a lean, muscular physique conveys is more than just appearance—it also signals discipline, patience, and the ability to manage yourself consistently.
Of course, physique doesn’t define your character, nor does it represent your entire worth as a person.
Third: it’s an attention-driven viral experiment in its own right.
This is the part I find most worth examining.
A concept that originally belonged to the fitness world quickly became a new social narrative through influencer promotion, community imitation, and a sense of identity.
How similar this is to the way meme coins spread.
From an idea, to consensus, to a crowd chasing after it—the underlying force is the attention economy.
Here’s what I’m thinking:
Every era comes up with a new “answer of the moment.” But what truly matters isn’t chasing the answer—it’s understanding why it emerged.
Wealth can compound, knowledge can compound, and so can the benefits of taking care of your body over the long term.
Markets rotate, and narratives come and go.
The one thing always worth investing in for the long term is yourself.
You’ve got this!!![加油][加油][加油]
#薄肌论 #认知复利 #长期主义 #Web3
The recently popular #LeanMuscleTheory in Web3 is pretty interesting.
How do I interpret it?
I think it has three layers.
First: a shift from competing over wealth to competing over personal appeal.
In the past, the crypto world often treated wealth, returns, and luxury cars as symbols of success. Now, appearance, physical condition, emotional support, and social skills are becoming another form of competitive edge.
Second: the body becomes a visible signal of self-discipline.
Wealth can come from luck, but maintaining a healthy physique usually takes long-term effort. What a lean, muscular physique conveys is more than just appearance—it also signals discipline, patience, and the ability to manage yourself consistently.
Of course, physique doesn’t define your character, nor does it represent your entire worth as a person.
Third: it’s an attention-driven viral experiment in its own right.
This is the part I find most worth examining.
A concept that originally belonged to the fitness world quickly became a new social narrative through influencer promotion, community imitation, and a sense of identity.
How similar this is to the way meme coins spread.
From an idea, to consensus, to a crowd chasing after it—the underlying force is the attention economy.
Here’s what I’m thinking:
Every era comes up with a new “answer of the moment.” But what truly matters isn’t chasing the answer—it’s understanding why it emerged.
Wealth can compound, knowledge can compound, and so can the benefits of taking care of your body over the long term.
Markets rotate, and narratives come and go.
The one thing always worth investing in for the long term is yourself.
You’ve got this!!![加油][加油][加油]
#薄肌论 #认知复利 #长期主义 #Web3
How do I interpret it?
I think it has three layers.
First: a shift from competing over wealth to competing over personal appeal.
In the past, the crypto world often treated wealth, returns, and luxury cars as symbols of success. Now, appearance, physical condition, emotional support, and social skills are becoming another form of competitive edge.
Second: the body becomes a visible signal of self-discipline.
Wealth can come from luck, but maintaining a healthy physique usually takes long-term effort. What a lean, muscular physique conveys is more than just appearance—it also signals discipline, patience, and the ability to manage yourself consistently.
Of course, physique doesn’t define your character, nor does it represent your entire worth as a person.
Third: it’s an attention-driven viral experiment in its own right.
This is the part I find most worth examining.
A concept that originally belonged to the fitness world quickly became a new social narrative through influencer promotion, community imitation, and a sense of identity.
How similar this is to the way meme coins spread.
From an idea, to consensus, to a crowd chasing after it—the underlying force is the attention economy.
Here’s what I’m thinking:
Every era comes up with a new “answer of the moment.” But what truly matters isn’t chasing the answer—it’s understanding why it emerged.
Wealth can compound, knowledge can compound, and so can the benefits of taking care of your body over the long term.
Markets rotate, and narratives come and go.
The one thing always worth investing in for the long term is yourself.
You’ve got this!!![加油][加油][加油]
#薄肌论 #认知复利 #长期主义 #Web3


Z行者Zynergy2
·
--
Bullish20x long the body in sync with Cz
127
·
--
Follow me and build an AI trading ecosystem! Break through 2000 trades 24/7
Follow me and build an AI trading ecosystem! Break through 2000 trades 24/7
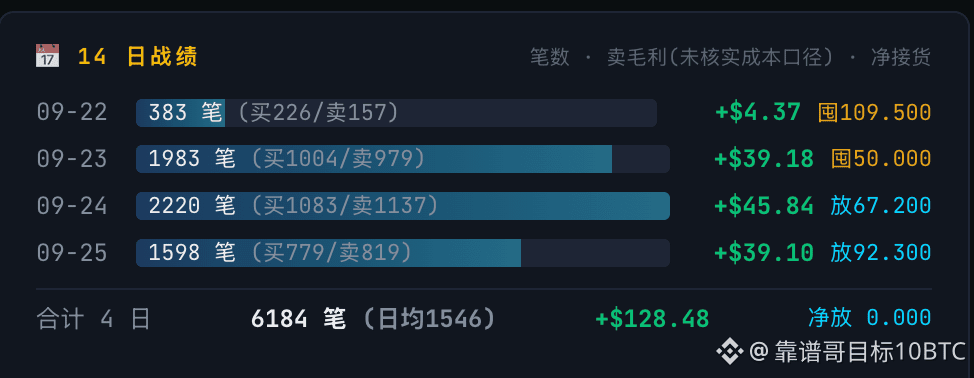
107
·
--
Mountains in view, a cool breeze filling my sleeves🍃
For now, I have a moment of peace in the mortal world,
and I can take in the fresh oxygen of the forests.
Investing in the world is much the same—no need to rush at once.
Like a waterfall and fine trickling water flowing steadily,
staying calm is what lets you go far.
记录#AI交易 突破日交易1000笔
Mountains in view, a cool breeze filling my sleeves🍃
For now, I have a moment of peace in the mortal world,
and I can take in the fresh oxygen of the forests.
Investing in the world is much the same—no need to rush at once.
Like a waterfall and fine trickling water flowing steadily,
staying calm is what lets you go far.
记录#AI交易 突破日交易1000笔
For now, I have a moment of peace in the mortal world,
and I can take in the fresh oxygen of the forests.
Investing in the world is much the same—no need to rush at once.
Like a waterfall and fine trickling water flowing steadily,
staying calm is what lets you go far.
记录#AI交易 突破日交易1000笔




109



Log in to explore more content
Join global crypto users on Binance Square
⚡️ Get latest and useful information about crypto.
💬 Trusted by the world’s largest crypto exchange.
👍 Discover real insights from verified creators.
Email / Phone number
Trending Topics
BitcoinRebounds$75KAsChipsLead
9,866 views
141 Discussing
Market Watch | Bitcoin Rebounds to $75,600 After Dip Below $75,000 as Chip Stocks Lead Rally on Jobs Beat
Binance News
·17 Likes
·5k views
JobsReportRaisesHikeOdds
123,681 views
1,097 Discussing
US Data Center Rules May Constrain AI Expansion
18,453 views
109 Discussing