
乾一学院
102 Posts

乾一学院
微博:乾丶一。十年交易者,擅长趋势,短线波段。

Top 30D Traders by Volume
24 Following
3.3K+ Followers
300 Liked
1 Badges
Posts
All
Live

Big issue
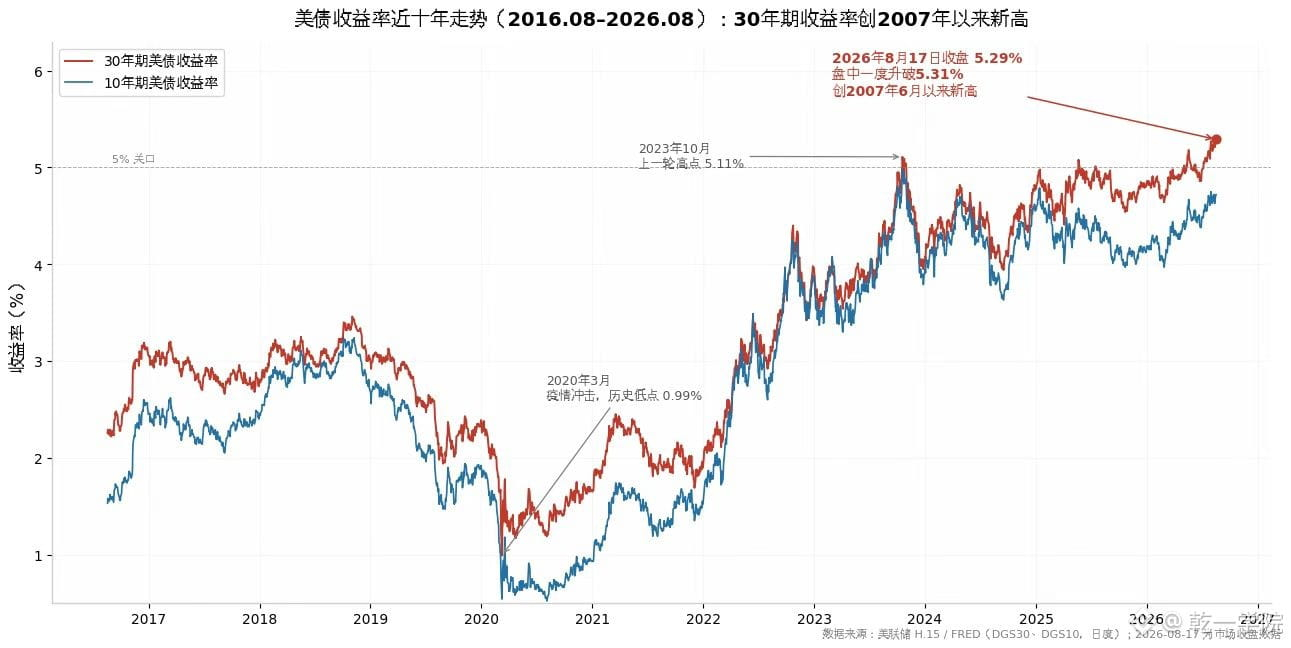
Over the past few days, in developed countries around the world—US, Japan, France, Germany, and the UK—the long-end yields on government bonds have surged dramatically. For example, today, the yield on the 30-year US Treasury climbed to the highest level in nearly two decades during the overnight session, reaching 5.304%.
Some friends have asked what this means.
Interest rates—more precisely, real interest rates—are the most important guiding macroeconomic indicators. The rise in global long-end rates can indicate two things:
1. The market is voting with its feet: In early August, the size of US Treasury holdings first exceeded $40 trillion, as investors have become alert to concerns about the sustainability of US debt and the pressure from interest payments;
2. Investors are starting to bet that future inflation will be hard to bring down. The market needs to use high interest rates to suppress high inflation.
Over the past few days, in developed countries around the world—US, Japan, France, Germany, and the UK—the long-end yields on government bonds have surged dramatically. For example, today, the yield on the 30-year US Treasury climbed to the highest level in nearly two decades during the overnight session, reaching 5.304%.
Some friends have asked what this means.
Interest rates—more precisely, real interest rates—are the most important guiding macroeconomic indicators. The rise in global long-end rates can indicate two things:
1. The market is voting with its feet: In early August, the size of US Treasury holdings first exceeded $40 trillion, as investors have become alert to concerns about the sustainability of US debt and the pressure from interest payments;
2. Investors are starting to bet that future inflation will be hard to bring down. The market needs to use high interest rates to suppress high inflation.
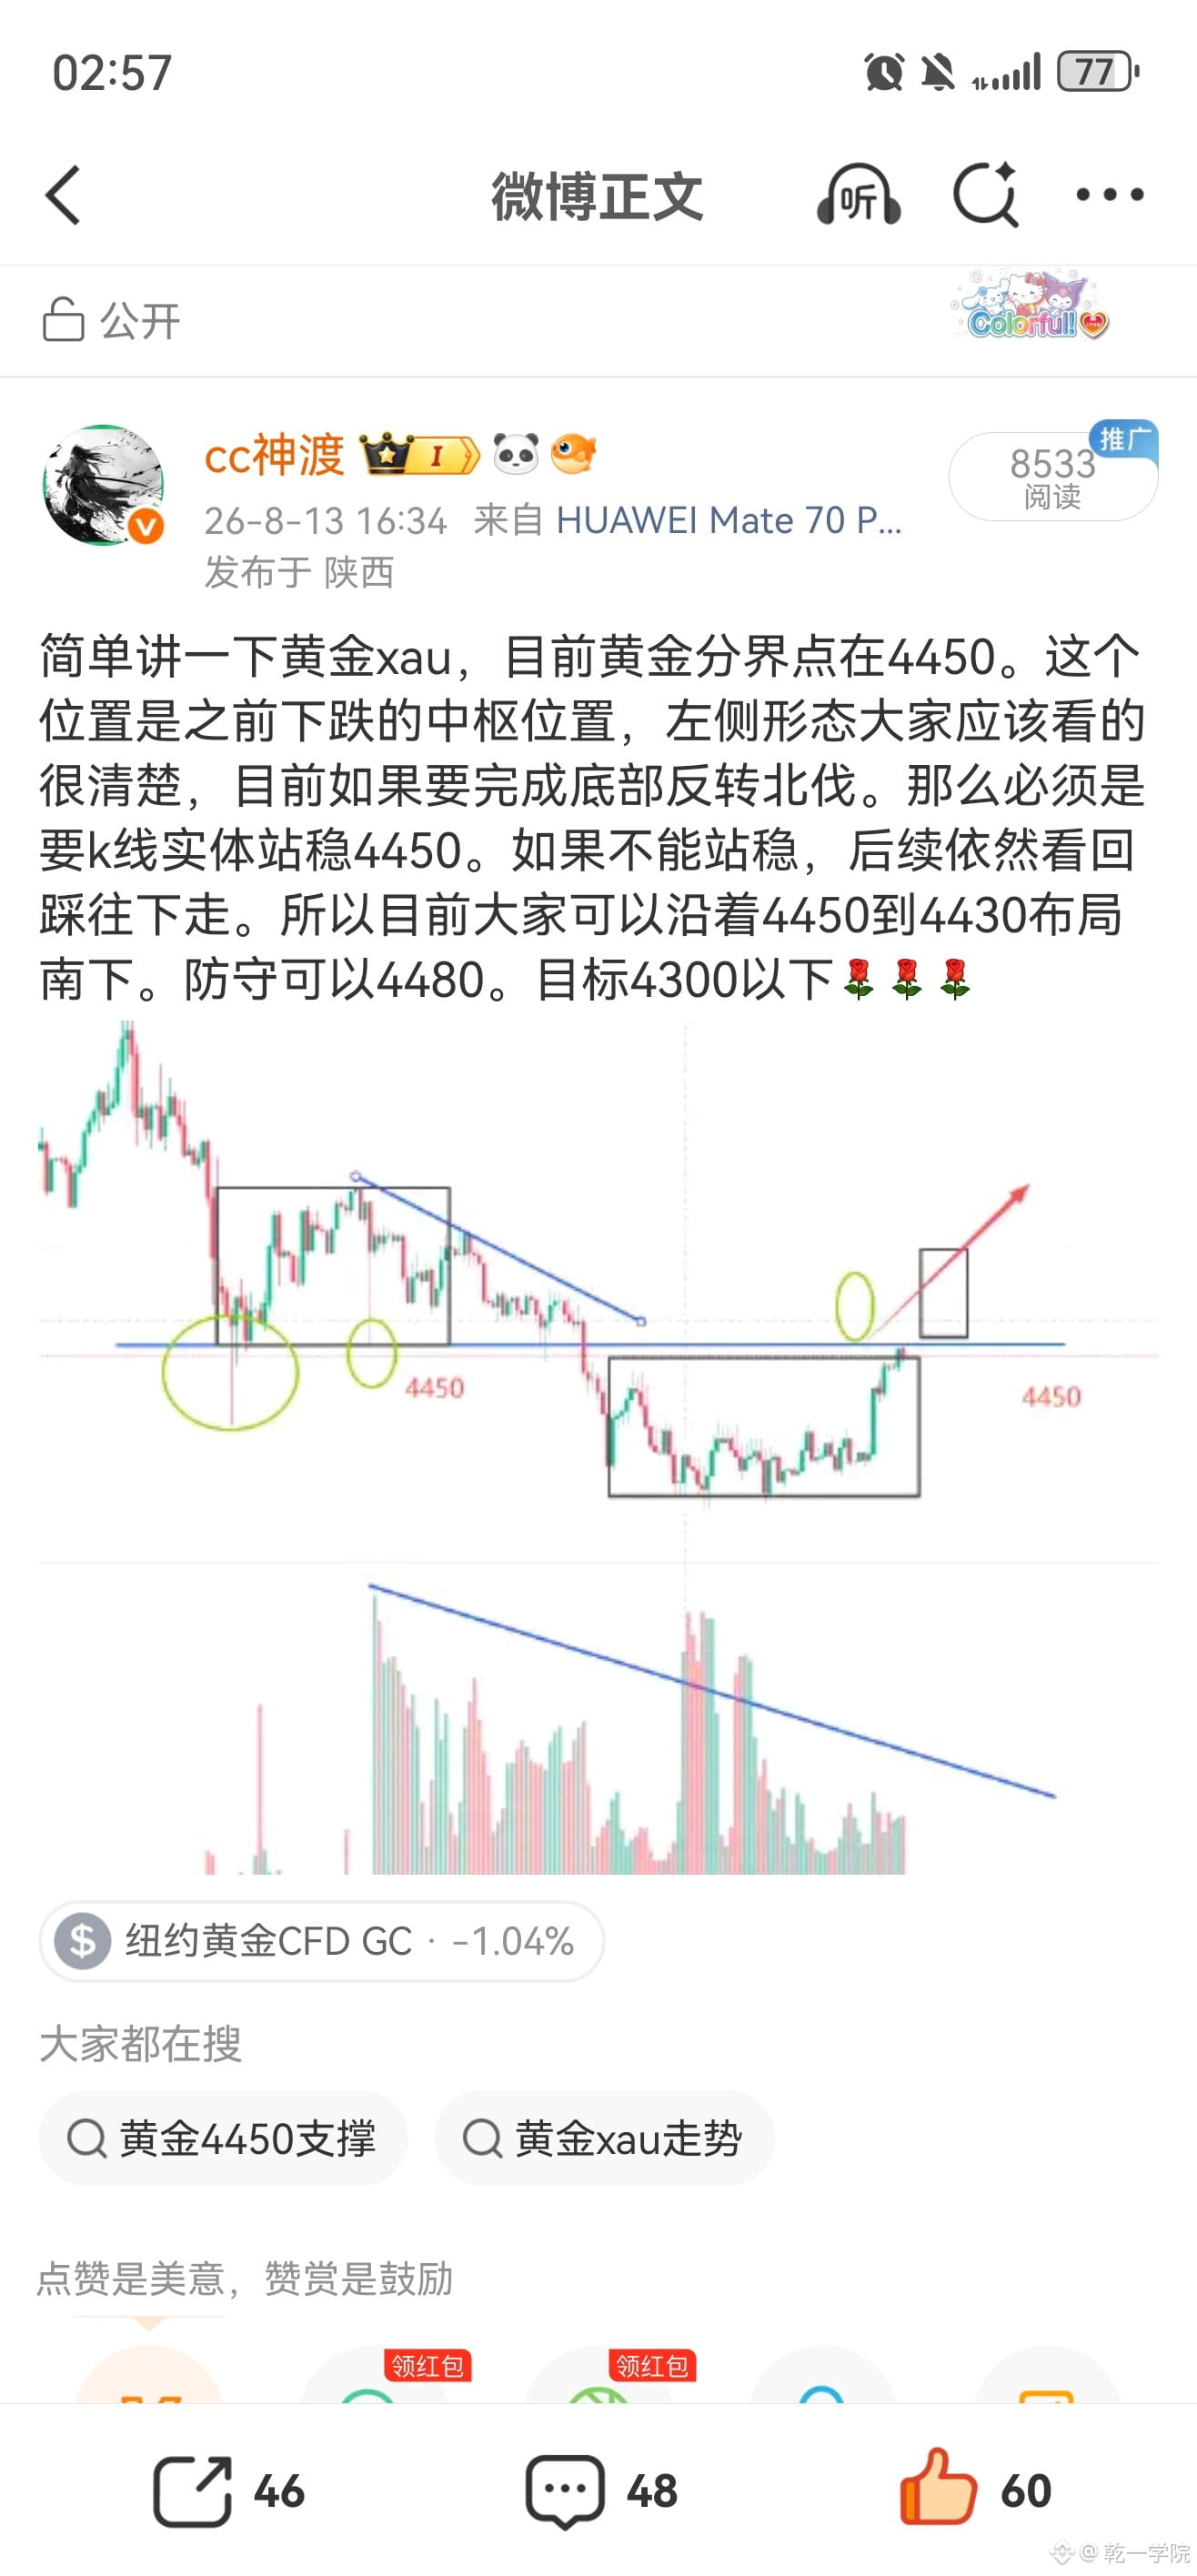
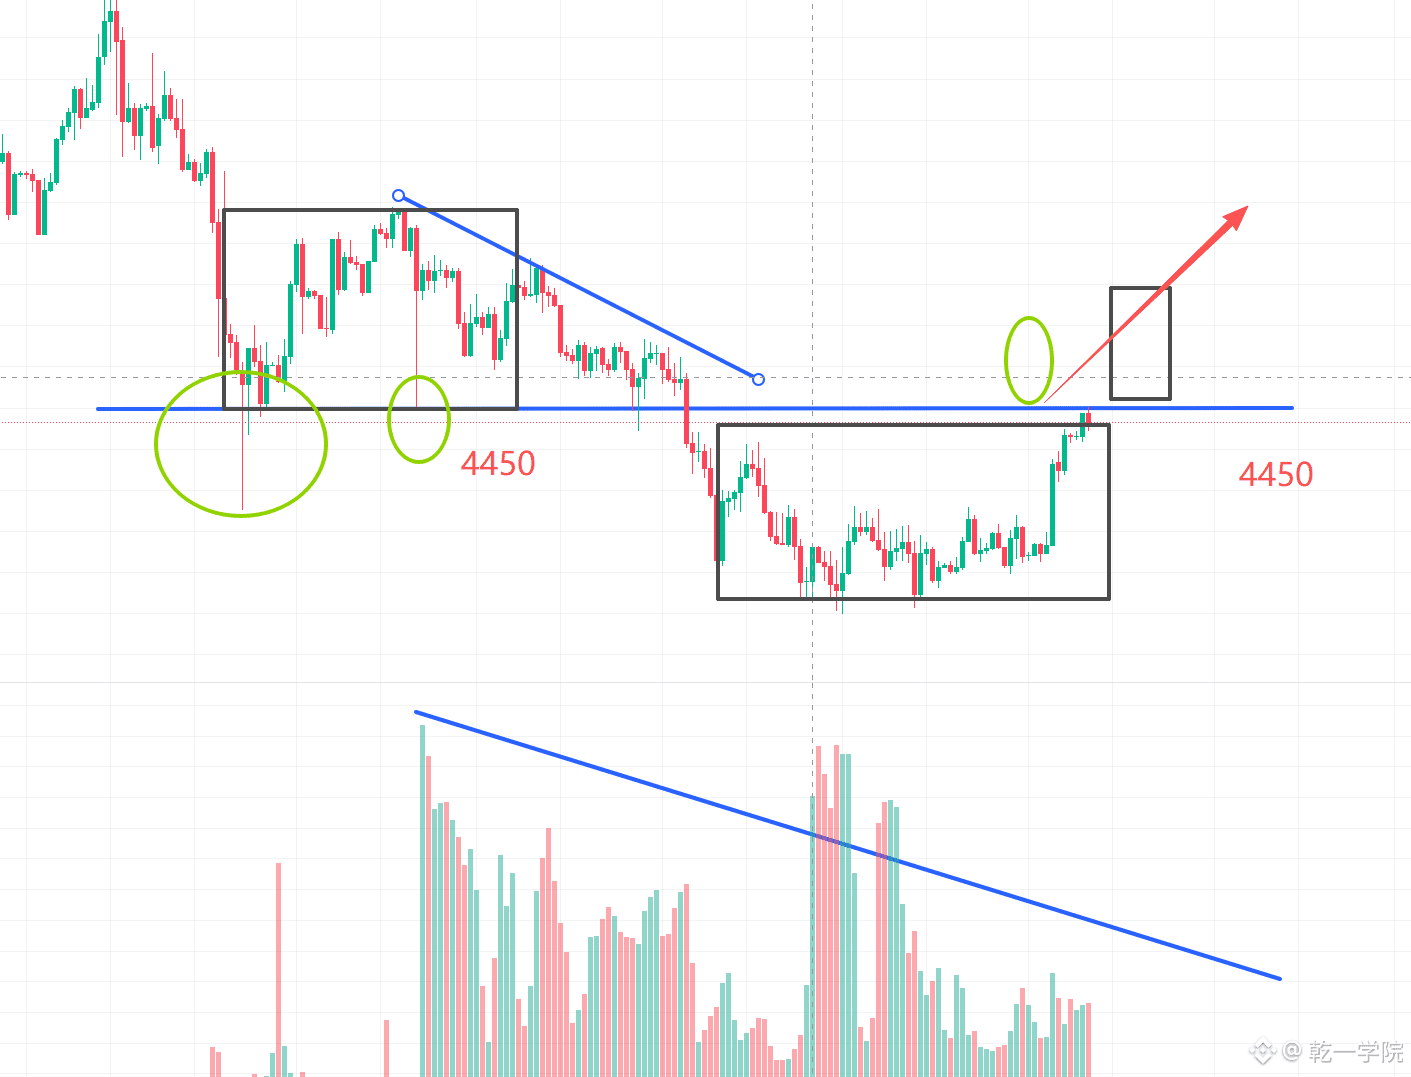
$XAU Briefly explain gold XAU. Currently, the key dividing point for gold is 4450. This level is the central area of the previous downswing. The left-side structure is quite clear to everyone. If we want to complete a bottom reversal, then we must have the candlestick body firmly hold above 4450. If it cannot hold, then we still expect a retest downward and continued movement lower. So for now, everyone can go short along 4450 to 4430. The stop-loss/defense level can be set at 4480. Targets are below 4300.
Let me talk about Ethereum [flowers][flowers][flowers]
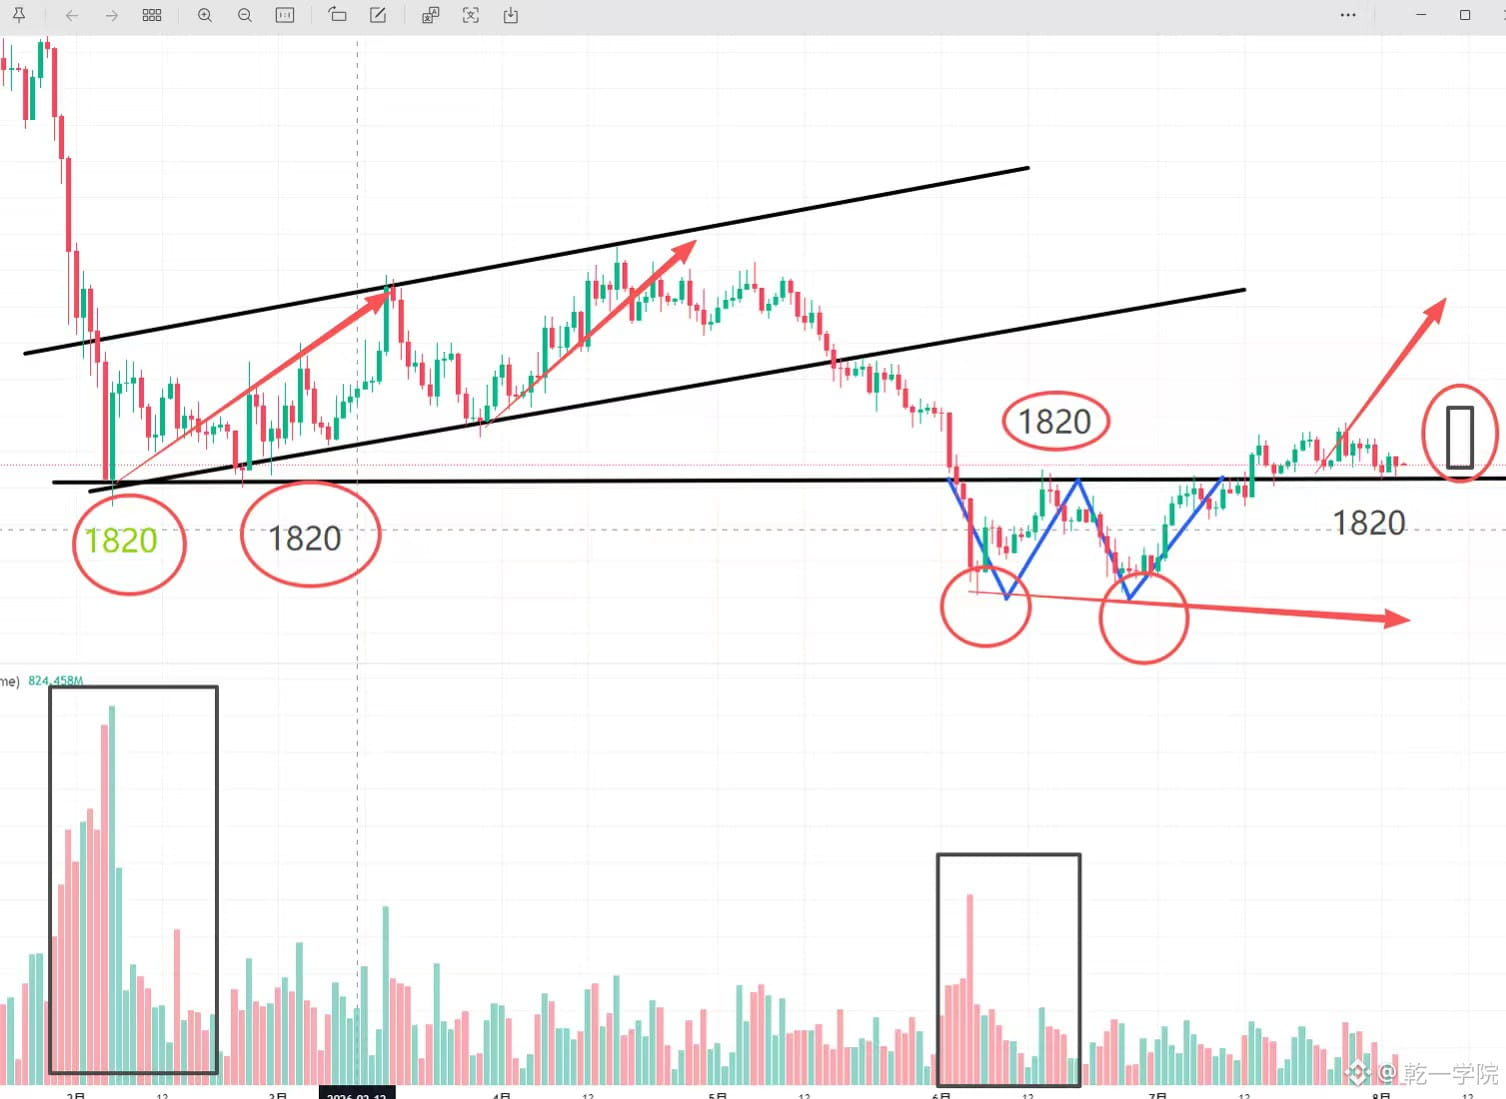
I’ve always been telling everyone to watch the ETH level at 1820.
Why is it this point? Actually, it’s based on the February movement. ETH at 1820 has the same logic as Bitcoin at 63000. In both cases, the uptrend channel line only begins once the candlestick body is established above 1820. So the same reasoning applies: what’s reflected on the left side corresponds to the right side. Therefore, 1820 is still the key dividing point for me to start. If it holds, then 1980 and 2020 can be reached one after another. If it can’t hold, then the next step will still be another attempt at 1500.
But for now, it hasn’t held and it hasn’t broken down either [flowers][flowers]. We’ll wait patiently for the subsequent daily candles to establish above [flowers][flowers][flowers]$BTC
I’ve always been telling everyone to watch the ETH level at 1820.
Why is it this point? Actually, it’s based on the February movement. ETH at 1820 has the same logic as Bitcoin at 63000. In both cases, the uptrend channel line only begins once the candlestick body is established above 1820. So the same reasoning applies: what’s reflected on the left side corresponds to the right side. Therefore, 1820 is still the key dividing point for me to start. If it holds, then 1980 and 2020 can be reached one after another. If it can’t hold, then the next step will still be another attempt at 1500.
But for now, it hasn’t held and it hasn’t broken down either [flowers][flowers]. We’ll wait patiently for the subsequent daily candles to establish above [flowers][flowers][flowers]$BTC
$BTC I actually really hope that this round of Bitcoin’s price action can follow the pattern from February.
That way, at least the market can warm up a bit. And also give the market some confidence.
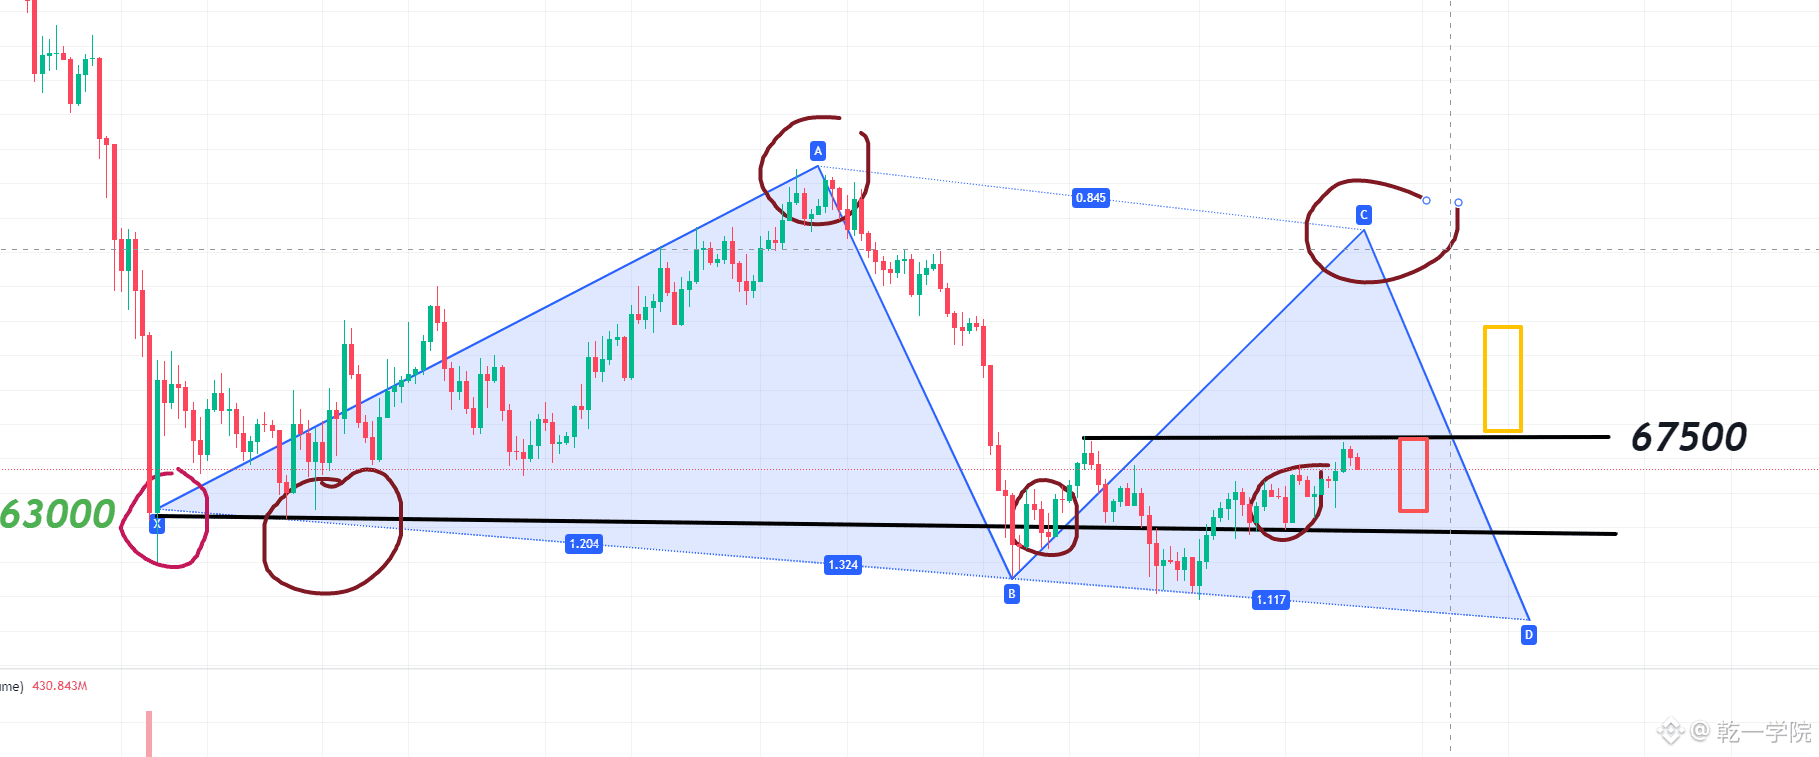
As I said before: Right now, the bottom-building level is still 63,000. If it doesn’t break, I still expect an advance northward. The upper peak is at 67,500. The range will play out in this manner.
That way, at least the market can warm up a bit. And also give the market some confidence.
As I said before: Right now, the bottom-building level is still 63,000. If it doesn’t break, I still expect an advance northward. The upper peak is at 67,500. The range will play out in this manner.
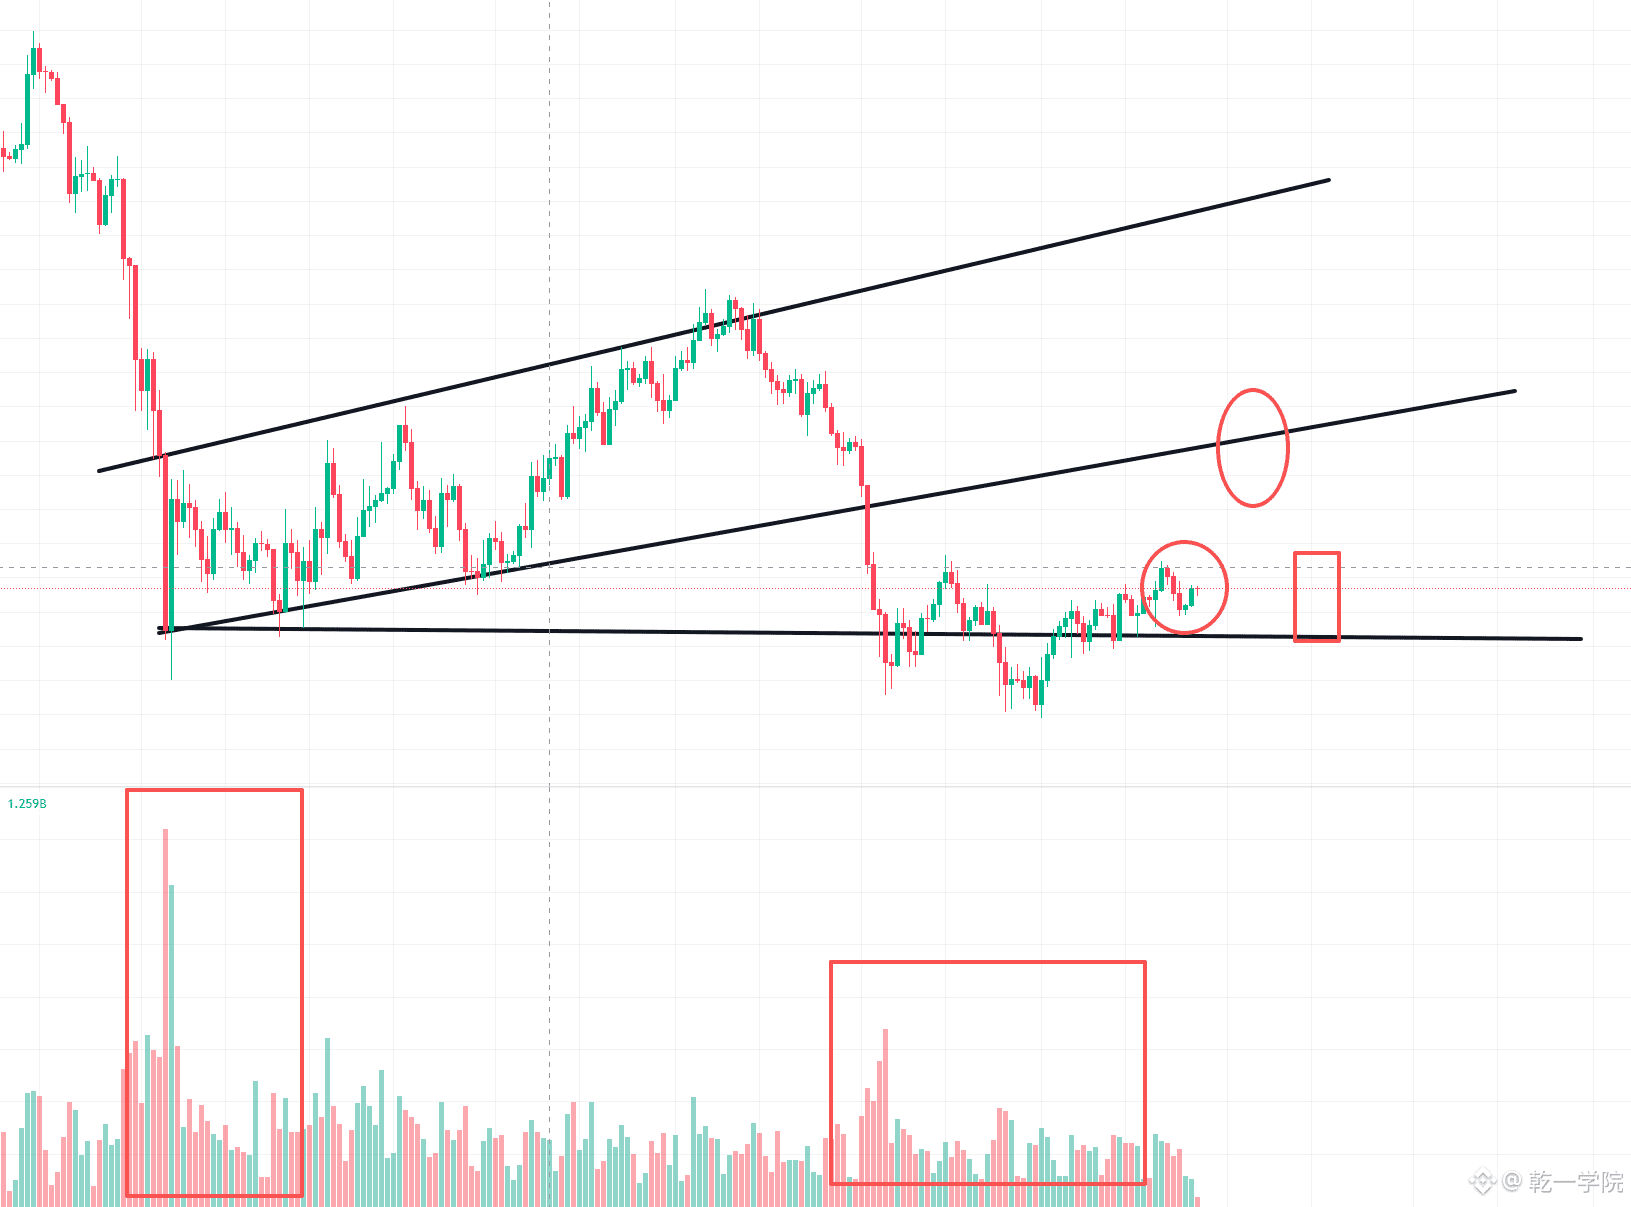
$BTC actually this recent move in Bitcoin. Suppose if this round is the bottom, then his eventual northern campaign target is around 78,000.
According to the Bat pattern's vertex on the second measurement, it's around 78,000. But currently we are only forecasting. Because the current pressure point is at 67,500. If it can't even hold that level, how could it reach 78,000?
So sometimes the final point is a larger-scale prediction, but the real-time path still has to follow the daily closing price. So the key is here: you must focus on the 67,500 level right now. If it holds there, then the next thing to watch is 73,000. If it can't hold, then instead it will need to keep pulling back to the 63,500 level. [flowers][flowers]
According to the Bat pattern's vertex on the second measurement, it's around 78,000. But currently we are only forecasting. Because the current pressure point is at 67,500. If it can't even hold that level, how could it reach 78,000?
So sometimes the final point is a larger-scale prediction, but the real-time path still has to follow the daily closing price. So the key is here: you must focus on the 67,500 level right now. If it holds there, then the next thing to watch is 73,000. If it can't hold, then instead it will need to keep pulling back to the 63,500 level. [flowers][flowers]
So disgusting. Like a knockoff.
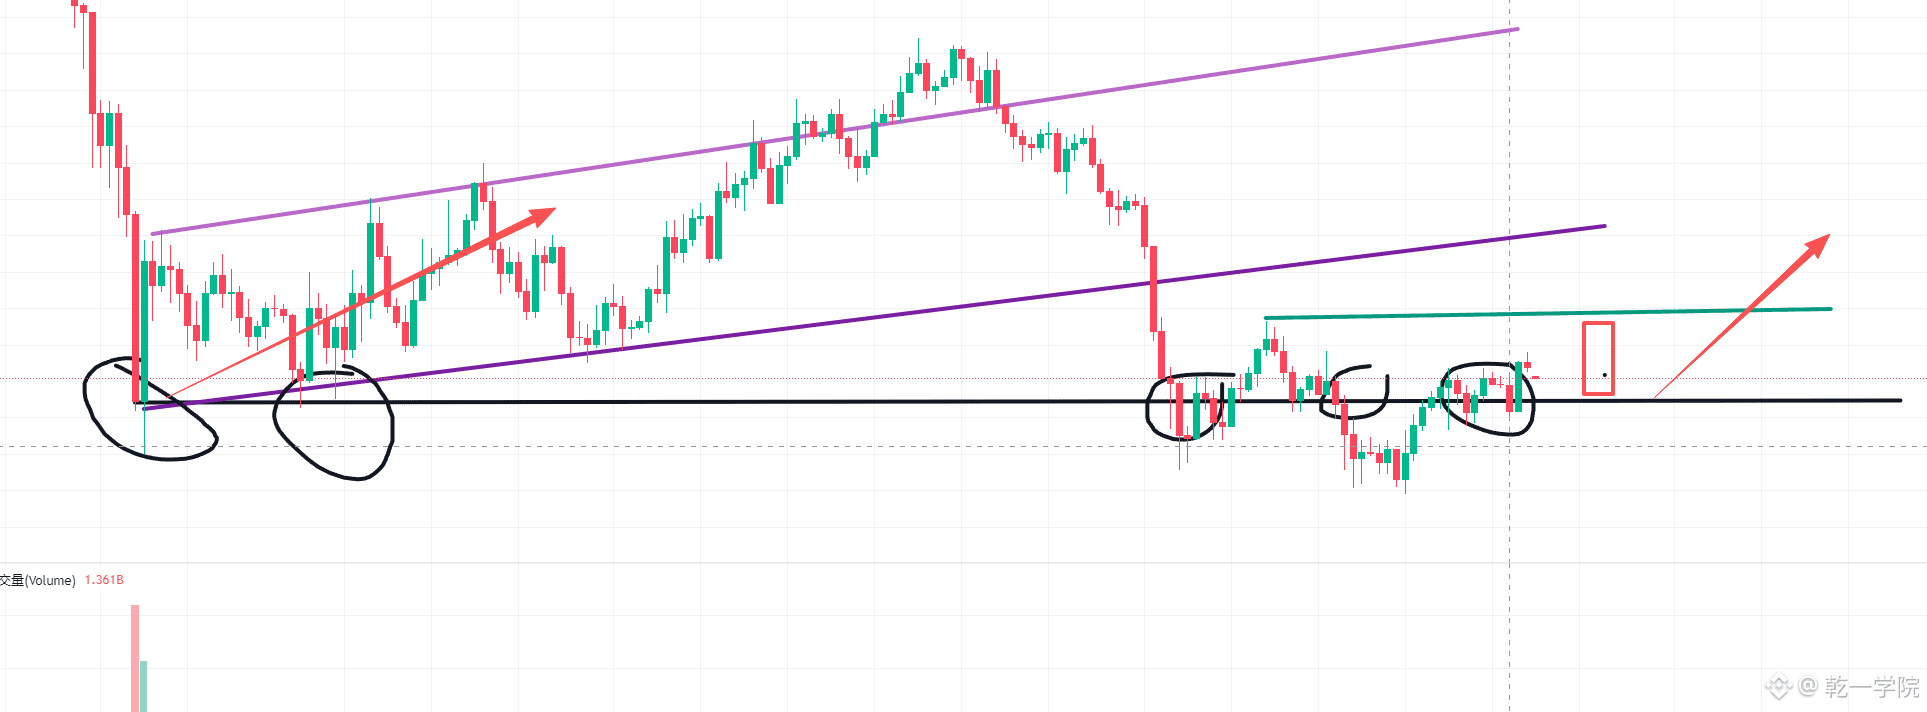
Can’t sleep late at night, watching this chart to review the market. From February to now, through July, the lows have all stayed in the range of 58,000 to 60,000. But when we review the February move, we’ll find that the actual northern breakout point is 63,000. So returning to the current position: you’ll see that if 63,000 doesn’t break down, it’s impossible for the market to move south. And even above it, the final northern breakout point is around 67,000. But who can guarantee that 67,000 definitely won’t be broken through? So recently, everyone trading—don’t blindly chase north or south. Because it’s clearly that a larger time frame is moving in a range [flowers][flowers]$BTC
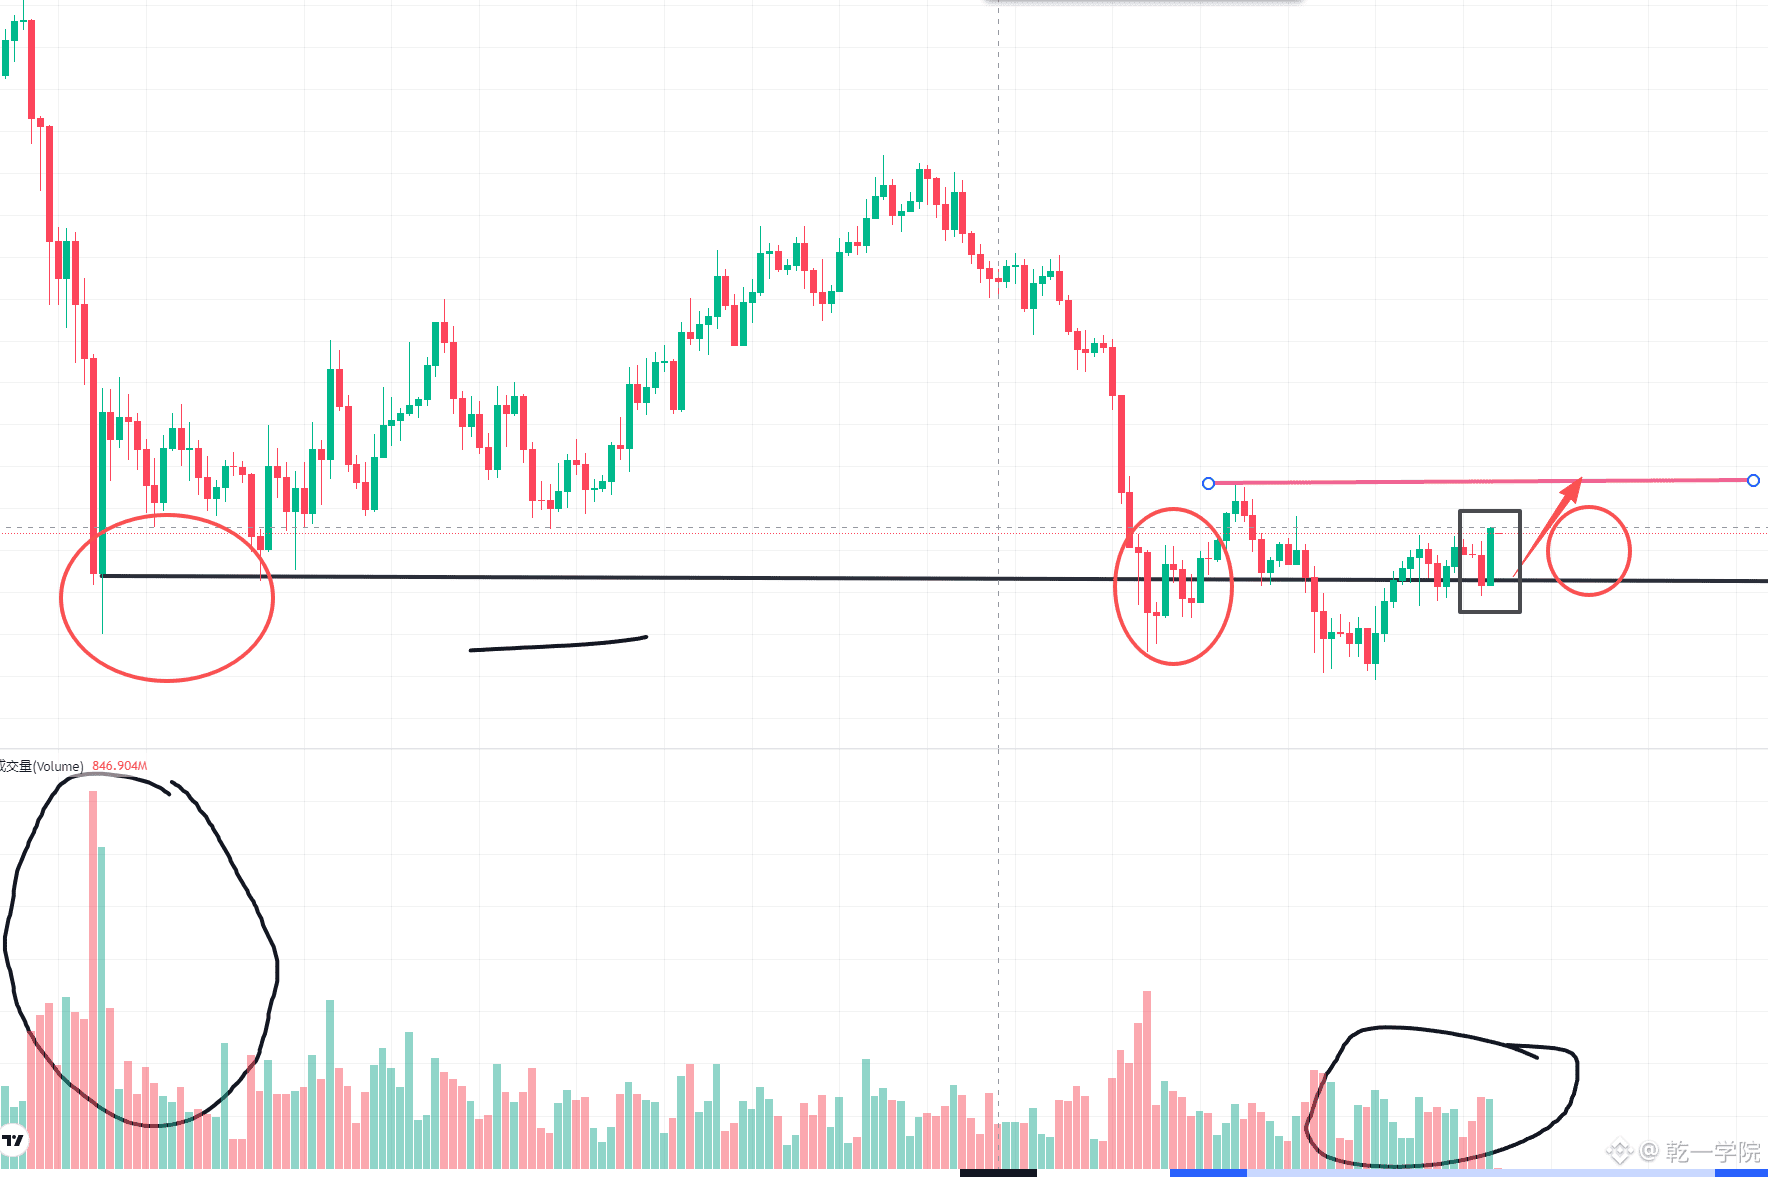
We can only say that Bitcoin hasn’t rebounded enough yet, compared to the drop to around 60,000 in February. The trading volume was huge back then. But for this drop to 58,000, the volume was pitifully small. So in the end, the current candles mainly resemble the first wave from February. The question is: if it holds above 63,000, what can we expect next—at minimum, it should go to 66,500 to 67,000. $BTC
Log in to explore more content