
Roaib_Bn
1.3k Posts

Roaib_Bn
Report
Block User
HOLDER | SELF BELIEVER | NOT A PERSONAL ADVISER | JUST AN EDUCATOR 📚 | Learning. Growing. Sharing Knowledge.Future in progress.
34 Following
9.9K+ Followers
13.8K+ Liked
Posts
All
Quotes
Videos
Live
·
--
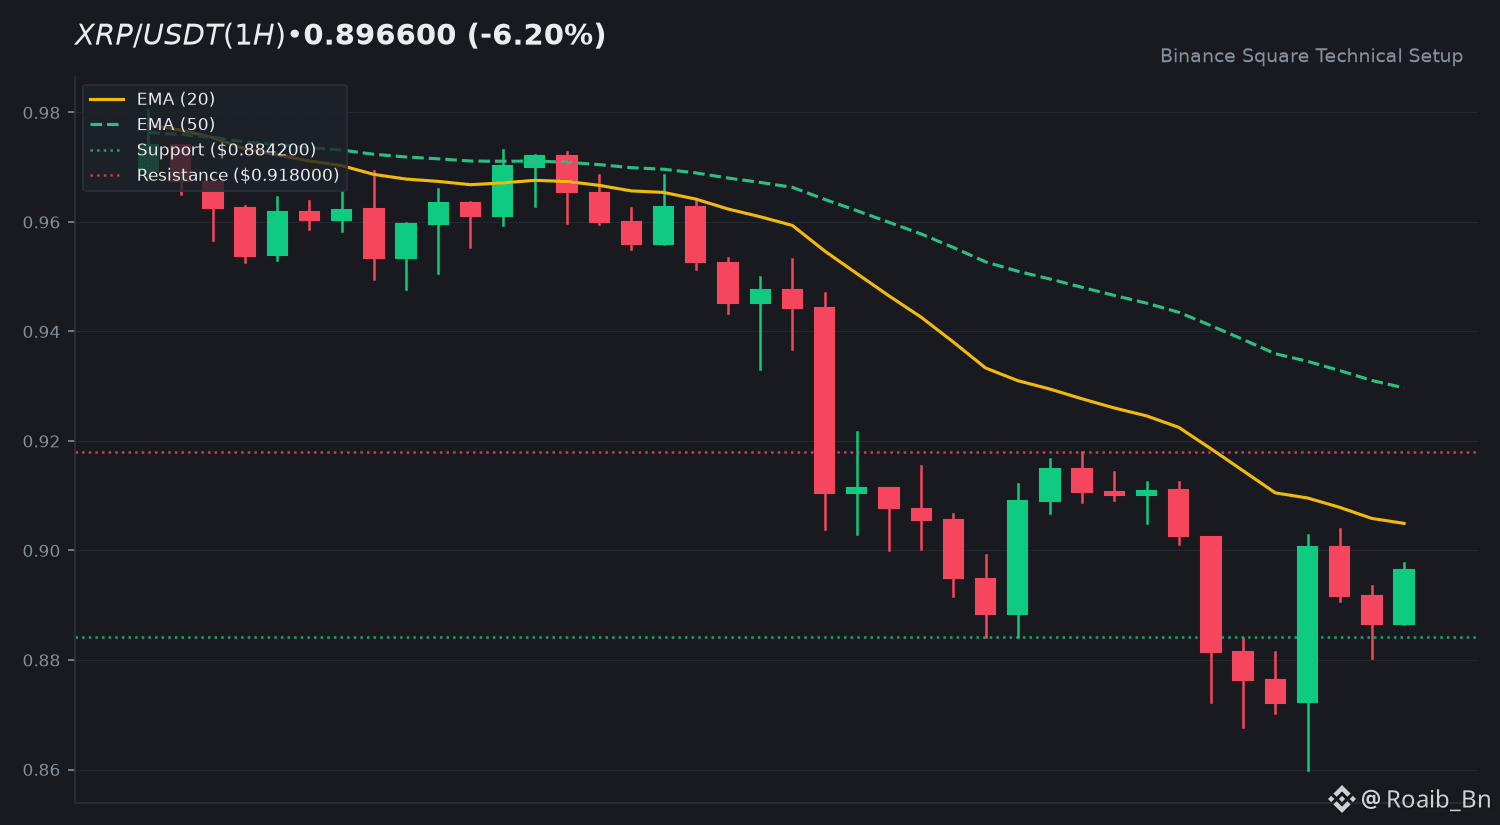
$XRP is currently undergoing a mild pullback as it trades near 0.8966. The market is showing some hesitation after recent volatility, leading to a period where participants are reevaluating the current price action before committing to a larger move in either direction.
On the hourly timeframe, the price is hovering just below the 20 EMA of 0.9050, which suggests that short-term momentum is currently leaning toward the bears. An RSI of 42.81 indicates that selling pressure is cooling off without entering oversold territory yet.
To see a shift in sentiment, we need to watch for a reclaim of the 0.9180 resistance level. Conversely, maintaining the structure above the immediate support at 0.8842 is essential to prevent further downside.
What are your thoughts on this level—are you holding your position or waiting for a clearer breakout?
Educational analysis only, not financial advice. DYOR.
$XRP #BinanceSquare #Crypto
$XRP is currently undergoing a mild pullback as it trades near 0.8966. The market is showing some hesitation after recent volatility, leading to a period where participants are reevaluating the current price action before committing to a larger move in either direction.
On the hourly timeframe, the price is hovering just below the 20 EMA of 0.9050, which suggests that short-term momentum is currently leaning toward the bears. An RSI of 42.81 indicates that selling pressure is cooling off without entering oversold territory yet.
To see a shift in sentiment, we need to watch for a reclaim of the 0.9180 resistance level. Conversely, maintaining the structure above the immediate support at 0.8842 is essential to prevent further downside.
What are your thoughts on this level—are you holding your position or waiting for a clearer breakout?
Educational analysis only, not financial advice. DYOR.
$XRP #BinanceSquare #Crypto
On the hourly timeframe, the price is hovering just below the 20 EMA of 0.9050, which suggests that short-term momentum is currently leaning toward the bears. An RSI of 42.81 indicates that selling pressure is cooling off without entering oversold territory yet.
To see a shift in sentiment, we need to watch for a reclaim of the 0.9180 resistance level. Conversely, maintaining the structure above the immediate support at 0.8842 is essential to prevent further downside.
What are your thoughts on this level—are you holding your position or waiting for a clearer breakout?
Educational analysis only, not financial advice. DYOR.
$XRP #BinanceSquare #Crypto
4
·
--
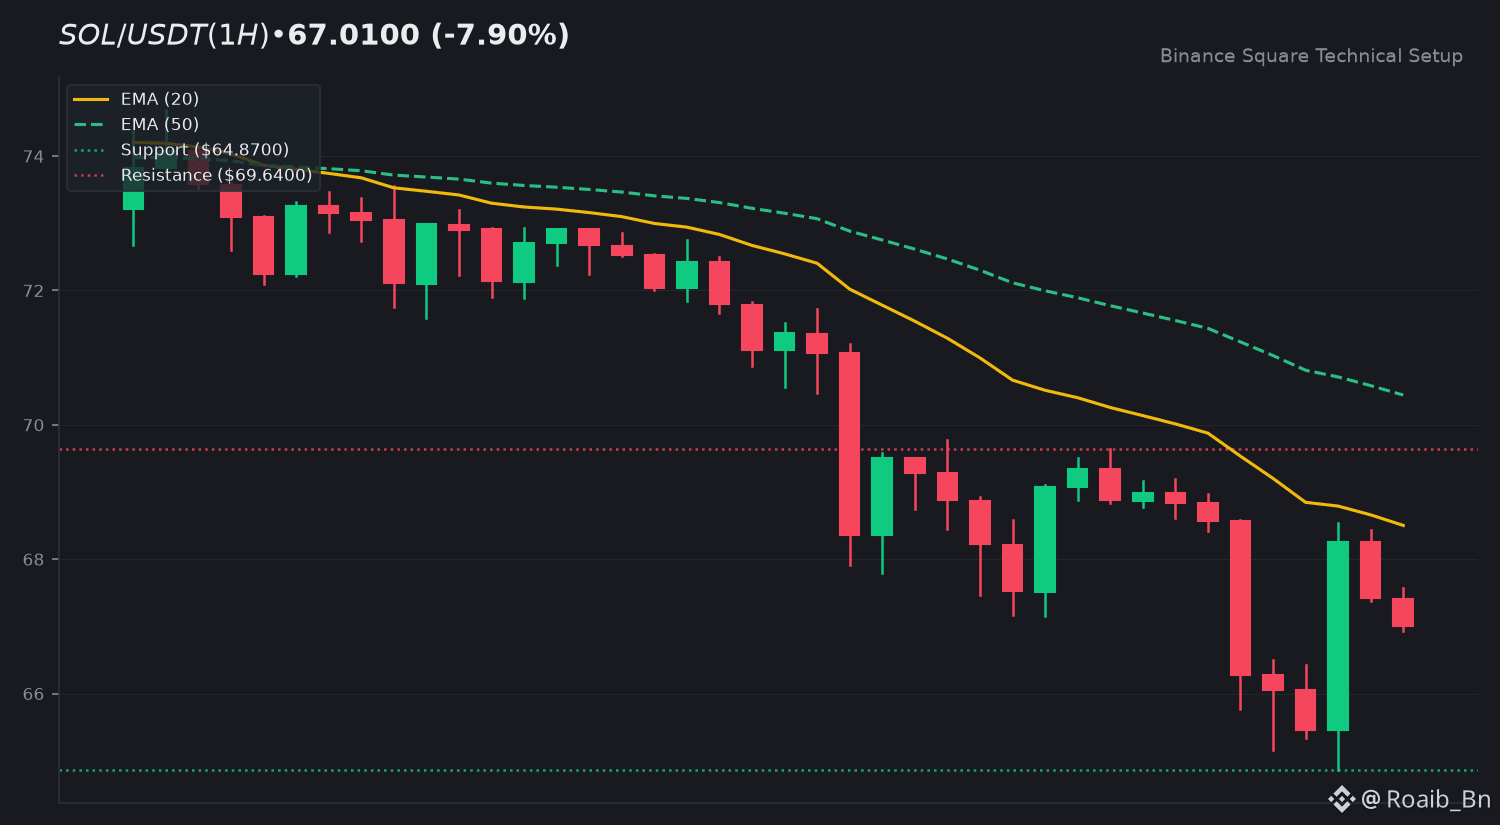
The market is seeing a notable pullback for $SOL today as it trades around the 67.01 level. This move reflects a broader cooling period across the sector after recent volatility, leaving many traders to reassess their positions as we navigate the current price action.
Looking at the hourly chart, the price is currently sitting below the 20 EMA of 68.50, which suggests that short term momentum remains tilted toward the bears. With the RSI hovering near 39.5, we are not quite in oversold territory yet, indicating that buyers are still cautious about stepping in too aggressively.
For the immediate outlook, all eyes are on the 69.64 resistance level as a key hurdle for any potential recovery. On the downside, maintaining the 64.87 support level is essential to keep the current market structure from weakening further.
How are you handling this consolidation phase—are you looking to accumulate at these support zones, or are you waiting for a clearer trend reversal before acting?
Educational analysis only, not financial advice. DYOR.
$SOL #BinanceSquare #Crypto
The market is seeing a notable pullback for $SOL today as it trades around the 67.01 level. This move reflects a broader cooling period across the sector after recent volatility, leaving many traders to reassess their positions as we navigate the current price action.
Looking at the hourly chart, the price is currently sitting below the 20 EMA of 68.50, which suggests that short term momentum remains tilted toward the bears. With the RSI hovering near 39.5, we are not quite in oversold territory yet, indicating that buyers are still cautious about stepping in too aggressively.
For the immediate outlook, all eyes are on the 69.64 resistance level as a key hurdle for any potential recovery. On the downside, maintaining the 64.87 support level is essential to keep the current market structure from weakening further.
How are you handling this consolidation phase—are you looking to accumulate at these support zones, or are you waiting for a clearer trend reversal before acting?
Educational analysis only, not financial advice. DYOR.
$SOL #BinanceSquare #Crypto
Looking at the hourly chart, the price is currently sitting below the 20 EMA of 68.50, which suggests that short term momentum remains tilted toward the bears. With the RSI hovering near 39.5, we are not quite in oversold territory yet, indicating that buyers are still cautious about stepping in too aggressively.
For the immediate outlook, all eyes are on the 69.64 resistance level as a key hurdle for any potential recovery. On the downside, maintaining the 64.87 support level is essential to keep the current market structure from weakening further.
How are you handling this consolidation phase—are you looking to accumulate at these support zones, or are you waiting for a clearer trend reversal before acting?
Educational analysis only, not financial advice. DYOR.
$SOL #BinanceSquare #Crypto
1
8
·
--
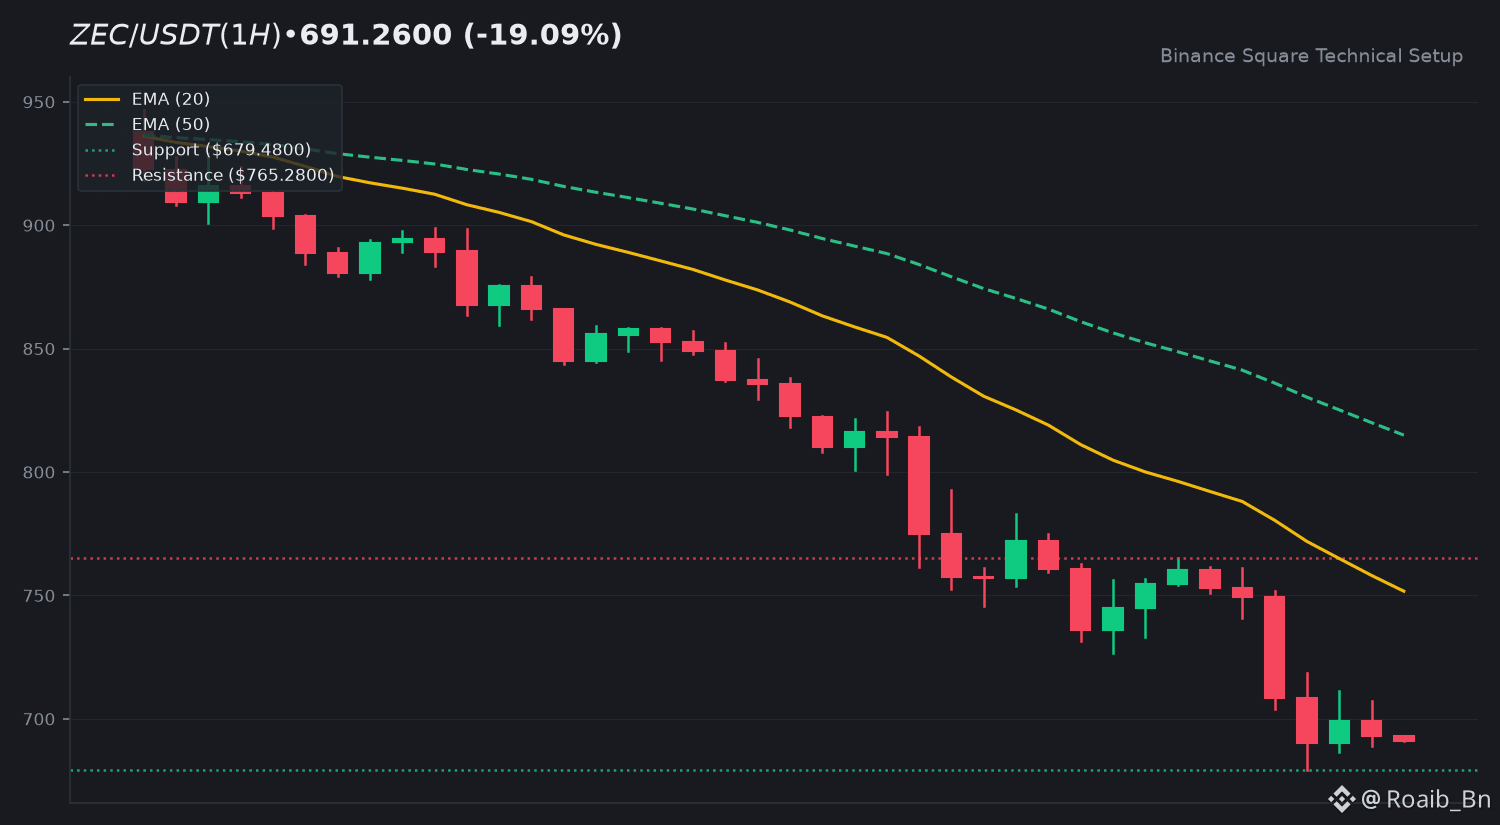
$ZEC is currently experiencing a sharp retracement, trading near 691.26 after a significant drop over the last twenty four hours. The market sentiment remains cautious as we see this downward pressure persist across the board.
On the hourly chart, the price is trading well below the 20 EMA of 751.72, signaling a clear bearish trend in the short term. With the RSI sitting at 22.75, the asset is deep in oversold territory, which often invites potential mean reversion attempts from buyers.
Looking ahead, we need to watch the 765.28 level as the primary resistance to clear for any bullish continuation. Meanwhile, the support level at 679.48 is critical to hold if we want to avoid further downside volatility.
How are you navigating this volatility—are you looking for a potential reversal here or waiting for more stability?
Educational analysis only, not financial advice. DYOR.
$ZEC #BinanceSquare #Crypto
$ZEC is currently experiencing a sharp retracement, trading near 691.26 after a significant drop over the last twenty four hours. The market sentiment remains cautious as we see this downward pressure persist across the board.
On the hourly chart, the price is trading well below the 20 EMA of 751.72, signaling a clear bearish trend in the short term. With the RSI sitting at 22.75, the asset is deep in oversold territory, which often invites potential mean reversion attempts from buyers.
Looking ahead, we need to watch the 765.28 level as the primary resistance to clear for any bullish continuation. Meanwhile, the support level at 679.48 is critical to hold if we want to avoid further downside volatility.
How are you navigating this volatility—are you looking for a potential reversal here or waiting for more stability?
Educational analysis only, not financial advice. DYOR.
$ZEC #BinanceSquare #Crypto
On the hourly chart, the price is trading well below the 20 EMA of 751.72, signaling a clear bearish trend in the short term. With the RSI sitting at 22.75, the asset is deep in oversold territory, which often invites potential mean reversion attempts from buyers.
Looking ahead, we need to watch the 765.28 level as the primary resistance to clear for any bullish continuation. Meanwhile, the support level at 679.48 is critical to hold if we want to avoid further downside volatility.
How are you navigating this volatility—are you looking for a potential reversal here or waiting for more stability?
Educational analysis only, not financial advice. DYOR.
$ZEC #BinanceSquare #Crypto
49
·
--
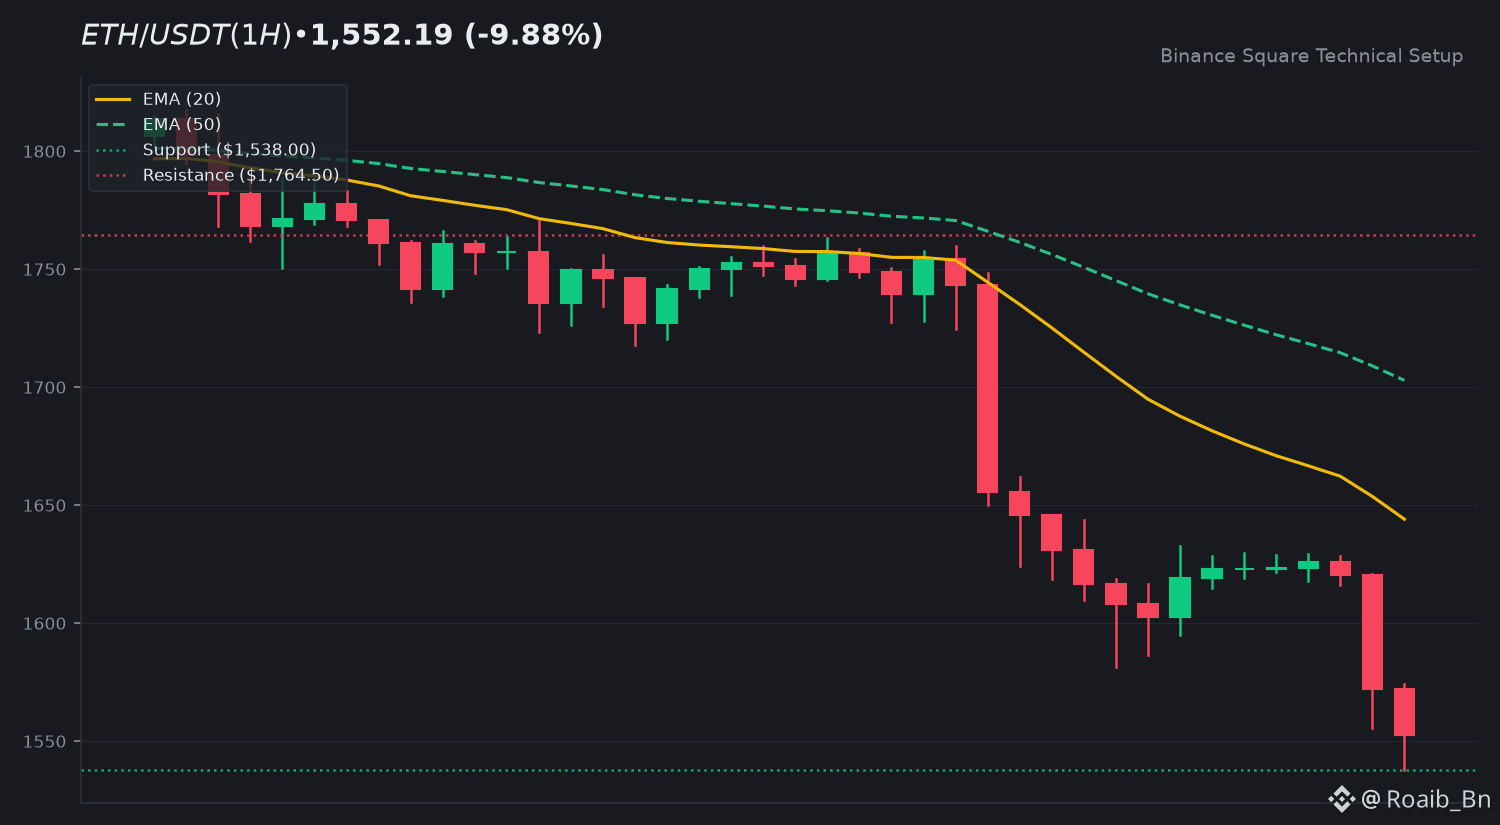
$ETH is currently facing a significant pullback, trading near 1,552.1900 after a sharp decline over the last twenty-four hours. The market sentiment remains cautious as we navigate this downward pressure.
On the hourly timeframe, the price is trading well below the 20 EMA of 1,644.0722, confirming a bearish trend. With the RSI sitting at 18.75, the asset is deeply oversold, suggesting that while momentum is weak, a short-term bounce could be possible if buyers step in.
Looking ahead, we need to watch the primary resistance at 1,764.5033 for any sign of a trend reversal. On the downside, maintaining the support level at 1,538.0000 is critical to prevent further structural damage to the chart.
What are your thoughts on this level—are you holding steady or waiting for a clearer breakout?
Educational analysis only, not financial advice. DYOR.
$ETH #BinanceSquare #Crypto
$ETH is currently facing a significant pullback, trading near 1,552.1900 after a sharp decline over the last twenty-four hours. The market sentiment remains cautious as we navigate this downward pressure.
On the hourly timeframe, the price is trading well below the 20 EMA of 1,644.0722, confirming a bearish trend. With the RSI sitting at 18.75, the asset is deeply oversold, suggesting that while momentum is weak, a short-term bounce could be possible if buyers step in.
Looking ahead, we need to watch the primary resistance at 1,764.5033 for any sign of a trend reversal. On the downside, maintaining the support level at 1,538.0000 is critical to prevent further structural damage to the chart.
What are your thoughts on this level—are you holding steady or waiting for a clearer breakout?
Educational analysis only, not financial advice. DYOR.
$ETH #BinanceSquare #Crypto
On the hourly timeframe, the price is trading well below the 20 EMA of 1,644.0722, confirming a bearish trend. With the RSI sitting at 18.75, the asset is deeply oversold, suggesting that while momentum is weak, a short-term bounce could be possible if buyers step in.
Looking ahead, we need to watch the primary resistance at 1,764.5033 for any sign of a trend reversal. On the downside, maintaining the support level at 1,538.0000 is critical to prevent further structural damage to the chart.
What are your thoughts on this level—are you holding steady or waiting for a clearer breakout?
Educational analysis only, not financial advice. DYOR.
$ETH #BinanceSquare #Crypto
48
·
--
Article
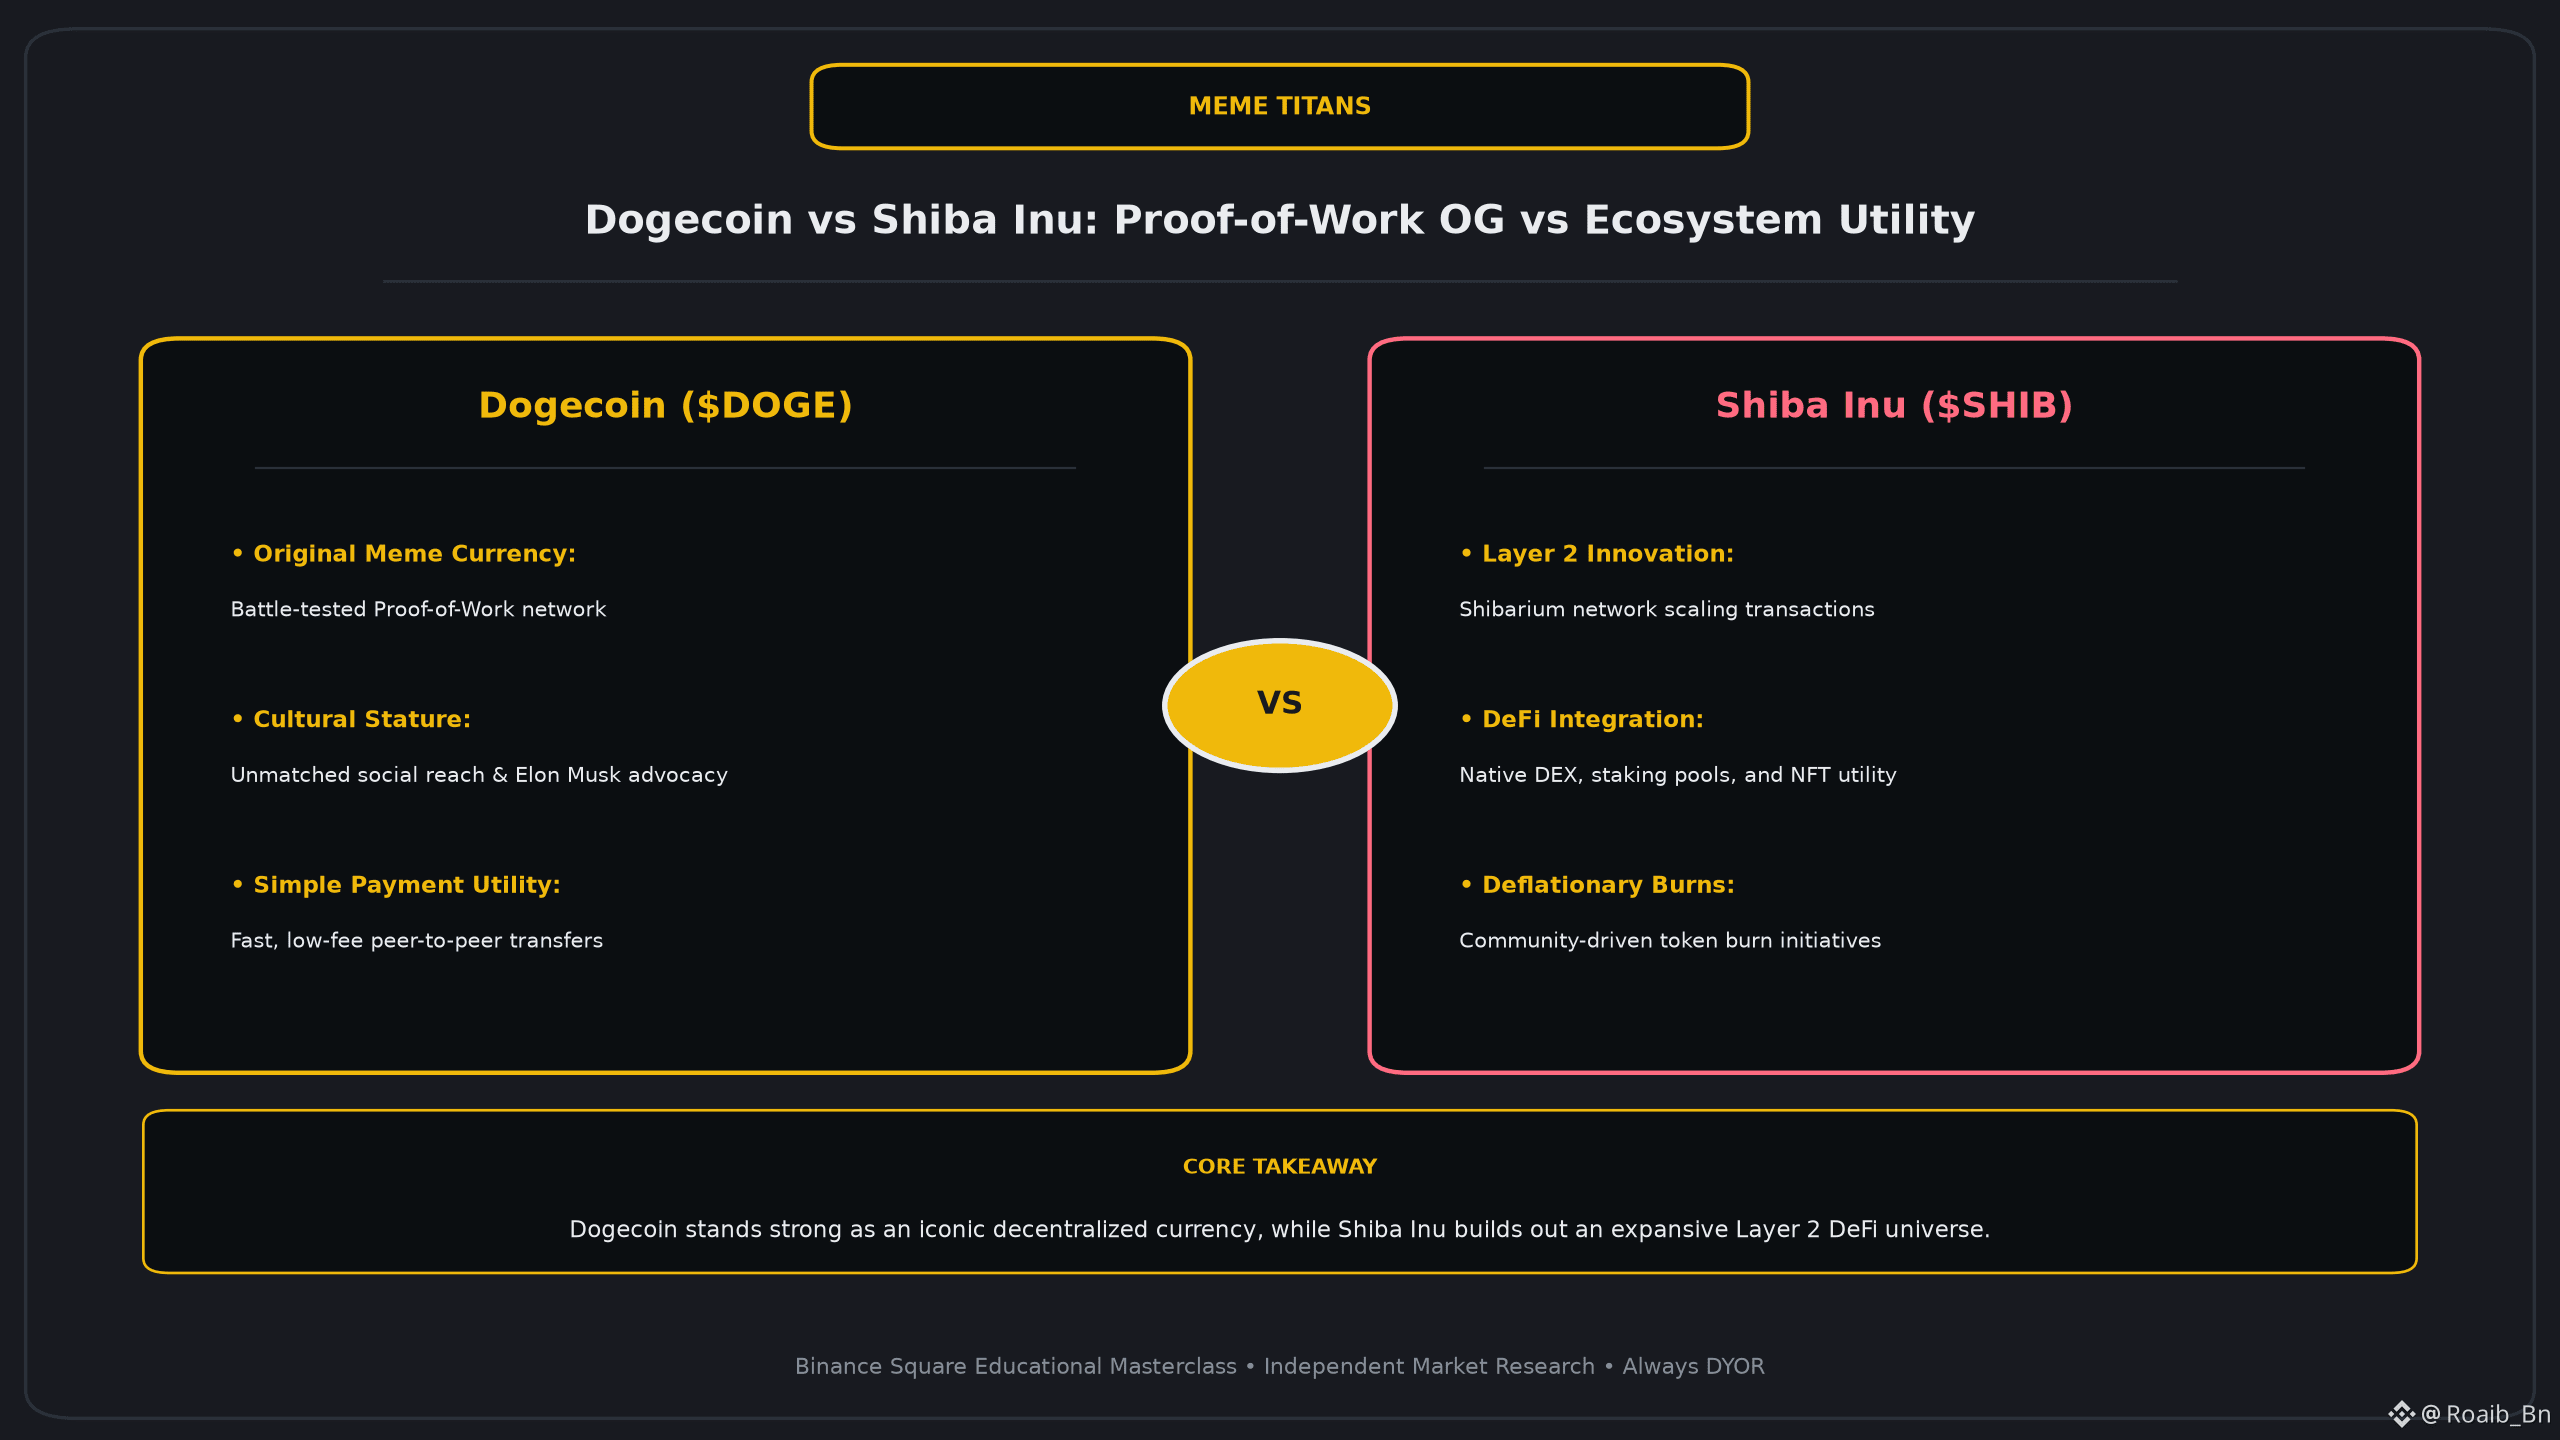
Dogecoin vs Shiba Inu: Proof-of-Work OG vs Ecosystem UtilityThe meme coin landscape has matured significantly since the retail frenzy of 2021. We are no longer just looking at internet jokes or speculative bubbles; we are looking at multi-billion dollar ecosystems that command massive market liquidity and institutional attention. For a trader, understanding the fundamental divide between $DOGE and $SHIB is essential for navigating this high-volatility niche. While both projects share a canine-themed origin, their underlying technologies and economic philosophies could not be more different.
DOGECOIN THE PROOF OF WORK POWERHOUSE
Dogecoin remains the undisputed king of the first generation of meme assets. Its primary strength lies in its simplicity and its battle-tested Proof-of-Work consensus mechanism. Unlike many modern tokens that rely on complex smart contracts, $DOGE functions as a pure decentralized currency. It is fast, cheap, and has achieved a level of cultural saturation that most projects can only dream of.
A key technical detail often overlooked is that Dogecoin is merge-mined with Litecoin, providing it with a robust security layer that makes it one of the most secure decentralized networks in the space. The advocacy from figures like Elon Musk provides a unique social layer that acts as a powerful catalyst during market upswings. It is the gold standard for peer-to-peer meme transfers, focusing on being a medium of exchange rather than a complex technological platform.
SHIBA INU THE UTILITY DRIVEN ECOSYSTEM
On the other side of the fence, Shiba Inu has undergone a massive transformation from a simple ERC-20 token into a sophisticated DeFi ecosystem. The launch of Shibarium, their dedicated Layer 2 scaling solution, was a definitive turning point. It allowed $SHIB to move away from the high gas fees of the Ethereum mainnet and create a home for decentralized exchanges, staking pools, and NFT utility.
The Shiba Inu ecosystem is built on complexity and value capture. With the integration of secondary tokens like BONE and LEASH, the project has created a multi-layered economy that rewards long-term participants. Furthermore, the community-driven burn mechanisms provide a deflationary narrative that contrasts sharply with the fixed annual issuance of Dogecoin. Shiba Inu is effectively an infrastructure play, trying to capture value through the adoption of its Layer 2 network and decentralized applications.
STRATEGIC POSITIONING AND VERDICT
When we compare the two, we see a clash of philosophies that dictates how they fit into a disciplined portfolio. Dogecoin is the OG commodity of the meme world. It is the asset you look toward when you want exposure to broad market sentiment and the raw power of social momentum. Its simplicity is its greatest defense against technical vulnerabilities.
Shiba Inu represents a bet on the successful execution of a technological roadmap. It appeals to the trader who believes that meme coins must evolve into functional utility platforms to survive in the long term. While $DOGE offers the stability of a sovereign blockchain, $SHIB offers the potential of an expanding DeFi universe.
As we move deeper into this market cycle, which path do you find more compelling? Do you prefer the simplicity and historical weight of the original Dogecoin, or are you looking for the technological expansion and burn mechanics offered by the Shiba Inu ecosystem? Share your analysis in the comments below.
This analysis is for educational purposes only and does not constitute financial advice.
Dogecoin vs Shiba Inu: Proof-of-Work OG vs Ecosystem Utility
The meme coin landscape has matured significantly since the retail frenzy of 2021. We are no longer just looking at internet jokes or speculative bubbles; we are looking at multi-billion dollar ecosystems that command massive market liquidity and institutional attention. For a trader, understanding the fundamental divide between $DOGE and $SHIB is essential for navigating this high-volatility niche. While both projects share a canine-themed origin, their underlying technologies and economic philosophies could not be more different.
DOGECOIN THE PROOF OF WORK POWERHOUSE
Dogecoin remains the undisputed king of the first generation of meme assets. Its primary strength lies in its simplicity and its battle-tested Proof-of-Work consensus mechanism. Unlike many modern tokens that rely on complex smart contracts, $DOGE functions as a pure decentralized currency. It is fast, cheap, and has achieved a level of cultural saturation that most projects can only dream of.
A key technical detail often overlooked is that Dogecoin is merge-mined with Litecoin, providing it with a robust security layer that makes it one of the most secure decentralized networks in the space. The advocacy from figures like Elon Musk provides a unique social layer that acts as a powerful catalyst during market upswings. It is the gold standard for peer-to-peer meme transfers, focusing on being a medium of exchange rather than a complex technological platform.
SHIBA INU THE UTILITY DRIVEN ECOSYSTEM
On the other side of the fence, Shiba Inu has undergone a massive transformation from a simple ERC-20 token into a sophisticated DeFi ecosystem. The launch of Shibarium, their dedicated Layer 2 scaling solution, was a definitive turning point. It allowed $SHIB to move away from the high gas fees of the Ethereum mainnet and create a home for decentralized exchanges, staking pools, and NFT utility.
The Shiba Inu ecosystem is built on complexity and value capture. With the integration of secondary tokens like BONE and LEASH, the project has created a multi-layered economy that rewards long-term participants. Furthermore, the community-driven burn mechanisms provide a deflationary narrative that contrasts sharply with the fixed annual issuance of Dogecoin. Shiba Inu is effectively an infrastructure play, trying to capture value through the adoption of its Layer 2 network and decentralized applications.
STRATEGIC POSITIONING AND VERDICT
When we compare the two, we see a clash of philosophies that dictates how they fit into a disciplined portfolio. Dogecoin is the OG commodity of the meme world. It is the asset you look toward when you want exposure to broad market sentiment and the raw power of social momentum. Its simplicity is its greatest defense against technical vulnerabilities.
Shiba Inu represents a bet on the successful execution of a technological roadmap. It appeals to the trader who believes that meme coins must evolve into functional utility platforms to survive in the long term. While $DOGE offers the stability of a sovereign blockchain, $SHIB offers the potential of an expanding DeFi universe.
As we move deeper into this market cycle, which path do you find more compelling? Do you prefer the simplicity and historical weight of the original Dogecoin, or are you looking for the technological expansion and burn mechanics offered by the Shiba Inu ecosystem? Share your analysis in the comments below.
This analysis is for educational purposes only and does not constitute financial advice.
DOGECOIN THE PROOF OF WORK POWERHOUSE
Dogecoin remains the undisputed king of the first generation of meme assets. Its primary strength lies in its simplicity and its battle-tested Proof-of-Work consensus mechanism. Unlike many modern tokens that rely on complex smart contracts, $DOGE functions as a pure decentralized currency. It is fast, cheap, and has achieved a level of cultural saturation that most projects can only dream of.
A key technical detail often overlooked is that Dogecoin is merge-mined with Litecoin, providing it with a robust security layer that makes it one of the most secure decentralized networks in the space. The advocacy from figures like Elon Musk provides a unique social layer that acts as a powerful catalyst during market upswings. It is the gold standard for peer-to-peer meme transfers, focusing on being a medium of exchange rather than a complex technological platform.
SHIBA INU THE UTILITY DRIVEN ECOSYSTEM
On the other side of the fence, Shiba Inu has undergone a massive transformation from a simple ERC-20 token into a sophisticated DeFi ecosystem. The launch of Shibarium, their dedicated Layer 2 scaling solution, was a definitive turning point. It allowed $SHIB to move away from the high gas fees of the Ethereum mainnet and create a home for decentralized exchanges, staking pools, and NFT utility.
The Shiba Inu ecosystem is built on complexity and value capture. With the integration of secondary tokens like BONE and LEASH, the project has created a multi-layered economy that rewards long-term participants. Furthermore, the community-driven burn mechanisms provide a deflationary narrative that contrasts sharply with the fixed annual issuance of Dogecoin. Shiba Inu is effectively an infrastructure play, trying to capture value through the adoption of its Layer 2 network and decentralized applications.
STRATEGIC POSITIONING AND VERDICT
When we compare the two, we see a clash of philosophies that dictates how they fit into a disciplined portfolio. Dogecoin is the OG commodity of the meme world. It is the asset you look toward when you want exposure to broad market sentiment and the raw power of social momentum. Its simplicity is its greatest defense against technical vulnerabilities.
Shiba Inu represents a bet on the successful execution of a technological roadmap. It appeals to the trader who believes that meme coins must evolve into functional utility platforms to survive in the long term. While $DOGE offers the stability of a sovereign blockchain, $SHIB offers the potential of an expanding DeFi universe.
As we move deeper into this market cycle, which path do you find more compelling? Do you prefer the simplicity and historical weight of the original Dogecoin, or are you looking for the technological expansion and burn mechanics offered by the Shiba Inu ecosystem? Share your analysis in the comments below.
This analysis is for educational purposes only and does not constitute financial advice.
69
·
--
just testing red packets feature more will come in future
just testing red packets feature more will come in future

more in future
From Roaib_Bn
25
·
--
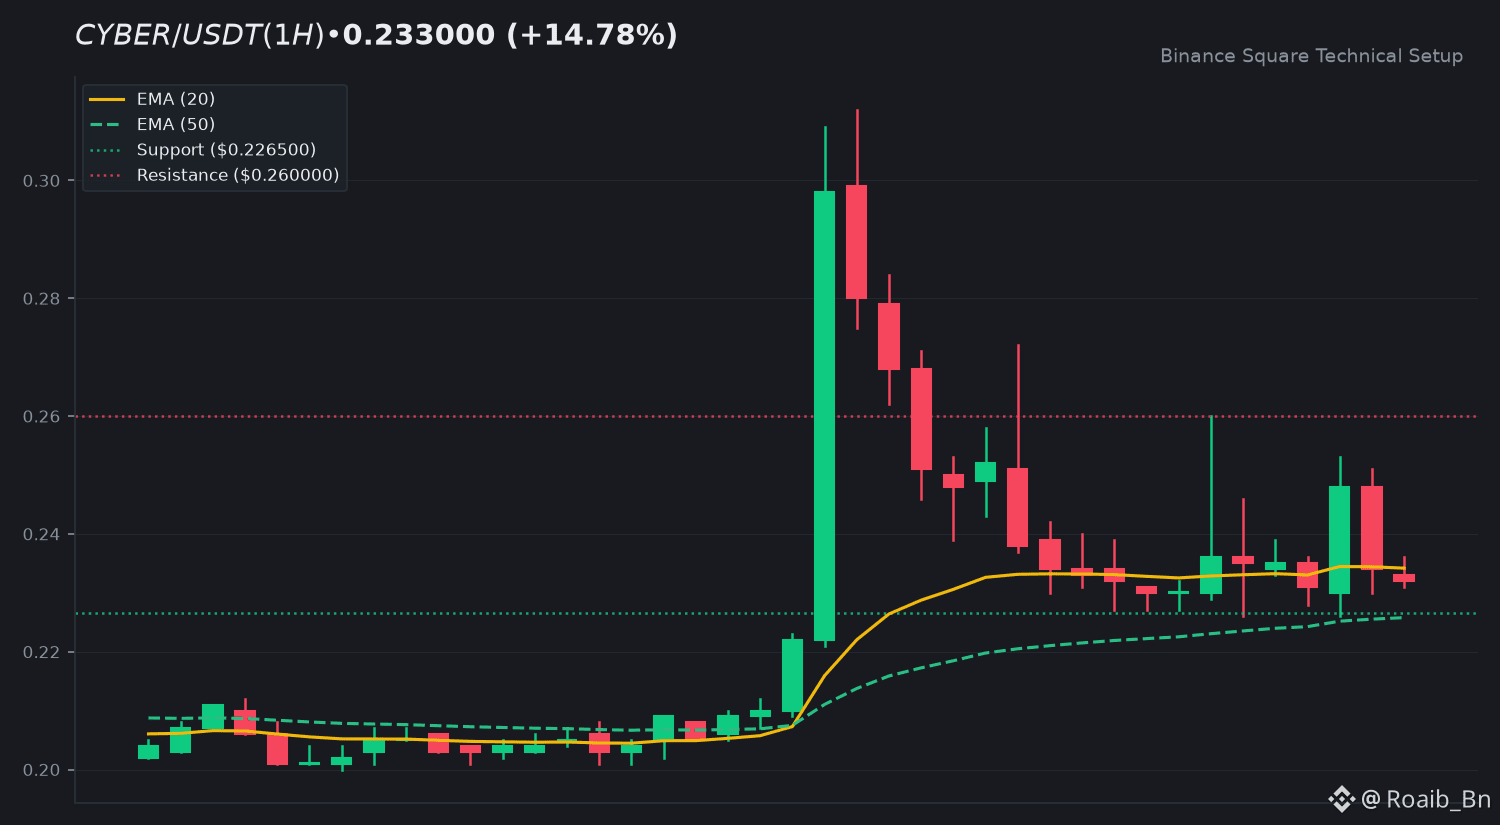
The market is feeling heavy this morning as the bears have firmly taken control of the session. With only 4 gainers against 46 losers in the top 50, the breadth is decisively negative. Broad selling pressure is hitting across the board, signaling a lack of appetite for risk at these current levels.
Volume remains concentrated in the major pairs, totaling over 5.4 billion USDT. $BTC is down 4.1 percent while $ETH is facing a sharper 6.3 percent correction. SOL is also struggling with a 4.5 percent drop, but the most aggressive move comes from ZEC which has shed 14.1 percent.
Prioritize capital preservation over chasing falling knives. Are you looking to hedge your positions or waiting for a clear floor?
Educational analysis only, not financial advice. DYOR.
BinanceSquare #CryptoMarket
The market is feeling heavy this morning as the bears have firmly taken control of the session. With only 4 gainers against 46 losers in the top 50, the breadth is decisively negative. Broad selling pressure is hitting across the board, signaling a lack of appetite for risk at these current levels.
Volume remains concentrated in the major pairs, totaling over 5.4 billion USDT. $BTC is down 4.1 percent while $ETH is facing a sharper 6.3 percent correction. SOL is also struggling with a 4.5 percent drop, but the most aggressive move comes from ZEC which has shed 14.1 percent.
Prioritize capital preservation over chasing falling knives. Are you looking to hedge your positions or waiting for a clear floor?
Educational analysis only, not financial advice. DYOR.
BinanceSquare #CryptoMarket
Volume remains concentrated in the major pairs, totaling over 5.4 billion USDT. $BTC is down 4.1 percent while $ETH is facing a sharper 6.3 percent correction. SOL is also struggling with a 4.5 percent drop, but the most aggressive move comes from ZEC which has shed 14.1 percent.
Prioritize capital preservation over chasing falling knives. Are you looking to hedge your positions or waiting for a clear floor?
Educational analysis only, not financial advice. DYOR.
BinanceSquare #CryptoMarket
90
·
--
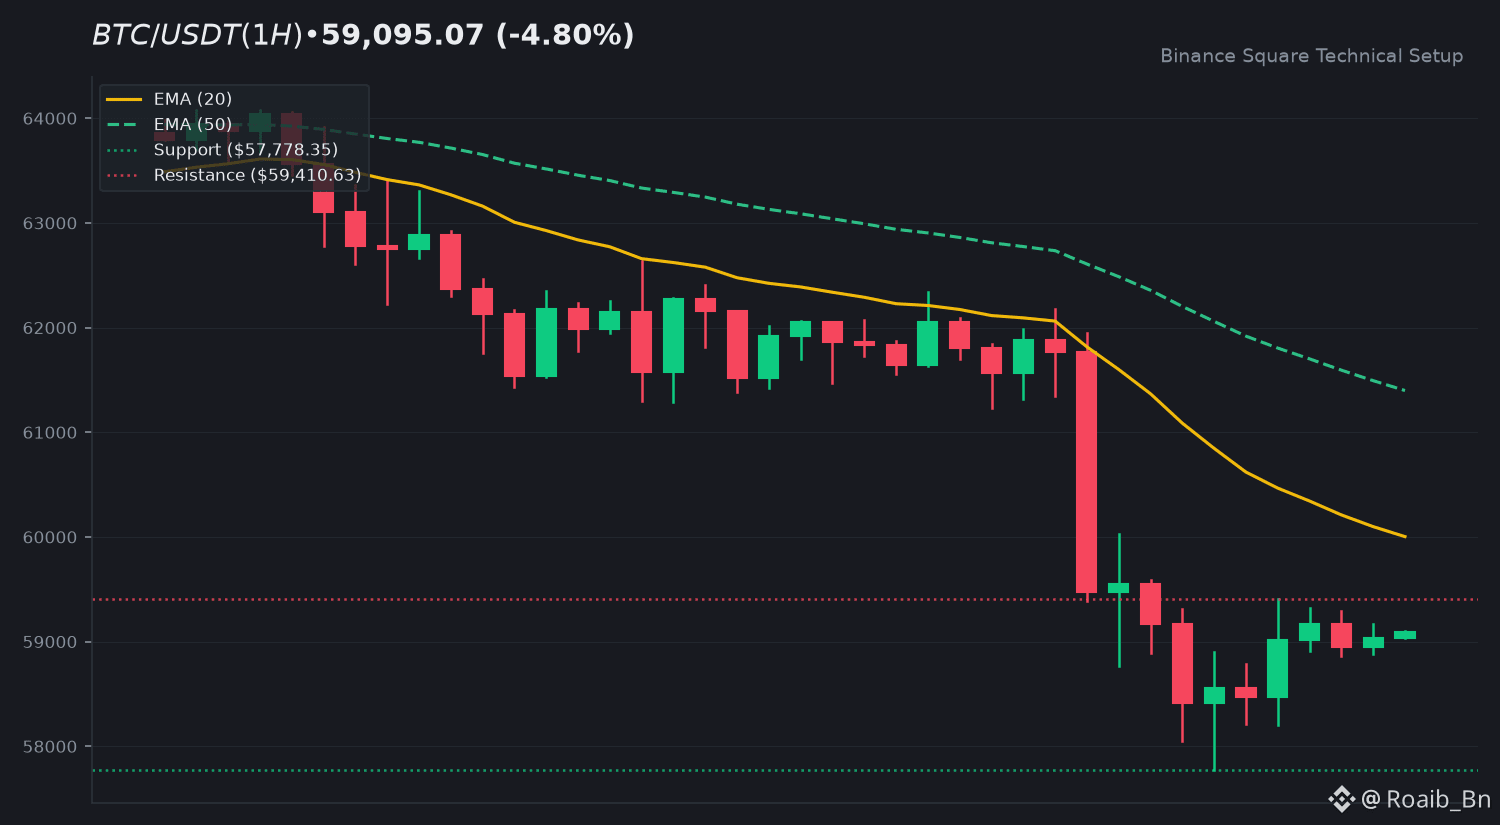
Bitcoin is currently testing key support levels at $59,095.07, marking a decline of 4.80 percent. The price action has slipped below the 50-day EMA, signaling a shift in momentum that traders are watching closely. Maintaining this level is vital to avoid further downside pressure in the coming sessions.
Ethereum is showing deeper weakness, trading at $1,624.79 with a 7.43 percent drop. The relative strength of ETH against $BTC has deteriorated significantly, suggesting that capital is flowing out of altcoins faster during this retracement.
The broader market direction remains uncertain as we wait for a consolidation phase. Which asset do you expect to lead the recovery if the selling pressure eases?
Educational analysis only, not financial advice. DYOR.
$BTC ETH #BinanceSquare #CryptoMarket
Bitcoin is currently testing key support levels at $59,095.07, marking a decline of 4.80 percent. The price action has slipped below the 50-day EMA, signaling a shift in momentum that traders are watching closely. Maintaining this level is vital to avoid further downside pressure in the coming sessions.
Ethereum is showing deeper weakness, trading at $1,624.79 with a 7.43 percent drop. The relative strength of ETH against $BTC has deteriorated significantly, suggesting that capital is flowing out of altcoins faster during this retracement.
The broader market direction remains uncertain as we wait for a consolidation phase. Which asset do you expect to lead the recovery if the selling pressure eases?
Educational analysis only, not financial advice. DYOR.
$BTC ETH #BinanceSquare #CryptoMarket
Ethereum is showing deeper weakness, trading at $1,624.79 with a 7.43 percent drop. The relative strength of ETH against $BTC has deteriorated significantly, suggesting that capital is flowing out of altcoins faster during this retracement.
The broader market direction remains uncertain as we wait for a consolidation phase. Which asset do you expect to lead the recovery if the selling pressure eases?
Educational analysis only, not financial advice. DYOR.
$BTC ETH #BinanceSquare #CryptoMarket
85
·
--
Article
The Rise of Autonomous AI Agents in Crypto: On-Chain Finance UnleashedThe intersection of artificial intelligence and decentralized finance has evolved far beyond the speculative meme phase of early cycles. We are currently witnessing a structural transformation where autonomous software agents are moving from passive analytical tools to active, self-sovereign on-chain economic participants. For crypto market participants, understanding this paradigm shift is no longer optional; it represents a fundamental re-architecture of how capital flows across liquidity pools, execution layers, and decentralized protocols.
THE EMERGENCE OF MACHINE-TO-MACHINE ECONOMIES
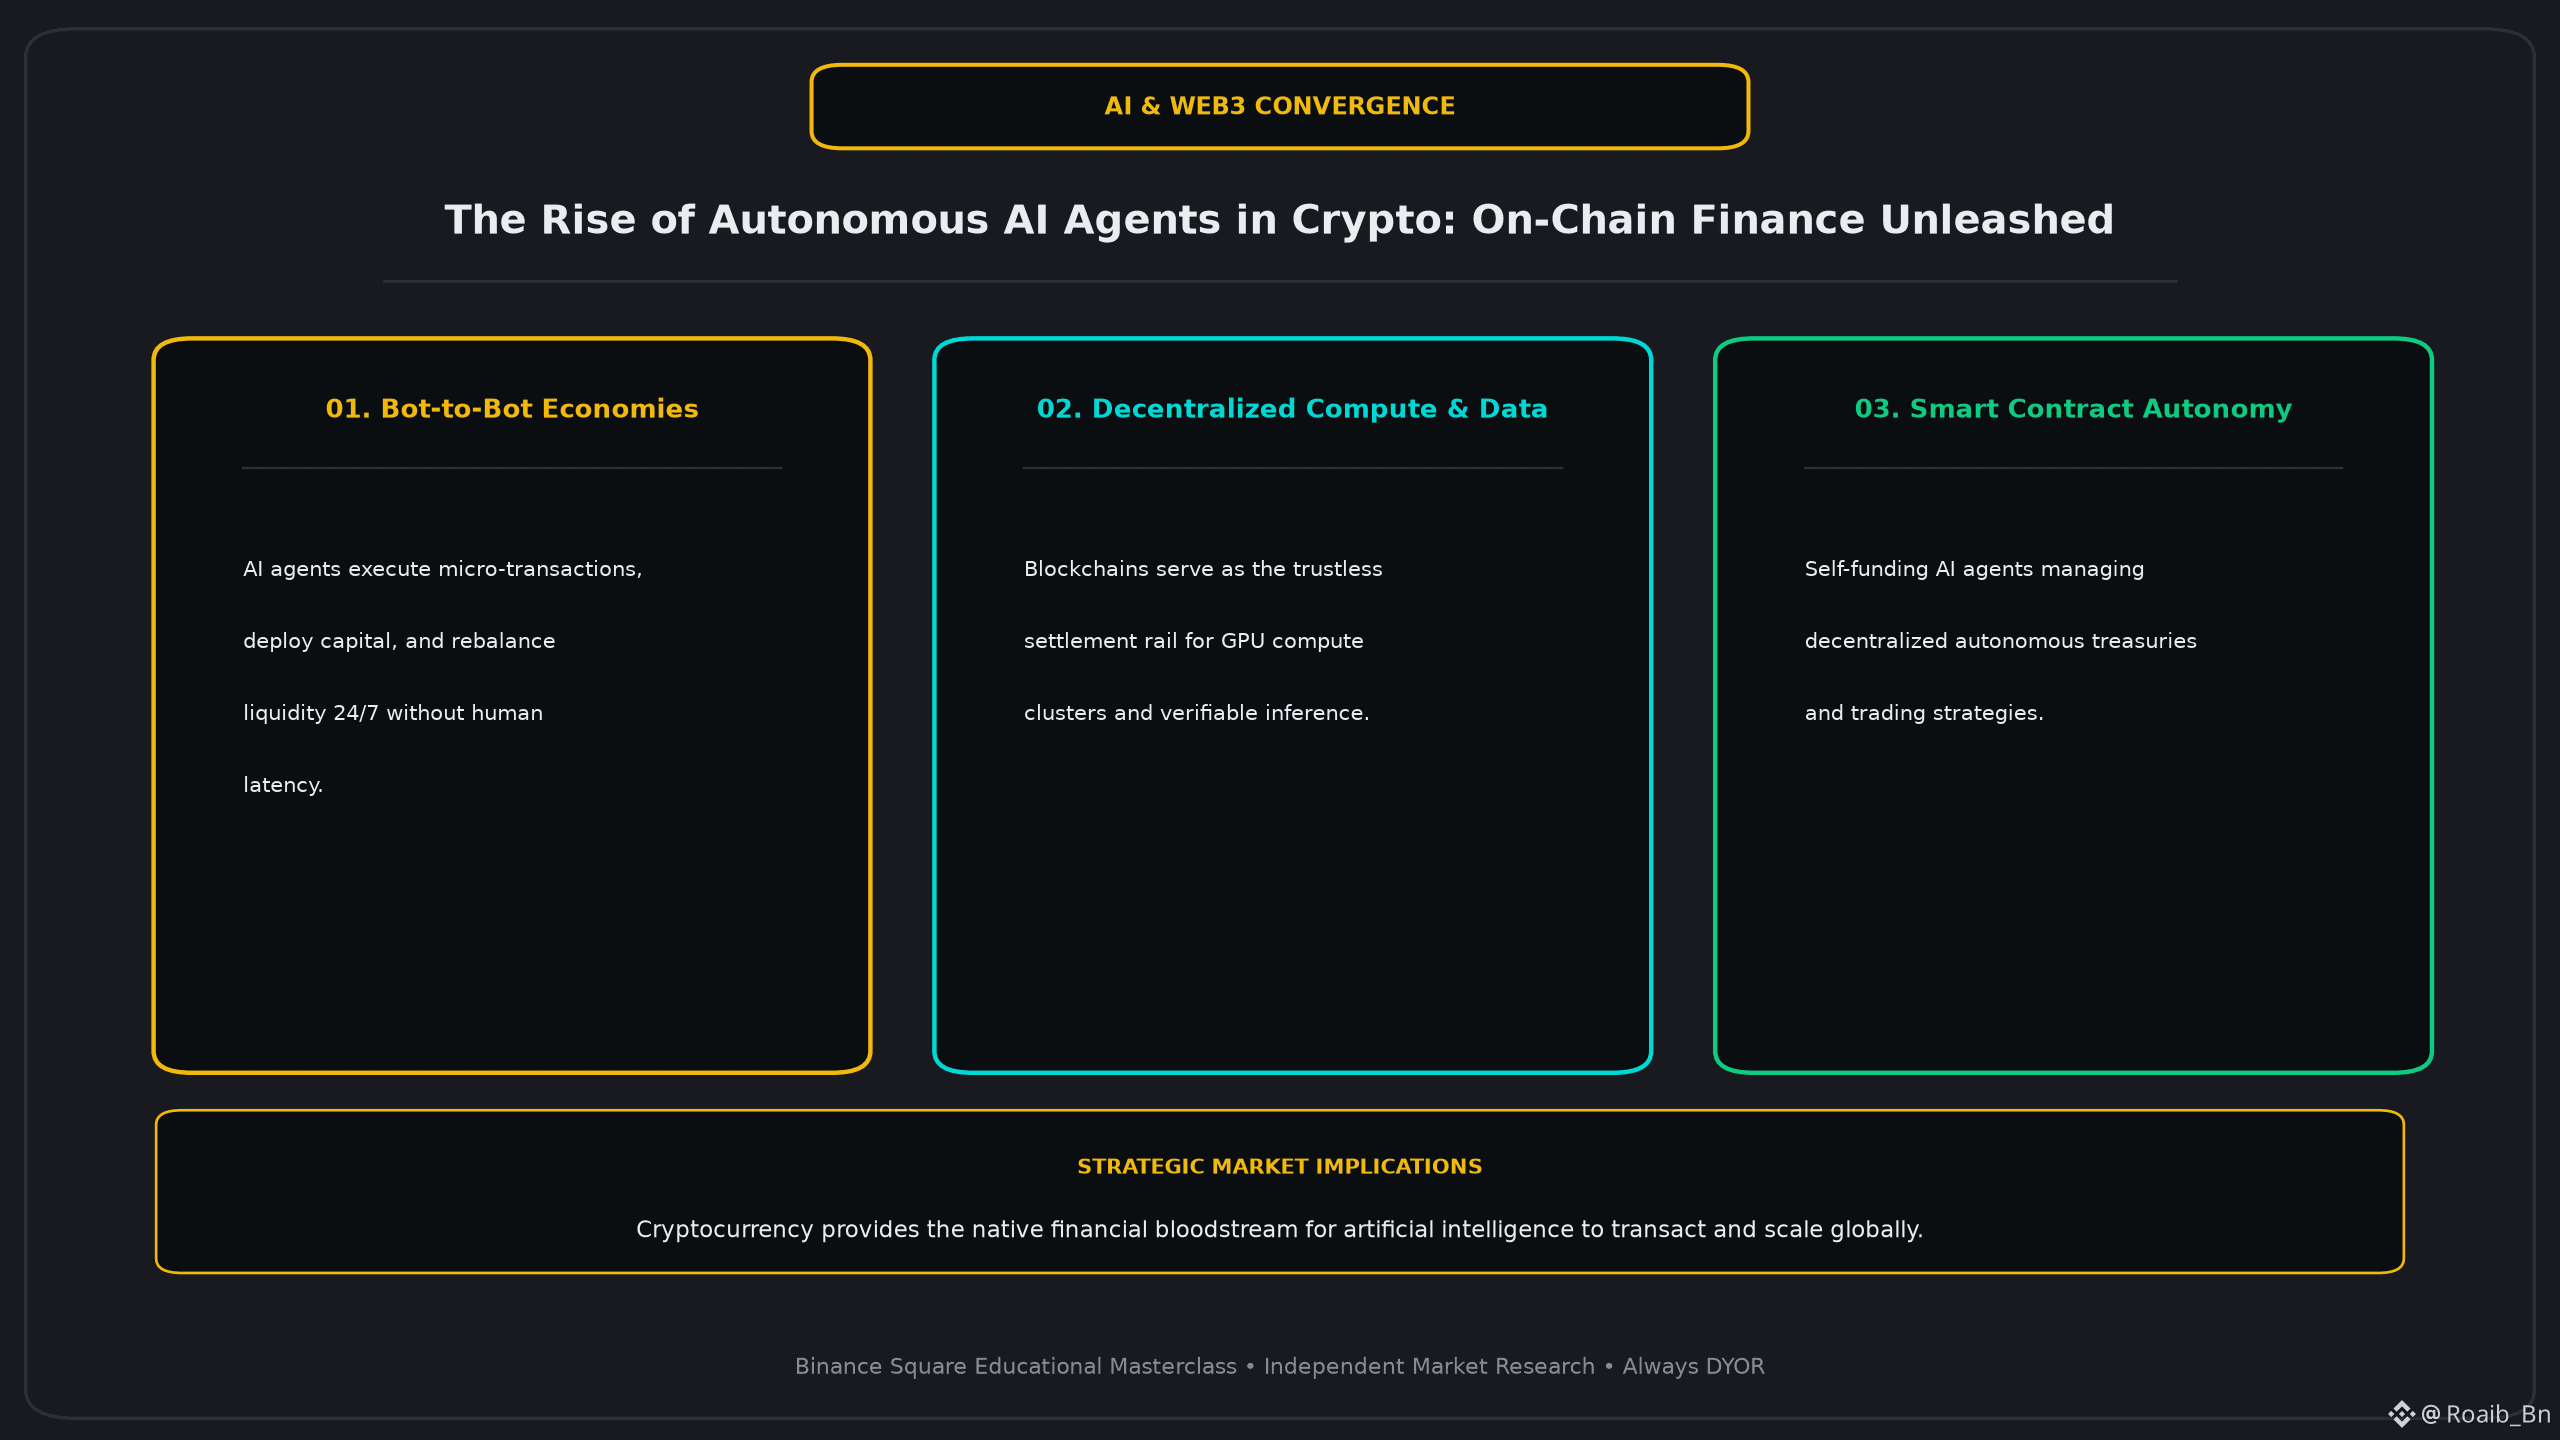
Traditional banking rails were never engineered for automated micro-transactions. An autonomous AI model cannot open a traditional bank account, submit identity documents, or wait three business days for clearinghouse settlements. Blockchains, however, offer permissionless, programmable, and deterministic settlement rails natively compatible with autonomous code.
Today, intelligent agents are equipped with their own non-custodial wallets, deploying capital across automated market makers, executing programmatic cross-chain arbitrage, and rebalancing collateral positions 24 hours a day without human latency. Networks emphasizing chain abstraction, such as $NEAR , are positioning themselves as foundational infrastructure where AI models can coordinate complex multi-chain execution through single, simplified user and machine interfaces. In this environment, liquidity optimization ceases to rely on human reaction times, moving toward perpetual algorithmic market efficiency.
DECENTRALIZED COMPUTE AND THE SETTLEMENT LAYER
Beyond capital deployment, autonomous agents require verifiable inference and trustless compute markets to function without centralized bottlenecks. Platforms driving collective intelligence, such as $FET and the broader decentralized AI infrastructure cohort, are building decentralized coordination layers where independent agents interact, purchase GPU compute, exchange proprietary datasets, and execute complex workflows without centralized intermediaries.
When an AI agent hires another AI agent to crunch market datasets or verify zero-knowledge proofs, crypto is the only viable settlement medium. Smart contracts act as programmatic escrow services, ensuring that compute resources are delivered before payment is released. This creates an organic feedback loop: as the demand for autonomous automation expands, the underlying transactional velocity across verifiable settlement layers accelerates proportionally.
STRATEGIC PORTFOLIO POSITIONING
For disciplined market participants, navigating the AI narrative requires distinguishing between superficial marketing wrappers and real infrastructural moats. The true value accrual of the autonomous agent trend rests on two core pillars: protocols providing the execution environments that abstract complexity, and decentralized networks providing the computational and agent-coordination bandwidth.
Rather than chasing short-term
The Rise of Autonomous AI Agents in Crypto: On-Chain Finance Unleashed
The intersection of artificial intelligence and decentralized finance has evolved far beyond the speculative meme phase of early cycles. We are currently witnessing a structural transformation where autonomous software agents are moving from passive analytical tools to active, self-sovereign on-chain economic participants. For crypto market participants, understanding this paradigm shift is no longer optional; it represents a fundamental re-architecture of how capital flows across liquidity pools, execution layers, and decentralized protocols.
THE EMERGENCE OF MACHINE-TO-MACHINE ECONOMIES
Traditional banking rails were never engineered for automated micro-transactions. An autonomous AI model cannot open a traditional bank account, submit identity documents, or wait three business days for clearinghouse settlements. Blockchains, however, offer permissionless, programmable, and deterministic settlement rails natively compatible with autonomous code.
Today, intelligent agents are equipped with their own non-custodial wallets, deploying capital across automated market makers, executing programmatic cross-chain arbitrage, and rebalancing collateral positions 24 hours a day without human latency. Networks emphasizing chain abstraction, such as $NEAR , are positioning themselves as foundational infrastructure where AI models can coordinate complex multi-chain execution through single, simplified user and machine interfaces. In this environment, liquidity optimization ceases to rely on human reaction times, moving toward perpetual algorithmic market efficiency.
DECENTRALIZED COMPUTE AND THE SETTLEMENT LAYER
Beyond capital deployment, autonomous agents require verifiable inference and trustless compute markets to function without centralized bottlenecks. Platforms driving collective intelligence, such as $FET and the broader decentralized AI infrastructure cohort, are building decentralized coordination layers where independent agents interact, purchase GPU compute, exchange proprietary datasets, and execute complex workflows without centralized intermediaries.
When an AI agent hires another AI agent to crunch market datasets or verify zero-knowledge proofs, crypto is the only viable settlement medium. Smart contracts act as programmatic escrow services, ensuring that compute resources are delivered before payment is released. This creates an organic feedback loop: as the demand for autonomous automation expands, the underlying transactional velocity across verifiable settlement layers accelerates proportionally.
STRATEGIC PORTFOLIO POSITIONING
For disciplined market participants, navigating the AI narrative requires distinguishing between superficial marketing wrappers and real infrastructural moats. The true value accrual of the autonomous agent trend rests on two core pillars: protocols providing the execution environments that abstract complexity, and decentralized networks providing the computational and agent-coordination bandwidth.
Rather than chasing short-term
THE EMERGENCE OF MACHINE-TO-MACHINE ECONOMIES
Traditional banking rails were never engineered for automated micro-transactions. An autonomous AI model cannot open a traditional bank account, submit identity documents, or wait three business days for clearinghouse settlements. Blockchains, however, offer permissionless, programmable, and deterministic settlement rails natively compatible with autonomous code.
Today, intelligent agents are equipped with their own non-custodial wallets, deploying capital across automated market makers, executing programmatic cross-chain arbitrage, and rebalancing collateral positions 24 hours a day without human latency. Networks emphasizing chain abstraction, such as $NEAR , are positioning themselves as foundational infrastructure where AI models can coordinate complex multi-chain execution through single, simplified user and machine interfaces. In this environment, liquidity optimization ceases to rely on human reaction times, moving toward perpetual algorithmic market efficiency.
DECENTRALIZED COMPUTE AND THE SETTLEMENT LAYER
Beyond capital deployment, autonomous agents require verifiable inference and trustless compute markets to function without centralized bottlenecks. Platforms driving collective intelligence, such as $FET and the broader decentralized AI infrastructure cohort, are building decentralized coordination layers where independent agents interact, purchase GPU compute, exchange proprietary datasets, and execute complex workflows without centralized intermediaries.
When an AI agent hires another AI agent to crunch market datasets or verify zero-knowledge proofs, crypto is the only viable settlement medium. Smart contracts act as programmatic escrow services, ensuring that compute resources are delivered before payment is released. This creates an organic feedback loop: as the demand for autonomous automation expands, the underlying transactional velocity across verifiable settlement layers accelerates proportionally.
STRATEGIC PORTFOLIO POSITIONING
For disciplined market participants, navigating the AI narrative requires distinguishing between superficial marketing wrappers and real infrastructural moats. The true value accrual of the autonomous agent trend rests on two core pillars: protocols providing the execution environments that abstract complexity, and decentralized networks providing the computational and agent-coordination bandwidth.
Rather than chasing short-term
22
·
--
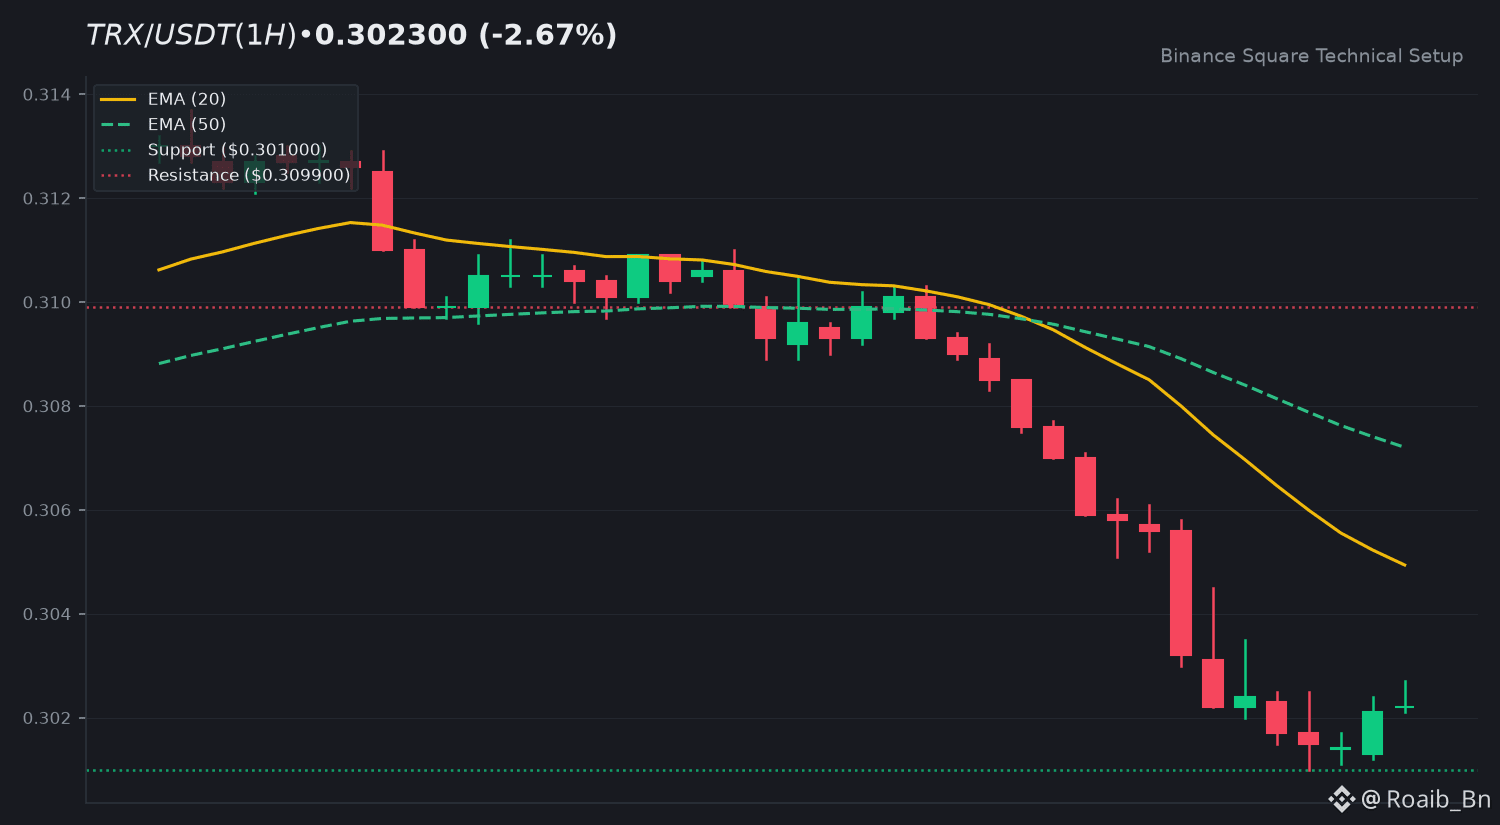
$TRX is currently seeing a mild pullback as it trades around the 0.3023 level. The asset has been working through some selling pressure over the last twenty-four hours, leading to a period of consolidation as buyers and sellers look for a clear direction.
On the one-hour chart, the price is trading below both the 20 EMA at 0.3049 and the 50 EMA at 0.3072, indicating a short-term bearish trend. With the RSI sitting at 23.41, the asset is deeply oversold, which often suggests that the current downward momentum is becoming stretched.
Looking ahead, we need to watch the 0.3099 level as the primary resistance for any potential recovery. On the downside, maintaining the immediate support level at 0.3010 is essential to preserve the current market structure.
What are your thoughts on this level—are you holding or waiting for a breakout?
Educational analysis only, not financial advice. DYOR.
$TRX #BinanceSquare #Crypto
$TRX is currently seeing a mild pullback as it trades around the 0.3023 level. The asset has been working through some selling pressure over the last twenty-four hours, leading to a period of consolidation as buyers and sellers look for a clear direction.
On the one-hour chart, the price is trading below both the 20 EMA at 0.3049 and the 50 EMA at 0.3072, indicating a short-term bearish trend. With the RSI sitting at 23.41, the asset is deeply oversold, which often suggests that the current downward momentum is becoming stretched.
Looking ahead, we need to watch the 0.3099 level as the primary resistance for any potential recovery. On the downside, maintaining the immediate support level at 0.3010 is essential to preserve the current market structure.
What are your thoughts on this level—are you holding or waiting for a breakout?
Educational analysis only, not financial advice. DYOR.
$TRX #BinanceSquare #Crypto
On the one-hour chart, the price is trading below both the 20 EMA at 0.3049 and the 50 EMA at 0.3072, indicating a short-term bearish trend. With the RSI sitting at 23.41, the asset is deeply oversold, which often suggests that the current downward momentum is becoming stretched.
Looking ahead, we need to watch the 0.3099 level as the primary resistance for any potential recovery. On the downside, maintaining the immediate support level at 0.3010 is essential to preserve the current market structure.
What are your thoughts on this level—are you holding or waiting for a breakout?
Educational analysis only, not financial advice. DYOR.
$TRX #BinanceSquare #Crypto
31
·
--
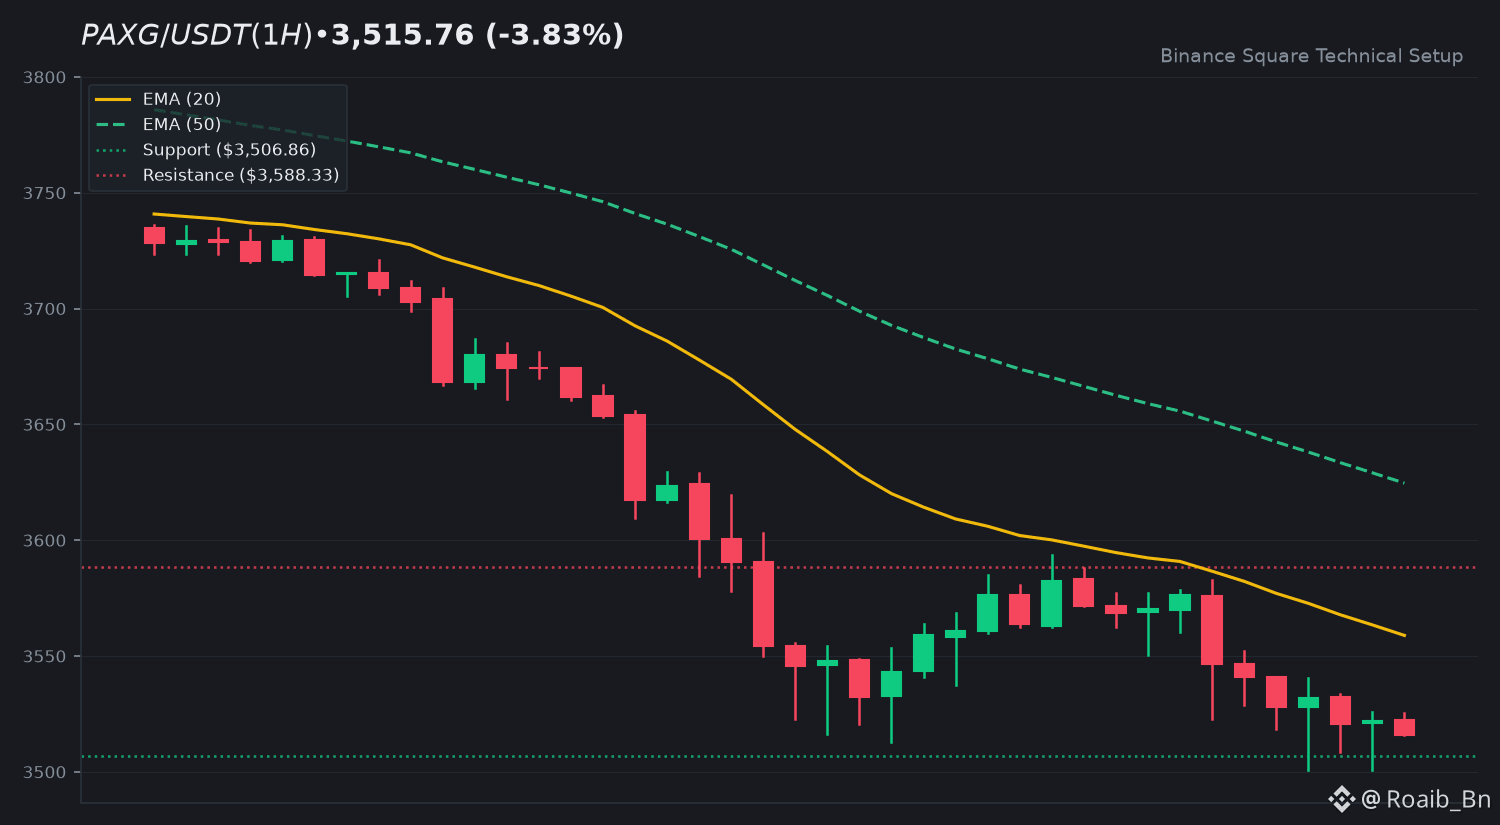
$PAXG is seeing a mild pullback today, currently trading at $3,515.76. The asset has been under some selling pressure, leading to this recent cooling off after a period of volatility.
On the hourly chart, the price remains below the 20 EMA of $3,558.88, which continues to act as a barrier for any immediate recovery. With the RSI sitting at 27.67, we are officially in oversold territory, suggesting that momentum is currently quite exhausted.
Looking ahead, we need to watch the primary resistance at $3,588.33 to see if bulls can reclaim that level. On the downside, $3,506.86 is the critical support level that must hold to maintain the current market structure.
What are your thoughts on this level—are you holding steady or waiting for a breakout?
Educational analysis only, not financial advice. DYOR.
$PAXG #BinanceSquare #Crypto
$PAXG is seeing a mild pullback today, currently trading at $3,515.76. The asset has been under some selling pressure, leading to this recent cooling off after a period of volatility.
On the hourly chart, the price remains below the 20 EMA of $3,558.88, which continues to act as a barrier for any immediate recovery. With the RSI sitting at 27.67, we are officially in oversold territory, suggesting that momentum is currently quite exhausted.
Looking ahead, we need to watch the primary resistance at $3,588.33 to see if bulls can reclaim that level. On the downside, $3,506.86 is the critical support level that must hold to maintain the current market structure.
What are your thoughts on this level—are you holding steady or waiting for a breakout?
Educational analysis only, not financial advice. DYOR.
$PAXG #BinanceSquare #Crypto
On the hourly chart, the price remains below the 20 EMA of $3,558.88, which continues to act as a barrier for any immediate recovery. With the RSI sitting at 27.67, we are officially in oversold territory, suggesting that momentum is currently quite exhausted.
Looking ahead, we need to watch the primary resistance at $3,588.33 to see if bulls can reclaim that level. On the downside, $3,506.86 is the critical support level that must hold to maintain the current market structure.
What are your thoughts on this level—are you holding steady or waiting for a breakout?
Educational analysis only, not financial advice. DYOR.
$PAXG #BinanceSquare #Crypto
19
·
--
Article
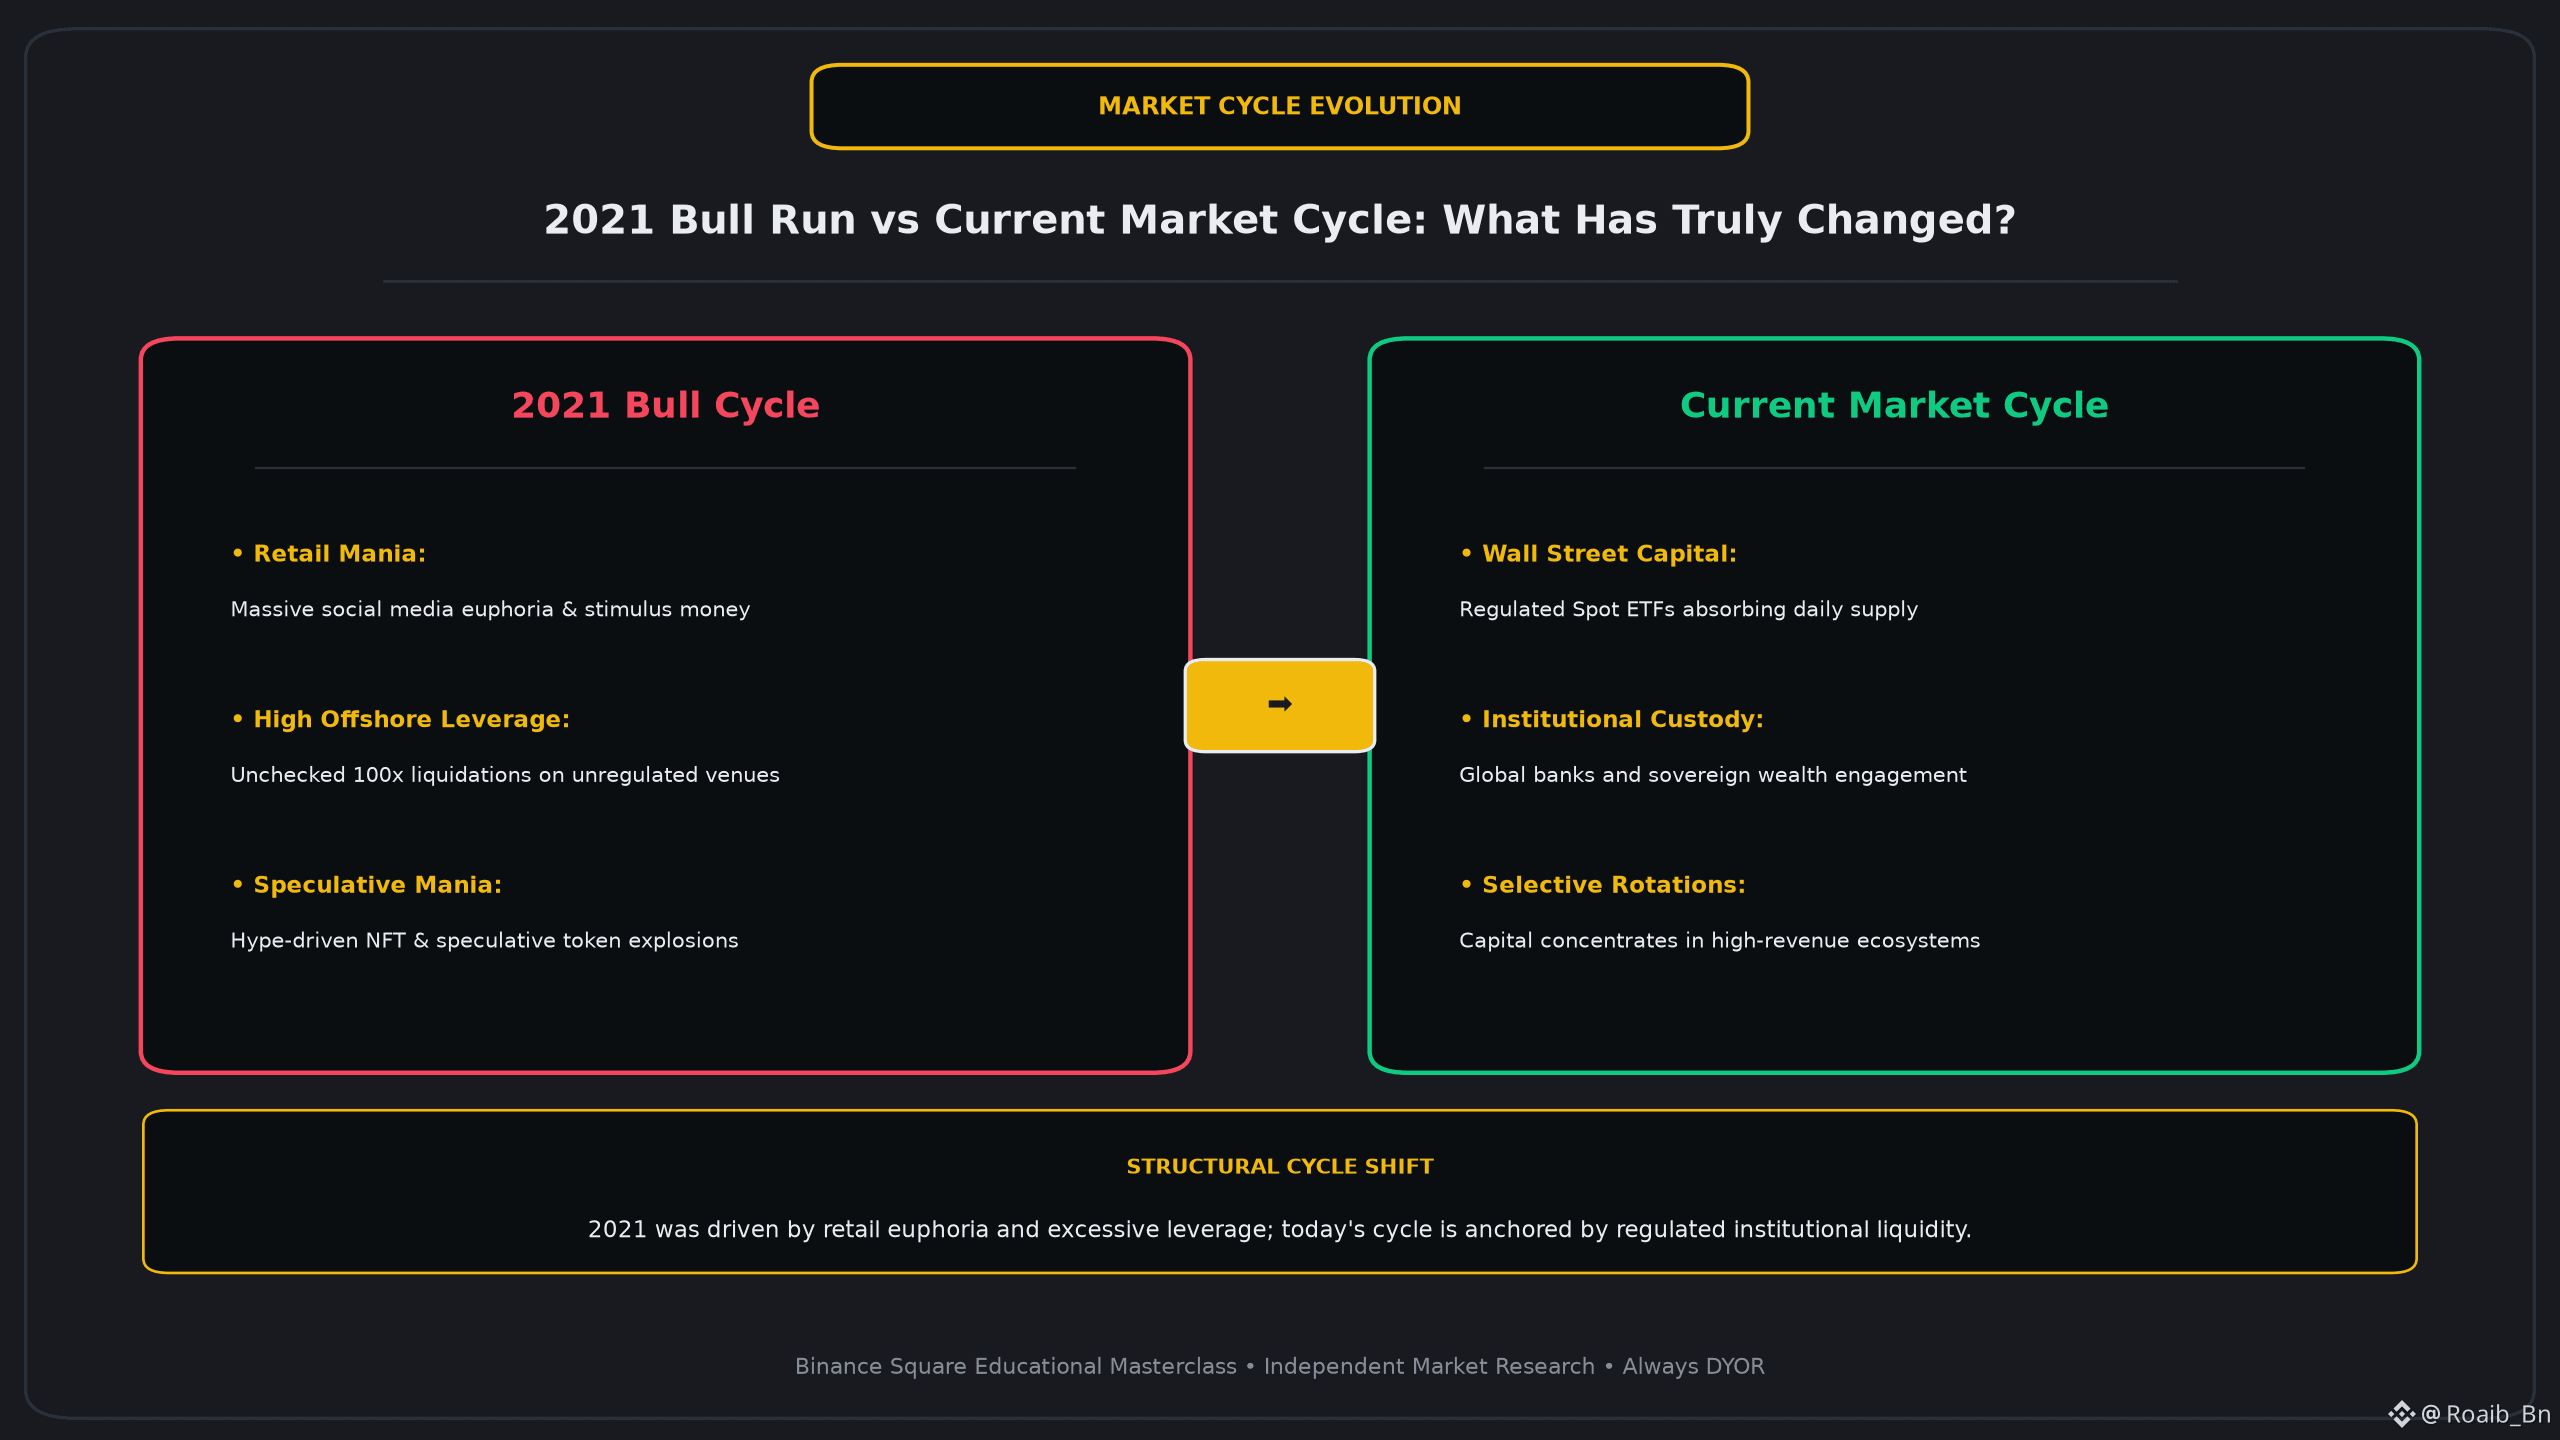
2021 Bull Run vs Current Market Cycle: What Has Truly Changed?Many traders who survived the 2021 mania are looking at the current market and feeling a sense of deja vu, but if you look under the hood, the mechanics of this cycle are fundamentally different. Understanding these shifts is not just an academic exercise; it is the difference between getting liquidated on a flash crash and holding through a structural re-rating of the entire asset class. We are no longer in the wild west of 2021, and the strategies that worked then might be the very ones that fail today.
THE 2021 ERA OF RETAIL EUPHORIA
The 2021 bull run was defined by a unique set of circumstances that we may never see again in the same combination. It was the era of stimulus-driven liquidity, where retail participants globally were flush with cash and stuck at home. This created a speculative environment where social media trends could move multi-billion dollar market caps in hours. We saw the explosion of speculative assets that defied all logic, driven by a collective fear of missing out. More importantly, the market structure was heavily reliant on massive offshore leverage. Traders were routinely using 100x leverage on unregulated platforms, leading to those legendary liquidation cascades where $BTC would drop twenty percent in minutes only to be bought back up. It was a cycle of pure adrenaline, unchecked speculation, and retail-driven momentum.
THE CURRENT CYCLE OF INSTITUTIONAL MATURITY
Fast forward to today, and the landscape has undergone a professional transformation. The primary driver of price action is no longer the individual trader with a stimulus check, but rather Wall Street capital flowing through regulated Spot ETFs. When firms like BlackRock and Fidelity enter the arena, the nature of the bid changes fundamentally. This is sticky capital. These are institutional allocations that are part of long-term wealth management strategies rather than weekend gambles. We are seeing global banks and even sovereign wealth funds begin to engage with digital assets as a legitimate hedge. Furthermore, the leverage that once defined the market has largely migrated to regulated futures markets or been replaced by spot accumulation. This creates a market that is arguably more resilient, though perhaps more calculated in its movements.
THE STRATEGIC VERDICT
The transition from a retail-led market to an institutional-led one means that the old playbooks need updating. In 2021, capital was spread thin across thousands of speculative projects. Today, capital is becoming much more selective, concentrating in high-revenue ecosystems and assets with clear regulatory pathways. While $BTC remains the primary vehicle for institutional entry, $ETH and other major platforms are being evaluated on their ability to settle global value. For the disciplined trader, this means focusing on fundamental strength and liquidity rather than just social media hype. The volatility is still present, but the floor is being built by some of the largest financial entities on the planet. We are moving from a phase of discovery to a phase of integration.
COMMUNITY DISCUSSION
Looking at your own portfolio and strategy, do you find this institutional phase easier to navigate than the retail mania of 2021, or do you miss the wild, unpredictable volatility of the previous cycle? I am interested to hear how your approach to risk management has evolved as the market has matured.
This analysis is provided for educational purposes only and does not constitute financial advice. The crypto market involves significant risk. Always conduct your own research before making any investment decisions.
$BTC $ETH #BinanceSquare #MarketCycles
2021 Bull Run vs Current Market Cycle: What Has Truly Changed?
Many traders who survived the 2021 mania are looking at the current market and feeling a sense of deja vu, but if you look under the hood, the mechanics of this cycle are fundamentally different. Understanding these shifts is not just an academic exercise; it is the difference between getting liquidated on a flash crash and holding through a structural re-rating of the entire asset class. We are no longer in the wild west of 2021, and the strategies that worked then might be the very ones that fail today.
THE 2021 ERA OF RETAIL EUPHORIA
The 2021 bull run was defined by a unique set of circumstances that we may never see again in the same combination. It was the era of stimulus-driven liquidity, where retail participants globally were flush with cash and stuck at home. This created a speculative environment where social media trends could move multi-billion dollar market caps in hours. We saw the explosion of speculative assets that defied all logic, driven by a collective fear of missing out. More importantly, the market structure was heavily reliant on massive offshore leverage. Traders were routinely using 100x leverage on unregulated platforms, leading to those legendary liquidation cascades where $BTC would drop twenty percent in minutes only to be bought back up. It was a cycle of pure adrenaline, unchecked speculation, and retail-driven momentum.
THE CURRENT CYCLE OF INSTITUTIONAL MATURITY
Fast forward to today, and the landscape has undergone a professional transformation. The primary driver of price action is no longer the individual trader with a stimulus check, but rather Wall Street capital flowing through regulated Spot ETFs. When firms like BlackRock and Fidelity enter the arena, the nature of the bid changes fundamentally. This is sticky capital. These are institutional allocations that are part of long-term wealth management strategies rather than weekend gambles. We are seeing global banks and even sovereign wealth funds begin to engage with digital assets as a legitimate hedge. Furthermore, the leverage that once defined the market has largely migrated to regulated futures markets or been replaced by spot accumulation. This creates a market that is arguably more resilient, though perhaps more calculated in its movements.
THE STRATEGIC VERDICT
The transition from a retail-led market to an institutional-led one means that the old playbooks need updating. In 2021, capital was spread thin across thousands of speculative projects. Today, capital is becoming much more selective, concentrating in high-revenue ecosystems and assets with clear regulatory pathways. While $BTC remains the primary vehicle for institutional entry, $ETH and other major platforms are being evaluated on their ability to settle global value. For the disciplined trader, this means focusing on fundamental strength and liquidity rather than just social media hype. The volatility is still present, but the floor is being built by some of the largest financial entities on the planet. We are moving from a phase of discovery to a phase of integration.
COMMUNITY DISCUSSION
Looking at your own portfolio and strategy, do you find this institutional phase easier to navigate than the retail mania of 2021, or do you miss the wild, unpredictable volatility of the previous cycle? I am interested to hear how your approach to risk management has evolved as the market has matured.
This analysis is provided for educational purposes only and does not constitute financial advice. The crypto market involves significant risk. Always conduct your own research before making any investment decisions.
$BTC $ETH #BinanceSquare #MarketCycles
THE 2021 ERA OF RETAIL EUPHORIA
The 2021 bull run was defined by a unique set of circumstances that we may never see again in the same combination. It was the era of stimulus-driven liquidity, where retail participants globally were flush with cash and stuck at home. This created a speculative environment where social media trends could move multi-billion dollar market caps in hours. We saw the explosion of speculative assets that defied all logic, driven by a collective fear of missing out. More importantly, the market structure was heavily reliant on massive offshore leverage. Traders were routinely using 100x leverage on unregulated platforms, leading to those legendary liquidation cascades where $BTC would drop twenty percent in minutes only to be bought back up. It was a cycle of pure adrenaline, unchecked speculation, and retail-driven momentum.
THE CURRENT CYCLE OF INSTITUTIONAL MATURITY
Fast forward to today, and the landscape has undergone a professional transformation. The primary driver of price action is no longer the individual trader with a stimulus check, but rather Wall Street capital flowing through regulated Spot ETFs. When firms like BlackRock and Fidelity enter the arena, the nature of the bid changes fundamentally. This is sticky capital. These are institutional allocations that are part of long-term wealth management strategies rather than weekend gambles. We are seeing global banks and even sovereign wealth funds begin to engage with digital assets as a legitimate hedge. Furthermore, the leverage that once defined the market has largely migrated to regulated futures markets or been replaced by spot accumulation. This creates a market that is arguably more resilient, though perhaps more calculated in its movements.
THE STRATEGIC VERDICT
The transition from a retail-led market to an institutional-led one means that the old playbooks need updating. In 2021, capital was spread thin across thousands of speculative projects. Today, capital is becoming much more selective, concentrating in high-revenue ecosystems and assets with clear regulatory pathways. While $BTC remains the primary vehicle for institutional entry, $ETH and other major platforms are being evaluated on their ability to settle global value. For the disciplined trader, this means focusing on fundamental strength and liquidity rather than just social media hype. The volatility is still present, but the floor is being built by some of the largest financial entities on the planet. We are moving from a phase of discovery to a phase of integration.
COMMUNITY DISCUSSION
Looking at your own portfolio and strategy, do you find this institutional phase easier to navigate than the retail mania of 2021, or do you miss the wild, unpredictable volatility of the previous cycle? I am interested to hear how your approach to risk management has evolved as the market has matured.
This analysis is provided for educational purposes only and does not constitute financial advice. The crypto market involves significant risk. Always conduct your own research before making any investment decisions.
$BTC $ETH #BinanceSquare #MarketCycles
12
·
--
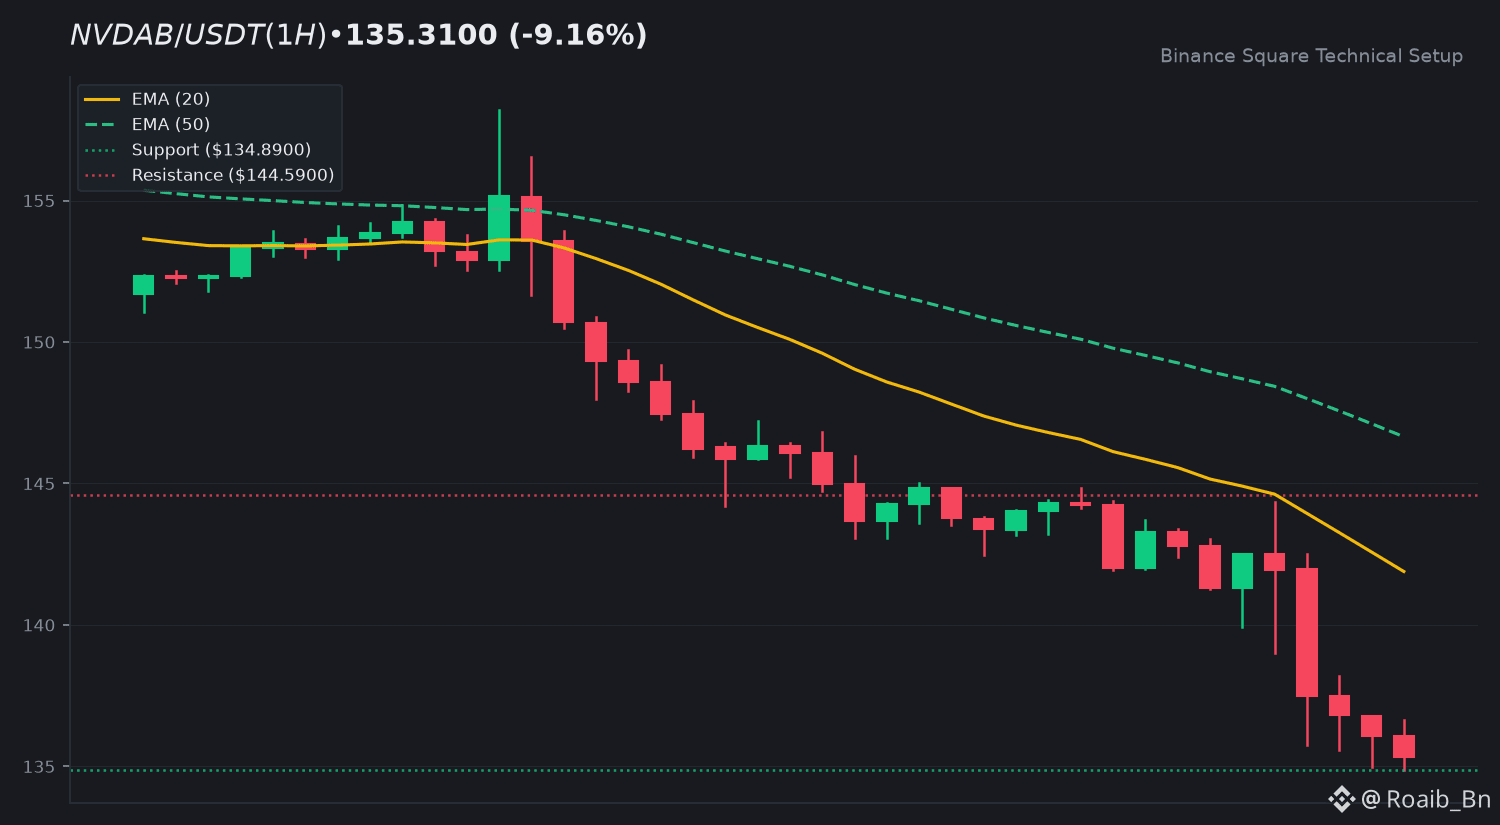
The market is showing a sharp reaction today as $NVDAB trades near 135.3100. We are seeing a significant pullback of over nine percent, which has put a lot of pressure on the current price structure as traders look for a potential floor in this volatile environment.
On the hourly chart, the price is trading well below the 20 EMA of 141.8887, indicating a clear bearish trend in the short term. With the RSI sitting at 21.0, the asset is deep in oversold territory, which often suggests that selling momentum is stretched thin.
Looking ahead, the primary resistance level to watch for any potential recovery is 144.5900. On the downside, it is critical to see if the immediate support at 134.8900 can hold to prevent further slippage in the coming sessions.
Are you looking at these oversold levels as a potential entry point, or do you prefer to wait for a confirmed trend reversal before making any moves?
Educational analysis only, not financial advice. DYOR.
$NVDAB #BinanceSquare #Crypto
The market is showing a sharp reaction today as $NVDAB trades near 135.3100. We are seeing a significant pullback of over nine percent, which has put a lot of pressure on the current price structure as traders look for a potential floor in this volatile environment.
On the hourly chart, the price is trading well below the 20 EMA of 141.8887, indicating a clear bearish trend in the short term. With the RSI sitting at 21.0, the asset is deep in oversold territory, which often suggests that selling momentum is stretched thin.
Looking ahead, the primary resistance level to watch for any potential recovery is 144.5900. On the downside, it is critical to see if the immediate support at 134.8900 can hold to prevent further slippage in the coming sessions.
Are you looking at these oversold levels as a potential entry point, or do you prefer to wait for a confirmed trend reversal before making any moves?
Educational analysis only, not financial advice. DYOR.
$NVDAB #BinanceSquare #Crypto
On the hourly chart, the price is trading well below the 20 EMA of 141.8887, indicating a clear bearish trend in the short term. With the RSI sitting at 21.0, the asset is deep in oversold territory, which often suggests that selling momentum is stretched thin.
Looking ahead, the primary resistance level to watch for any potential recovery is 144.5900. On the downside, it is critical to see if the immediate support at 134.8900 can hold to prevent further slippage in the coming sessions.
Are you looking at these oversold levels as a potential entry point, or do you prefer to wait for a confirmed trend reversal before making any moves?
Educational analysis only, not financial advice. DYOR.
$NVDAB #BinanceSquare #Crypto
42
·
--
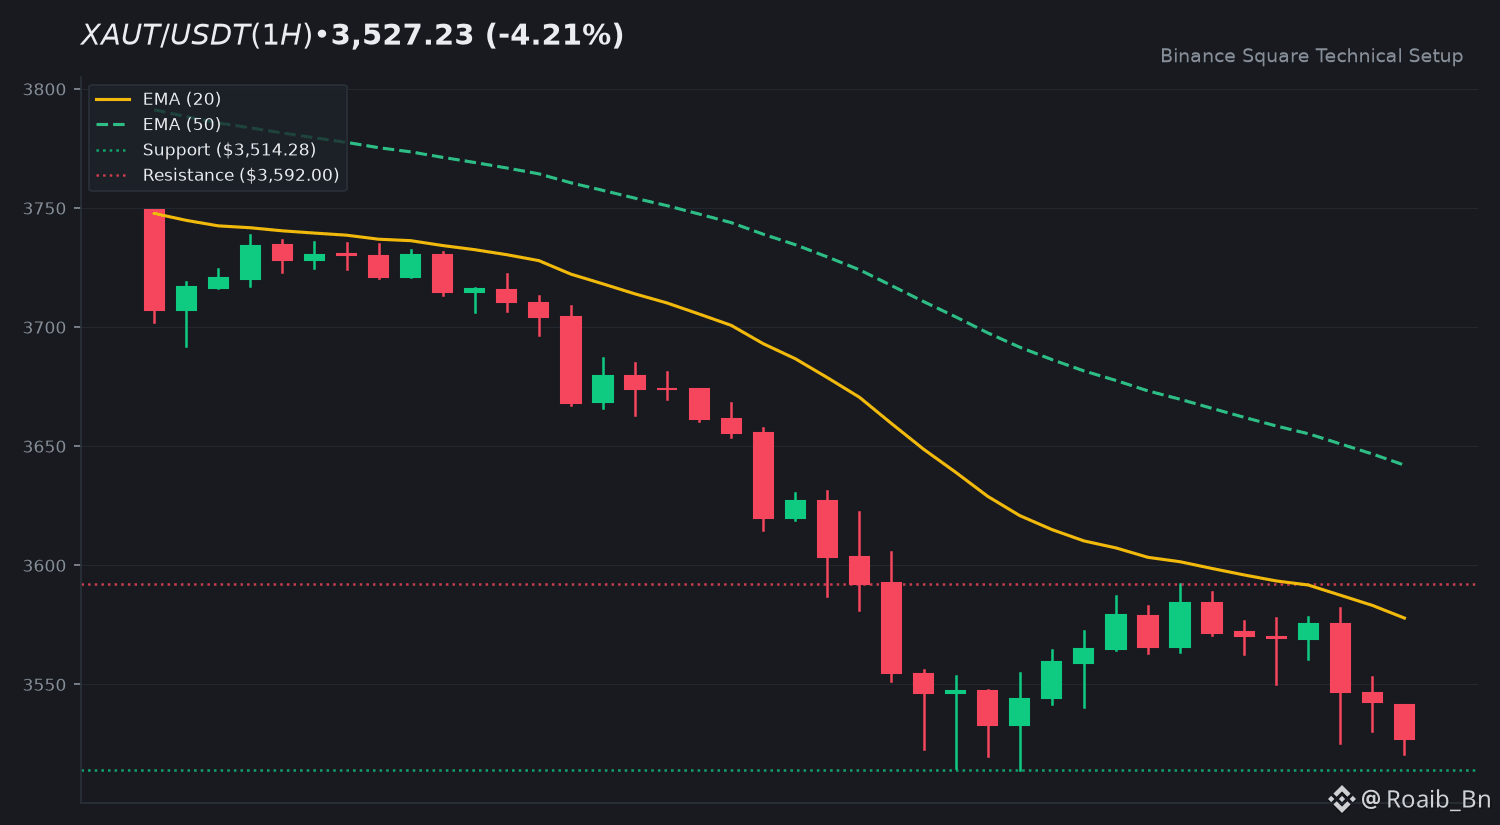
$XAUT is currently seeing a mild pullback as it trades near the 3,527.23 level. The asset has been under pressure over the last twenty four hours, reflecting broader market movements as investors reassess their positions in gold backed tokens.
Looking at the hourly chart, the price is trading well below the 20 EMA of 3,577.86, signaling persistent short term weakness. With an RSI reading of 28.24, the asset is clearly in oversold territory, which often suggests that selling momentum may be reaching a point of exhaustion.
For the immediate outlook, I am keeping a close watch on the 3,592.00 resistance level, which needs to be reclaimed to show any signs of a trend reversal. On the downside, the 3,514.28 support level is critical to maintain the current market structure.
How are you navigating this dip in $XAUT right now—are you looking for a potential bounce or waiting for more stability before acting?
Educational analysis only, not financial advice. DYOR.
$XAUT #BinanceSquare #Crypto
$XAUT is currently seeing a mild pullback as it trades near the 3,527.23 level. The asset has been under pressure over the last twenty four hours, reflecting broader market movements as investors reassess their positions in gold backed tokens.
Looking at the hourly chart, the price is trading well below the 20 EMA of 3,577.86, signaling persistent short term weakness. With an RSI reading of 28.24, the asset is clearly in oversold territory, which often suggests that selling momentum may be reaching a point of exhaustion.
For the immediate outlook, I am keeping a close watch on the 3,592.00 resistance level, which needs to be reclaimed to show any signs of a trend reversal. On the downside, the 3,514.28 support level is critical to maintain the current market structure.
How are you navigating this dip in $XAUT right now—are you looking for a potential bounce or waiting for more stability before acting?
Educational analysis only, not financial advice. DYOR.
$XAUT #BinanceSquare #Crypto
Looking at the hourly chart, the price is trading well below the 20 EMA of 3,577.86, signaling persistent short term weakness. With an RSI reading of 28.24, the asset is clearly in oversold territory, which often suggests that selling momentum may be reaching a point of exhaustion.
For the immediate outlook, I am keeping a close watch on the 3,592.00 resistance level, which needs to be reclaimed to show any signs of a trend reversal. On the downside, the 3,514.28 support level is critical to maintain the current market structure.
How are you navigating this dip in $XAUT right now—are you looking for a potential bounce or waiting for more stability before acting?
Educational analysis only, not financial advice. DYOR.
$XAUT #BinanceSquare #Crypto
32
·
--

Article
Real World Assets (RWA): How Trillions in TradFi Debt Move On-ChainREAL WORLD ASSETS: HOW TRILLIONS IN TRADFI DEBT MOVE ON-CHAIN
The landscape of digital assets is undergoing a fundamental transformation that many retail traders are still overlooking. While the headlines often focus on the latest meme coin cycle or spot ETF inflows, a much deeper structural shift is happening beneath the surface. We are witnessing the migration of trillions of dollars in traditional financial debt onto public blockchains. This is not a theoretical future anymore. It is happening right now, and the implications for the next decade of finance are massive. The wall of money is no longer a meme; it is a series of smart contracts being deployed by the world's largest asset managers.
The first major pillar of this movement is the explosion of tokenized US Treasuries. We have recently surpassed the 2 billion dollar mark for sovereign debt trading and earning yield 24/7 on public blockchains. In the past, accessing the safety and yield of US government bonds required complex brokerage accounts and was restricted by traditional banking hours and geographic boundaries. Today, protocols like $ONDO are allowing this capital to move and earn yield around the clock. This creates a bridge where institutional liquidity can stay on-chain during periods of market volatility rather than exiting back to legacy banks. For the trader, this means the ecosystem is becoming more resilient and less dependent on purely speculative, circular yield models.
Beyond just the yield, we have to look at the plumbing of the financial system. Institutional settlement rails are being completely redesigned. Traditional finance still operates largely on a T plus 2 settlement cycle, meaning it takes two days for a trade to actually clear and settle through a maze of intermediaries. By utilizing smart contracts and decentralized oracle networks like $LINK , asset managers are eliminating these friction points. When you remove the need for manual reconciliation and multiple layers of custodians, you unlock massive capital efficiency. This is why we see global giants testing private and public blockchain integrations. They are looking for a way to move value with the same speed and transparency that we move information.
For a disciplined trader, the RWA narrative represents a shift toward market maturity. In previous cycles, on-chain yield was often a game of printing new tokens to reward liquidity providers, which inevitably led to dilution. RWA changes that by bringing in exogenous yield from the real world. This provides a stabilizing force for the entire DeFi sector. In a balanced portfolio, RWA-focused assets serve as the infrastructure layer. While they may not always offer the vertical price action of a low-cap speculative token, they offer something arguably more valuable: institutional-grade adoption and a clear path to becoming the backbone of global finance.
As we look toward the 2027 horizon, the question is no longer if traditional assets will move on-chain, but how quickly the remaining gatekeepers will succumb to the efficiency of blockchain technology. The integration of composable collateral means your tokenized treasury bill can soon be used as margin for a trade or as collateral for a loan in a decentralized protocol, all without ever leaving the ledger. This level of interoperability is something the legacy system simply cannot match.
I am curious to hear your perspective on this shift. Do you view Real World Assets as the primary catalyst for the next leg of this market, or do you believe the core of crypto should remain entirely decoupled from traditional financial systems? Share your thoughts in the comments below.
This analysis is for educational purposes only and does not constitute financial advice. The crypto market involves significant risk, and you should always conduct your own research
Real World Assets (RWA): How Trillions in TradFi Debt Move On-Chain
REAL WORLD ASSETS: HOW TRILLIONS IN TRADFI DEBT MOVE ON-CHAIN
The landscape of digital assets is undergoing a fundamental transformation that many retail traders are still overlooking. While the headlines often focus on the latest meme coin cycle or spot ETF inflows, a much deeper structural shift is happening beneath the surface. We are witnessing the migration of trillions of dollars in traditional financial debt onto public blockchains. This is not a theoretical future anymore. It is happening right now, and the implications for the next decade of finance are massive. The wall of money is no longer a meme; it is a series of smart contracts being deployed by the world's largest asset managers.
The first major pillar of this movement is the explosion of tokenized US Treasuries. We have recently surpassed the 2 billion dollar mark for sovereign debt trading and earning yield 24/7 on public blockchains. In the past, accessing the safety and yield of US government bonds required complex brokerage accounts and was restricted by traditional banking hours and geographic boundaries. Today, protocols like $ONDO are allowing this capital to move and earn yield around the clock. This creates a bridge where institutional liquidity can stay on-chain during periods of market volatility rather than exiting back to legacy banks. For the trader, this means the ecosystem is becoming more resilient and less dependent on purely speculative, circular yield models.
Beyond just the yield, we have to look at the plumbing of the financial system. Institutional settlement rails are being completely redesigned. Traditional finance still operates largely on a T plus 2 settlement cycle, meaning it takes two days for a trade to actually clear and settle through a maze of intermediaries. By utilizing smart contracts and decentralized oracle networks like $LINK , asset managers are eliminating these friction points. When you remove the need for manual reconciliation and multiple layers of custodians, you unlock massive capital efficiency. This is why we see global giants testing private and public blockchain integrations. They are looking for a way to move value with the same speed and transparency that we move information.
For a disciplined trader, the RWA narrative represents a shift toward market maturity. In previous cycles, on-chain yield was often a game of printing new tokens to reward liquidity providers, which inevitably led to dilution. RWA changes that by bringing in exogenous yield from the real world. This provides a stabilizing force for the entire DeFi sector. In a balanced portfolio, RWA-focused assets serve as the infrastructure layer. While they may not always offer the vertical price action of a low-cap speculative token, they offer something arguably more valuable: institutional-grade adoption and a clear path to becoming the backbone of global finance.
As we look toward the 2027 horizon, the question is no longer if traditional assets will move on-chain, but how quickly the remaining gatekeepers will succumb to the efficiency of blockchain technology. The integration of composable collateral means your tokenized treasury bill can soon be used as margin for a trade or as collateral for a loan in a decentralized protocol, all without ever leaving the ledger. This level of interoperability is something the legacy system simply cannot match.
I am curious to hear your perspective on this shift. Do you view Real World Assets as the primary catalyst for the next leg of this market, or do you believe the core of crypto should remain entirely decoupled from traditional financial systems? Share your thoughts in the comments below.
This analysis is for educational purposes only and does not constitute financial advice. The crypto market involves significant risk, and you should always conduct your own research
The landscape of digital assets is undergoing a fundamental transformation that many retail traders are still overlooking. While the headlines often focus on the latest meme coin cycle or spot ETF inflows, a much deeper structural shift is happening beneath the surface. We are witnessing the migration of trillions of dollars in traditional financial debt onto public blockchains. This is not a theoretical future anymore. It is happening right now, and the implications for the next decade of finance are massive. The wall of money is no longer a meme; it is a series of smart contracts being deployed by the world's largest asset managers.
The first major pillar of this movement is the explosion of tokenized US Treasuries. We have recently surpassed the 2 billion dollar mark for sovereign debt trading and earning yield 24/7 on public blockchains. In the past, accessing the safety and yield of US government bonds required complex brokerage accounts and was restricted by traditional banking hours and geographic boundaries. Today, protocols like $ONDO are allowing this capital to move and earn yield around the clock. This creates a bridge where institutional liquidity can stay on-chain during periods of market volatility rather than exiting back to legacy banks. For the trader, this means the ecosystem is becoming more resilient and less dependent on purely speculative, circular yield models.
Beyond just the yield, we have to look at the plumbing of the financial system. Institutional settlement rails are being completely redesigned. Traditional finance still operates largely on a T plus 2 settlement cycle, meaning it takes two days for a trade to actually clear and settle through a maze of intermediaries. By utilizing smart contracts and decentralized oracle networks like $LINK , asset managers are eliminating these friction points. When you remove the need for manual reconciliation and multiple layers of custodians, you unlock massive capital efficiency. This is why we see global giants testing private and public blockchain integrations. They are looking for a way to move value with the same speed and transparency that we move information.
For a disciplined trader, the RWA narrative represents a shift toward market maturity. In previous cycles, on-chain yield was often a game of printing new tokens to reward liquidity providers, which inevitably led to dilution. RWA changes that by bringing in exogenous yield from the real world. This provides a stabilizing force for the entire DeFi sector. In a balanced portfolio, RWA-focused assets serve as the infrastructure layer. While they may not always offer the vertical price action of a low-cap speculative token, they offer something arguably more valuable: institutional-grade adoption and a clear path to becoming the backbone of global finance.
As we look toward the 2027 horizon, the question is no longer if traditional assets will move on-chain, but how quickly the remaining gatekeepers will succumb to the efficiency of blockchain technology. The integration of composable collateral means your tokenized treasury bill can soon be used as margin for a trade or as collateral for a loan in a decentralized protocol, all without ever leaving the ledger. This level of interoperability is something the legacy system simply cannot match.
I am curious to hear your perspective on this shift. Do you view Real World Assets as the primary catalyst for the next leg of this market, or do you believe the core of crypto should remain entirely decoupled from traditional financial systems? Share your thoughts in the comments below.
This analysis is for educational purposes only and does not constitute financial advice. The crypto market involves significant risk, and you should always conduct your own research
37
·
--
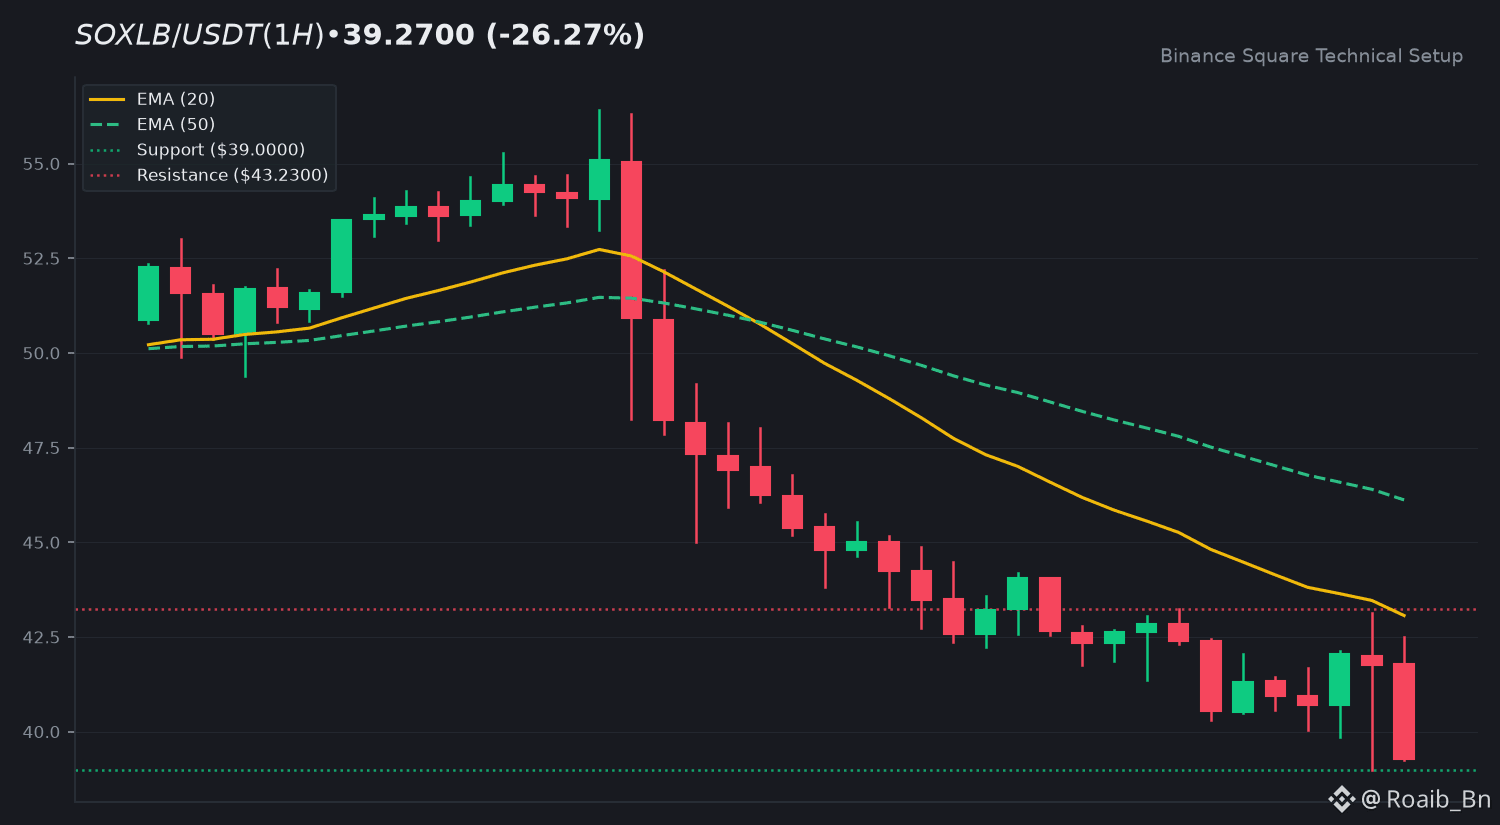
$SOXLB is currently facing significant downward pressure, trading at 39.2700 after a sharp 26 percent decline over the last day. The market sentiment remains cautious as the asset struggles to find a firm footing during this volatile session.
On the hourly timeframe, the price is trading well below the 20 EMA at 43.0649, indicating a clear bearish trend. With the RSI sitting at 29.32, the asset is officially in oversold territory, which often suggests that the selling momentum might be reaching an exhaustion point.
I am watching the 43.2300 level as the primary resistance that needs to be reclaimed for any meaningful recovery. On the downside, 39.0000 is the critical support level that must hold to prevent further structure breakdown.
Are you looking at this as a potential value entry or are you waiting for more stability before taking a position?
Educational analysis only, not financial advice. DYOR.
$SOXLB #BinanceSquare #Crypto
$SOXLB is currently facing significant downward pressure, trading at 39.2700 after a sharp 26 percent decline over the last day. The market sentiment remains cautious as the asset struggles to find a firm footing during this volatile session.
On the hourly timeframe, the price is trading well below the 20 EMA at 43.0649, indicating a clear bearish trend. With the RSI sitting at 29.32, the asset is officially in oversold territory, which often suggests that the selling momentum might be reaching an exhaustion point.
I am watching the 43.2300 level as the primary resistance that needs to be reclaimed for any meaningful recovery. On the downside, 39.0000 is the critical support level that must hold to prevent further structure breakdown.
Are you looking at this as a potential value entry or are you waiting for more stability before taking a position?
Educational analysis only, not financial advice. DYOR.
$SOXLB #BinanceSquare #Crypto
On the hourly timeframe, the price is trading well below the 20 EMA at 43.0649, indicating a clear bearish trend. With the RSI sitting at 29.32, the asset is officially in oversold territory, which often suggests that the selling momentum might be reaching an exhaustion point.
I am watching the 43.2300 level as the primary resistance that needs to be reclaimed for any meaningful recovery. On the downside, 39.0000 is the critical support level that must hold to prevent further structure breakdown.
Are you looking at this as a potential value entry or are you waiting for more stability before taking a position?
Educational analysis only, not financial advice. DYOR.
$SOXLB #BinanceSquare #Crypto
26
·
--
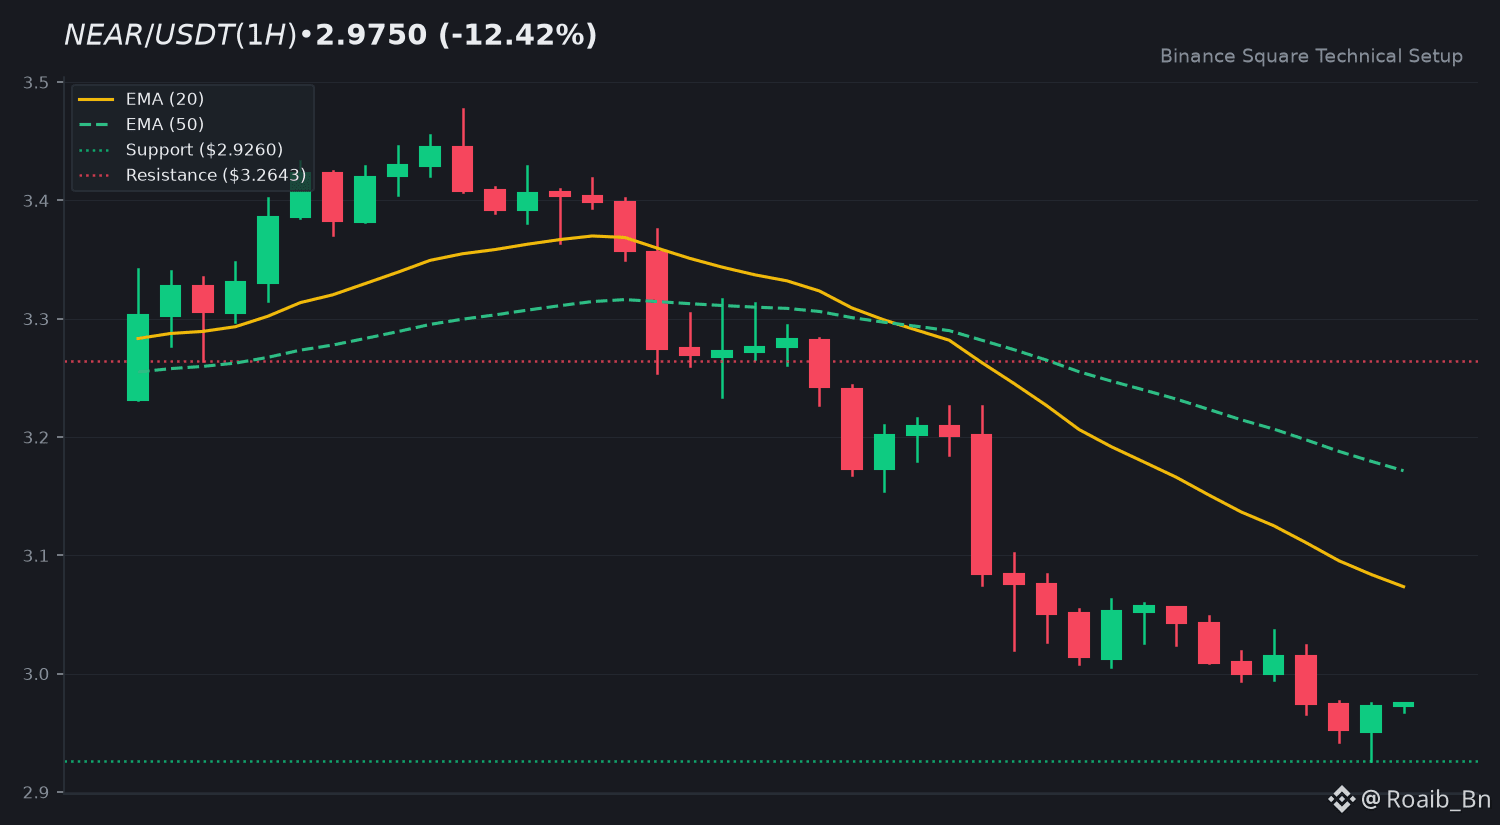
$NEAR is currently seeing a significant pullback, trading around the 2.9750 level after a sharp decline over the last day. The market sentiment remains cautious as sellers maintain control in the short term.
On the hourly chart, the price is trading well below the 20 EMA of 3.0735, indicating a clear bearish trend. With the RSI currently at 28.95, the asset is entering oversold territory, which sometimes suggests that the selling pressure may be reaching a point of exhaustion.
Looking ahead, we need to watch the 3.2643 level as the primary resistance to reclaim if we want to see a trend reversal. On the downside, 2.9260 is the critical support level that must hold to prevent further structural damage.
What are your thoughts on this price level—are you holding your position or waiting for a clearer breakout signal before acting?
Educational analysis only, not financial advice. DYOR.
$NEAR #BinanceSquare #Crypto
$NEAR is currently seeing a significant pullback, trading around the 2.9750 level after a sharp decline over the last day. The market sentiment remains cautious as sellers maintain control in the short term.
On the hourly chart, the price is trading well below the 20 EMA of 3.0735, indicating a clear bearish trend. With the RSI currently at 28.95, the asset is entering oversold territory, which sometimes suggests that the selling pressure may be reaching a point of exhaustion.
Looking ahead, we need to watch the 3.2643 level as the primary resistance to reclaim if we want to see a trend reversal. On the downside, 2.9260 is the critical support level that must hold to prevent further structural damage.
What are your thoughts on this price level—are you holding your position or waiting for a clearer breakout signal before acting?
Educational analysis only, not financial advice. DYOR.
$NEAR #BinanceSquare #Crypto
On the hourly chart, the price is trading well below the 20 EMA of 3.0735, indicating a clear bearish trend. With the RSI currently at 28.95, the asset is entering oversold territory, which sometimes suggests that the selling pressure may be reaching a point of exhaustion.
Looking ahead, we need to watch the 3.2643 level as the primary resistance to reclaim if we want to see a trend reversal. On the downside, 2.9260 is the critical support level that must hold to prevent further structural damage.
What are your thoughts on this price level—are you holding your position or waiting for a clearer breakout signal before acting?
Educational analysis only, not financial advice. DYOR.
$NEAR #BinanceSquare #Crypto
39
·
--

Article
Institutional Spot ETFs & Global Treasury Flows: The Next PhaseWe are witnessing a fundamental transformation in how digital assets are priced and held. The era of pure retail speculation has been replaced by a sophisticated institutional framework that is permanently altering the liquidity landscape. As we look at the current market data in late 2026, the impact of spot ETFs is no longer a forecast—it is the dominant force in price discovery. The shift we are seeing today represents the most significant structural change since the inception of the first block.
THE MECHANISM OF CONTINUOUS ABSORPTION
Wall Street spot vehicles have created a vacuum in the circulating supply. While the market previously relied on exchange balances and miner sell pressure to dictate short-term moves, we now see a relentless absorption rate. These institutional vehicles are soaking up newly minted supply at a pace that often exceeds daily production. This creates a persistent bid that operates independently of retail sentiment. When multi-billion dollar funds execute programmatic buy orders every trading day, the traditional four-year cycle dynamics begin to stretch and evolve. We are moving away from the violent boom-and-bust cycles of the past and into a period of sustained institutional accumulation. This is not just a trend; it is a total re-engineering of market liquidity.
THE SOVEREIGN SHIFT AND PENSION ALLOCATIONS
The narrative has progressed far beyond individual wealth management. We are now seeing the integration of digital assets into global treasury flows. Retirement funds and sovereign wealth entities, which operate on decades-long time horizons, are officially moving from the evaluation phase to active allocation. This is a massive shift in the global financial hierarchy. When a national treasury or a state pension fund adds $BTC to its balance sheet, that capital is effectively locked away for the long term. This reduces the liquid float significantly. This transition from speculative asset to a legitimate reserve asset is the cornerstone of the current phase of market maturity. We are no longer asking if institutions will arrive; we are calculating how much of the global reserve they will eventually command.
A NEW ERA OF VOLATILITY MANAGEMENT
One of the most profound changes is the dampening of downside volatility. In previous eras, the market was dominated by high-leverage retail traders, leading to frequent and violent flash liquidations. While volatility remains a characteristic of the space, the presence of long-term institutional custody acts as a stabilizing force. These entities do not panic sell during ten percent corrections; instead, they often view dips as rebalancing opportunities. This change in holder composition means that the market floors are becoming much more resilient. For the disciplined trader, this requires a shift in strategy—focusing less on catching the absolute bottom of a crash and more on understanding the macro flow of institutional capital.
STRATEGIC VERDICT FOR THE MODERN PORTFOLIO
In this institutionalized environment, the distinction between $BTC and $ETH as core holdings has never been clearer. One serves as the primary global reserve and hedge against currency debasement, while the other functions as the settlement layer for this new financial architecture. A disciplined approach now requires monitoring ETF inflow data and treasury announcements as closely as one would monitor central bank interest rate decisions. The market has grown up, and our analysis must
Institutional Spot ETFs & Global Treasury Flows: The Next Phase
We are witnessing a fundamental transformation in how digital assets are priced and held. The era of pure retail speculation has been replaced by a sophisticated institutional framework that is permanently altering the liquidity landscape. As we look at the current market data in late 2026, the impact of spot ETFs is no longer a forecast—it is the dominant force in price discovery. The shift we are seeing today represents the most significant structural change since the inception of the first block.
THE MECHANISM OF CONTINUOUS ABSORPTION
Wall Street spot vehicles have created a vacuum in the circulating supply. While the market previously relied on exchange balances and miner sell pressure to dictate short-term moves, we now see a relentless absorption rate. These institutional vehicles are soaking up newly minted supply at a pace that often exceeds daily production. This creates a persistent bid that operates independently of retail sentiment. When multi-billion dollar funds execute programmatic buy orders every trading day, the traditional four-year cycle dynamics begin to stretch and evolve. We are moving away from the violent boom-and-bust cycles of the past and into a period of sustained institutional accumulation. This is not just a trend; it is a total re-engineering of market liquidity.
THE SOVEREIGN SHIFT AND PENSION ALLOCATIONS
The narrative has progressed far beyond individual wealth management. We are now seeing the integration of digital assets into global treasury flows. Retirement funds and sovereign wealth entities, which operate on decades-long time horizons, are officially moving from the evaluation phase to active allocation. This is a massive shift in the global financial hierarchy. When a national treasury or a state pension fund adds $BTC to its balance sheet, that capital is effectively locked away for the long term. This reduces the liquid float significantly. This transition from speculative asset to a legitimate reserve asset is the cornerstone of the current phase of market maturity. We are no longer asking if institutions will arrive; we are calculating how much of the global reserve they will eventually command.
A NEW ERA OF VOLATILITY MANAGEMENT
One of the most profound changes is the dampening of downside volatility. In previous eras, the market was dominated by high-leverage retail traders, leading to frequent and violent flash liquidations. While volatility remains a characteristic of the space, the presence of long-term institutional custody acts as a stabilizing force. These entities do not panic sell during ten percent corrections; instead, they often view dips as rebalancing opportunities. This change in holder composition means that the market floors are becoming much more resilient. For the disciplined trader, this requires a shift in strategy—focusing less on catching the absolute bottom of a crash and more on understanding the macro flow of institutional capital.
STRATEGIC VERDICT FOR THE MODERN PORTFOLIO
In this institutionalized environment, the distinction between $BTC and $ETH as core holdings has never been clearer. One serves as the primary global reserve and hedge against currency debasement, while the other functions as the settlement layer for this new financial architecture. A disciplined approach now requires monitoring ETF inflow data and treasury announcements as closely as one would monitor central bank interest rate decisions. The market has grown up, and our analysis must
THE MECHANISM OF CONTINUOUS ABSORPTION
Wall Street spot vehicles have created a vacuum in the circulating supply. While the market previously relied on exchange balances and miner sell pressure to dictate short-term moves, we now see a relentless absorption rate. These institutional vehicles are soaking up newly minted supply at a pace that often exceeds daily production. This creates a persistent bid that operates independently of retail sentiment. When multi-billion dollar funds execute programmatic buy orders every trading day, the traditional four-year cycle dynamics begin to stretch and evolve. We are moving away from the violent boom-and-bust cycles of the past and into a period of sustained institutional accumulation. This is not just a trend; it is a total re-engineering of market liquidity.
THE SOVEREIGN SHIFT AND PENSION ALLOCATIONS
The narrative has progressed far beyond individual wealth management. We are now seeing the integration of digital assets into global treasury flows. Retirement funds and sovereign wealth entities, which operate on decades-long time horizons, are officially moving from the evaluation phase to active allocation. This is a massive shift in the global financial hierarchy. When a national treasury or a state pension fund adds $BTC to its balance sheet, that capital is effectively locked away for the long term. This reduces the liquid float significantly. This transition from speculative asset to a legitimate reserve asset is the cornerstone of the current phase of market maturity. We are no longer asking if institutions will arrive; we are calculating how much of the global reserve they will eventually command.
A NEW ERA OF VOLATILITY MANAGEMENT
One of the most profound changes is the dampening of downside volatility. In previous eras, the market was dominated by high-leverage retail traders, leading to frequent and violent flash liquidations. While volatility remains a characteristic of the space, the presence of long-term institutional custody acts as a stabilizing force. These entities do not panic sell during ten percent corrections; instead, they often view dips as rebalancing opportunities. This change in holder composition means that the market floors are becoming much more resilient. For the disciplined trader, this requires a shift in strategy—focusing less on catching the absolute bottom of a crash and more on understanding the macro flow of institutional capital.
STRATEGIC VERDICT FOR THE MODERN PORTFOLIO
In this institutionalized environment, the distinction between $BTC and $ETH as core holdings has never been clearer. One serves as the primary global reserve and hedge against currency debasement, while the other functions as the settlement layer for this new financial architecture. A disciplined approach now requires monitoring ETF inflow data and treasury announcements as closely as one would monitor central bank interest rate decisions. The market has grown up, and our analysis must
10
·
--
XRP is currently seeing a mild pullback as it trades around the 0.9562 level. The price action reflects a period of consolidation following the recent volatility, as the market looks to find its footing after the latest move.
On the hourly timeframe, the price is hovering just below the 20 EMA at 0.9645, indicating that short-term momentum is currently leaning toward the bears. With the RSI sitting at 42.71, the market is in neutral territory, showing neither overbought nor oversold conditions, which suggests a lack of strong conviction in either direction for now.
Looking ahead, the primary resistance level to watch for a potential trend shift is 0.9802. On the downside, maintaining the immediate support level at 0.9533 is crucial to prevent further structural damage.
How are you navigating this setup—are you holding your position or waiting for a clearer breakout before making a move?
Educational analysis only, not financial advice. DYOR.
$XRP #BinanceSquare #Crypto
XRP is currently seeing a mild pullback as it trades around the 0.9562 level. The price action reflects a period of consolidation following the recent volatility, as the market looks to find its footing after the latest move.
On the hourly timeframe, the price is hovering just below the 20 EMA at 0.9645, indicating that short-term momentum is currently leaning toward the bears. With the RSI sitting at 42.71, the market is in neutral territory, showing neither overbought nor oversold conditions, which suggests a lack of strong conviction in either direction for now.
Looking ahead, the primary resistance level to watch for a potential trend shift is 0.9802. On the downside, maintaining the immediate support level at 0.9533 is crucial to prevent further structural damage.
How are you navigating this setup—are you holding your position or waiting for a clearer breakout before making a move?
Educational analysis only, not financial advice. DYOR.
$XRP #BinanceSquare #Crypto
On the hourly timeframe, the price is hovering just below the 20 EMA at 0.9645, indicating that short-term momentum is currently leaning toward the bears. With the RSI sitting at 42.71, the market is in neutral territory, showing neither overbought nor oversold conditions, which suggests a lack of strong conviction in either direction for now.
Looking ahead, the primary resistance level to watch for a potential trend shift is 0.9802. On the downside, maintaining the immediate support level at 0.9533 is crucial to prevent further structural damage.
How are you navigating this setup—are you holding your position or waiting for a clearer breakout before making a move?
Educational analysis only, not financial advice. DYOR.
$XRP #BinanceSquare #Crypto
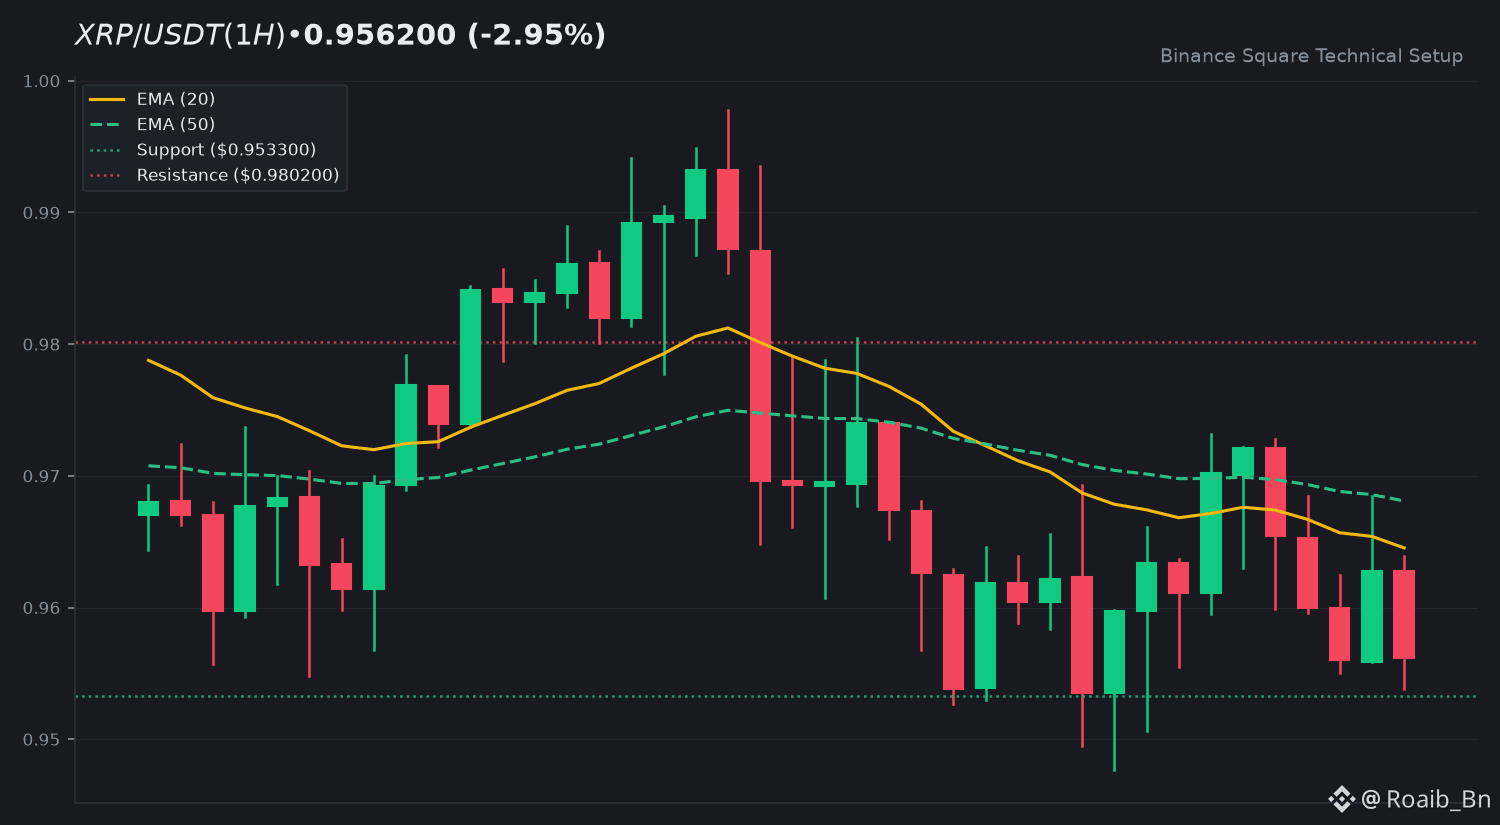
26
·
--
Solana is currently experiencing a mild pullback as it trades near 72.0500. The asset remains in a phase of consolidation following the recent downward pressure, reflecting a cautious sentiment across the broader market today.
On the hourly timeframe, the price is hovering just below the 20 EMA of 72.9074, indicating that sellers maintain a slight edge. With the RSI at 40.26, momentum is currently neutral, showing that the market is neither overbought nor oversold at this specific juncture.
Looking ahead, we need to watch the primary resistance at 74.3500 to see if buyers can reclaim the trend. On the downside, the immediate support level sits at 71.9013, which is critical for maintaining the current structure.
What are your thoughts on this level—are you holding your position or waiting for a clearer breakout?
Educational analysis only, not financial advice. DYOR.
$SOL #BinanceSquare #Crypto
Solana is currently experiencing a mild pullback as it trades near 72.0500. The asset remains in a phase of consolidation following the recent downward pressure, reflecting a cautious sentiment across the broader market today.
On the hourly timeframe, the price is hovering just below the 20 EMA of 72.9074, indicating that sellers maintain a slight edge. With the RSI at 40.26, momentum is currently neutral, showing that the market is neither overbought nor oversold at this specific juncture.
Looking ahead, we need to watch the primary resistance at 74.3500 to see if buyers can reclaim the trend. On the downside, the immediate support level sits at 71.9013, which is critical for maintaining the current structure.
What are your thoughts on this level—are you holding your position or waiting for a clearer breakout?
Educational analysis only, not financial advice. DYOR.
$SOL #BinanceSquare #Crypto
On the hourly timeframe, the price is hovering just below the 20 EMA of 72.9074, indicating that sellers maintain a slight edge. With the RSI at 40.26, momentum is currently neutral, showing that the market is neither overbought nor oversold at this specific juncture.
Looking ahead, we need to watch the primary resistance at 74.3500 to see if buyers can reclaim the trend. On the downside, the immediate support level sits at 71.9013, which is critical for maintaining the current structure.
What are your thoughts on this level—are you holding your position or waiting for a clearer breakout?
Educational analysis only, not financial advice. DYOR.
$SOL #BinanceSquare #Crypto
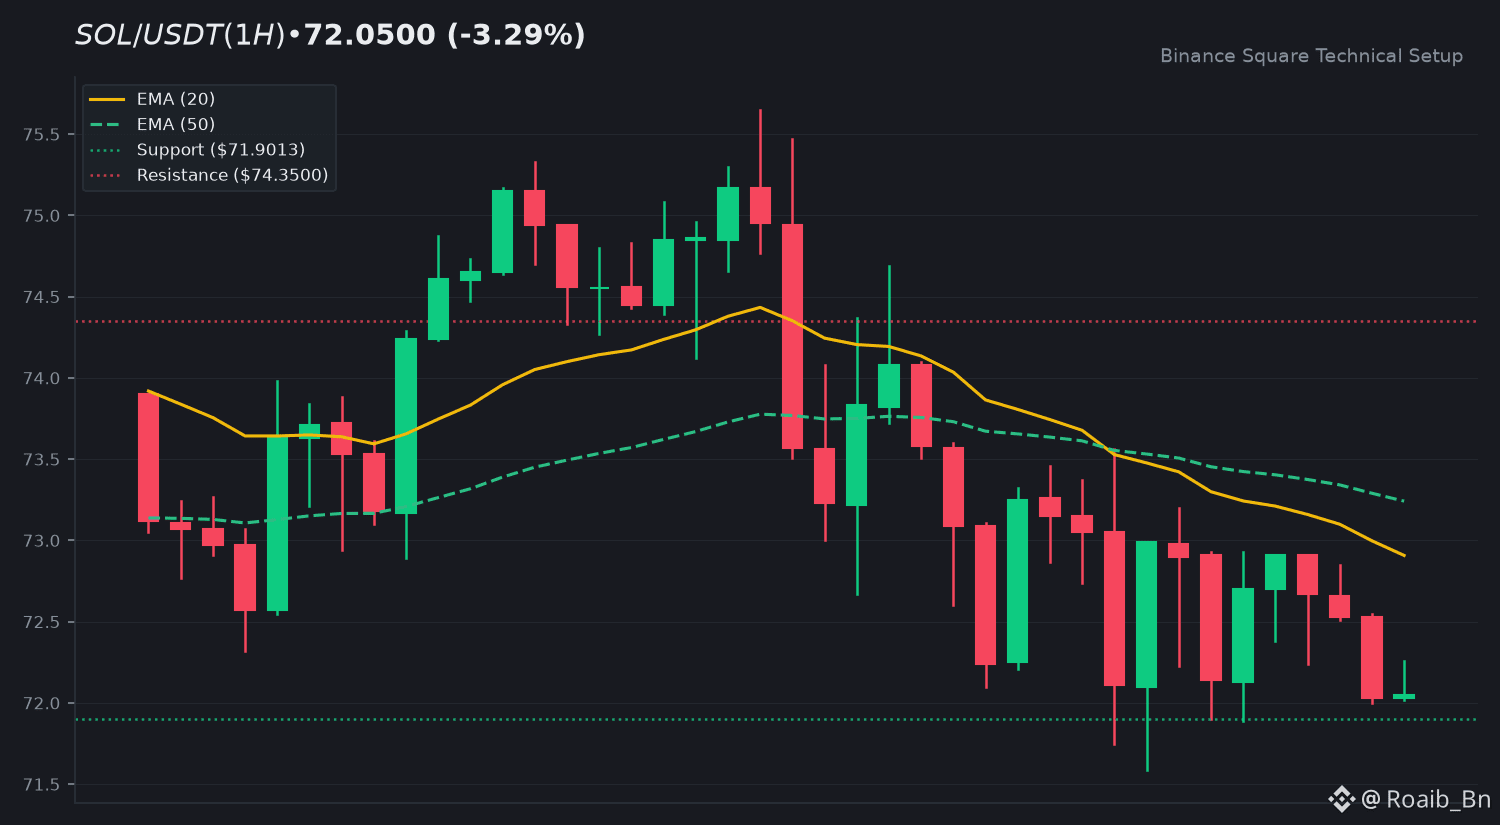
24
Log in to explore more content
Join global crypto users on Binance Square
⚡️ Get latest and useful information about crypto.
💬 Trusted by the world’s largest crypto exchange.
👍 Discover real insights from verified creators.
Email / Phone number
Trending Topics
CanBTCReboundAfterFallingBelow60K?
360,624 views
1,510 Discussing
Bitcoin News | Bitcoin Falls Below $60,000 for the First Time Since July as IBIT Posts Record $541 Million Outflow
Binance News
·52 Likes
·99k views
GlobalStocksFaceLongestLosingStreakSince2023
119,016 views
1,079 Discussing
BlackRockIBITPostsRecord$541MSingleDayOutflow
613 views
16 Discussing