
TokenScan SD
261 Posts

TokenScan SD
Report
Block User
Crypto Analyzer,web3 tool builder and security Token Analyze 🔥 Don't Fomo before Scan,🔎 Check Liquidity,holder and security Token with TokenScan SD🔎
Open Trade
Occasional Trader
4.3 Years
80 Following
28 Followers
62 Liked
Posts
Portfolio
All
Quotes
Videos
·
--
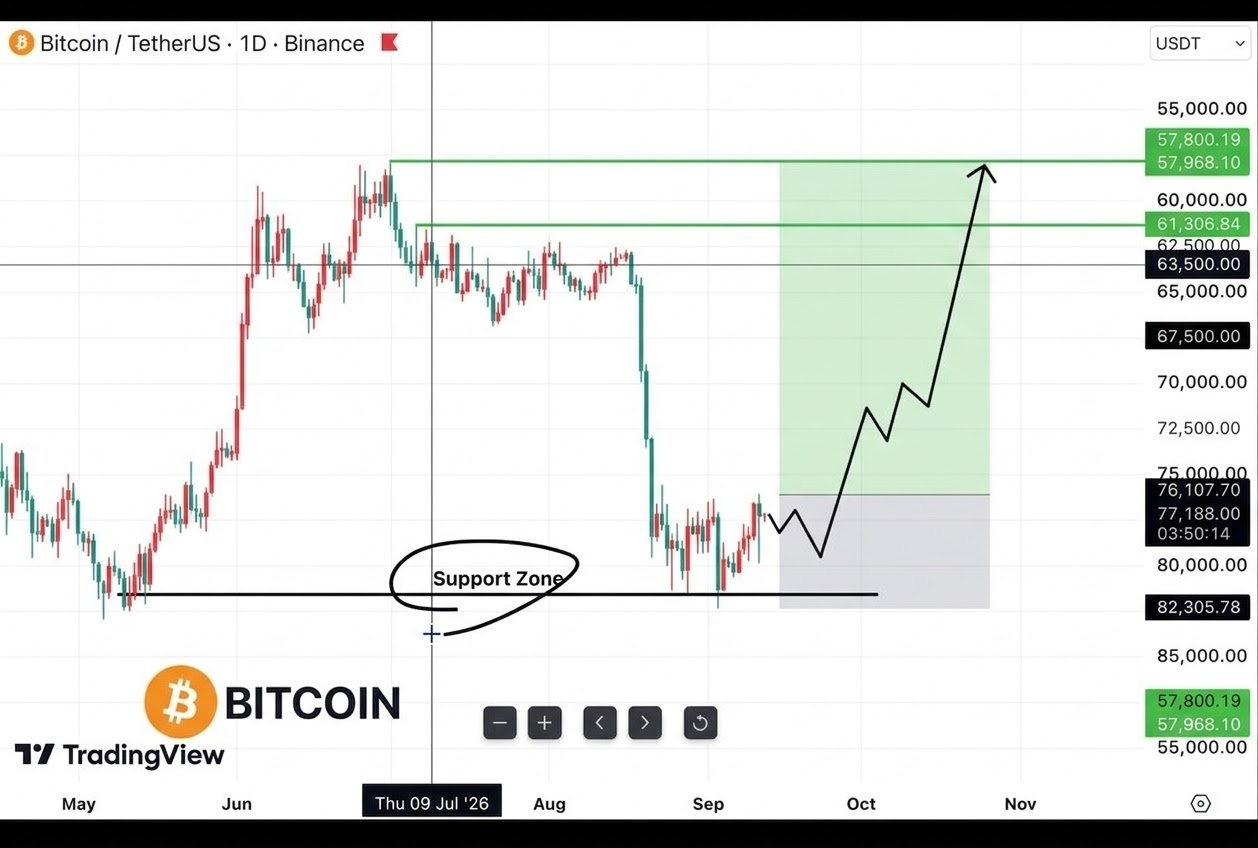
📊 BTC/USDT Outlook — Bullish Setup from the Support Zone
Bitcoin is currently consolidating in a Support Zone that has been tested several times. If this support remains solid, there is a chance for a reversal toward the resistance area at 61,300 and then onward to the 57,800–58,000 zone as the next target.
A higher-low structure has begun forming after yesterday’s sharp correction—an indication of potential medium-term uptrend if volume supports it.
⚠️ This is a technical projection, not a buy/sell signal. Always cross-check with a risk scanner before executing & do your own research (DYOR).
#Bitcoin #BTC #cryptoindonesia #TokenScanSD
$BTC
{spot}(BTCUSDT)
📊 BTC/USDT Outlook — Bullish Setup from the Support Zone
Bitcoin is currently consolidating in a Support Zone that has been tested several times. If this support remains solid, there is a chance for a reversal toward the resistance area at 61,300 and then onward to the 57,800–58,000 zone as the next target.
A higher-low structure has begun forming after yesterday’s sharp correction—an indication of potential medium-term uptrend if volume supports it.
⚠️ This is a technical projection, not a buy/sell signal. Always cross-check with a risk scanner before executing & do your own research (DYOR).
#Bitcoin #BTC #cryptoindonesia #TokenScanSD
$BTC
Bitcoin is currently consolidating in a Support Zone that has been tested several times. If this support remains solid, there is a chance for a reversal toward the resistance area at 61,300 and then onward to the 57,800–58,000 zone as the next target.
A higher-low structure has begun forming after yesterday’s sharp correction—an indication of potential medium-term uptrend if volume supports it.
⚠️ This is a technical projection, not a buy/sell signal. Always cross-check with a risk scanner before executing & do your own research (DYOR).
#Bitcoin #BTC #cryptoindonesia #TokenScanSD
$BTC
2
753
·
--
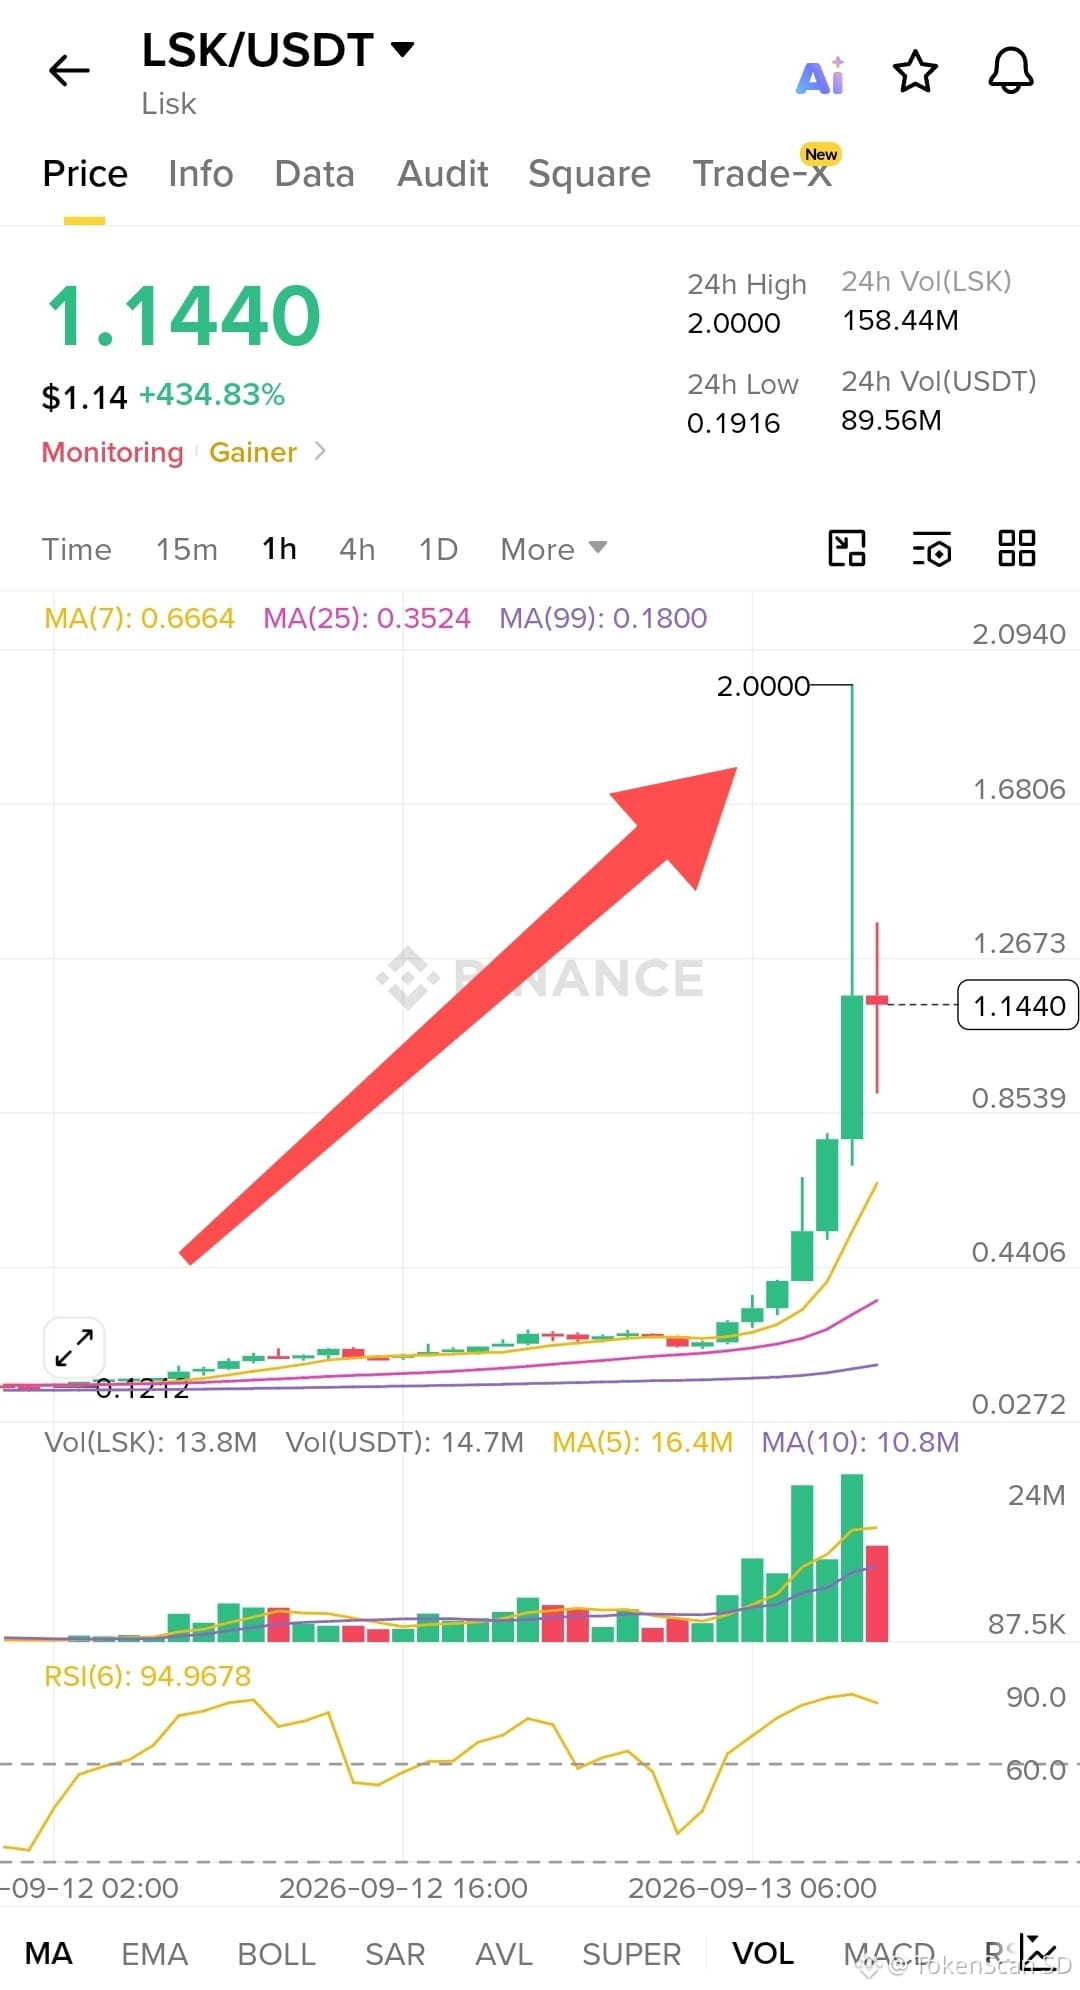
What do you think about the LSK coin?
LSK was 0.12 earlier, briefly hit 2.00, now it’s 1.05. Up +434% in a day.
Not “Lisk season.”
It’s an old coin the market suddenly remembered.
The key points:
Wick to 2.00 = someone sold to those who were late
RSI 95 = breathing on your neck, not the start of the party
Last volume is red = lots of activity, then someone left
Price is still above MA7 0.66, so the short-term trend hasn’t broken yet
The rise is vertical. The foundation is thin.
If it holds at 1.00, it’s still alive.
If it breaks to 0.66, the party has already paid for catering.
Don’t buy just because it’s green.
Don’t marry a coin that just woke up.
DYOR. Not financial advice.
$LSK
{future}(LSKUSDT)
What do you think about the LSK coin?
LSK was 0.12 earlier, briefly hit 2.00, now it’s 1.05. Up +434% in a day.
Not “Lisk season.”
It’s an old coin the market suddenly remembered.
The key points:
Wick to 2.00 = someone sold to those who were late
RSI 95 = breathing on your neck, not the start of the party
Last volume is red = lots of activity, then someone left
Price is still above MA7 0.66, so the short-term trend hasn’t broken yet
The rise is vertical. The foundation is thin.
If it holds at 1.00, it’s still alive.
If it breaks to 0.66, the party has already paid for catering.
Don’t buy just because it’s green.
Don’t marry a coin that just woke up.
DYOR. Not financial advice.
$LSK
LSK was 0.12 earlier, briefly hit 2.00, now it’s 1.05. Up +434% in a day.
Not “Lisk season.”
It’s an old coin the market suddenly remembered.
The key points:
Wick to 2.00 = someone sold to those who were late
RSI 95 = breathing on your neck, not the start of the party
Last volume is red = lots of activity, then someone left
Price is still above MA7 0.66, so the short-term trend hasn’t broken yet
The rise is vertical. The foundation is thin.
If it holds at 1.00, it’s still alive.
If it breaks to 0.66, the party has already paid for catering.
Don’t buy just because it’s green.
Don’t marry a coin that just woke up.
DYOR. Not financial advice.
$LSK
1k
·
--
🚨All altcoins will be like this eventually
Not a threat. This is a pattern that has repeated.
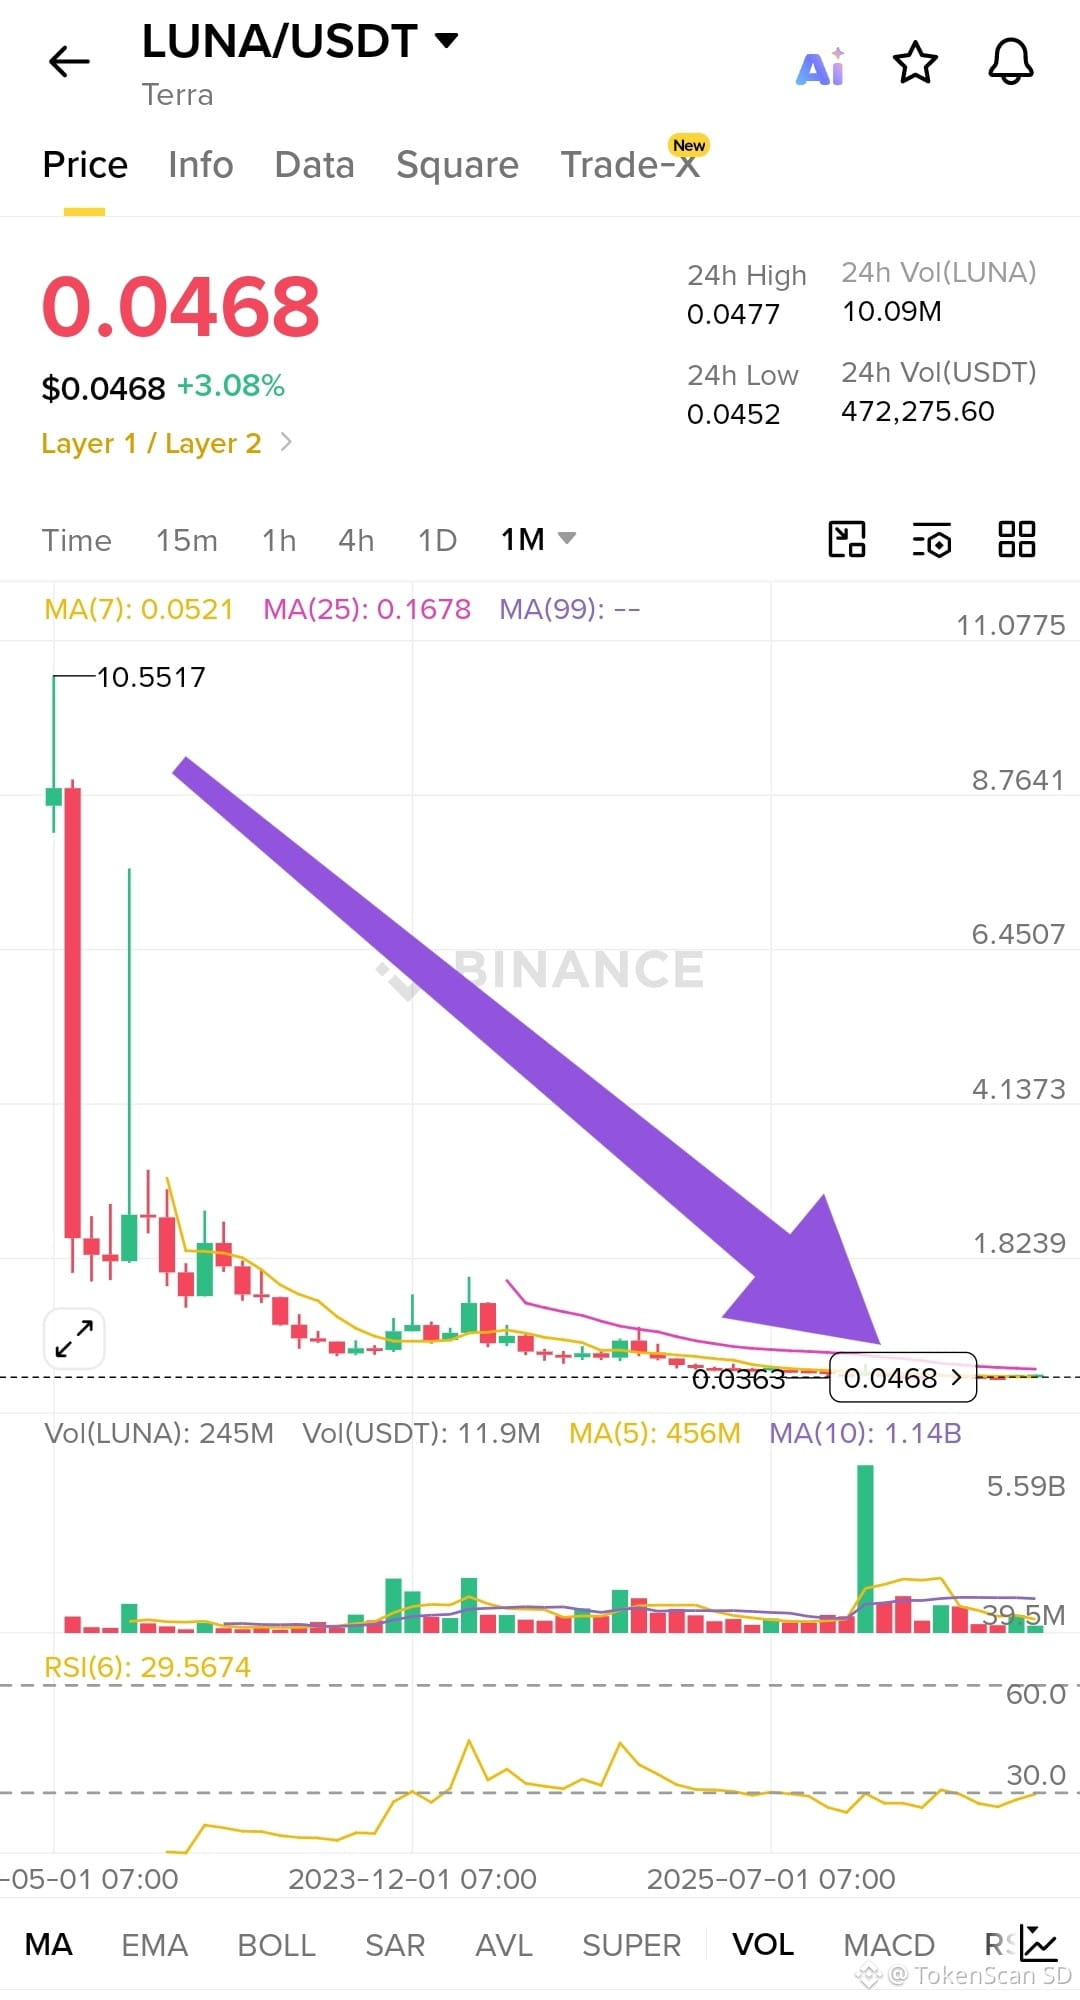
1. LUNA
It once hit 10.55. Now it’s 0.04668.
From the peak to here, the monthly chart only goes one way: down, down, then flat at the bottom. There’s still volume, RSI is low, and green price +3% today. That’s not a comeback. It’s dust that’s still moving.
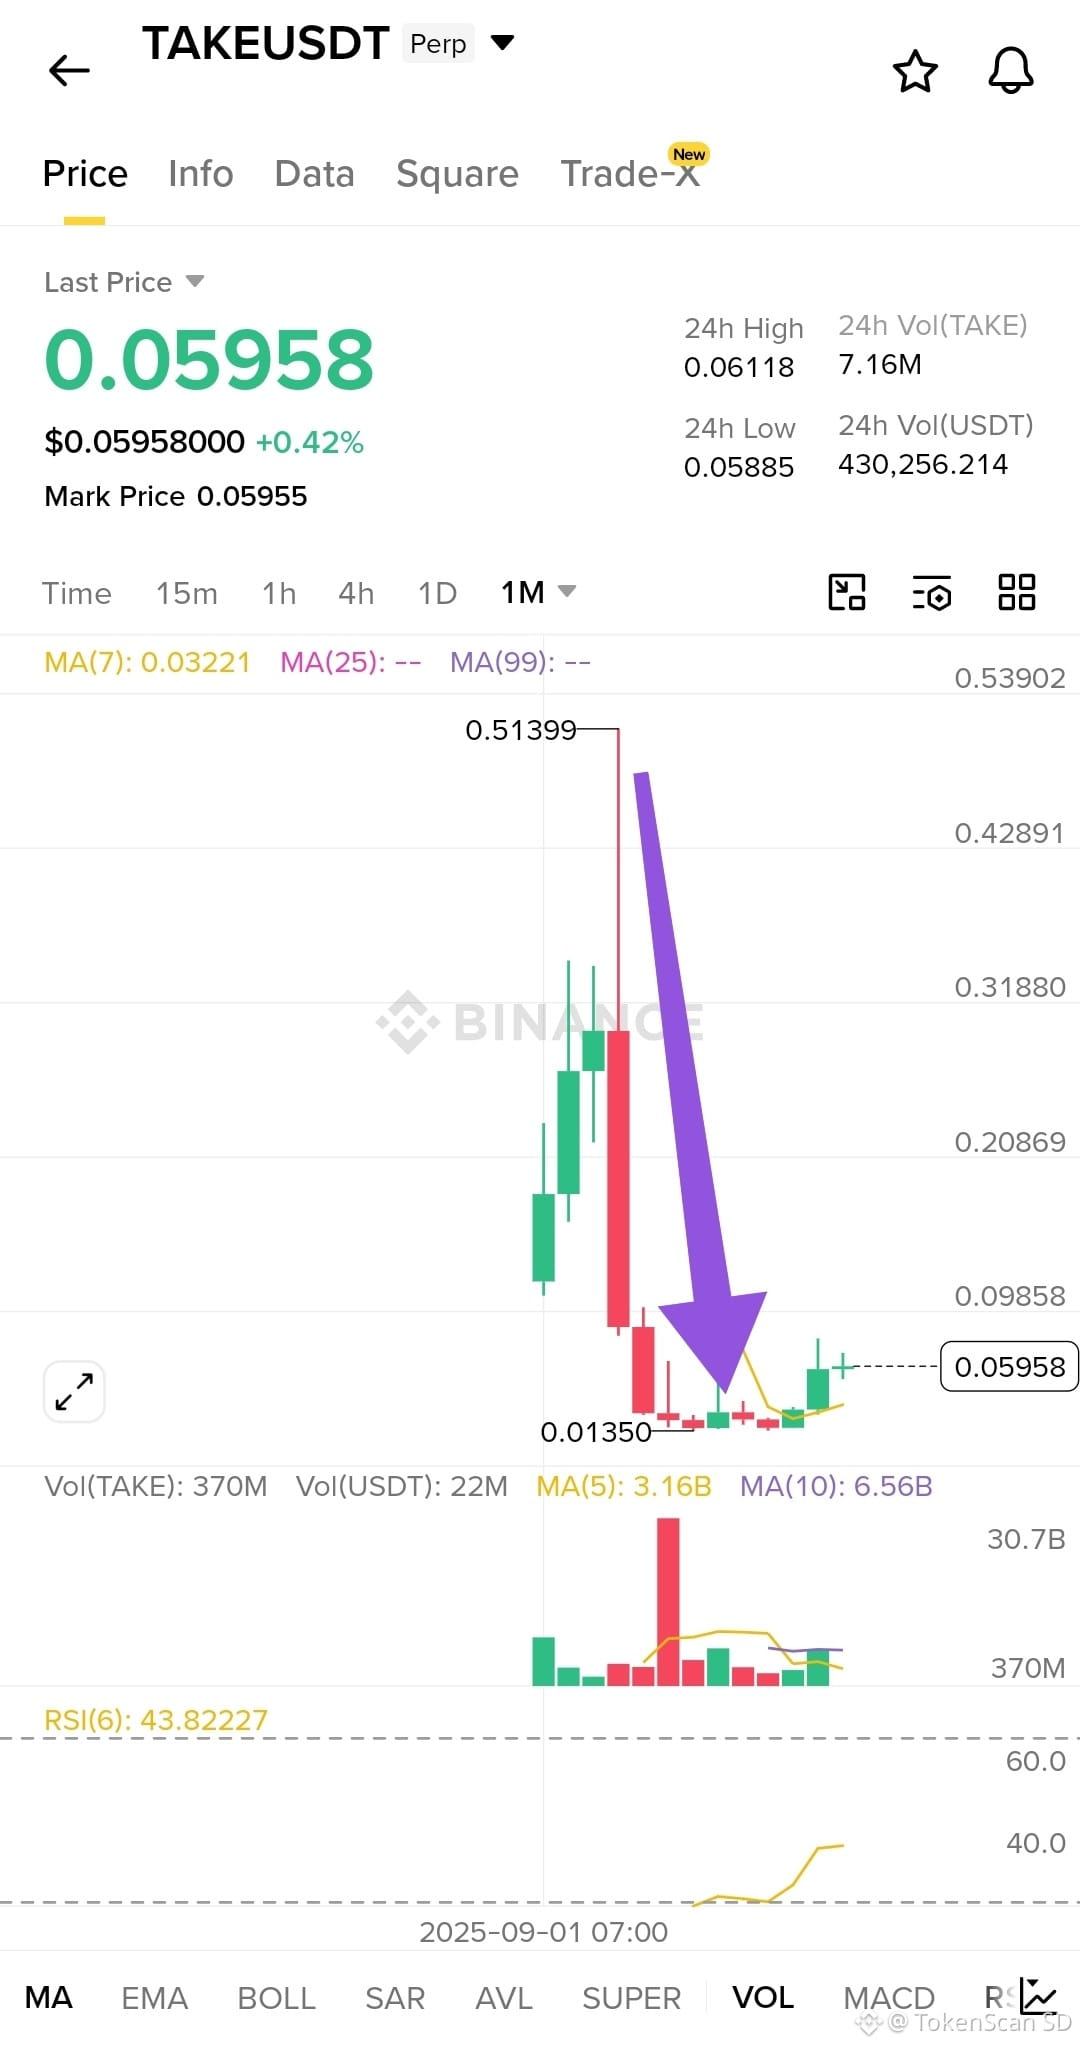
2. TAKE
Peak at 0.513. Fell to 0.01350. Now it’s 0.05958.
It goes up a bit after being smashed, and people start calling it “recovery.” But it’s still far from the ATH. One big red candle is enough to erase the narrative.
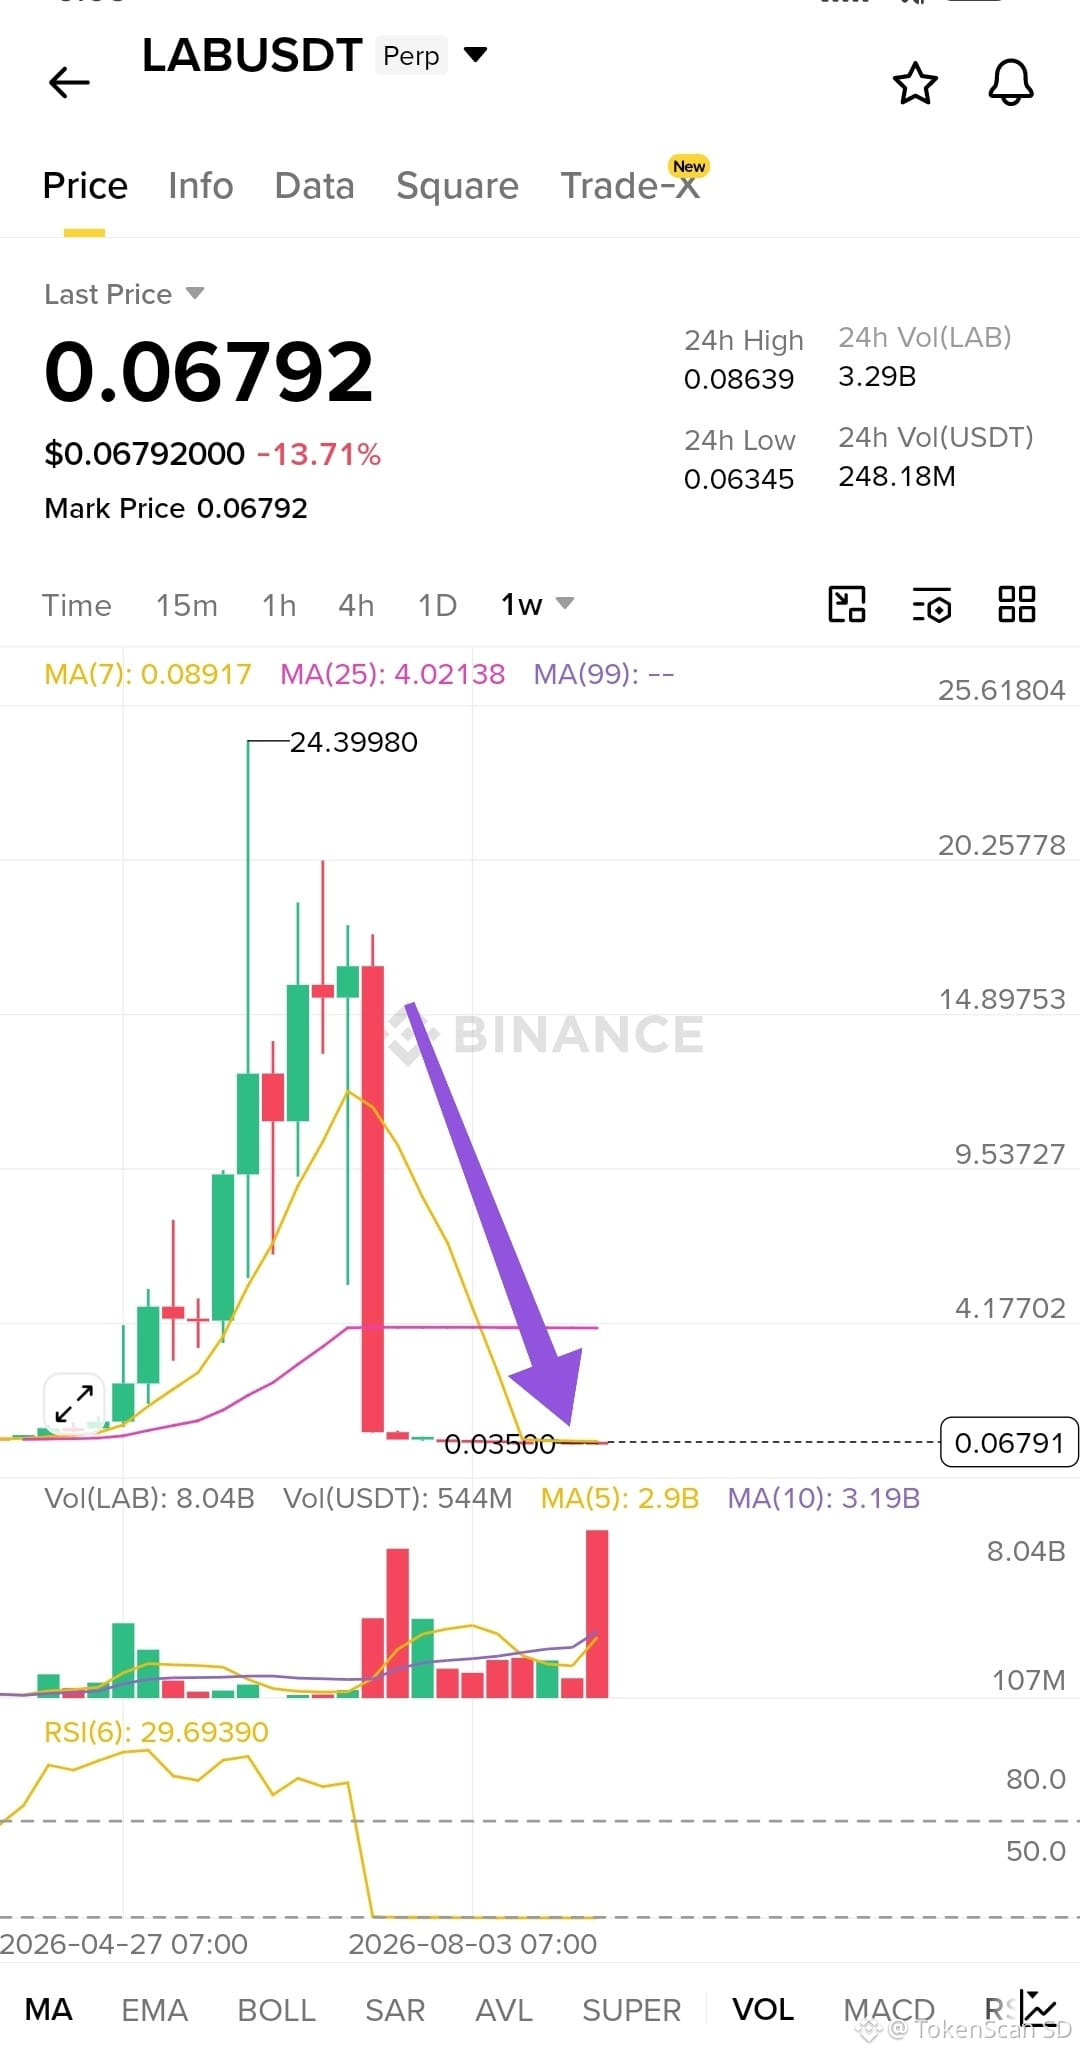
3. LAB
Faster story.
Climbed to 24.39, then got cut down. Now 0.0678, down 13.7% in a day.
RSI is in a weak zone. Big volume on the red candle. This isn’t a “dip”; it’s distribution that’s already finished.
Three charts, one template ☕
👉New narrative
👉Price rockets
👉Liquidity comes in
👉Smart money exits
👉The chart turns into an arrow to the bottom-right
What’s left holding the bag, waiting
“for the next cycle”
Bitcoin can recover because it’s an index of network trust.
Most major altcoins don’t have that. They have moments, timelines, KOLs, and expiration dates.
What looks “alive” today may just be waiting for the right time to die.
Later, the charts will look like these three: a peak on the left, the needle on the bottom-right, and the caption “still early.”
Not that there’s no pump,
There is—but Brief.
After that, the market does the same thing to the next names.
Don’t read this chart as a buy signal.
Read it as a reminder ☝️that in crypto, the damaging time comes late—and those who know when to be done end up helping themselves.
DYOR. Not financial advice.
#story #altcoins
$LUNA
{spot}(LUNAUSDT)
$TAKE
{future}(TAKEUSDT)
$LAB
{future}(LABUSDT)
🚨All altcoins will be like this eventually
Not a threat. This is a pattern that has repeated.
1. LUNA
It once hit 10.55. Now it’s 0.04668.
From the peak to here, the monthly chart only goes one way: down, down, then flat at the bottom. There’s still volume, RSI is low, and green price +3% today. That’s not a comeback. It’s dust that’s still moving.
2. TAKE
Peak at 0.513. Fell to 0.01350. Now it’s 0.05958.
It goes up a bit after being smashed, and people start calling it “recovery.” But it’s still far from the ATH. One big red candle is enough to erase the narrative.
3. LAB
Faster story.
Climbed to 24.39, then got cut down. Now 0.0678, down 13.7% in a day.
RSI is in a weak zone. Big volume on the red candle. This isn’t a “dip”; it’s distribution that’s already finished.
Three charts, one template ☕
👉New narrative
👉Price rockets
👉Liquidity comes in
👉Smart money exits
👉The chart turns into an arrow to the bottom-right
What’s left holding the bag, waiting
“for the next cycle”
Bitcoin can recover because it’s an index of network trust.
Most major altcoins don’t have that. They have moments, timelines, KOLs, and expiration dates.
What looks “alive” today may just be waiting for the right time to die.
Later, the charts will look like these three: a peak on the left, the needle on the bottom-right, and the caption “still early.”
Not that there’s no pump,
There is—but Brief.
After that, the market does the same thing to the next names.
Don’t read this chart as a buy signal.
Read it as a reminder ☝️that in crypto, the damaging time comes late—and those who know when to be done end up helping themselves.
DYOR. Not financial advice.
#story #altcoins
$LUNA
$TAKE
$LAB
Not a threat. This is a pattern that has repeated.
1. LUNA
It once hit 10.55. Now it’s 0.04668.
From the peak to here, the monthly chart only goes one way: down, down, then flat at the bottom. There’s still volume, RSI is low, and green price +3% today. That’s not a comeback. It’s dust that’s still moving.
2. TAKE
Peak at 0.513. Fell to 0.01350. Now it’s 0.05958.
It goes up a bit after being smashed, and people start calling it “recovery.” But it’s still far from the ATH. One big red candle is enough to erase the narrative.
3. LAB
Faster story.
Climbed to 24.39, then got cut down. Now 0.0678, down 13.7% in a day.
RSI is in a weak zone. Big volume on the red candle. This isn’t a “dip”; it’s distribution that’s already finished.
Three charts, one template ☕
👉New narrative
👉Price rockets
👉Liquidity comes in
👉Smart money exits
👉The chart turns into an arrow to the bottom-right
What’s left holding the bag, waiting
“for the next cycle”
Bitcoin can recover because it’s an index of network trust.
Most major altcoins don’t have that. They have moments, timelines, KOLs, and expiration dates.
What looks “alive” today may just be waiting for the right time to die.
Later, the charts will look like these three: a peak on the left, the needle on the bottom-right, and the caption “still early.”
Not that there’s no pump,
There is—but Brief.
After that, the market does the same thing to the next names.
Don’t read this chart as a buy signal.
Read it as a reminder ☝️that in crypto, the damaging time comes late—and those who know when to be done end up helping themselves.
DYOR. Not financial advice.
#story #altcoins
$LUNA
$TAKE
$LAB
702
·
--
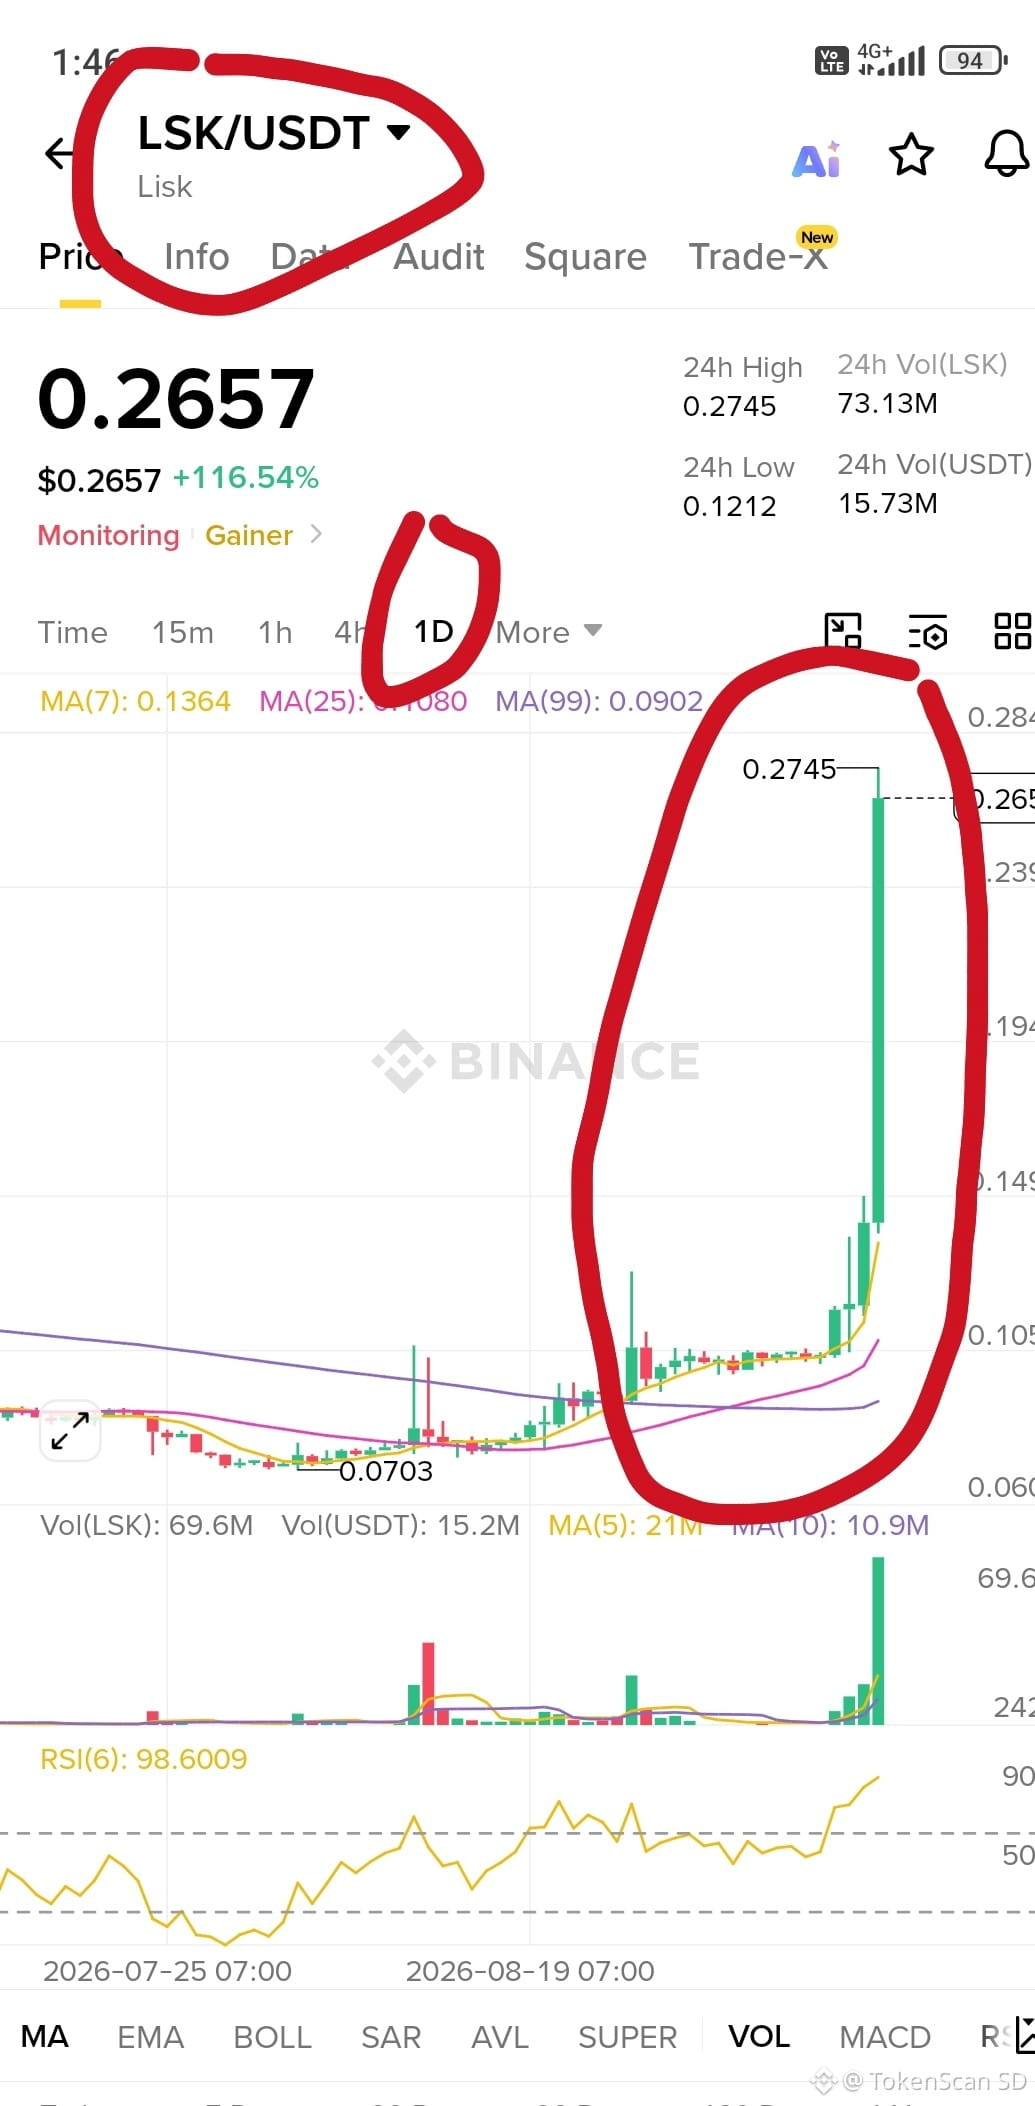
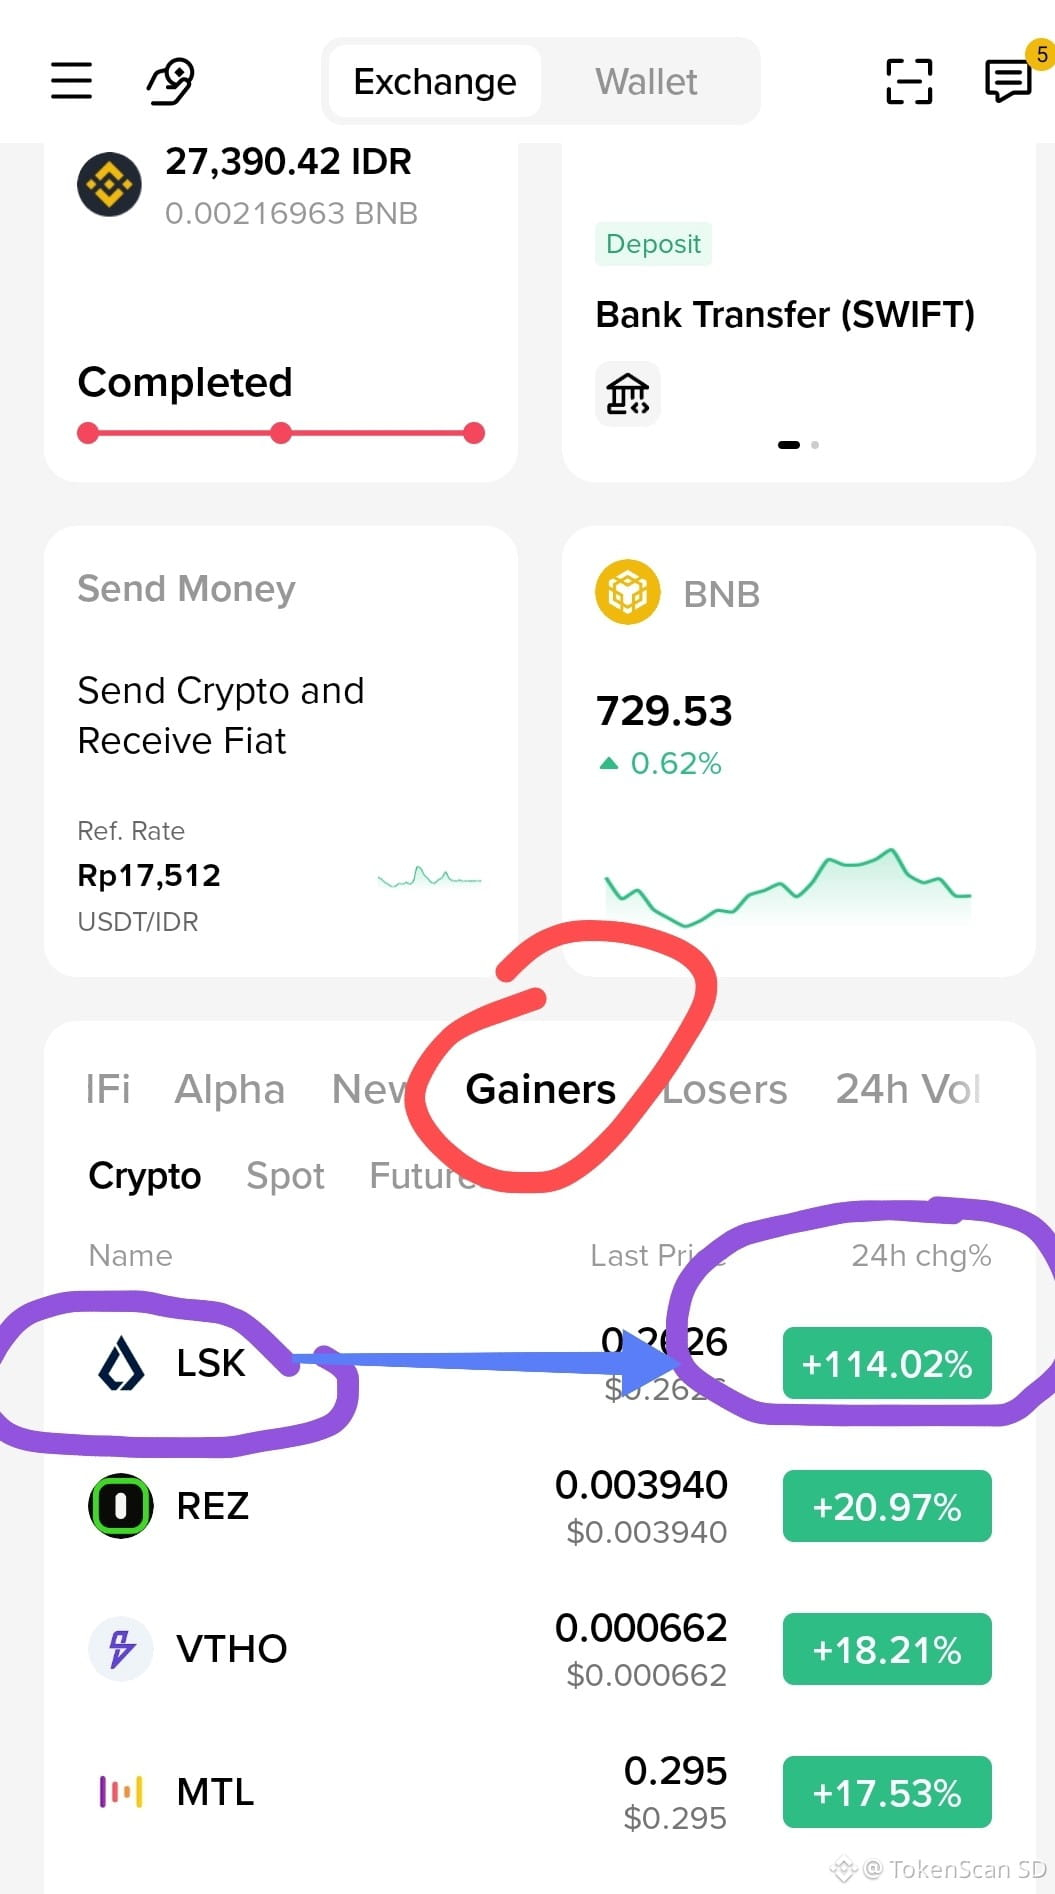
$LSK just became a stage star, from 0.0703 rocketing to 0.2745, green fireworks +116%! Entering the #1 Gainers list, beating REZ, VTHO—everyone else move aside.
But take a look at the RSI... 98.6! This isn’t overbought anymore, it’s already 'over-everything' 🥵 The long green candle is like a rocket with no brakes, and the volume suddenly exploded while the price is already up in the sky.
Realistically: a pump this wild rarely comes down smoothly. Those who got in late usually become the cushion for those who sold first. If you’re not in yet, better sit tight and watch the drama from the audience seats. Chasing a green candle with RSI this high is like jumping onto a train that has already left the station 😅 DYOR, don’t just go in on pure hype
NOTE : RSI 98.6, already extreme overbought, +116% in a day. Entry now (long or short) is equally high risk. Wait for reversal signals first before taking a position. DYOR.
$LSK
{future}(LSKUSDT)
$LSK just became a stage star, from 0.0703 rocketing to 0.2745, green fireworks +116%! Entering the #1 Gainers list, beating REZ, VTHO—everyone else move aside.
But take a look at the RSI... 98.6! This isn’t overbought anymore, it’s already 'over-everything' 🥵 The long green candle is like a rocket with no brakes, and the volume suddenly exploded while the price is already up in the sky.
Realistically: a pump this wild rarely comes down smoothly. Those who got in late usually become the cushion for those who sold first. If you’re not in yet, better sit tight and watch the drama from the audience seats. Chasing a green candle with RSI this high is like jumping onto a train that has already left the station 😅 DYOR, don’t just go in on pure hype
NOTE : RSI 98.6, already extreme overbought, +116% in a day. Entry now (long or short) is equally high risk. Wait for reversal signals first before taking a position. DYOR.
$LSK
But take a look at the RSI... 98.6! This isn’t overbought anymore, it’s already 'over-everything' 🥵 The long green candle is like a rocket with no brakes, and the volume suddenly exploded while the price is already up in the sky.
Realistically: a pump this wild rarely comes down smoothly. Those who got in late usually become the cushion for those who sold first. If you’re not in yet, better sit tight and watch the drama from the audience seats. Chasing a green candle with RSI this high is like jumping onto a train that has already left the station 😅 DYOR, don’t just go in on pure hype
NOTE : RSI 98.6, already extreme overbought, +116% in a day. Entry now (long or short) is equally high risk. Wait for reversal signals first before taking a position. DYOR.
$LSK
1
1.8k
·
--
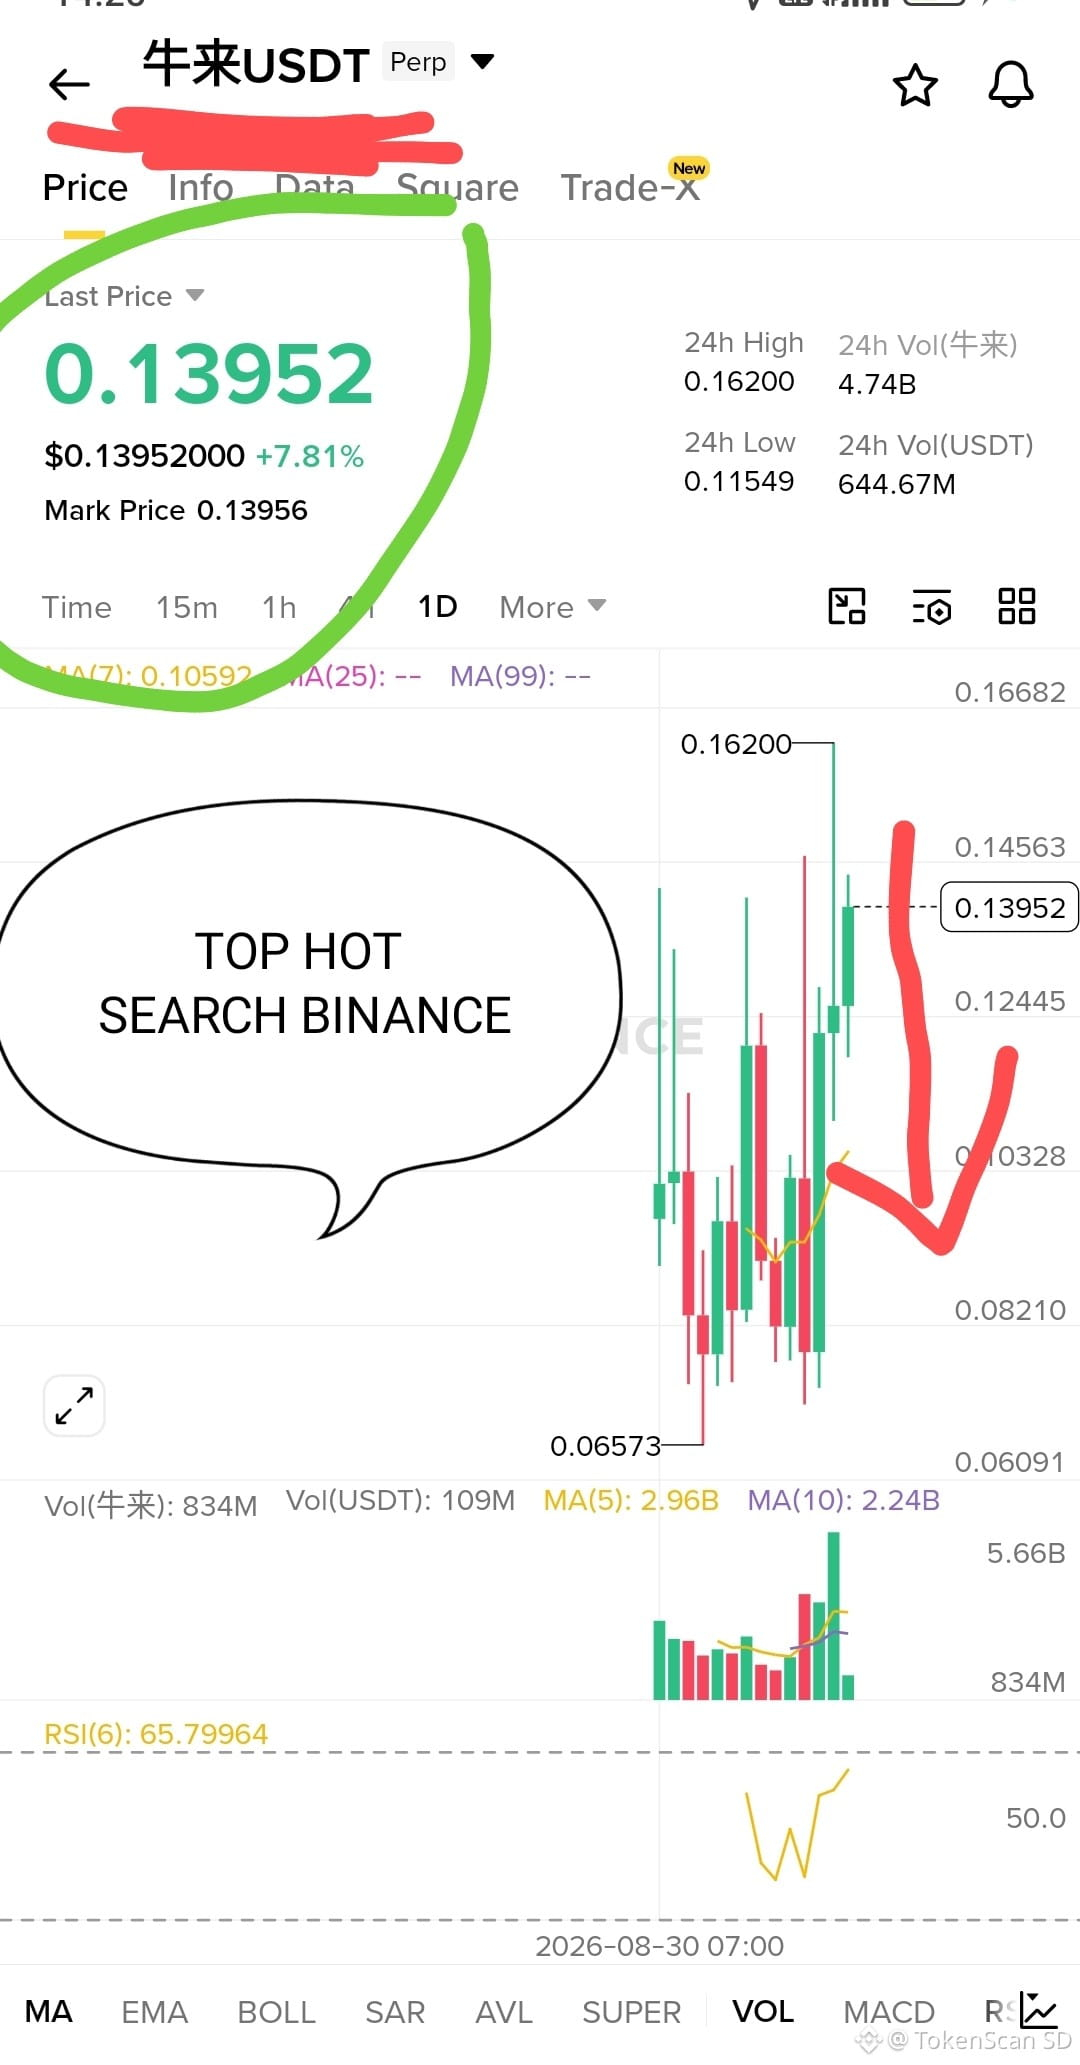
$牛来 still trending, trending again and again,
charts like someone who just got dumped—goes straight to the gym.
From 0.16 got smashed, to 0.11 embraced, now 0.139 again looking up.
Big volume, RSI 65, hot search Binance.
The red pattern on the right looks like a slanted checkmark — “it’s already down, now it’s time to go up… or it gets hit again”.
Conclusion 👉 there is momentum, but this is still a meme cash-cow. Could be rendang, could be satay, could also be meat that’s already gone bad.
Go ahead. Don’t go all-in.
DYOR NFA!
#MEME #crypto #niulai
$牛来
{spot}(牛来USDT)
$牛来 still trending, trending again and again,
charts like someone who just got dumped—goes straight to the gym.
From 0.16 got smashed, to 0.11 embraced, now 0.139 again looking up.
Big volume, RSI 65, hot search Binance.
The red pattern on the right looks like a slanted checkmark — “it’s already down, now it’s time to go up… or it gets hit again”.
Conclusion 👉 there is momentum, but this is still a meme cash-cow. Could be rendang, could be satay, could also be meat that’s already gone bad.
Go ahead. Don’t go all-in.
DYOR NFA!
#MEME #crypto #niulai
$牛来
charts like someone who just got dumped—goes straight to the gym.
From 0.16 got smashed, to 0.11 embraced, now 0.139 again looking up.
Big volume, RSI 65, hot search Binance.
The red pattern on the right looks like a slanted checkmark — “it’s already down, now it’s time to go up… or it gets hit again”.
Conclusion 👉 there is momentum, but this is still a meme cash-cow. Could be rendang, could be satay, could also be meat that’s already gone bad.
Go ahead. Don’t go all-in.
DYOR NFA!
#MEME #crypto #niulai
$牛来
1
768
·
--
😂 "Nasib Artis Dadakan": The One Who Became a Top Gainer Star Yesterday Is Now Caught Sitting in the Top Losers
Is the title being dramatic? But take a look at this data—this really happened:
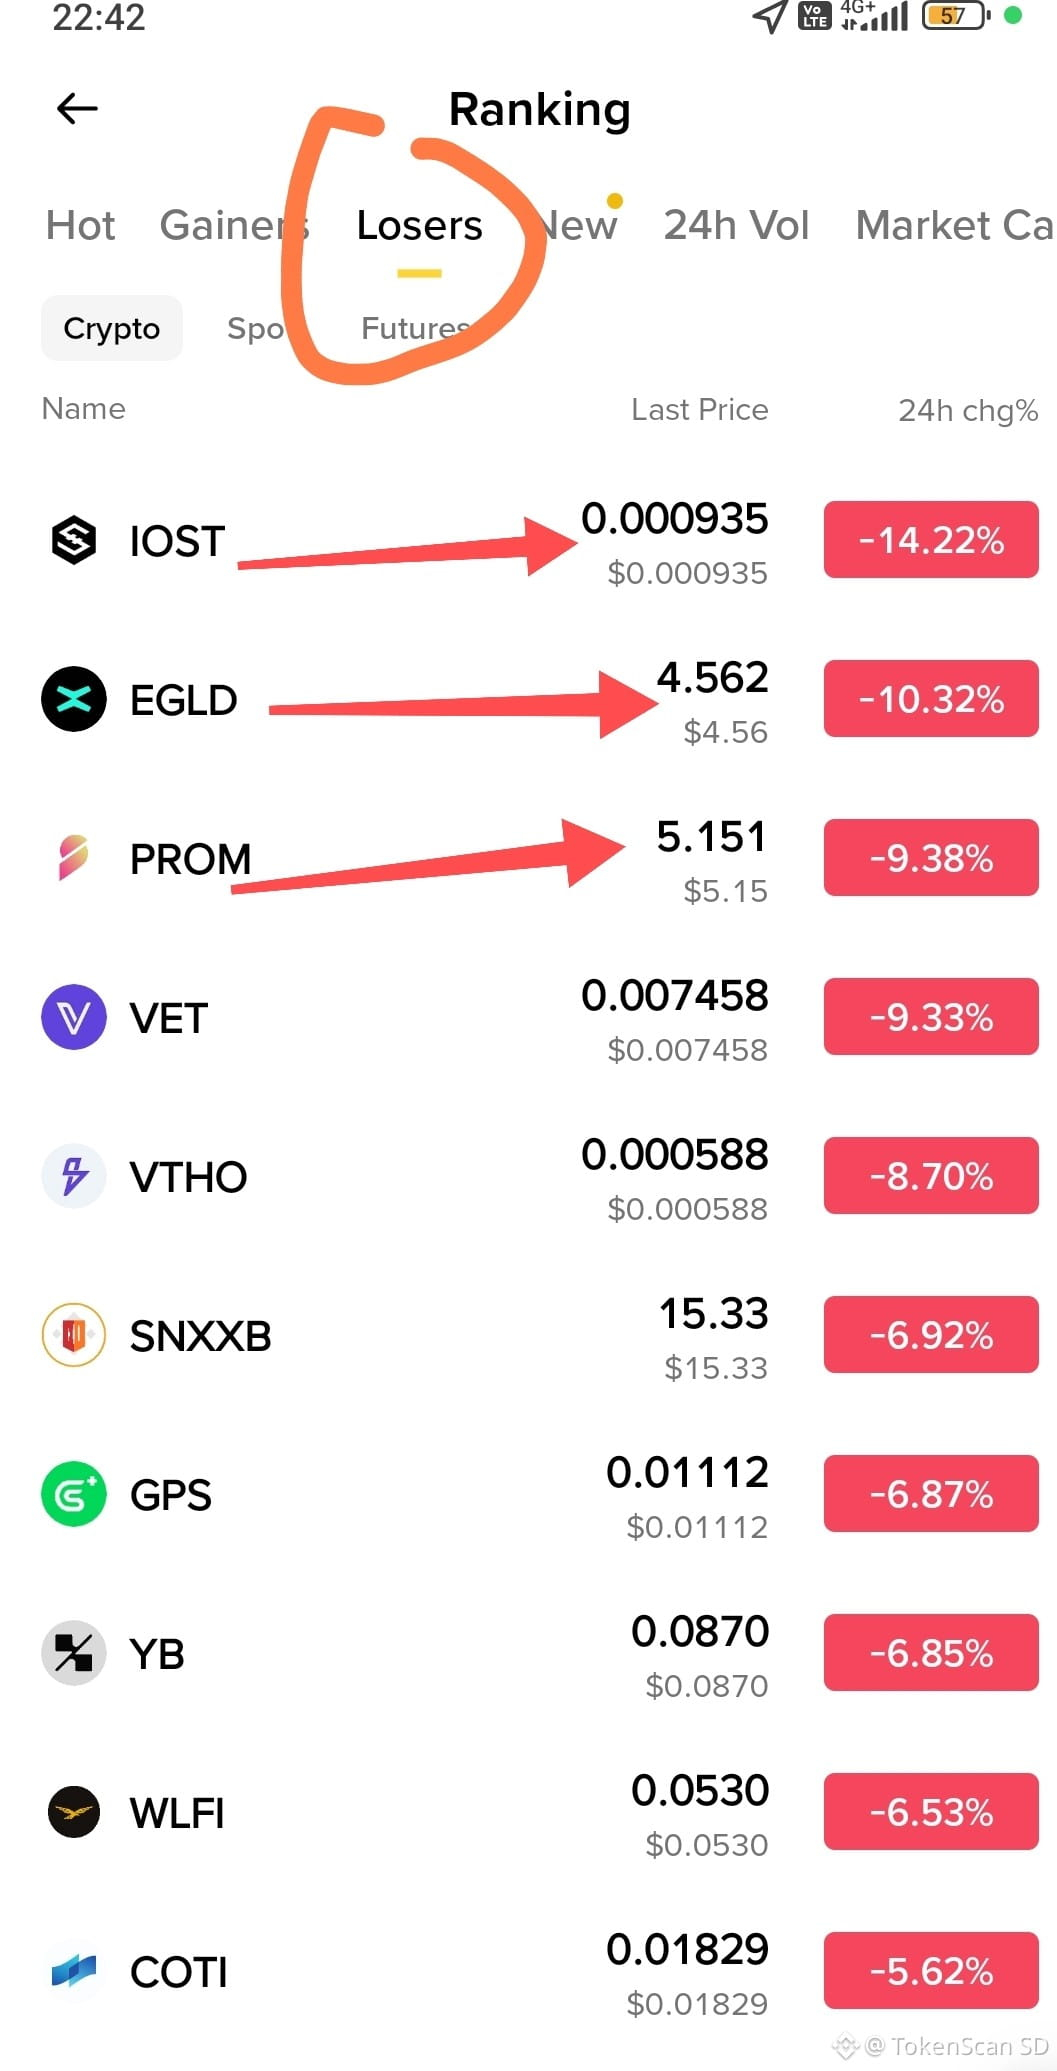
🏆 The day before yesterday, VTHO went viral in the Top Gainers—jumping up to +57% in a single day. People were talking about, "Wow, huge profit, right." At that time, I even said: its RSI is already 87 (severely overbought); usually after this, there’s a sharp correction.
📉 Now? VTHO is sitting in the Top LOSERS, -8.70%. EGLD, which was also in the Top Gainers yesterday (+10%), is now plunging too, -10.32%.
It’s like a soap opera plot: "From the Stage of Honor to an Uninvited Comeback" 🎭
Let’s break down today’s losers lineup, in a fresh and weird version:
🥇 IOST -14.22% → The champion of today’s losers. Like someone who just won the lottery and then his wallet disappears again the next day.
🥈 EGLD -10.32% → Even though yesterday it became a group’s pride. Now it’s like, "Oh right, it was you—the one who was making noise yesterday?"
🥉 PROM -9.38% → A proud name "Prometheus," but the fire went out first today.
VET -9.33%, VTHO -8.70% → A duo of "one-management artists" who went up on stage together, and also stepped off the stage together.
$IOST
{spot}(IOSTUSDT)
$EGLD
{future}(EGLDUSDT)
$PROM
{future}(PROMUSDT)
#TopLosers #EdukasiCrypto #VTHO.24小时交易策略 #EGLD
😂 "Nasib Artis Dadakan": The One Who Became a Top Gainer Star Yesterday Is Now Caught Sitting in the Top Losers
Is the title being dramatic? But take a look at this data—this really happened:
🏆 The day before yesterday, VTHO went viral in the Top Gainers—jumping up to +57% in a single day. People were talking about, "Wow, huge profit, right." At that time, I even said: its RSI is already 87 (severely overbought); usually after this, there’s a sharp correction.
📉 Now? VTHO is sitting in the Top LOSERS, -8.70%. EGLD, which was also in the Top Gainers yesterday (+10%), is now plunging too, -10.32%.
It’s like a soap opera plot: "From the Stage of Honor to an Uninvited Comeback" 🎭
Let’s break down today’s losers lineup, in a fresh and weird version:
🥇 IOST -14.22% → The champion of today’s losers. Like someone who just won the lottery and then his wallet disappears again the next day.
🥈 EGLD -10.32% → Even though yesterday it became a group’s pride. Now it’s like, "Oh right, it was you—the one who was making noise yesterday?"
🥉 PROM -9.38% → A proud name "Prometheus," but the fire went out first today.
VET -9.33%, VTHO -8.70% → A duo of "one-management artists" who went up on stage together, and also stepped off the stage together.
$IOST
$EGLD
$PROM
#TopLosers #EdukasiCrypto #VTHO.24小时交易策略 #EGLD
Is the title being dramatic? But take a look at this data—this really happened:
🏆 The day before yesterday, VTHO went viral in the Top Gainers—jumping up to +57% in a single day. People were talking about, "Wow, huge profit, right." At that time, I even said: its RSI is already 87 (severely overbought); usually after this, there’s a sharp correction.
📉 Now? VTHO is sitting in the Top LOSERS, -8.70%. EGLD, which was also in the Top Gainers yesterday (+10%), is now plunging too, -10.32%.
It’s like a soap opera plot: "From the Stage of Honor to an Uninvited Comeback" 🎭
Let’s break down today’s losers lineup, in a fresh and weird version:
🥇 IOST -14.22% → The champion of today’s losers. Like someone who just won the lottery and then his wallet disappears again the next day.
🥈 EGLD -10.32% → Even though yesterday it became a group’s pride. Now it’s like, "Oh right, it was you—the one who was making noise yesterday?"
🥉 PROM -9.38% → A proud name "Prometheus," but the fire went out first today.
VET -9.33%, VTHO -8.70% → A duo of "one-management artists" who went up on stage together, and also stepped off the stage together.
$IOST
$EGLD
$PROM
#TopLosers #EdukasiCrypto #VTHO.24小时交易策略 #EGLD
1k
·
--
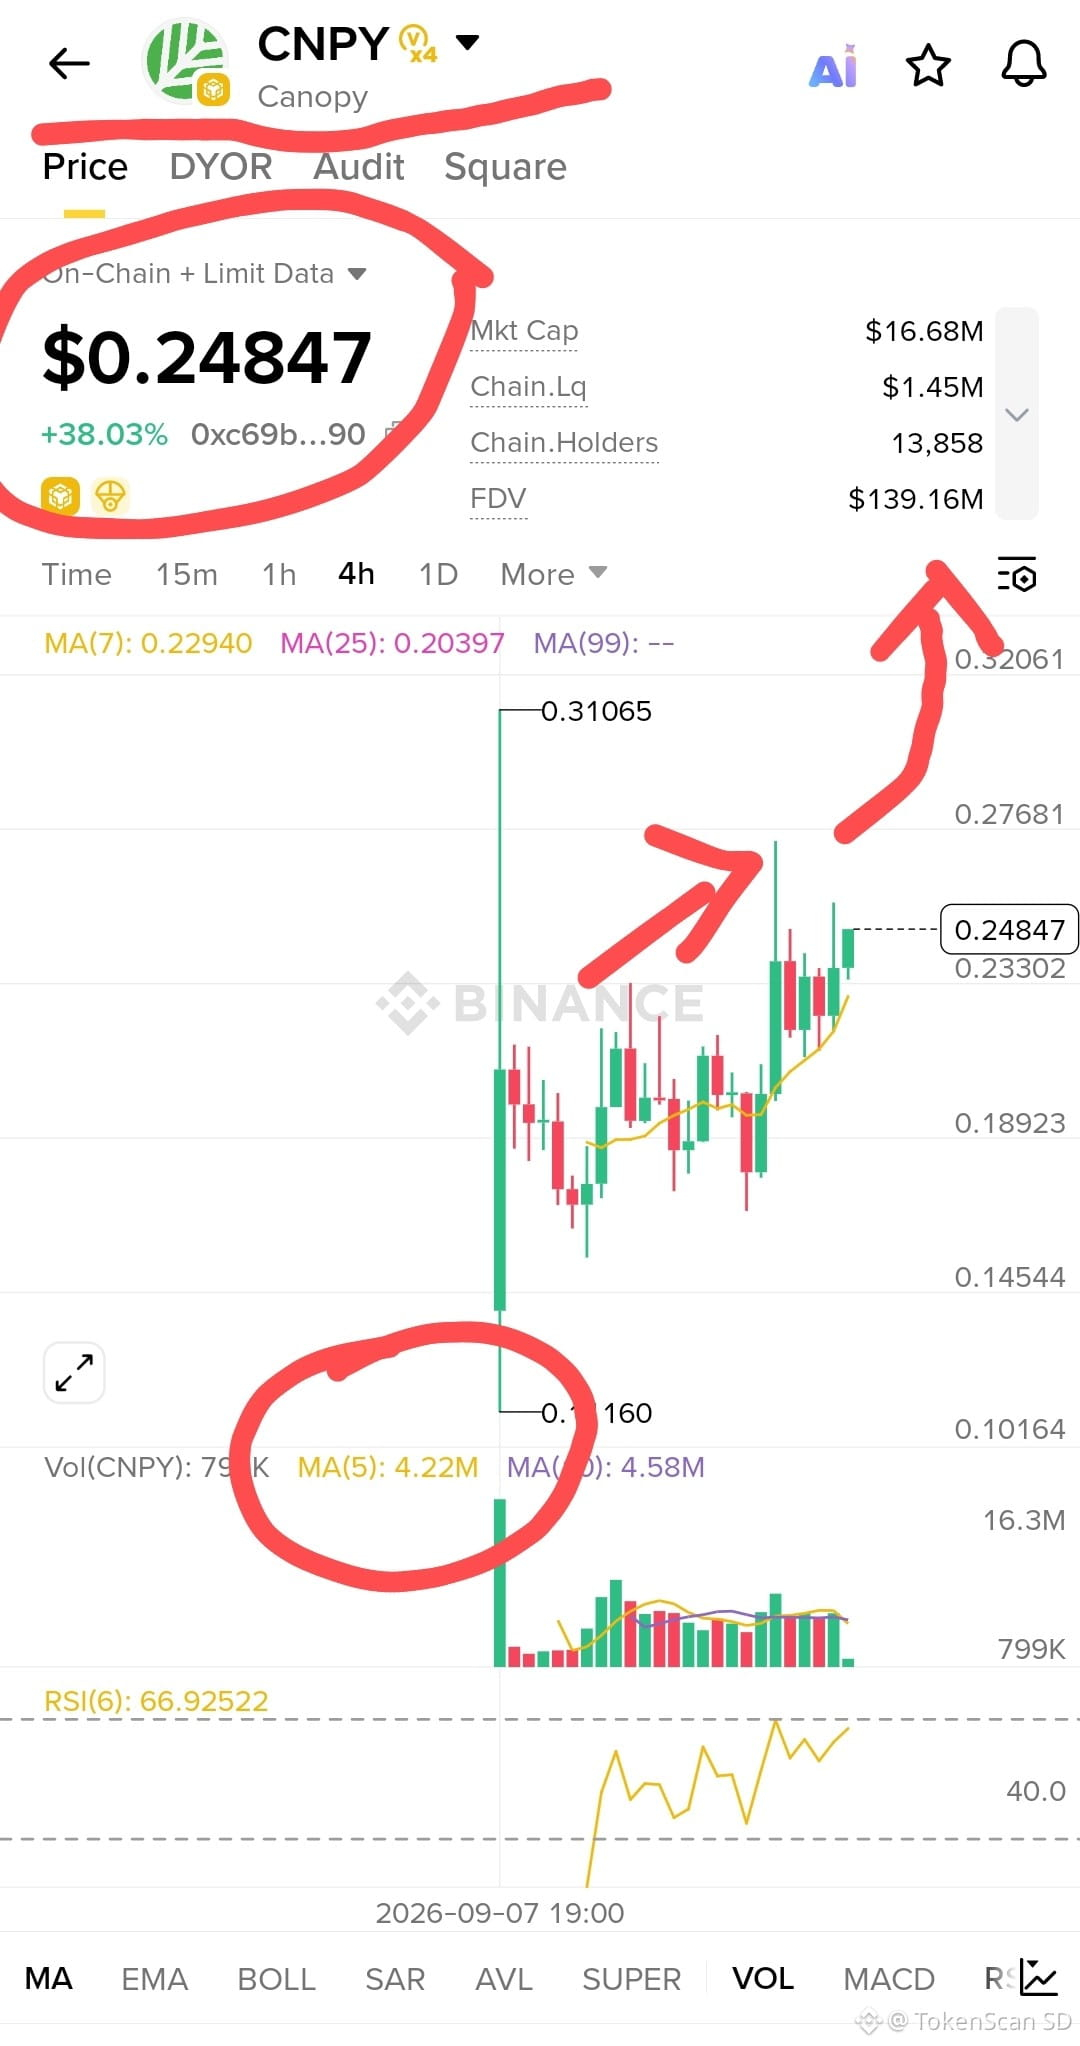
$CNPY (Canopy) — GUE version
Price on chart: $0.248 (+38%)
MC $16.6M
Liq $1.45M
Holders 13.8k
FDV $139M
Not a coin “dogs wearing hats.” This is AI infrastructure to build an appchain with ~200 lines of code. $CNPY = pay gas + stake + borrow security from someone else’s chain. Seed $8.5M. Listed 7 Sep on Alpha/Bitget/Gate. Circulation is only ~12% of the max 560 million. The rest is still waiting in line to come out. 👋
Chart 4H:
That first green candle isn’t accumulation—people are fighting for seats. High $0.31, now sitting at $0.248, still above MA7/MA25. RSI 67 = a bit hot, not knocked out yet.
Support: 0.23 – 0.19
Resistance: 0.27 – 0.31
Volume vs MC is insane. Good for trading, bad for your ego.
Conclusion: good narrative, listing timing is nice, price already ran first. Chasing +38% = buying a concert ticket for songs that haven’t started yet. Wait for a pullback, small size, don’t marry the green candle.🤪
DYOR. Not a signal. If you lose money, don’t tag me—tag the MA7.
#Canopy #NewListing
$CNPY
{alpha}(560xc69b16cf18cea1e5d0bb6a1a9db802097790ddd2)
$CNPY (Canopy) — GUE version
Price on chart: $0.248 (+38%)
MC $16.6M
Liq $1.45M
Holders 13.8k
FDV $139M
Not a coin “dogs wearing hats.” This is AI infrastructure to build an appchain with ~200 lines of code. $CNPY = pay gas + stake + borrow security from someone else’s chain. Seed $8.5M. Listed 7 Sep on Alpha/Bitget/Gate. Circulation is only ~12% of the max 560 million. The rest is still waiting in line to come out. 👋
Chart 4H:
That first green candle isn’t accumulation—people are fighting for seats. High $0.31, now sitting at $0.248, still above MA7/MA25. RSI 67 = a bit hot, not knocked out yet.
Support: 0.23 – 0.19
Resistance: 0.27 – 0.31
Volume vs MC is insane. Good for trading, bad for your ego.
Conclusion: good narrative, listing timing is nice, price already ran first. Chasing +38% = buying a concert ticket for songs that haven’t started yet. Wait for a pullback, small size, don’t marry the green candle.🤪
DYOR. Not a signal. If you lose money, don’t tag me—tag the MA7.
#Canopy #NewListing
$CNPY
Price on chart: $0.248 (+38%)
MC $16.6M
Liq $1.45M
Holders 13.8k
FDV $139M
Not a coin “dogs wearing hats.” This is AI infrastructure to build an appchain with ~200 lines of code. $CNPY = pay gas + stake + borrow security from someone else’s chain. Seed $8.5M. Listed 7 Sep on Alpha/Bitget/Gate. Circulation is only ~12% of the max 560 million. The rest is still waiting in line to come out. 👋
Chart 4H:
That first green candle isn’t accumulation—people are fighting for seats. High $0.31, now sitting at $0.248, still above MA7/MA25. RSI 67 = a bit hot, not knocked out yet.
Support: 0.23 – 0.19
Resistance: 0.27 – 0.31
Volume vs MC is insane. Good for trading, bad for your ego.
Conclusion: good narrative, listing timing is nice, price already ran first. Chasing +38% = buying a concert ticket for songs that haven’t started yet. Wait for a pullback, small size, don’t marry the green candle.🤪
DYOR. Not a signal. If you lose money, don’t tag me—tag the MA7.
#Canopy #NewListing
$CNPY
417
·
--
#CPIWatch Tonight, "Headline vs Core" is up ring 🥊
August NFP +162K, the labor market is still strong. Now it’s Core CPI’s turn tonight + FOMC 15–16 Sept to set the direction.
This is according to my analysis 👇
Core ≤0,2% → I’d lean to hold; BNB has room to 725–740.
Core in-line but yields don’t fall → range 700–720.
Core ≥0,3% → hike odds increase; pressure toward 704, possibly 690.
The logic: hot core → expectations of a hike rise → yield & dollar strengthen → risk-off → BTC drops first → BNB follows, often deeper.
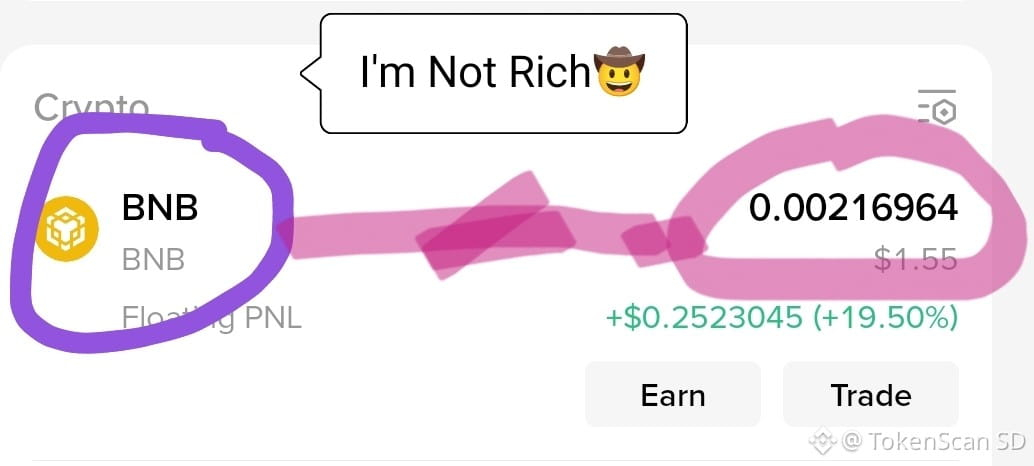
My position is small: hold BNB ~1,5 USDT, just to gauge sentiment. Neutral-to-bearish ahead of the release.
Hike or hold? 👇
$BNB
#CPIWatch Tonight, "Headline vs Core" is up ring 🥊
August NFP +162K, the labor market is still strong. Now it’s Core CPI’s turn tonight + FOMC 15–16 Sept to set the direction.
This is according to my analysis 👇
Core ≤0,2% → I’d lean to hold; BNB has room to 725–740.
Core in-line but yields don’t fall → range 700–720.
Core ≥0,3% → hike odds increase; pressure toward 704, possibly 690.
The logic: hot core → expectations of a hike rise → yield & dollar strengthen → risk-off → BTC drops first → BNB follows, often deeper.
My position is small: hold BNB ~1,5 USDT, just to gauge sentiment. Neutral-to-bearish ahead of the release.
Hike or hold? 👇
$BNB
August NFP +162K, the labor market is still strong. Now it’s Core CPI’s turn tonight + FOMC 15–16 Sept to set the direction.
This is according to my analysis 👇
Core ≤0,2% → I’d lean to hold; BNB has room to 725–740.
Core in-line but yields don’t fall → range 700–720.
Core ≥0,3% → hike odds increase; pressure toward 704, possibly 690.
The logic: hot core → expectations of a hike rise → yield & dollar strengthen → risk-off → BTC drops first → BNB follows, often deeper.
My position is small: hold BNB ~1,5 USDT, just to gauge sentiment. Neutral-to-bearish ahead of the release.
Hike or hold? 👇
$BNB
90
·
--
Verified
Niu Lai (Niu Lai) finally becomes the Top 1 Gainer. Not because of utility. But because the movie is bad 👹👺👹👺 honestly. 😂
This isn’t a “future technology” coin. It’s a coin made from a Chinese animated film that originally, in just 9 days, only sold about 7,000 RMB worth of tickets. The modeling is stiff like a 2012 game character, the voice sounds like a phone recording, and the plot is “a bull goes into a dream and becomes a hero.” People watch it to make fun of it. And yet—somehow it went viral. Ticket prices went up by thousands of times.
The movie’s name is 《牛来》—literally meaning “a bull/cow comes.”
Crypto hears “bull comes” + an abstract film + BSC, and boom: the meme is born.
PancakeSwap Pool on 14 August. Some wallets shopped with around $100, and ended up as a 1,000x–10,000x story. Classic BSC circus.
Why is it #1 gainer now?
Its schedule is like a Netflix series:
👉Binance Alpha
👉Futures 30 August (insane pump, high ~0.14)
👉Spot 9 September + seed tag + Earn/Margin/Convert
👉Dump “sell the news”
👉10–11 September: big volume + big KOL/holders come in again → rebound around +50% back into the 0.12 zone
So what you see in the Gainers screenshot isn’t the first listing. That’s the second wave: the initial listing already got digested, and now speculators are back in because the name is way too “on the nose” for a bull-hungry market.
24-hour volume briefly broke into the hundreds of millions of USD. Market cap hovers around $120–130 million. Supply is 1 billion. There’s a 1% buy/sell tax. The seed tag—Binance itself said—high volatility, 90-day quiz, don’t mess around. DYOR, NFA
$牛来
{spot}(牛来USDT)
#MEMECOİN #牛来
Niu Lai (Niu Lai) finally becomes the Top 1 Gainer. Not because of utility. But because the movie is bad 👹👺👹👺 honestly. 😂
This isn’t a “future technology” coin. It’s a coin made from a Chinese animated film that originally, in just 9 days, only sold about 7,000 RMB worth of tickets. The modeling is stiff like a 2012 game character, the voice sounds like a phone recording, and the plot is “a bull goes into a dream and becomes a hero.” People watch it to make fun of it. And yet—somehow it went viral. Ticket prices went up by thousands of times.
The movie’s name is 《牛来》—literally meaning “a bull/cow comes.”
Crypto hears “bull comes” + an abstract film + BSC, and boom: the meme is born.
PancakeSwap Pool on 14 August. Some wallets shopped with around $100, and ended up as a 1,000x–10,000x story. Classic BSC circus.
Why is it #1 gainer now?
Its schedule is like a Netflix series:
👉Binance Alpha
👉Futures 30 August (insane pump, high ~0.14)
👉Spot 9 September + seed tag + Earn/Margin/Convert
👉Dump “sell the news”
👉10–11 September: big volume + big KOL/holders come in again → rebound around +50% back into the 0.12 zone
So what you see in the Gainers screenshot isn’t the first listing. That’s the second wave: the initial listing already got digested, and now speculators are back in because the name is way too “on the nose” for a bull-hungry market.
24-hour volume briefly broke into the hundreds of millions of USD. Market cap hovers around $120–130 million. Supply is 1 billion. There’s a 1% buy/sell tax. The seed tag—Binance itself said—high volatility, 90-day quiz, don’t mess around. DYOR, NFA
$牛来
#MEMECOİN #牛来
This isn’t a “future technology” coin. It’s a coin made from a Chinese animated film that originally, in just 9 days, only sold about 7,000 RMB worth of tickets. The modeling is stiff like a 2012 game character, the voice sounds like a phone recording, and the plot is “a bull goes into a dream and becomes a hero.” People watch it to make fun of it. And yet—somehow it went viral. Ticket prices went up by thousands of times.
The movie’s name is 《牛来》—literally meaning “a bull/cow comes.”
Crypto hears “bull comes” + an abstract film + BSC, and boom: the meme is born.
PancakeSwap Pool on 14 August. Some wallets shopped with around $100, and ended up as a 1,000x–10,000x story. Classic BSC circus.
Why is it #1 gainer now?
Its schedule is like a Netflix series:
👉Binance Alpha
👉Futures 30 August (insane pump, high ~0.14)
👉Spot 9 September + seed tag + Earn/Margin/Convert
👉Dump “sell the news”
👉10–11 September: big volume + big KOL/holders come in again → rebound around +50% back into the 0.12 zone
So what you see in the Gainers screenshot isn’t the first listing. That’s the second wave: the initial listing already got digested, and now speculators are back in because the name is way too “on the nose” for a bull-hungry market.
24-hour volume briefly broke into the hundreds of millions of USD. Market cap hovers around $120–130 million. Supply is 1 billion. There’s a 1% buy/sell tax. The seed tag—Binance itself said—high volatility, 90-day quiz, don’t mess around. DYOR, NFA
$牛来
#MEMECOİN #牛来


1.1k
·
--
🔎History has its own way of repeating itself.👀
Left 👉 2022
Right👉 2026
A pattern that’s almost the same: a fake bounce, the Bull Trap label, and then it drops even deeper.
The only difference is the numbers. What’s the same is still the market psychology.
Don’t let yourself be tricked again by a green candle in the middle of a downtrend.
Be careful. The chart doesn’t lie, but a trader’s ego often does.
NFA, DYOR
#bitcoin #BTC突破7万大关 #bulltrap #crypto
$BTC
{spot}(BTCUSDT)
🔎History has its own way of repeating itself.👀
Left 👉 2022
Right👉 2026
A pattern that’s almost the same: a fake bounce, the Bull Trap label, and then it drops even deeper.
The only difference is the numbers. What’s the same is still the market psychology.
Don’t let yourself be tricked again by a green candle in the middle of a downtrend.
Be careful. The chart doesn’t lie, but a trader’s ego often does.
NFA, DYOR
#bitcoin #BTC突破7万大关 #bulltrap #crypto
$BTC
Left 👉 2022
Right👉 2026
A pattern that’s almost the same: a fake bounce, the Bull Trap label, and then it drops even deeper.
The only difference is the numbers. What’s the same is still the market psychology.
Don’t let yourself be tricked again by a green candle in the middle of a downtrend.
Be careful. The chart doesn’t lie, but a trader’s ego often does.
NFA, DYOR
#bitcoin #BTC突破7万大关 #bulltrap #crypto
$BTC

1
1k
·
--
📉 ZECUSDT Continues to Plunge, Time to Open a Short? Be Patient First, Bro! 🛑
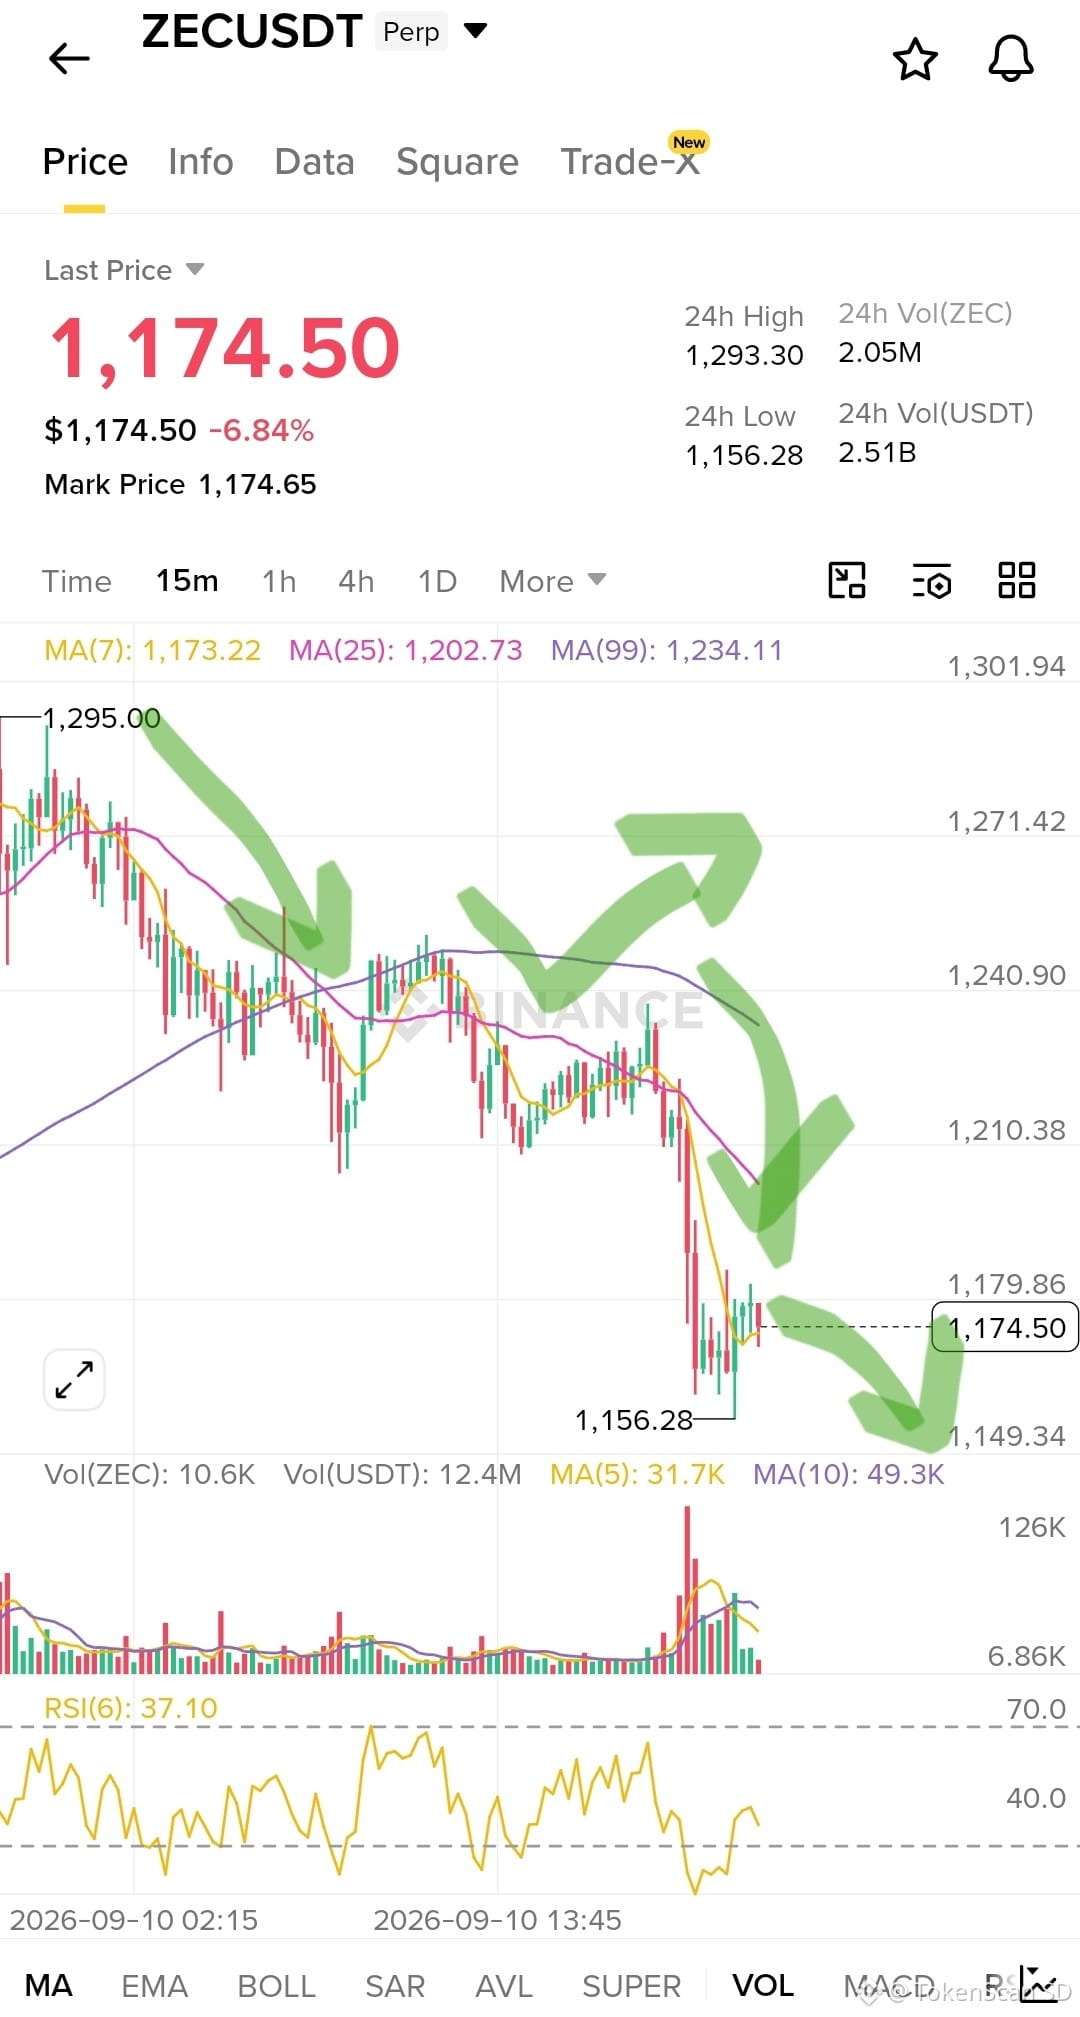
Technically (TF 15m), ZEC is indeed being battered and is in a severe downtrend below the MA25 & MA99 lines. But hey, don’t just FOMO-hit the Sell button right now! Why?
RSI has just started crawling out of oversold territory (sell exhaustion). Think of a rubber ball after being slammed to the floor—there’s still potential to bounce back up first (dead cat bounce). 🐈⬛💥
⚠️ Watch Out for the Batman Trap (Short Squeeze):
Most traders are opening short positions, but spot buyers are being quietly aggressive at accumulating. If you force a short at the lower current peak price, your position is at risk of being forcibly “picked up” — aka getting liquidated by the market maker!
🧠 Smart Trader Setup (Sell on Bounce):
Let’s be elegant: wait for the price to take a short breath before we cast our net.
🎣 Net Entry: USD 1,200 - 1,210 (Wait for the price to test resistance at MA25).
💰 Profit Targets (TP): USD 1,156 (testing the 24-hour gap) and USD 1,064 for the greedier target.
🛑 Safety Belt (SL): USD 1,240. Never trade without an SL—unless you’re willing to donate your capital to the market!
Manage discipline: keep max margin only 1–2%, don’t go all-in like you’re drunk. Stay safe, and may you profit! 💸
$ZEC
{spot}(ZECUSDT)
#ZECUSDT #ShortSqueeze #ShortSignal
📉 ZECUSDT Continues to Plunge, Time to Open a Short? Be Patient First, Bro! 🛑
Technically (TF 15m), ZEC is indeed being battered and is in a severe downtrend below the MA25 & MA99 lines. But hey, don’t just FOMO-hit the Sell button right now! Why?
RSI has just started crawling out of oversold territory (sell exhaustion). Think of a rubber ball after being slammed to the floor—there’s still potential to bounce back up first (dead cat bounce). 🐈⬛💥
⚠️ Watch Out for the Batman Trap (Short Squeeze):
Most traders are opening short positions, but spot buyers are being quietly aggressive at accumulating. If you force a short at the lower current peak price, your position is at risk of being forcibly “picked up” — aka getting liquidated by the market maker!
🧠 Smart Trader Setup (Sell on Bounce):
Let’s be elegant: wait for the price to take a short breath before we cast our net.
🎣 Net Entry: USD 1,200 - 1,210 (Wait for the price to test resistance at MA25).
💰 Profit Targets (TP): USD 1,156 (testing the 24-hour gap) and USD 1,064 for the greedier target.
🛑 Safety Belt (SL): USD 1,240. Never trade without an SL—unless you’re willing to donate your capital to the market!
Manage discipline: keep max margin only 1–2%, don’t go all-in like you’re drunk. Stay safe, and may you profit! 💸
$ZEC
#ZECUSDT #ShortSqueeze #ShortSignal
Technically (TF 15m), ZEC is indeed being battered and is in a severe downtrend below the MA25 & MA99 lines. But hey, don’t just FOMO-hit the Sell button right now! Why?
RSI has just started crawling out of oversold territory (sell exhaustion). Think of a rubber ball after being slammed to the floor—there’s still potential to bounce back up first (dead cat bounce). 🐈⬛💥
⚠️ Watch Out for the Batman Trap (Short Squeeze):
Most traders are opening short positions, but spot buyers are being quietly aggressive at accumulating. If you force a short at the lower current peak price, your position is at risk of being forcibly “picked up” — aka getting liquidated by the market maker!
🧠 Smart Trader Setup (Sell on Bounce):
Let’s be elegant: wait for the price to take a short breath before we cast our net.
🎣 Net Entry: USD 1,200 - 1,210 (Wait for the price to test resistance at MA25).
💰 Profit Targets (TP): USD 1,156 (testing the 24-hour gap) and USD 1,064 for the greedier target.
🛑 Safety Belt (SL): USD 1,240. Never trade without an SL—unless you’re willing to donate your capital to the market!
Manage discipline: keep max margin only 1–2%, don’t go all-in like you’re drunk. Stay safe, and may you profit! 💸
$ZEC
#ZECUSDT #ShortSqueeze #ShortSignal
1.2k
·
--
🔥 $REZ (Renzo) Entering Top Gainers Futures Binance — Worth Watching for a Dip?💥
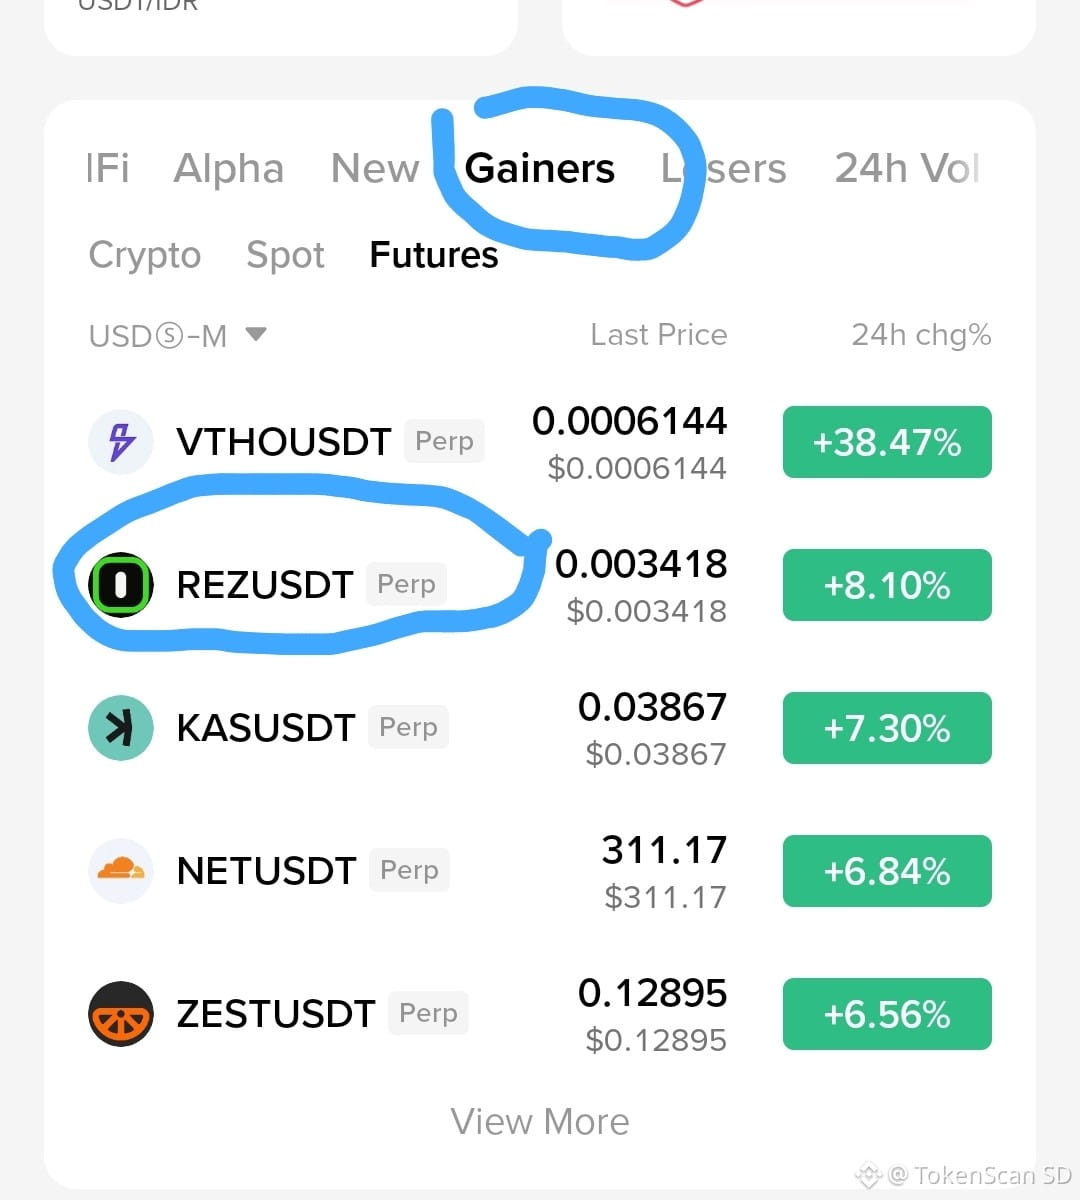
Guess what, REZUSDT is currently sitting on Binance Futures Gainers list, up about +8-9% in the past few hours, now trading at $0.003441.
📊 Quick data:
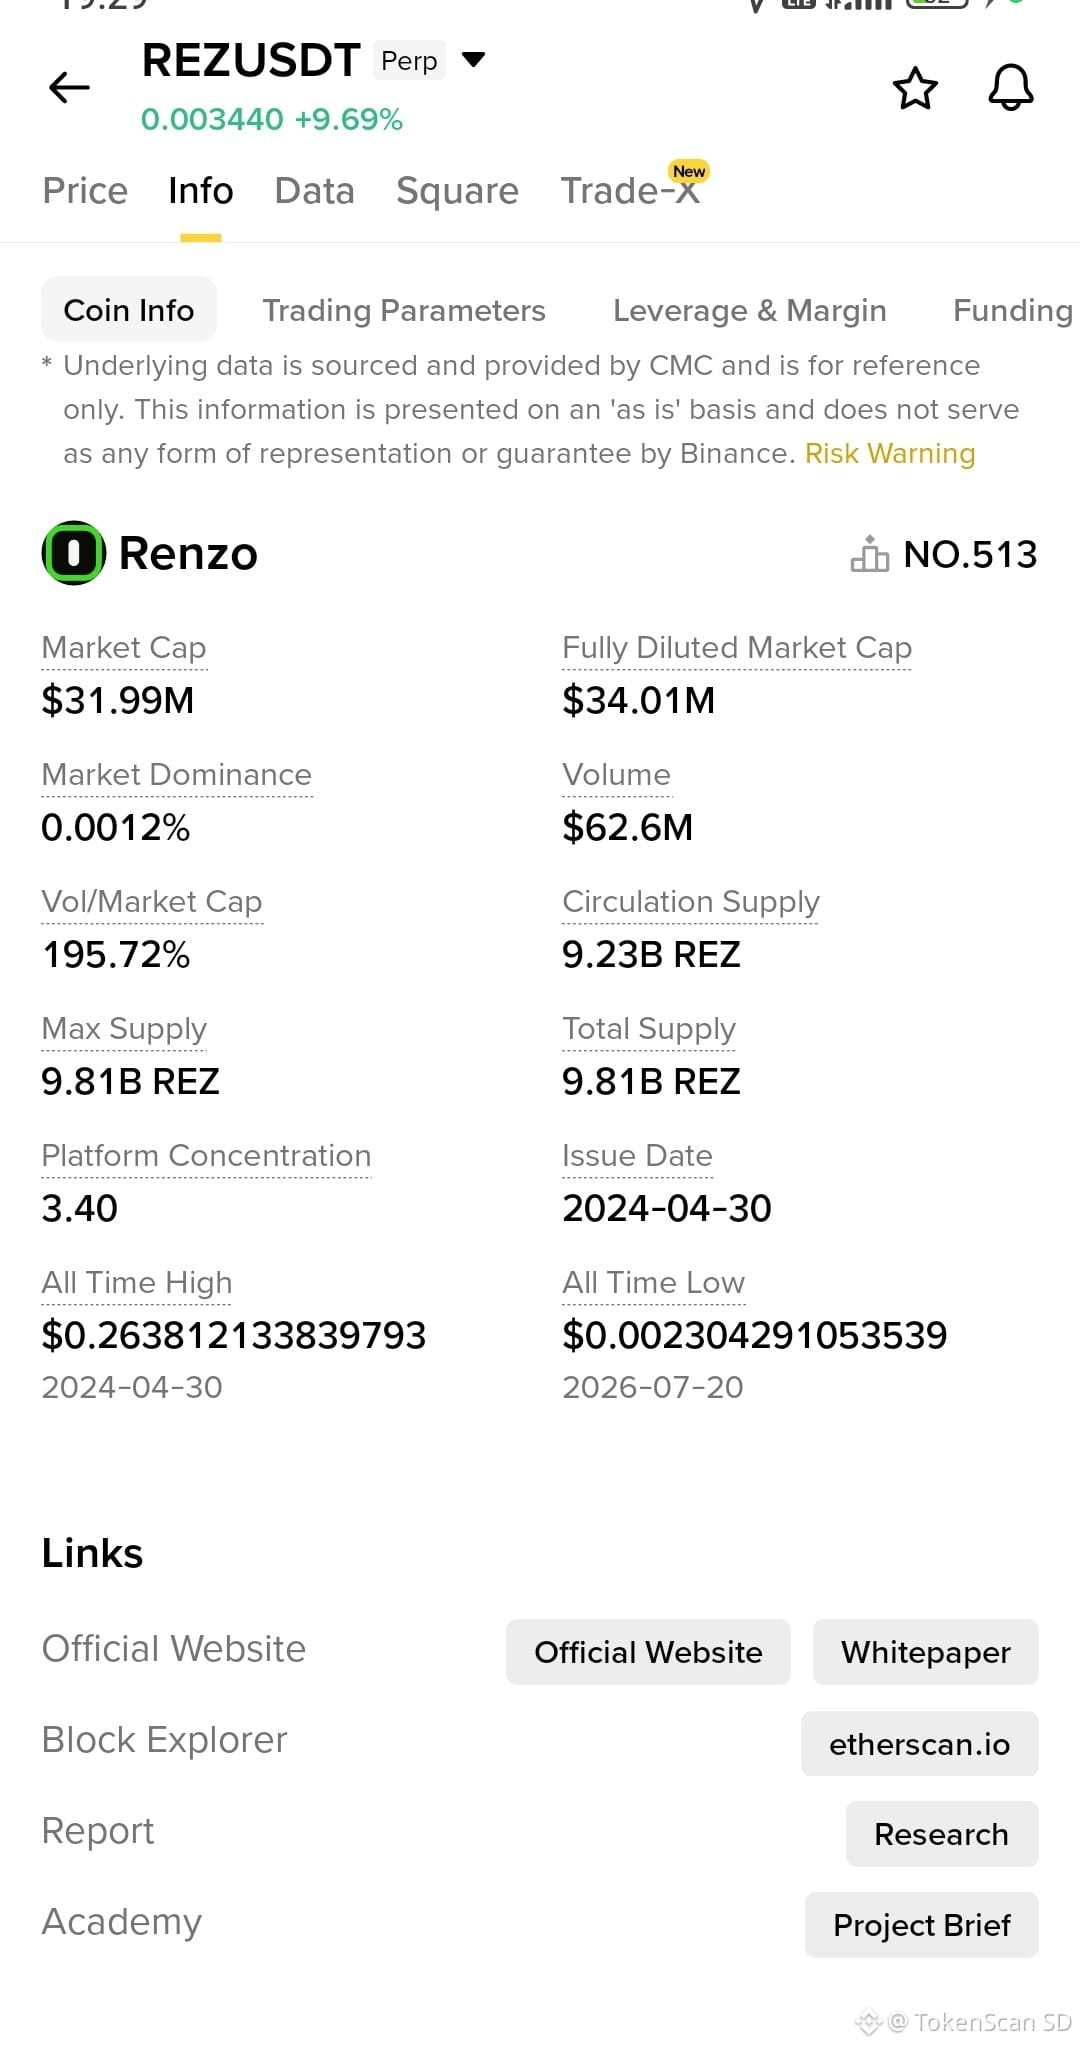
• 24h High: $0.003922 | 24h Low: $0.002940
• 24h Volume: 65.31M USDT (18.60B REZ)
• Market Cap: $31.99M | FDV: $34.01M
• All Time High: $0.263812 (30 Apr 2024)
• All Time Low: $0.002304 (just happened, 20 Jul 2026)
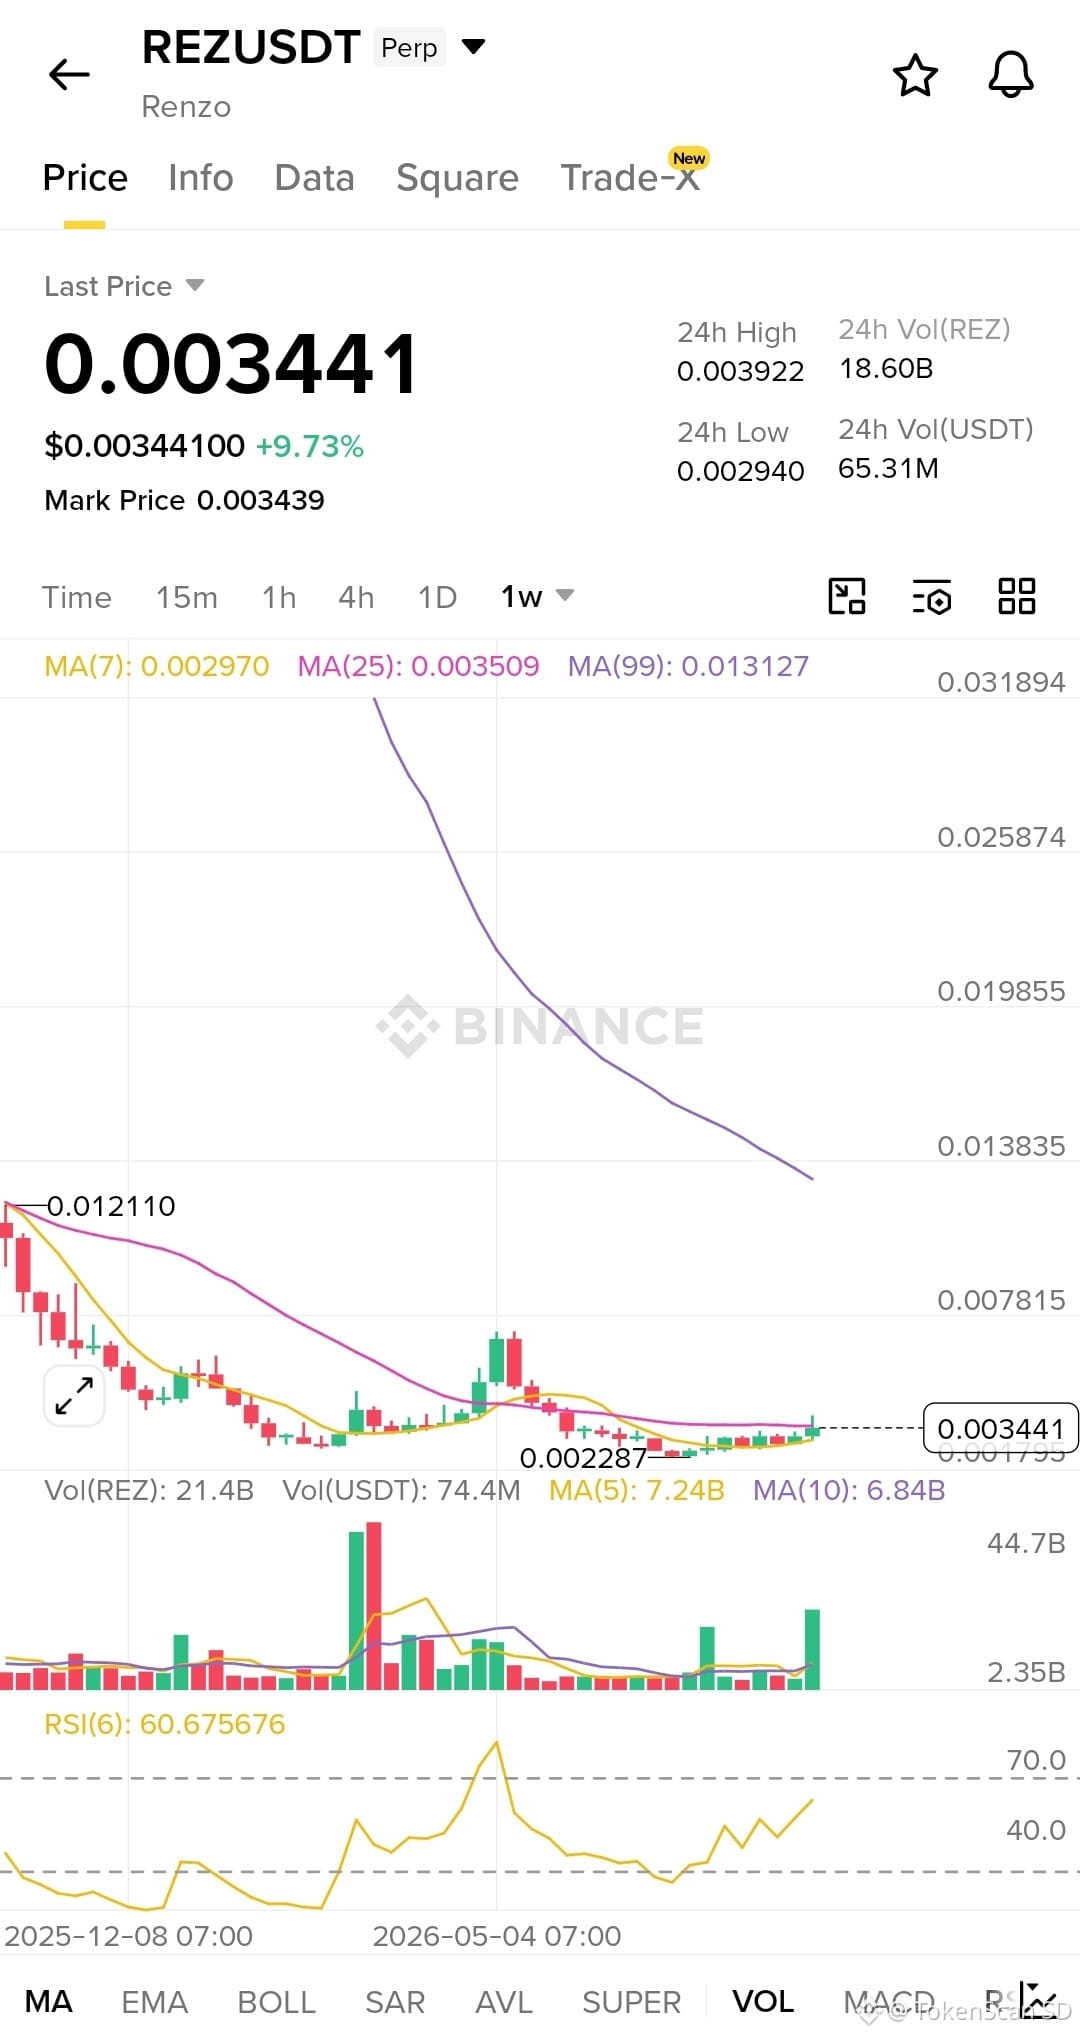
What’s interesting: the current price is still -98% from its ATH. So this move is likely just a bounce from the ATL area, not a big trend reversal. The weekly MA99 is still far above ($0.013), meaning the long-term downtrend remains dominant.
📈 Short-term signals:
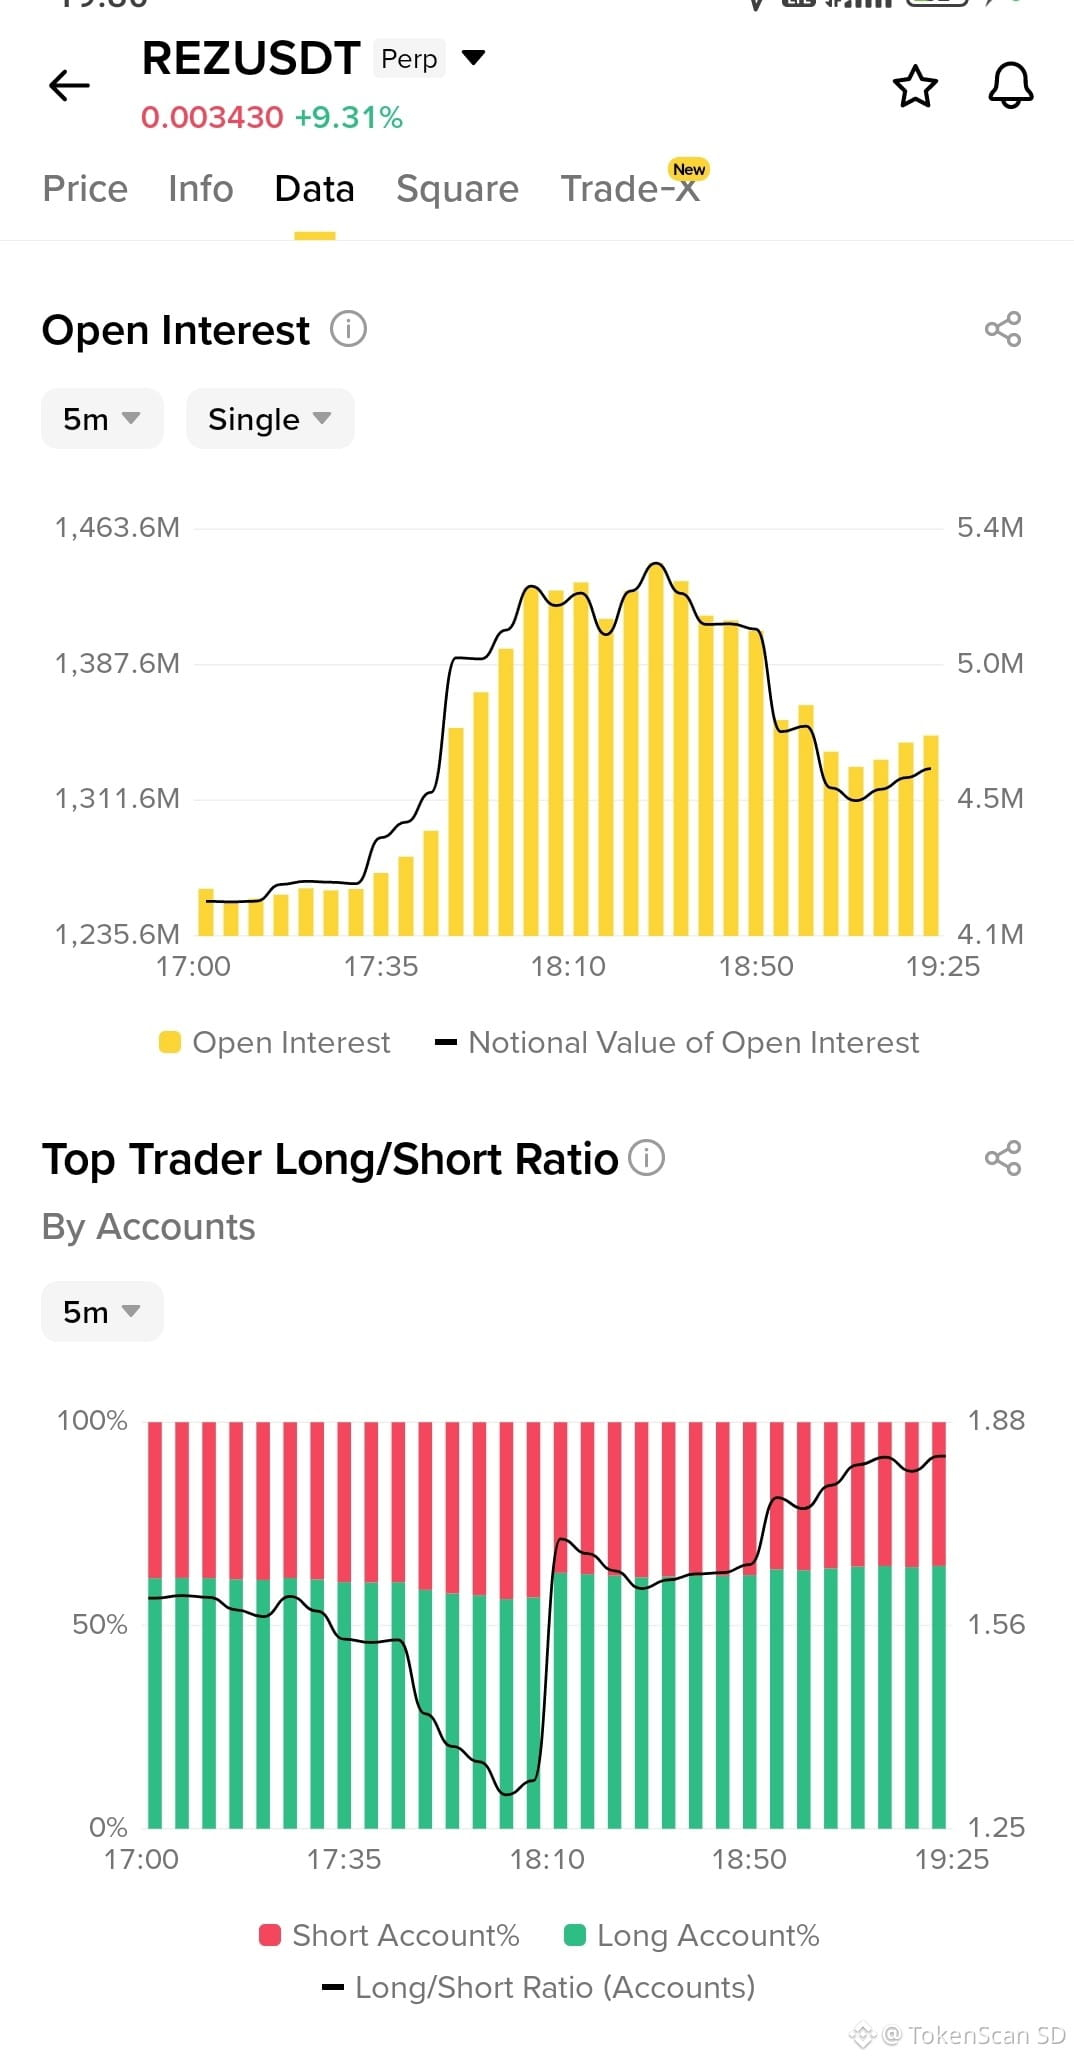
• Open Interest rose from ~1.24B to ~1.46B within a few hours — fresh money is coming in
• Top traders’ Long/Short ratio flipped drastically: from mostly short to mostly long (ratio ~1.8) after 18:10
• RSI(6) at 60.67 — not overbought yet, still room to rise
• MA7 has crossed above MA25 — short-term bullish potential is forming
⚠️ But remember:
Its market cap is small ($32M), the volatility is extremely high, and this project is still in a heavy downtrend from the ATH. Perpetual futures + a volatile coin = high liquidation risk if your timing is off or you use excessive leverage.
This is not an invitation to buy/sell, guys — just an analysis based on on-chart data. DYOR, manage your risk, and don’t go all-in on a coin that’s only “gaining” without checking the fundamentals first.
$REZ
{spot}(REZUSDT)
#RENZO #BİNANCEFUTURES
🔥 $REZ (Renzo) Entering Top Gainers Futures Binance — Worth Watching for a Dip?💥
Guess what, REZUSDT is currently sitting on Binance Futures Gainers list, up about +8-9% in the past few hours, now trading at $0.003441.
📊 Quick data:
• 24h High: $0.003922 | 24h Low: $0.002940
• 24h Volume: 65.31M USDT (18.60B REZ)
• Market Cap: $31.99M | FDV: $34.01M
• All Time High: $0.263812 (30 Apr 2024)
• All Time Low: $0.002304 (just happened, 20 Jul 2026)
What’s interesting: the current price is still -98% from its ATH. So this move is likely just a bounce from the ATL area, not a big trend reversal. The weekly MA99 is still far above ($0.013), meaning the long-term downtrend remains dominant.
📈 Short-term signals:
• Open Interest rose from ~1.24B to ~1.46B within a few hours — fresh money is coming in
• Top traders’ Long/Short ratio flipped drastically: from mostly short to mostly long (ratio ~1.8) after 18:10
• RSI(6) at 60.67 — not overbought yet, still room to rise
• MA7 has crossed above MA25 — short-term bullish potential is forming
⚠️ But remember:
Its market cap is small ($32M), the volatility is extremely high, and this project is still in a heavy downtrend from the ATH. Perpetual futures + a volatile coin = high liquidation risk if your timing is off or you use excessive leverage.
This is not an invitation to buy/sell, guys — just an analysis based on on-chart data. DYOR, manage your risk, and don’t go all-in on a coin that’s only “gaining” without checking the fundamentals first.
$REZ
#RENZO #BİNANCEFUTURES
Guess what, REZUSDT is currently sitting on Binance Futures Gainers list, up about +8-9% in the past few hours, now trading at $0.003441.
📊 Quick data:
• 24h High: $0.003922 | 24h Low: $0.002940
• 24h Volume: 65.31M USDT (18.60B REZ)
• Market Cap: $31.99M | FDV: $34.01M
• All Time High: $0.263812 (30 Apr 2024)
• All Time Low: $0.002304 (just happened, 20 Jul 2026)
What’s interesting: the current price is still -98% from its ATH. So this move is likely just a bounce from the ATL area, not a big trend reversal. The weekly MA99 is still far above ($0.013), meaning the long-term downtrend remains dominant.
📈 Short-term signals:
• Open Interest rose from ~1.24B to ~1.46B within a few hours — fresh money is coming in
• Top traders’ Long/Short ratio flipped drastically: from mostly short to mostly long (ratio ~1.8) after 18:10
• RSI(6) at 60.67 — not overbought yet, still room to rise
• MA7 has crossed above MA25 — short-term bullish potential is forming
⚠️ But remember:
Its market cap is small ($32M), the volatility is extremely high, and this project is still in a heavy downtrend from the ATH. Perpetual futures + a volatile coin = high liquidation risk if your timing is off or you use excessive leverage.
This is not an invitation to buy/sell, guys — just an analysis based on on-chart data. DYOR, manage your risk, and don’t go all-in on a coin that’s only “gaining” without checking the fundamentals first.
$REZ
#RENZO #BİNANCEFUTURES
164
·
--
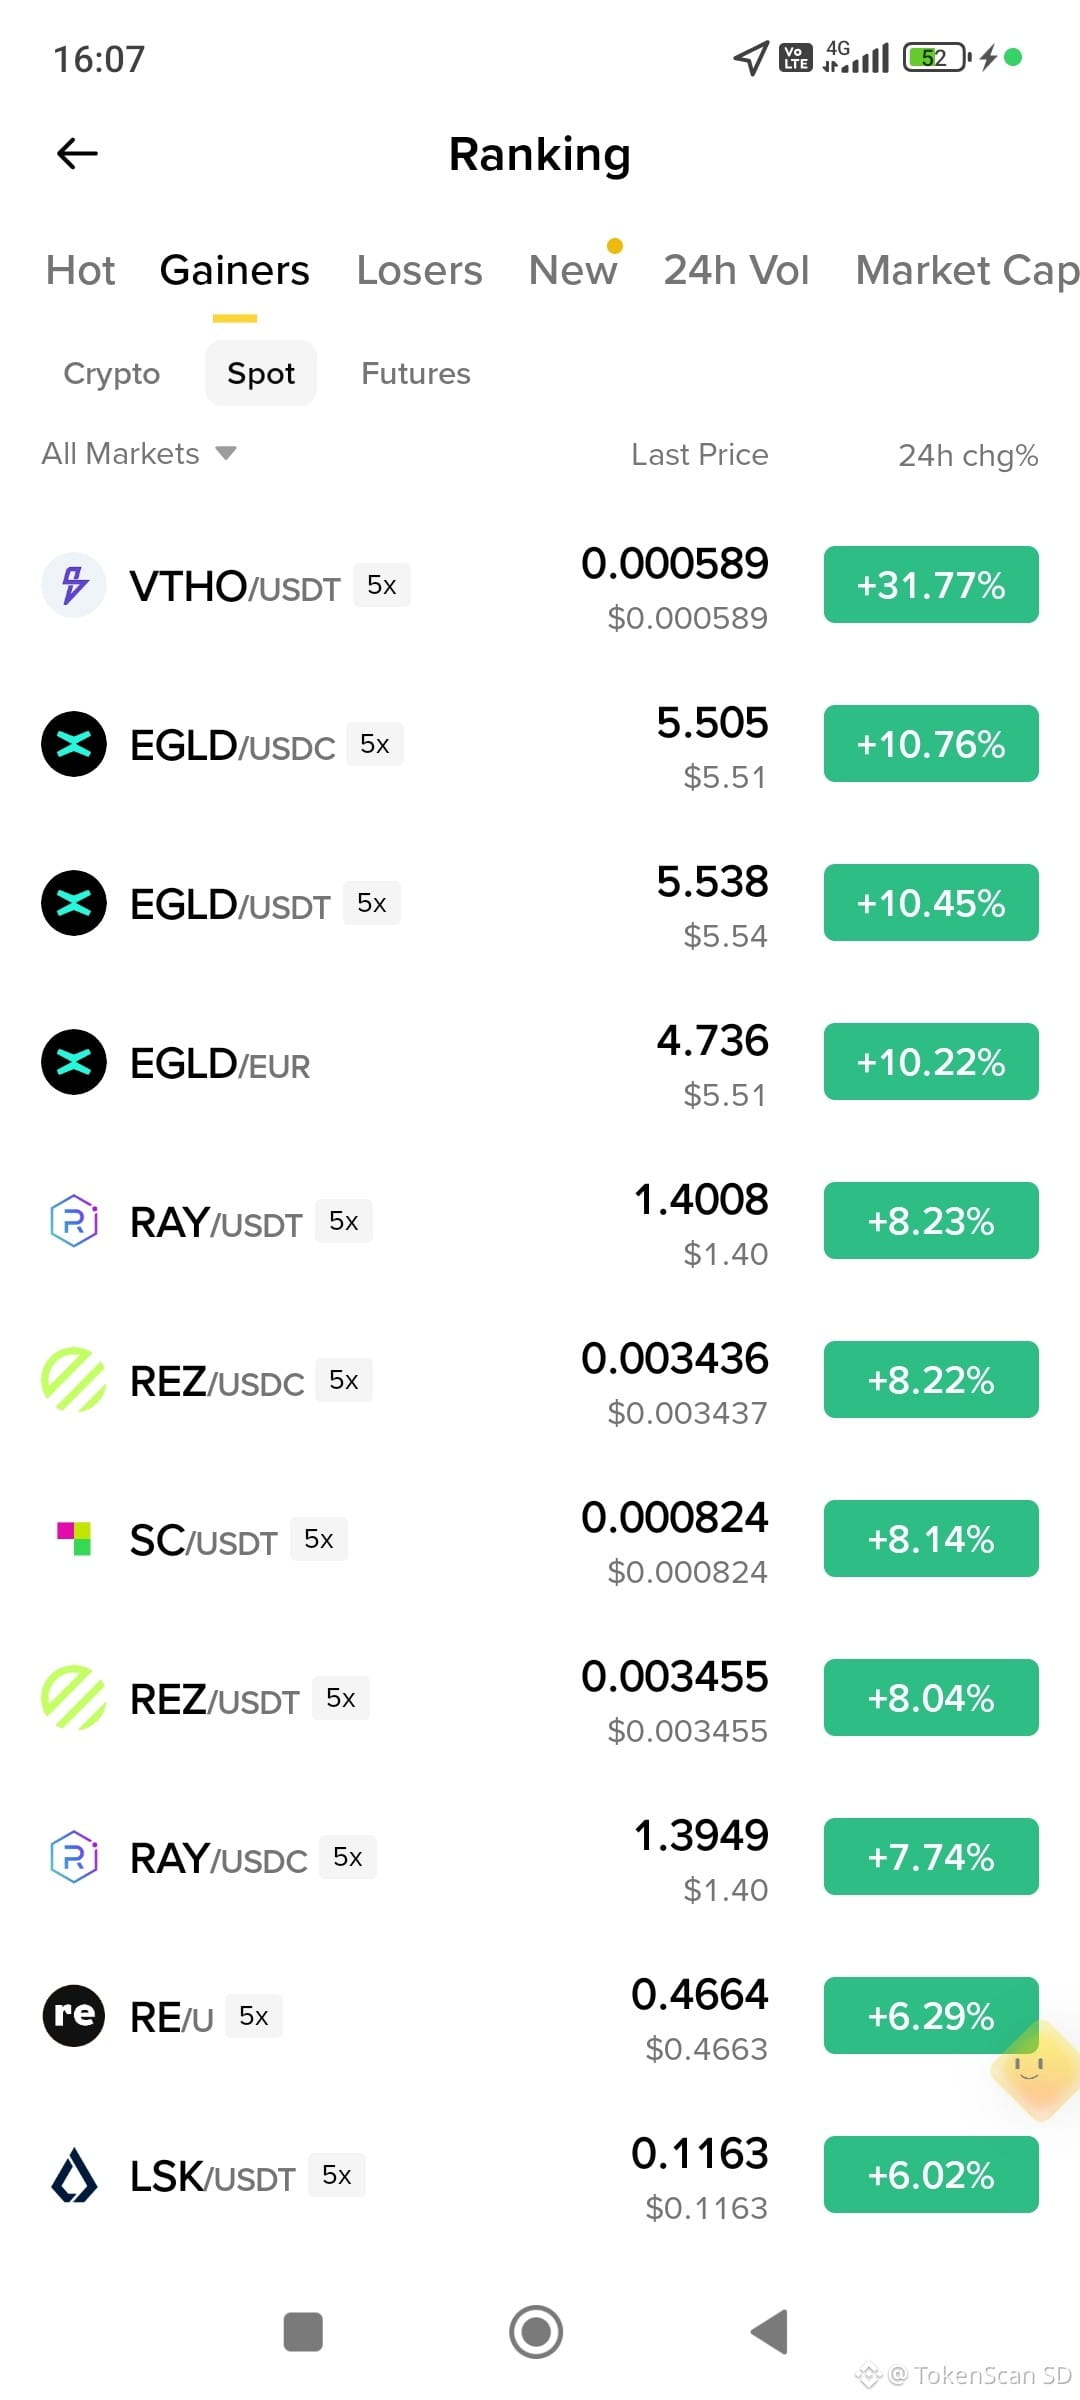
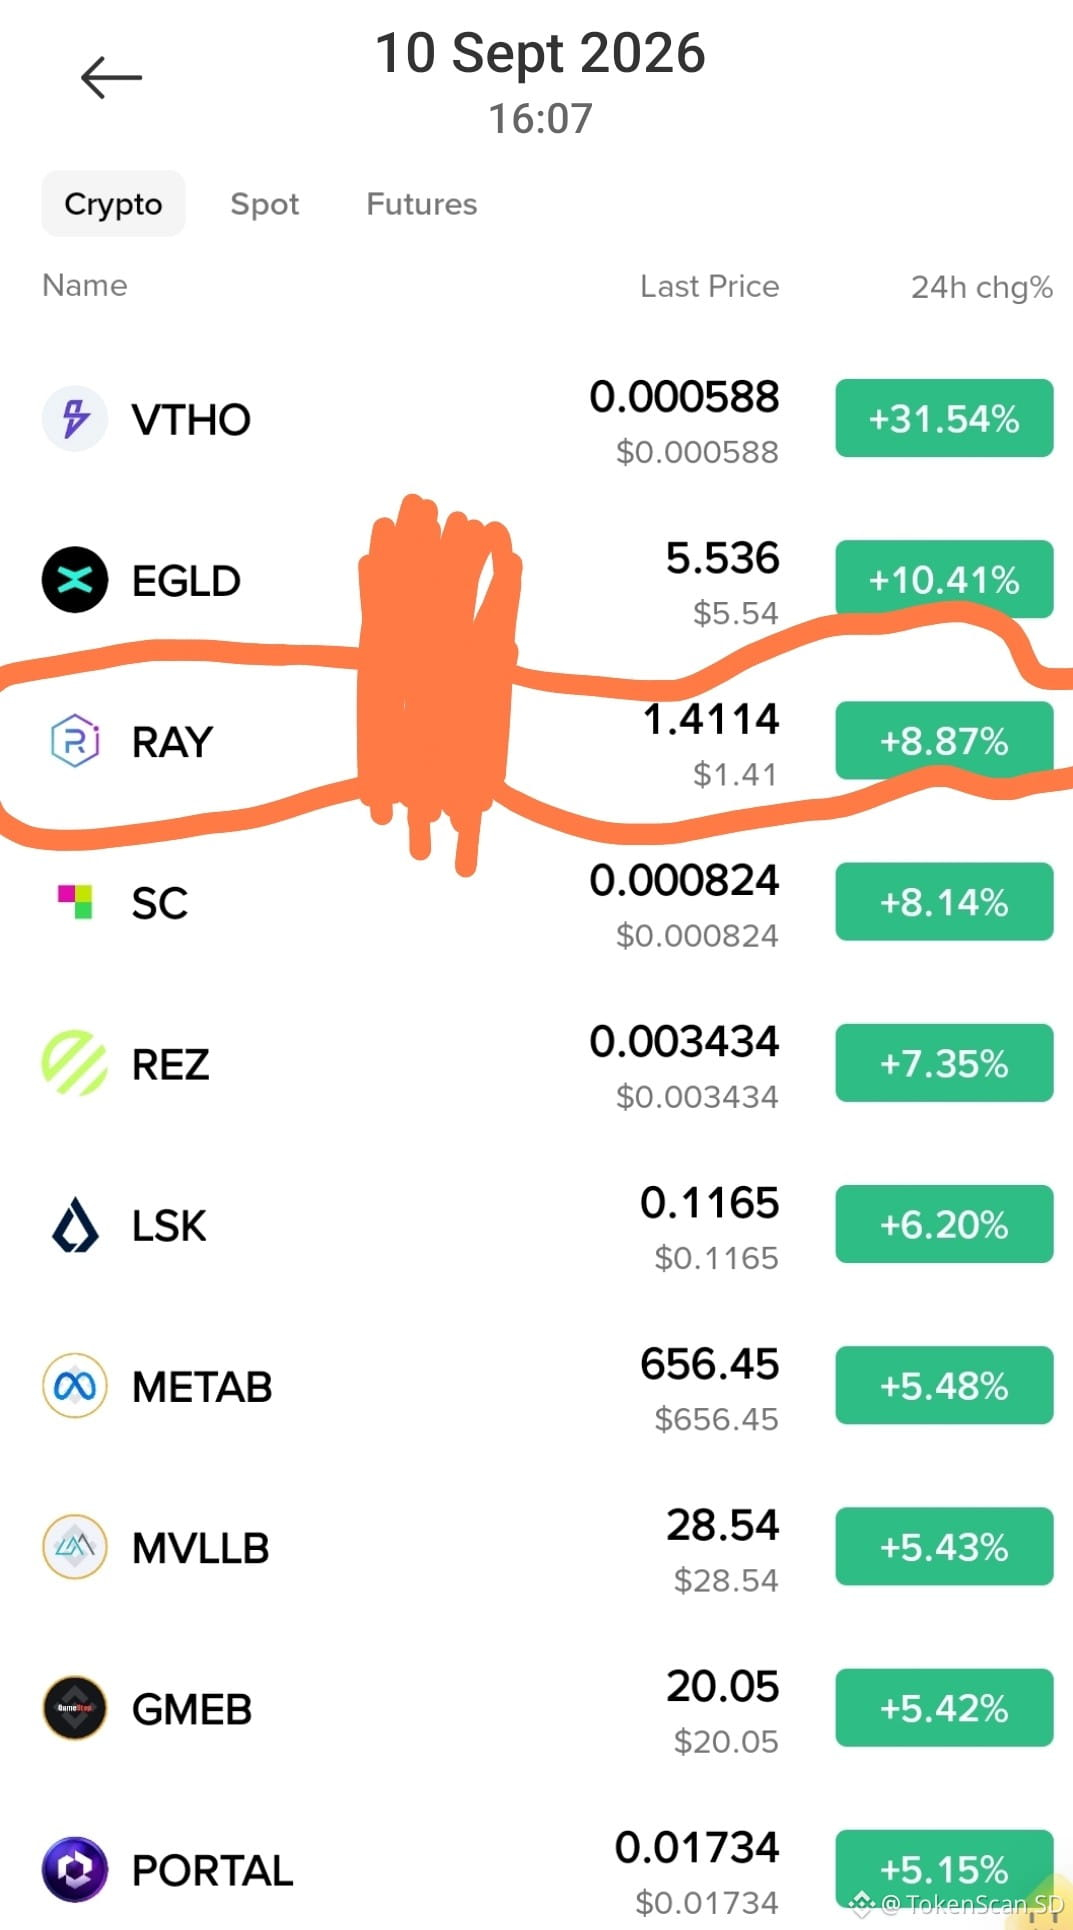
🔍 From today’s top gainer list, if I had to pick just one... I’d choose $RAY (Raydium)
I was just looking at the top gainer list: VTHO, EGLD, RAY, SC, REZ, LSK, METAB, and others. Everything is green, everything is up. But if I’m forced to pick just one to pay attention to, I choose RAY. Here’s why—so I can learn how to choose, not just blindly follow what’s green:
1️⃣ It’s not just “up”; it has real work
RAY is the token of Raydium— the biggest DEX (token swapping place) on Solana. Every time someone swaps tokens on Raydium, the protocol earns a fee. That means RAY’s value isn’t only from speculation, but from real everyday activity.
2️⃣ It connects directly to the world we talk about every day
Remember the tokens from pump.fun that we often keep an eye on? Once their bonding curve “graduates” (goes live), the token moves and gets traded on Raydium. So the busier the Solana meme-coin market gets, the more Raydium infrastructure gets used too.
3️⃣ The increase is healthy, not the most “hot”
Today, RAY is up around 8–9%. Compare that with VTHO, which jumped 57% in a day with RSI at 87 (extremely overbought)—that’s a sign the market is already very overheated, and usually after that there’s a sharp correction. RAY’s move is more moderate, so the risk of “getting trapped buying at the peak” is lower.
4️⃣ Proven for a long time
Raydium has existed since 2021, surviving the ups and downs of Solana’s ecosystem (including the time Solana was considered “dead” in 2022–2023), and it still remains one of the main DEXs today. It’s not a brand-new project with no track record.
$RAY
{spot}(RAYUSDT)
🔍 From today’s top gainer list, if I had to pick just one... I’d choose $RAY (Raydium)
I was just looking at the top gainer list: VTHO, EGLD, RAY, SC, REZ, LSK, METAB, and others. Everything is green, everything is up. But if I’m forced to pick just one to pay attention to, I choose RAY. Here’s why—so I can learn how to choose, not just blindly follow what’s green:
1️⃣ It’s not just “up”; it has real work
RAY is the token of Raydium— the biggest DEX (token swapping place) on Solana. Every time someone swaps tokens on Raydium, the protocol earns a fee. That means RAY’s value isn’t only from speculation, but from real everyday activity.
2️⃣ It connects directly to the world we talk about every day
Remember the tokens from pump.fun that we often keep an eye on? Once their bonding curve “graduates” (goes live), the token moves and gets traded on Raydium. So the busier the Solana meme-coin market gets, the more Raydium infrastructure gets used too.
3️⃣ The increase is healthy, not the most “hot”
Today, RAY is up around 8–9%. Compare that with VTHO, which jumped 57% in a day with RSI at 87 (extremely overbought)—that’s a sign the market is already very overheated, and usually after that there’s a sharp correction. RAY’s move is more moderate, so the risk of “getting trapped buying at the peak” is lower.
4️⃣ Proven for a long time
Raydium has existed since 2021, surviving the ups and downs of Solana’s ecosystem (including the time Solana was considered “dead” in 2022–2023), and it still remains one of the main DEXs today. It’s not a brand-new project with no track record.
$RAY
I was just looking at the top gainer list: VTHO, EGLD, RAY, SC, REZ, LSK, METAB, and others. Everything is green, everything is up. But if I’m forced to pick just one to pay attention to, I choose RAY. Here’s why—so I can learn how to choose, not just blindly follow what’s green:
1️⃣ It’s not just “up”; it has real work
RAY is the token of Raydium— the biggest DEX (token swapping place) on Solana. Every time someone swaps tokens on Raydium, the protocol earns a fee. That means RAY’s value isn’t only from speculation, but from real everyday activity.
2️⃣ It connects directly to the world we talk about every day
Remember the tokens from pump.fun that we often keep an eye on? Once their bonding curve “graduates” (goes live), the token moves and gets traded on Raydium. So the busier the Solana meme-coin market gets, the more Raydium infrastructure gets used too.
3️⃣ The increase is healthy, not the most “hot”
Today, RAY is up around 8–9%. Compare that with VTHO, which jumped 57% in a day with RSI at 87 (extremely overbought)—that’s a sign the market is already very overheated, and usually after that there’s a sharp correction. RAY’s move is more moderate, so the risk of “getting trapped buying at the peak” is lower.
4️⃣ Proven for a long time
Raydium has existed since 2021, surviving the ups and downs of Solana’s ecosystem (including the time Solana was considered “dead” in 2022–2023), and it still remains one of the main DEXs today. It’s not a brand-new project with no track record.
$RAY
837
·
--
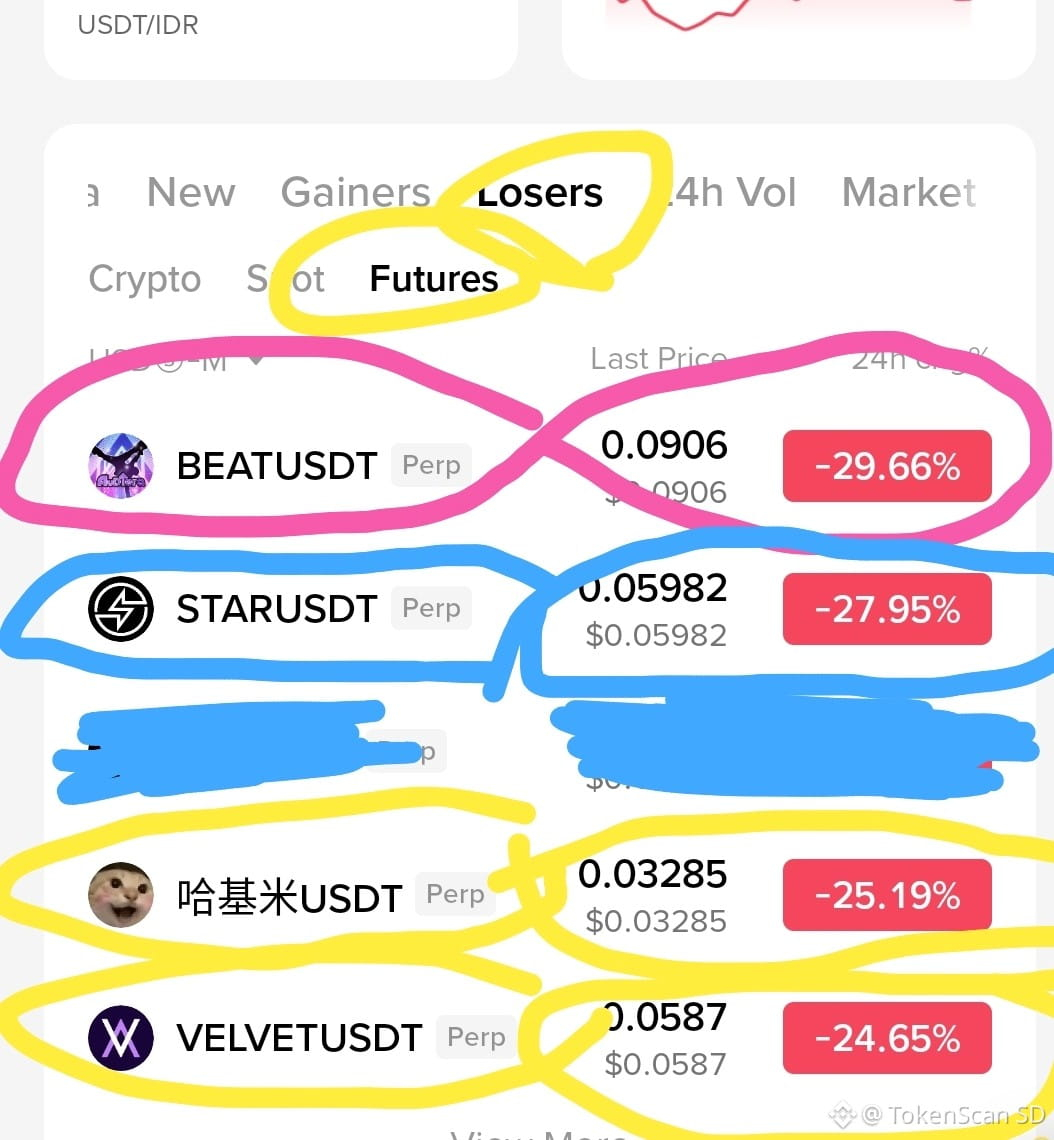
🚨Binance Futures top loser today all together fell off a cliff, like after a reunion then getting emotional together😅
📉 BEATUSDT -29.66% — after a quick rally, now it’s the turn of its leverage to get revenge
📉 STARUSDT -27.95% — too many long positions; the liquidation cascade kicked off first
📉 哈基米USDT -25.19% — meme token, thin liquidity; it really does love extreme toys
📉 VELVETUSDT -24.65% — buying momentum has been weak since yesterday; the price is just catching up
Brief analysis: a 20–30% correction in 24 hours isn’t the end of the world—it’s a typical sign of a market dominated by leverage. Usually after a drop this sharp, there are two possibilities: continued downside (if OI is still high & funding is extremely negative) or a technical bounce (if sellers are exhausted & funding starts to normalize).
If you’re going to trade: this isn’t a zone to FOMO short at this price—it's already too late. What makes more sense is to wait for the price to form a higher low first + have the funding rate return to neutral, then consider a small scalp bounce with a small size and a tight SL. Don’t go all-in just because you see red.
Note : BTW what is the #3 top loser?
you can guess and I’ll give you a prize ☕
⚠️ Not a call to buy/sell. High leverage = high risk. DYOR always, Crypto SD friends 🎒
#CryptoNewss #TopLoser #BinanceFutures #dyor
$BEAT
{future}(BEATUSDT)
$STAR
{future}(STARUSDT)
$VELVET
{future}(VELVETUSDT)
🚨Binance Futures top loser today all together fell off a cliff, like after a reunion then getting emotional together😅
📉 BEATUSDT -29.66% — after a quick rally, now it’s the turn of its leverage to get revenge
📉 STARUSDT -27.95% — too many long positions; the liquidation cascade kicked off first
📉 哈基米USDT -25.19% — meme token, thin liquidity; it really does love extreme toys
📉 VELVETUSDT -24.65% — buying momentum has been weak since yesterday; the price is just catching up
Brief analysis: a 20–30% correction in 24 hours isn’t the end of the world—it’s a typical sign of a market dominated by leverage. Usually after a drop this sharp, there are two possibilities: continued downside (if OI is still high & funding is extremely negative) or a technical bounce (if sellers are exhausted & funding starts to normalize).
If you’re going to trade: this isn’t a zone to FOMO short at this price—it's already too late. What makes more sense is to wait for the price to form a higher low first + have the funding rate return to neutral, then consider a small scalp bounce with a small size and a tight SL. Don’t go all-in just because you see red.
Note : BTW what is the #3 top loser?
you can guess and I’ll give you a prize ☕
⚠️ Not a call to buy/sell. High leverage = high risk. DYOR always, Crypto SD friends 🎒
#CryptoNewss #TopLoser #BinanceFutures #dyor
$BEAT
$STAR
$VELVET
📉 BEATUSDT -29.66% — after a quick rally, now it’s the turn of its leverage to get revenge
📉 STARUSDT -27.95% — too many long positions; the liquidation cascade kicked off first
📉 哈基米USDT -25.19% — meme token, thin liquidity; it really does love extreme toys
📉 VELVETUSDT -24.65% — buying momentum has been weak since yesterday; the price is just catching up
Brief analysis: a 20–30% correction in 24 hours isn’t the end of the world—it’s a typical sign of a market dominated by leverage. Usually after a drop this sharp, there are two possibilities: continued downside (if OI is still high & funding is extremely negative) or a technical bounce (if sellers are exhausted & funding starts to normalize).
If you’re going to trade: this isn’t a zone to FOMO short at this price—it's already too late. What makes more sense is to wait for the price to form a higher low first + have the funding rate return to neutral, then consider a small scalp bounce with a small size and a tight SL. Don’t go all-in just because you see red.
Note : BTW what is the #3 top loser?
you can guess and I’ll give you a prize ☕
⚠️ Not a call to buy/sell. High leverage = high risk. DYOR always, Crypto SD friends 🎒
#CryptoNewss #TopLoser #BinanceFutures #dyor
$BEAT
$STAR
$VELVET
1.2k
·
--
Verified
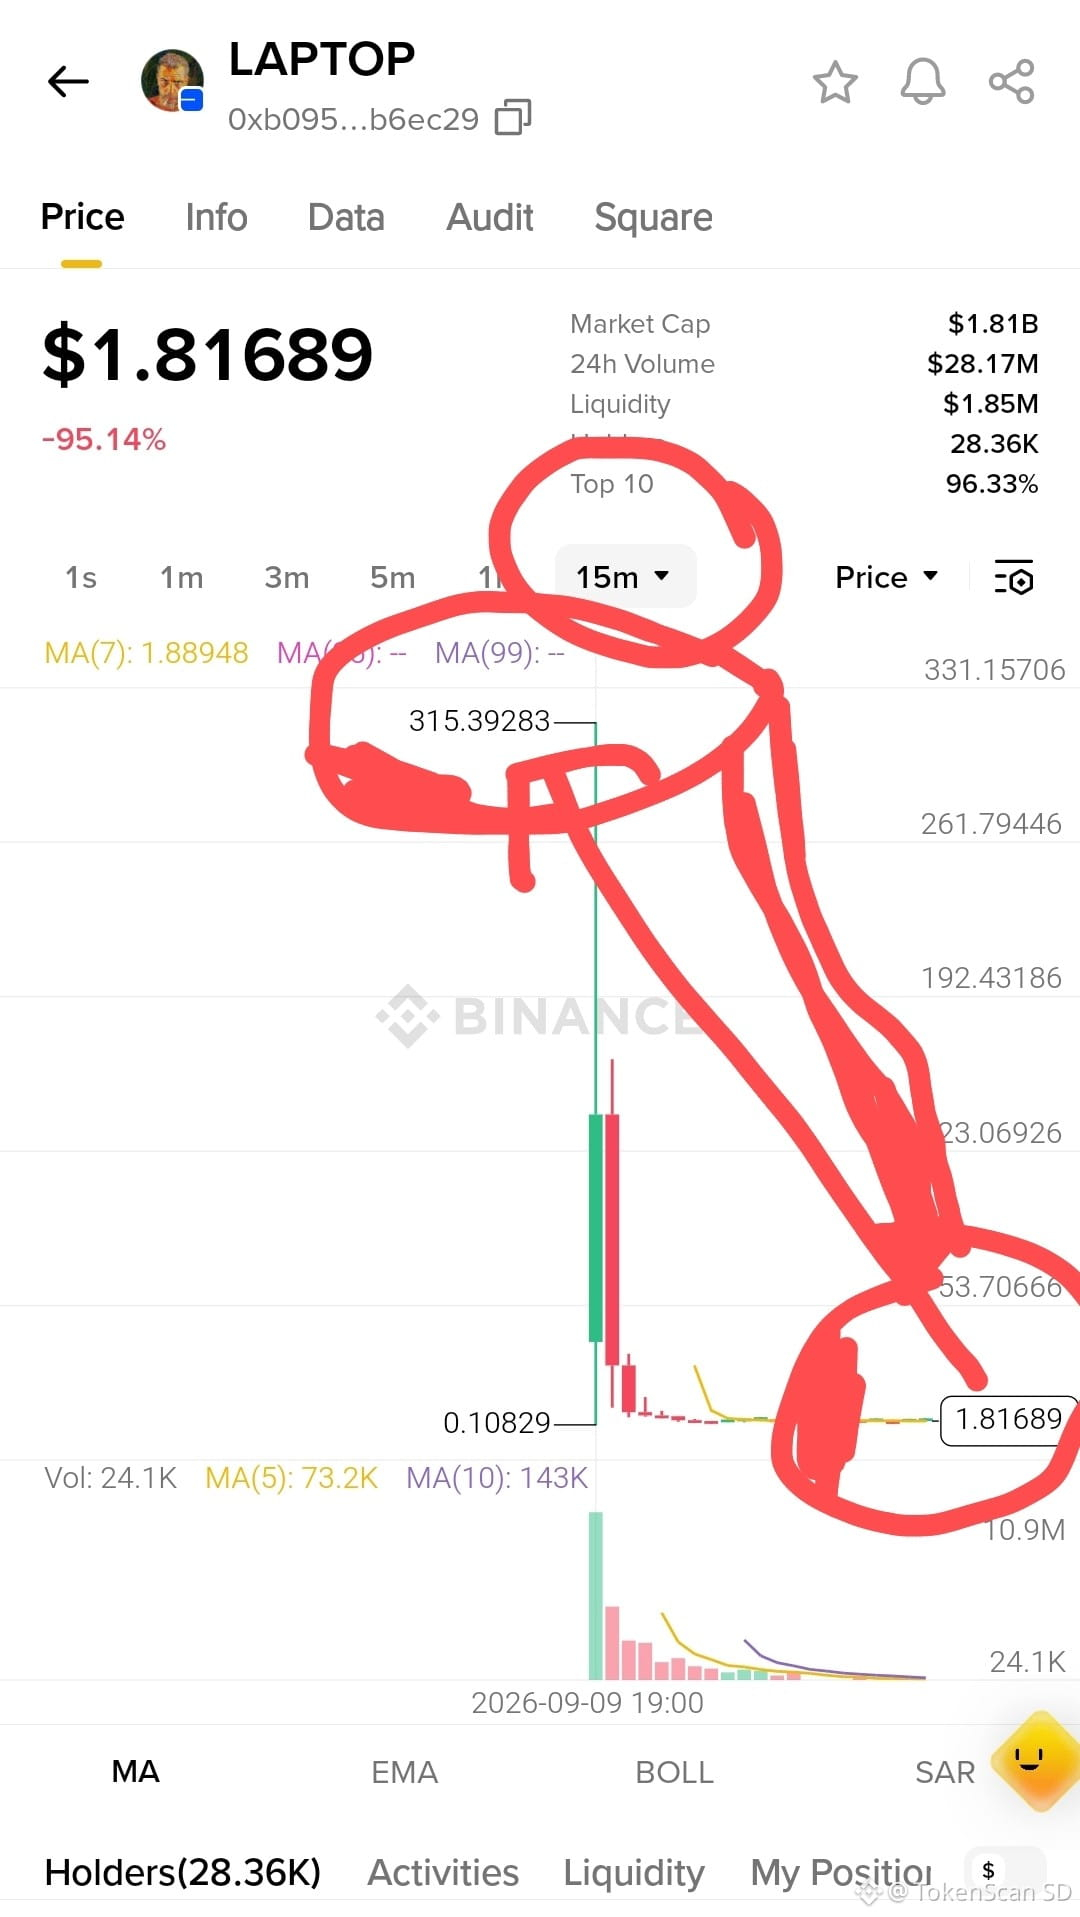
🔥 $LAPTOP CRASH 95%+ IN A FEW HOURS
Hunter Biden officially enters memecoin.
The $LAPTOP token launches on $Base on September 9, 2026.
The hype is insane. The chart is crazier.
📈 Peak: ~$316 (only ~4 minutes after listing)
📉 Now: ~$1.81
💥 Drop: -95.14%
What’s making this viral isn’t just the fall.
But how fast and how deep.
Some data that’s going viral right now:
• Market cap briefly looked “massive” due to thin liquidity
• There was a trader who entered ~$200K, leaving about ~$3K
• There’s also someone who went from 100 $ETH to around $1.18 million
• On-chain report: most traders who entered at launch are in the red
This isn’t a normal chart.
This is textbook memecoin launch:
Hype → spike in 2–4 minutes → exit liquidity → vertical chart dump.
Lesson for anyone still FOMO’ing new tokens:
Check liquidity first—don’t just look at the price
Check wallet distribution & unlocks
Don’t buy the first candle
If you enter late in a vertical pump, it almost always becomes exit liquidity
Today, $LAPTOP isn’t just a “Hunter Biden token” story.
This is a reminder: narratives can go viral—liquidity can’t lie.
My chart version is below.
Which zone did you enter? Peak, middle, or the one waiting after the crash?
NFA. DYOR.
This is not a buy or sell call. Memecoin = high risk, it can drop -99% within minutes.
#LAPTOP #BinanceSquare #DYOR🟢 #HunterBiden
🔥 $LAPTOP CRASH 95%+ IN A FEW HOURS
Hunter Biden officially enters memecoin.
The $LAPTOP token launches on $Base on September 9, 2026.
The hype is insane. The chart is crazier.
📈 Peak: ~$316 (only ~4 minutes after listing)
📉 Now: ~$1.81
💥 Drop: -95.14%
What’s making this viral isn’t just the fall.
But how fast and how deep.
Some data that’s going viral right now:
• Market cap briefly looked “massive” due to thin liquidity
• There was a trader who entered ~$200K, leaving about ~$3K
• There’s also someone who went from 100 $ETH to around $1.18 million
• On-chain report: most traders who entered at launch are in the red
This isn’t a normal chart.
This is textbook memecoin launch:
Hype → spike in 2–4 minutes → exit liquidity → vertical chart dump.
Lesson for anyone still FOMO’ing new tokens:
Check liquidity first—don’t just look at the price
Check wallet distribution & unlocks
Don’t buy the first candle
If you enter late in a vertical pump, it almost always becomes exit liquidity
Today, $LAPTOP isn’t just a “Hunter Biden token” story.
This is a reminder: narratives can go viral—liquidity can’t lie.
My chart version is below.
Which zone did you enter? Peak, middle, or the one waiting after the crash?
NFA. DYOR.
This is not a buy or sell call. Memecoin = high risk, it can drop -99% within minutes.
#LAPTOP #BinanceSquare #DYOR🟢 #HunterBiden
Hunter Biden officially enters memecoin.
The $LAPTOP token launches on $Base on September 9, 2026.
The hype is insane. The chart is crazier.
📈 Peak: ~$316 (only ~4 minutes after listing)
📉 Now: ~$1.81
💥 Drop: -95.14%
What’s making this viral isn’t just the fall.
But how fast and how deep.
Some data that’s going viral right now:
• Market cap briefly looked “massive” due to thin liquidity
• There was a trader who entered ~$200K, leaving about ~$3K
• There’s also someone who went from 100 $ETH to around $1.18 million
• On-chain report: most traders who entered at launch are in the red
This isn’t a normal chart.
This is textbook memecoin launch:
Hype → spike in 2–4 minutes → exit liquidity → vertical chart dump.
Lesson for anyone still FOMO’ing new tokens:
Check liquidity first—don’t just look at the price
Check wallet distribution & unlocks
Don’t buy the first candle
If you enter late in a vertical pump, it almost always becomes exit liquidity
Today, $LAPTOP isn’t just a “Hunter Biden token” story.
This is a reminder: narratives can go viral—liquidity can’t lie.
My chart version is below.
Which zone did you enter? Peak, middle, or the one waiting after the crash?
NFA. DYOR.
This is not a buy or sell call. Memecoin = high risk, it can drop -99% within minutes.
#LAPTOP #BinanceSquare #DYOR🟢 #HunterBiden

147
·
--
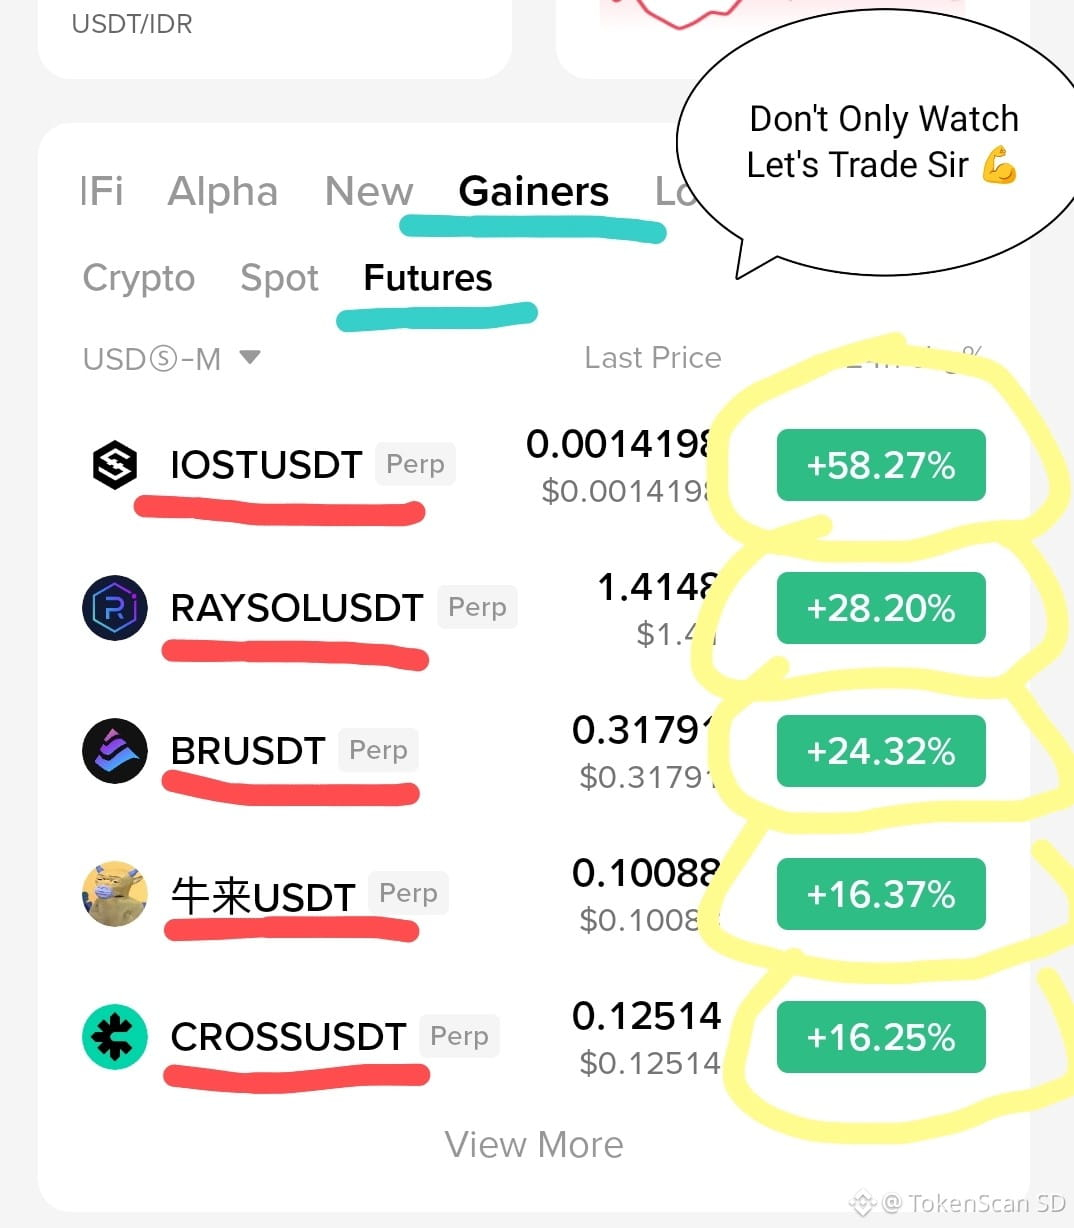
This is not a list of top gainers.
Here is a list of reasons why some people have lunch with profit,
while others are still reading “View More”.
IOST is already +58% before you even finish your lunch
👀
$IOST
{spot}(IOSTUSDT)
$RAYSOL
{future}(RAYSOLUSDT)
$BR
{future}(BRUSDT)
This is not a list of top gainers.
Here is a list of reasons why some people have lunch with profit,
while others are still reading “View More”.
IOST is already +58% before you even finish your lunch
👀
$IOST
$RAYSOL
$BR
Here is a list of reasons why some people have lunch with profit,
while others are still reading “View More”.
IOST is already +58% before you even finish your lunch
👀
$IOST
$RAYSOL
$BR
1.6k
·
--
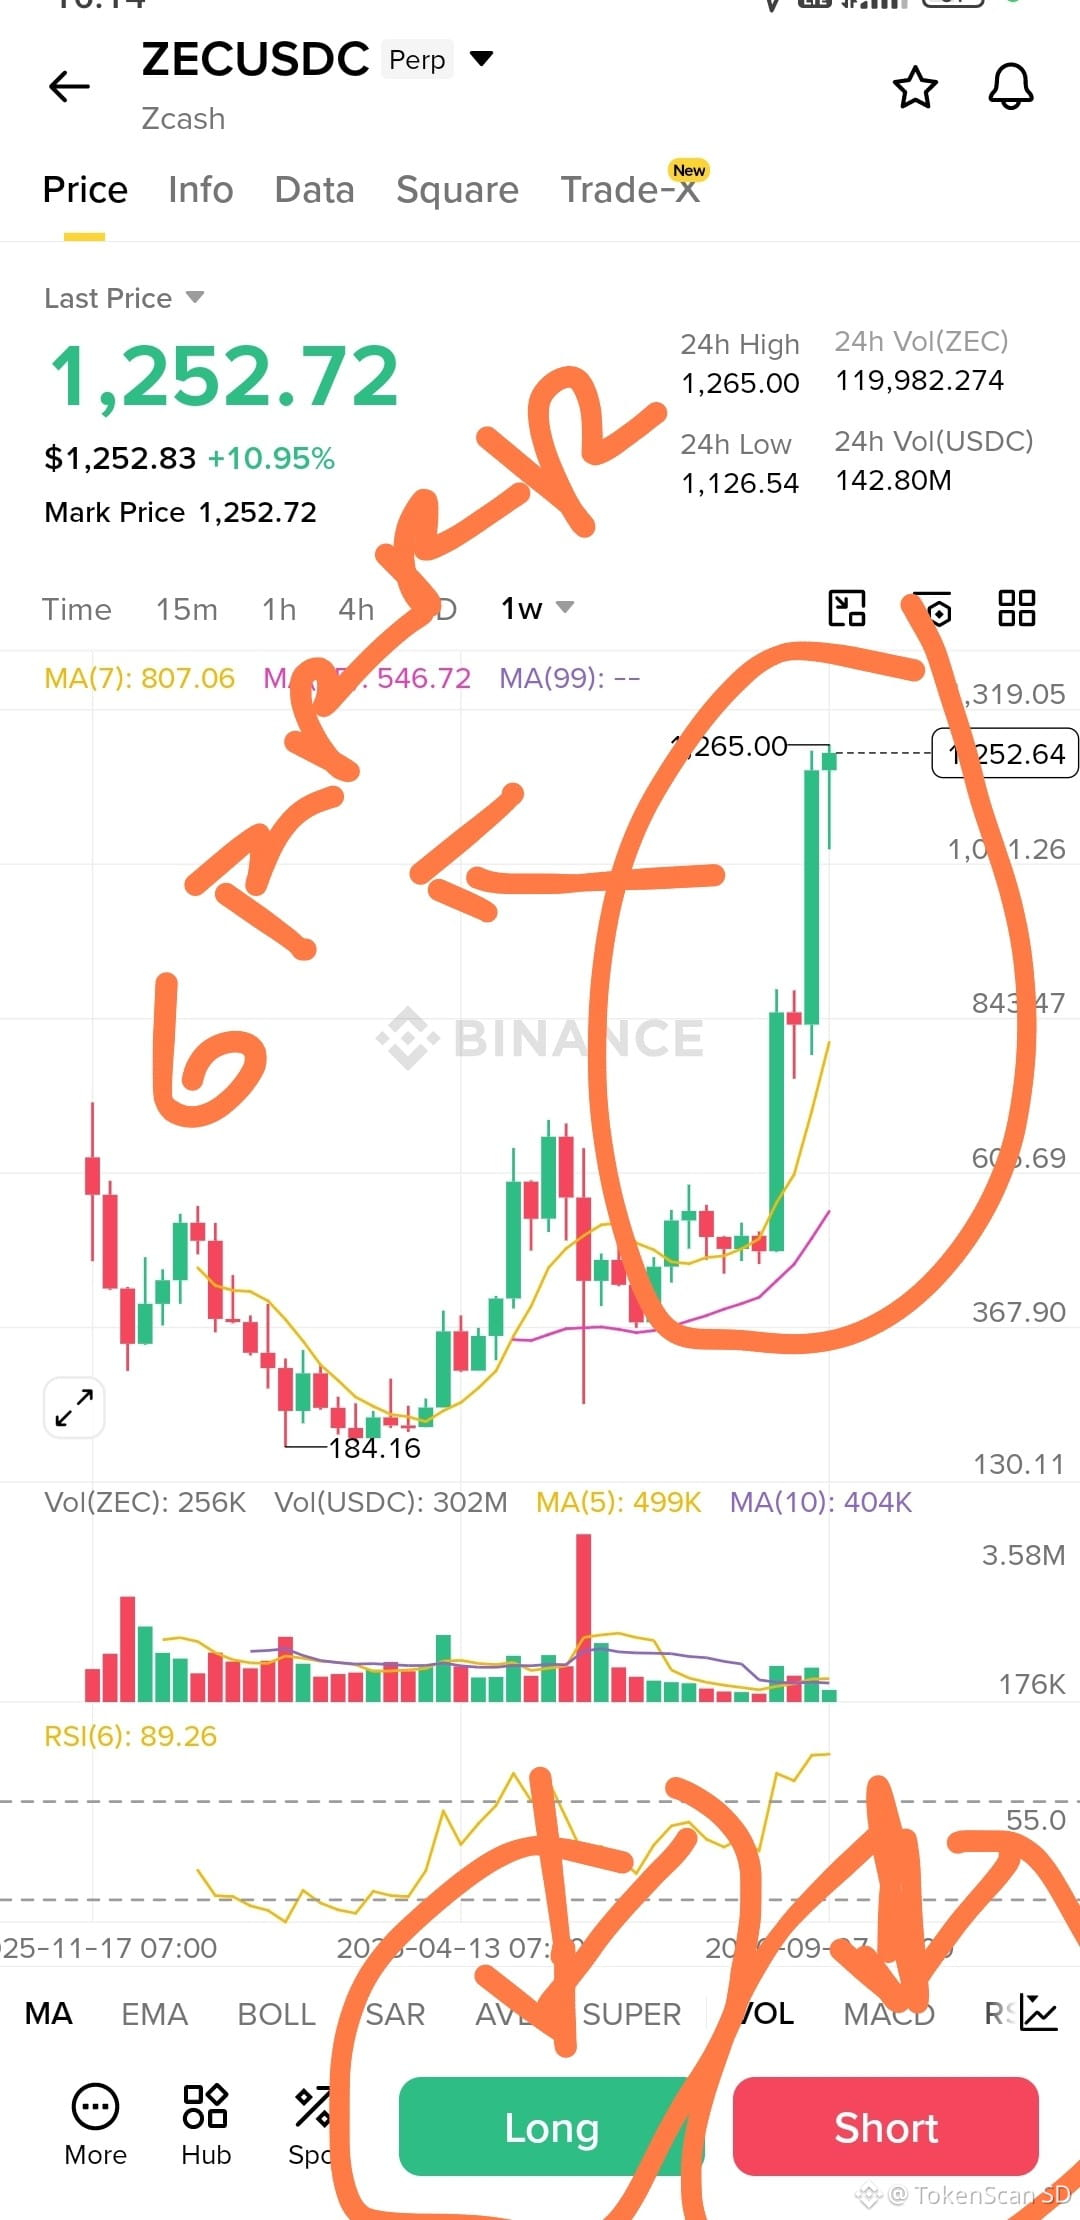
$ZEC Timeframe 1W
{future}(ZECUSDT)
Don’t chase 1.250
Price 1.251, high 1.265, +11% / 24 hours.
The weekly is already vertical. MA7 is still 807, RSI(6) is 89. This is euphoria, not a good entry.
Long only on a discount: 1.081 or the 800–850 zone.
Invalid: weekly close below 1.081.
If 1.265 breaks and you hold, then look at 1.319 / 1.500.
Short only on rejection of 1.265–1.280.
SL above 1.319. TP 1.081 → 843 → 807.
One sentence: the trend is still up, but the location is already expensive. Long on pullback, short on rejection—don’t donate at the candle’s peak.
NFA. Perp ZEC liquidation is brutal🚨👀
$ZEC Timeframe 1W
Don’t chase 1.250
Price 1.251, high 1.265, +11% / 24 hours.
The weekly is already vertical. MA7 is still 807, RSI(6) is 89. This is euphoria, not a good entry.
Long only on a discount: 1.081 or the 800–850 zone.
Invalid: weekly close below 1.081.
If 1.265 breaks and you hold, then look at 1.319 / 1.500.
Short only on rejection of 1.265–1.280.
SL above 1.319. TP 1.081 → 843 → 807.
One sentence: the trend is still up, but the location is already expensive. Long on pullback, short on rejection—don’t donate at the candle’s peak.
NFA. Perp ZEC liquidation is brutal🚨👀
Don’t chase 1.250
Price 1.251, high 1.265, +11% / 24 hours.
The weekly is already vertical. MA7 is still 807, RSI(6) is 89. This is euphoria, not a good entry.
Long only on a discount: 1.081 or the 800–850 zone.
Invalid: weekly close below 1.081.
If 1.265 breaks and you hold, then look at 1.319 / 1.500.
Short only on rejection of 1.265–1.280.
SL above 1.319. TP 1.081 → 843 → 807.
One sentence: the trend is still up, but the location is already expensive. Long on pullback, short on rejection—don’t donate at the candle’s peak.
NFA. Perp ZEC liquidation is brutal🚨👀
215
·
--
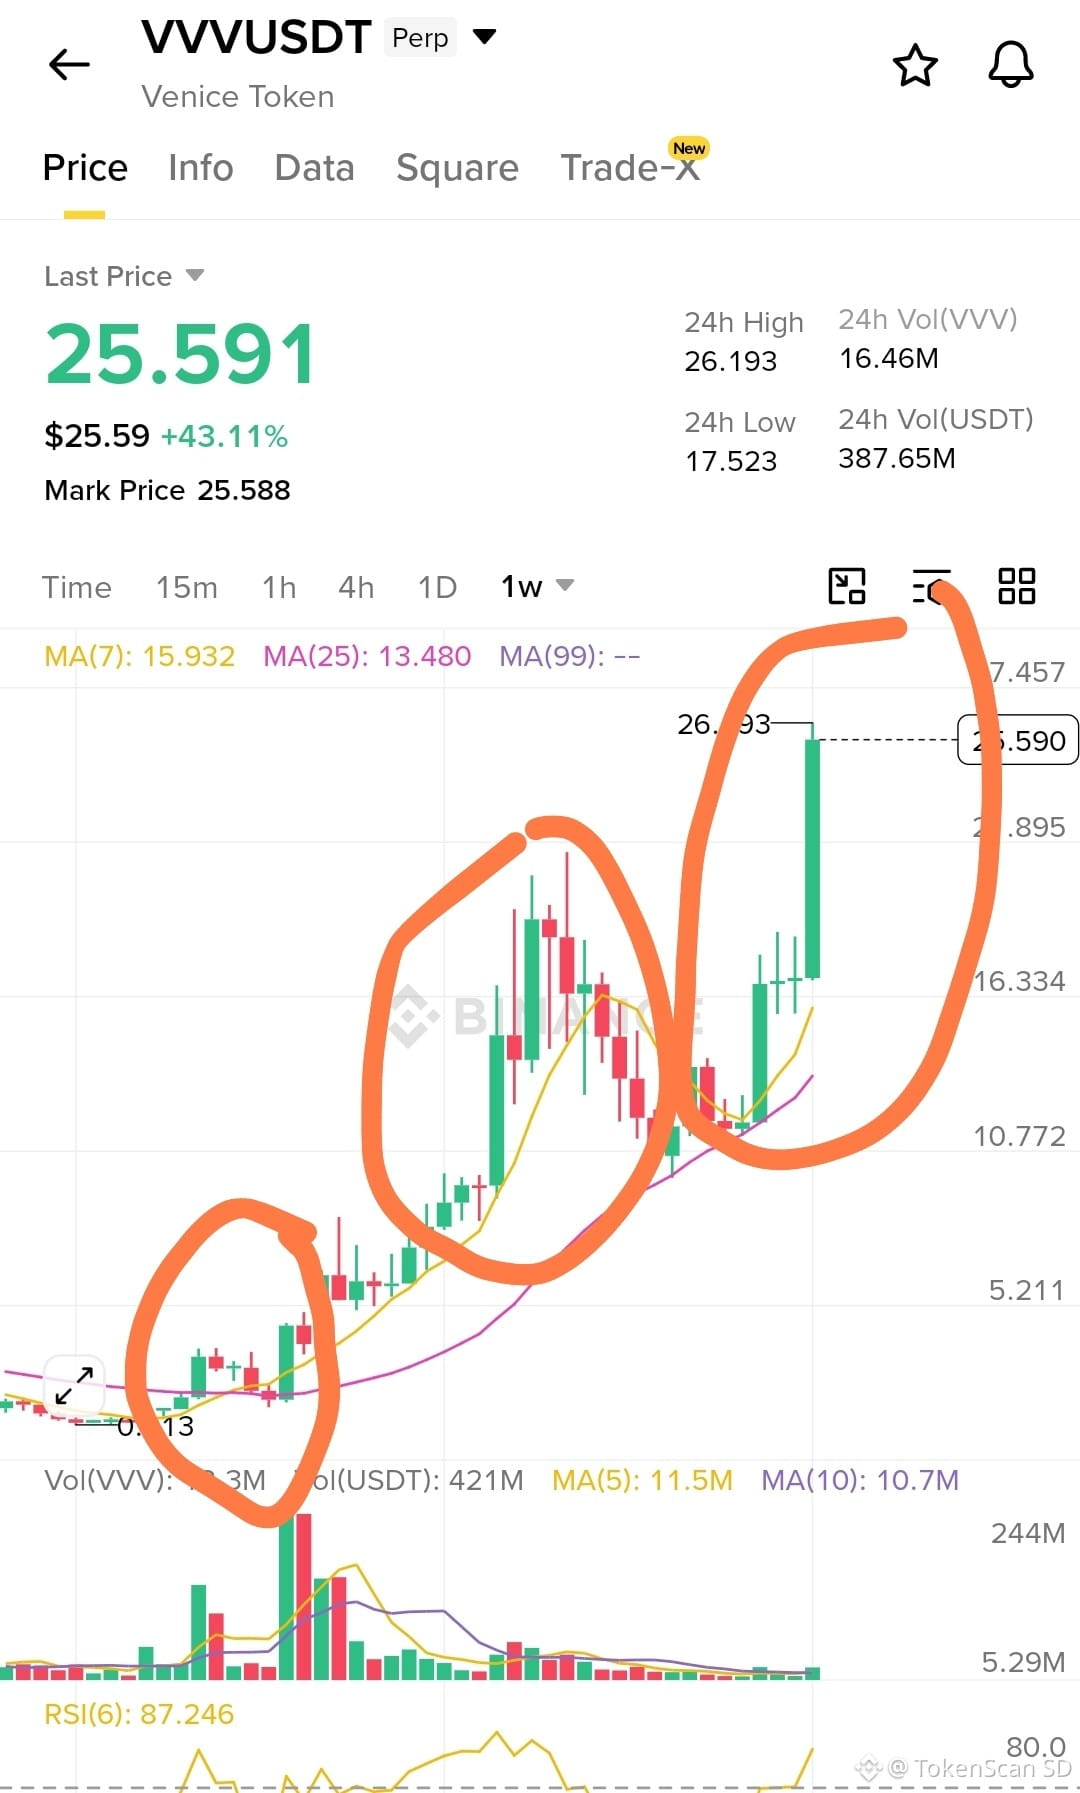
📊 VVV/USDT
Many people say this is a "PERFECT CHART"🚀
It really looks so neat when you look at it now:
✅ 3 times up-consolidate-up (staircase pattern)
✅ MA(7) & MA(25) neatly following the uptrend
✅ Big volume at the breakout point
✅ +43% in a single day
But wait... 👀
There are things we need to pay attention to:
🔴 RSI(6) at 87 — this is already in an extreme overbought zone (normally above 70 alone is already considered "overheated")
🔴 A 43% rise in one day is a parabolic move — a very wild move that is often followed by a sharp correction
🔴 What makes this chart look "perfect" is that we’re seeing it after all the movement has finished (hindsight bias). In real time, no one knows whether it will keep rising or suddenly dump
The key point: a chart that looks "perfect" in the past ≠ a guarantee that it will be perfect going forward. In fact, extreme RSI like this often becomes a risk signal for people who enter via FOMO at high prices.
Learning to read charts is important, but don’t let the visual beauty make us forget to check the risk indicators 🙏
$VVV
{future}(VVVUSDT)
#cryptoeducation #perfectchart
📊 VVV/USDT
Many people say this is a "PERFECT CHART"🚀
It really looks so neat when you look at it now:
✅ 3 times up-consolidate-up (staircase pattern)
✅ MA(7) & MA(25) neatly following the uptrend
✅ Big volume at the breakout point
✅ +43% in a single day
But wait... 👀
There are things we need to pay attention to:
🔴 RSI(6) at 87 — this is already in an extreme overbought zone (normally above 70 alone is already considered "overheated")
🔴 A 43% rise in one day is a parabolic move — a very wild move that is often followed by a sharp correction
🔴 What makes this chart look "perfect" is that we’re seeing it after all the movement has finished (hindsight bias). In real time, no one knows whether it will keep rising or suddenly dump
The key point: a chart that looks "perfect" in the past ≠ a guarantee that it will be perfect going forward. In fact, extreme RSI like this often becomes a risk signal for people who enter via FOMO at high prices.
Learning to read charts is important, but don’t let the visual beauty make us forget to check the risk indicators 🙏
$VVV
#cryptoeducation #perfectchart
Many people say this is a "PERFECT CHART"🚀
It really looks so neat when you look at it now:
✅ 3 times up-consolidate-up (staircase pattern)
✅ MA(7) & MA(25) neatly following the uptrend
✅ Big volume at the breakout point
✅ +43% in a single day
But wait... 👀
There are things we need to pay attention to:
🔴 RSI(6) at 87 — this is already in an extreme overbought zone (normally above 70 alone is already considered "overheated")
🔴 A 43% rise in one day is a parabolic move — a very wild move that is often followed by a sharp correction
🔴 What makes this chart look "perfect" is that we’re seeing it after all the movement has finished (hindsight bias). In real time, no one knows whether it will keep rising or suddenly dump
The key point: a chart that looks "perfect" in the past ≠ a guarantee that it will be perfect going forward. In fact, extreme RSI like this often becomes a risk signal for people who enter via FOMO at high prices.
Learning to read charts is important, but don’t let the visual beauty make us forget to check the risk indicators 🙏
$VVV
#cryptoeducation #perfectchart
399
·
--
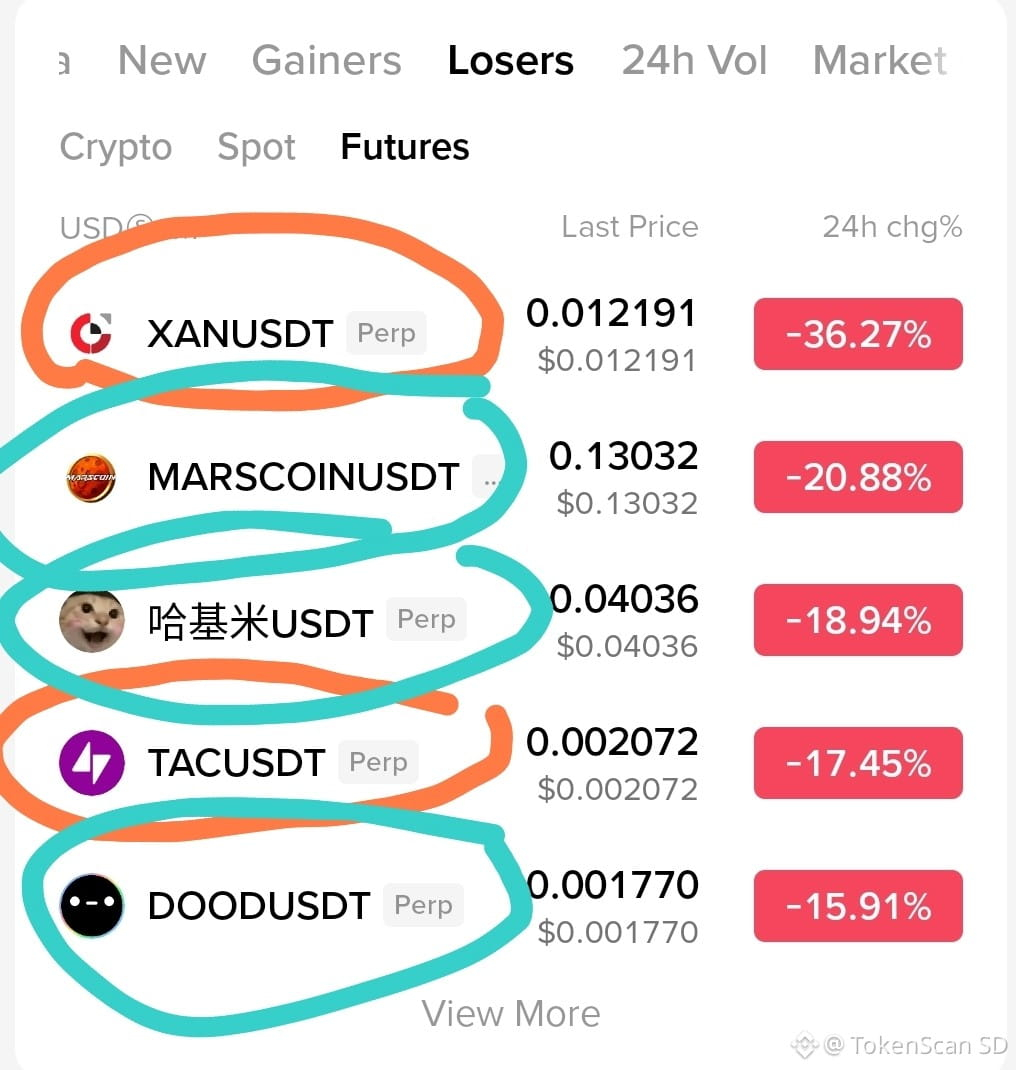
🚨 TOP LOSERS FUTURES TODAY... ADA THAT DROPPED ALL THE WAY TO -36%! 😱
Just scroll the “Losers” tab in Futures... it’s enough to make your heart stop! 💔
📉 XANUSDT: -36.27%
📉 MARSCOINUSDT: -20.88%
📉 哈基米(Hajimi)USDT: -18.94%
📉 TACUSDT: -17.45%
📉 DOODUSDT: -15.91%
Not BTC or ETH though... these are all MICRO-CAP tokens, aka low liquidity. And that’s what’s terrifying! 😨
Why? Because on tokens like these, you only need a LITTLE selling pressure to make the price collapse by dozens of percent in a single day. Plus, this is the FUTURES column — meaning many traders use leverage.
Imagine being long with 10x–20x leverage on a token like this when the price drops -36%... LIQUIDATED INSTANT. 💀 No mercy.
This is the “cascading liquidation” phenomenon — one position hits its stop loss, the price keeps falling, other positions get hit too, and so on. A terrifying domino effect for those who aren’t prepared.
Don’t get tricked by a green chart when a new token just gets listed, then start playing high-leverage futures without doing research. Micro-cap = high reward, but HIGH RISK too! ⚠️
Are you holding any of the tokens above? Tell us in the comments—hopefully you’re still surviving! 👇
#FutureTarding #Altcoin #Liquidations #TradingTips #BinanceSquare
$XAN
{future}(XANUSDT)
$MARSCOIN
{future}(MARSCOINUSDT)
$哈基米
{future}(哈基米USDT)
🚨 TOP LOSERS FUTURES TODAY... ADA THAT DROPPED ALL THE WAY TO -36%! 😱
Just scroll the “Losers” tab in Futures... it’s enough to make your heart stop! 💔
📉 XANUSDT: -36.27%
📉 MARSCOINUSDT: -20.88%
📉 哈基米(Hajimi)USDT: -18.94%
📉 TACUSDT: -17.45%
📉 DOODUSDT: -15.91%
Not BTC or ETH though... these are all MICRO-CAP tokens, aka low liquidity. And that’s what’s terrifying! 😨
Why? Because on tokens like these, you only need a LITTLE selling pressure to make the price collapse by dozens of percent in a single day. Plus, this is the FUTURES column — meaning many traders use leverage.
Imagine being long with 10x–20x leverage on a token like this when the price drops -36%... LIQUIDATED INSTANT. 💀 No mercy.
This is the “cascading liquidation” phenomenon — one position hits its stop loss, the price keeps falling, other positions get hit too, and so on. A terrifying domino effect for those who aren’t prepared.
Don’t get tricked by a green chart when a new token just gets listed, then start playing high-leverage futures without doing research. Micro-cap = high reward, but HIGH RISK too! ⚠️
Are you holding any of the tokens above? Tell us in the comments—hopefully you’re still surviving! 👇
#FutureTarding #Altcoin #Liquidations #TradingTips #BinanceSquare
$XAN
$MARSCOIN
$哈基米
Just scroll the “Losers” tab in Futures... it’s enough to make your heart stop! 💔
📉 XANUSDT: -36.27%
📉 MARSCOINUSDT: -20.88%
📉 哈基米(Hajimi)USDT: -18.94%
📉 TACUSDT: -17.45%
📉 DOODUSDT: -15.91%
Not BTC or ETH though... these are all MICRO-CAP tokens, aka low liquidity. And that’s what’s terrifying! 😨
Why? Because on tokens like these, you only need a LITTLE selling pressure to make the price collapse by dozens of percent in a single day. Plus, this is the FUTURES column — meaning many traders use leverage.
Imagine being long with 10x–20x leverage on a token like this when the price drops -36%... LIQUIDATED INSTANT. 💀 No mercy.
This is the “cascading liquidation” phenomenon — one position hits its stop loss, the price keeps falling, other positions get hit too, and so on. A terrifying domino effect for those who aren’t prepared.
Don’t get tricked by a green chart when a new token just gets listed, then start playing high-leverage futures without doing research. Micro-cap = high reward, but HIGH RISK too! ⚠️
Are you holding any of the tokens above? Tell us in the comments—hopefully you’re still surviving! 👇
#FutureTarding #Altcoin #Liquidations #TradingTips #BinanceSquare
$XAN
$MARSCOIN
$哈基米
2.7k
·
--
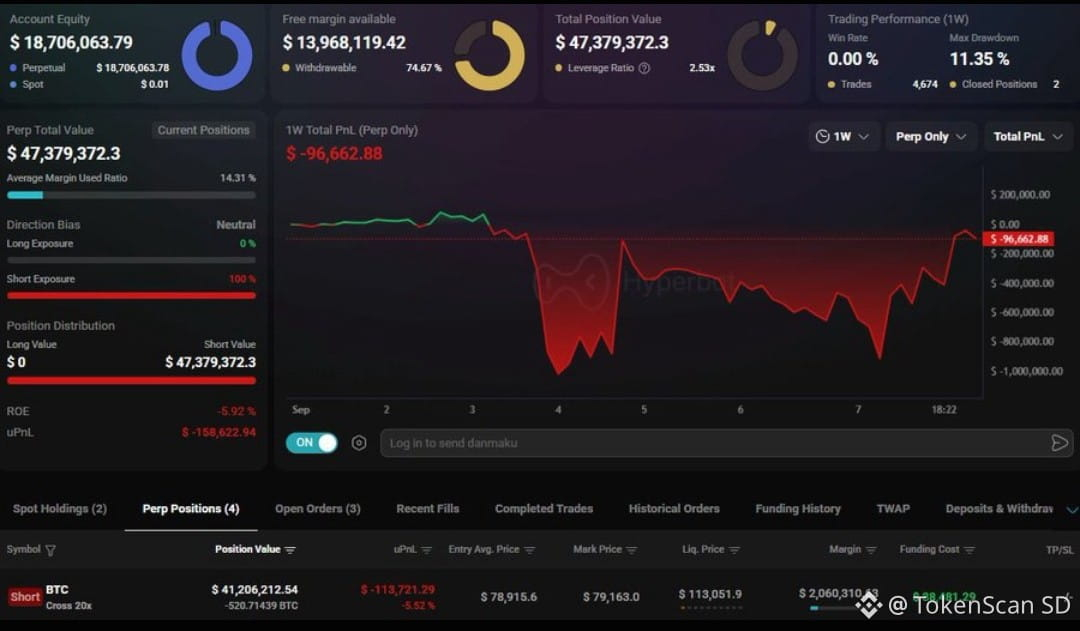
🐋 NEW WHALE JUST OPENED A SHORT $41 MILLION ON BTC... AND IMMEDIATELY STARTED CRYING BLOOD 😭
Imagine you have a trading account with $18.7 million in it... then open a SHORT position on BTC worth $41 million using 20x leverage.
Sounds brutal, right? 🔥
But when checked... 👀
❌ Floating loss: -$113.721 (-5.52%)
❌ Total unrealized PnL: -$158.622
❌ 1-week PnL: MINUS $96.662
❌ Win rate: 0.00%
❌ Max drawdown: 11.35%
Yeah, you read that right. WIN RATE IS ZERO PERCENT. 💀
Meanwhile, the margin locked for this position alone is already over $2 million, with the liquidation price at $113.051 — still not close, but if BTC keeps climbing... the pain can get even deeper.
What’s terrifying: this isn’t some amateur trader. Their equity is 18 million dollars. But the market doesn’t care whether you’re a whale or not — if you misread the direction, you’ll get crushed too.
So the question now: 🤔
Is this whale still confident BTC will drop and keep adding more shorts? Or will they cut losses before it gets worse?
In your opinion, will BTC keep going up this week, or will it reverse and dump? Drop your prediction in the comments below! 👇🔥
Are you going with SHORT
or sticking with LONG?
🐋 NEW WHALE JUST OPENED A SHORT $41 MILLION ON BTC... AND IMMEDIATELY STARTED CRYING BLOOD 😭
Imagine you have a trading account with $18.7 million in it... then open a SHORT position on BTC worth $41 million using 20x leverage.
Sounds brutal, right? 🔥
But when checked... 👀
❌ Floating loss: -$113.721 (-5.52%)
❌ Total unrealized PnL: -$158.622
❌ 1-week PnL: MINUS $96.662
❌ Win rate: 0.00%
❌ Max drawdown: 11.35%
Yeah, you read that right. WIN RATE IS ZERO PERCENT. 💀
Meanwhile, the margin locked for this position alone is already over $2 million, with the liquidation price at $113.051 — still not close, but if BTC keeps climbing... the pain can get even deeper.
What’s terrifying: this isn’t some amateur trader. Their equity is 18 million dollars. But the market doesn’t care whether you’re a whale or not — if you misread the direction, you’ll get crushed too.
So the question now: 🤔
Is this whale still confident BTC will drop and keep adding more shorts? Or will they cut losses before it gets worse?
In your opinion, will BTC keep going up this week, or will it reverse and dump? Drop your prediction in the comments below! 👇🔥
Are you going with SHORT
or sticking with LONG?
Imagine you have a trading account with $18.7 million in it... then open a SHORT position on BTC worth $41 million using 20x leverage.
Sounds brutal, right? 🔥
But when checked... 👀
❌ Floating loss: -$113.721 (-5.52%)
❌ Total unrealized PnL: -$158.622
❌ 1-week PnL: MINUS $96.662
❌ Win rate: 0.00%
❌ Max drawdown: 11.35%
Yeah, you read that right. WIN RATE IS ZERO PERCENT. 💀
Meanwhile, the margin locked for this position alone is already over $2 million, with the liquidation price at $113.051 — still not close, but if BTC keeps climbing... the pain can get even deeper.
What’s terrifying: this isn’t some amateur trader. Their equity is 18 million dollars. But the market doesn’t care whether you’re a whale or not — if you misread the direction, you’ll get crushed too.
So the question now: 🤔
Is this whale still confident BTC will drop and keep adding more shorts? Or will they cut losses before it gets worse?
In your opinion, will BTC keep going up this week, or will it reverse and dump? Drop your prediction in the comments below! 👇🔥
Are you going with SHORT
or sticking with LONG?
71
Log in to explore more content
Join global crypto users on Binance Square
⚡️ Get latest and useful information about crypto.
💬 Trusted by the world’s largest crypto exchange.
👍 Discover real insights from verified creators.
Email / Phone number
Trending Topics
AnthropicCEOCallsForAISlowdown
9,766 views
234 Discussing
#AnthropicCEOCallsForAISlowdown Anthropic CEO Calls for an AI Slowdown
The AI race is moving at incredible speed, but Anthropic’s CEO is calling for a more cautious approach. 🤖⚠️
The message is simple: innovation shouldn’t come at the cost of safety. As AI models become more powerful, companies may need stronger testing, safeguards, and responsible deployment before pushing the limits even further.
AI can transform industries, markets, and everyday life — but the faster it develops, the more important responsible development becomes. 🌍🧠$LSK
$VOD.US
Crypto_With_Kinza
·0 Likes
·34 views
AnthropicChoosesNasdaqForPotentialIPO
1,141 views
47 Discussing
SECReceivesGrayscaleLitecoinTrustETFFiling
124,664 views
1,767 Discussing