
Trad7
115 Posts

Trad7
Report
Block User
تابعونا لكل جديد في عالم العملات الرقمية تحليلات السوق .أخبار العملات . فرص استثمارية متابعة الأسعار وأهم التحديثات المعرفة أولا والقرار لك.
High-Frequency Trader
1.8 Months
3 Following
8 Followers
145 Liked
Posts
·
--
Article
Bitcoin Between Decline and Recovery: Why Has the Price Fallen, and Where Is It Headed Next?📉 Bitcoin Between Decline and Recovery: Where Is the Price Headed?
Bitcoin ($BTC ) is facing selling pressure due to several factors, most notably profit-taking, declining liquidity, investors’ concerns about global economic conditions, and the liquidation of leveraged trading positions. But does this signal the beginning of a new crash, or is it merely a price correction before the uptrend resumes?
Bitcoin Between Decline and Recovery: Why Has the Price Fallen, and Where Is It Headed Next?
📉 Bitcoin Between Decline and Recovery: Where Is the Price Headed?
Bitcoin ($BTC ) is facing selling pressure due to several factors, most notably profit-taking, declining liquidity, investors’ concerns about global economic conditions, and the liquidation of leveraged trading positions. But does this signal the beginning of a new crash, or is it merely a price correction before the uptrend resumes?
Bitcoin ($BTC ) is facing selling pressure due to several factors, most notably profit-taking, declining liquidity, investors’ concerns about global economic conditions, and the liquidation of leveraged trading positions. But does this signal the beginning of a new crash, or is it merely a price correction before the uptrend resumes?
1
57
·
--
Bullish
Verified
$DOT Descending wedge support remains intact as Polkadot writes its own future 🧐
Polkadot is holding the lower boundary of the descending wedge on the weekly timeframe.
Referendum 1954 passed with 97% approval on November 11, officially steering #DOT toward consumer products.
The first product is a mobile app for private messaging and digital payments, powered by dotUSD—a DOT-backed stablecoin already available, with $4.21 million in circulation.
Target levels:
🎯 $1.30
🎯 $2.10
🎯 $3.20
🎯 $5.30
🎯 $11.60
$DOT Descending wedge support remains intact as Polkadot writes its own future 🧐
Polkadot is holding the lower boundary of the descending wedge on the weekly timeframe.
Referendum 1954 passed with 97% approval on November 11, officially steering #DOT toward consumer products.
The first product is a mobile app for private messaging and digital payments, powered by dotUSD—a DOT-backed stablecoin already available, with $4.21 million in circulation.
Target levels:
🎯 $1.30
🎯 $2.10
🎯 $3.20
🎯 $5.30
🎯 $11.60
Polkadot is holding the lower boundary of the descending wedge on the weekly timeframe.
Referendum 1954 passed with 97% approval on November 11, officially steering #DOT toward consumer products.
The first product is a mobile app for private messaging and digital payments, powered by dotUSD—a DOT-backed stablecoin already available, with $4.21 million in circulation.
Target levels:
🎯 $1.30
🎯 $2.10
🎯 $3.20
🎯 $5.30
🎯 $11.60
1
136
·
--
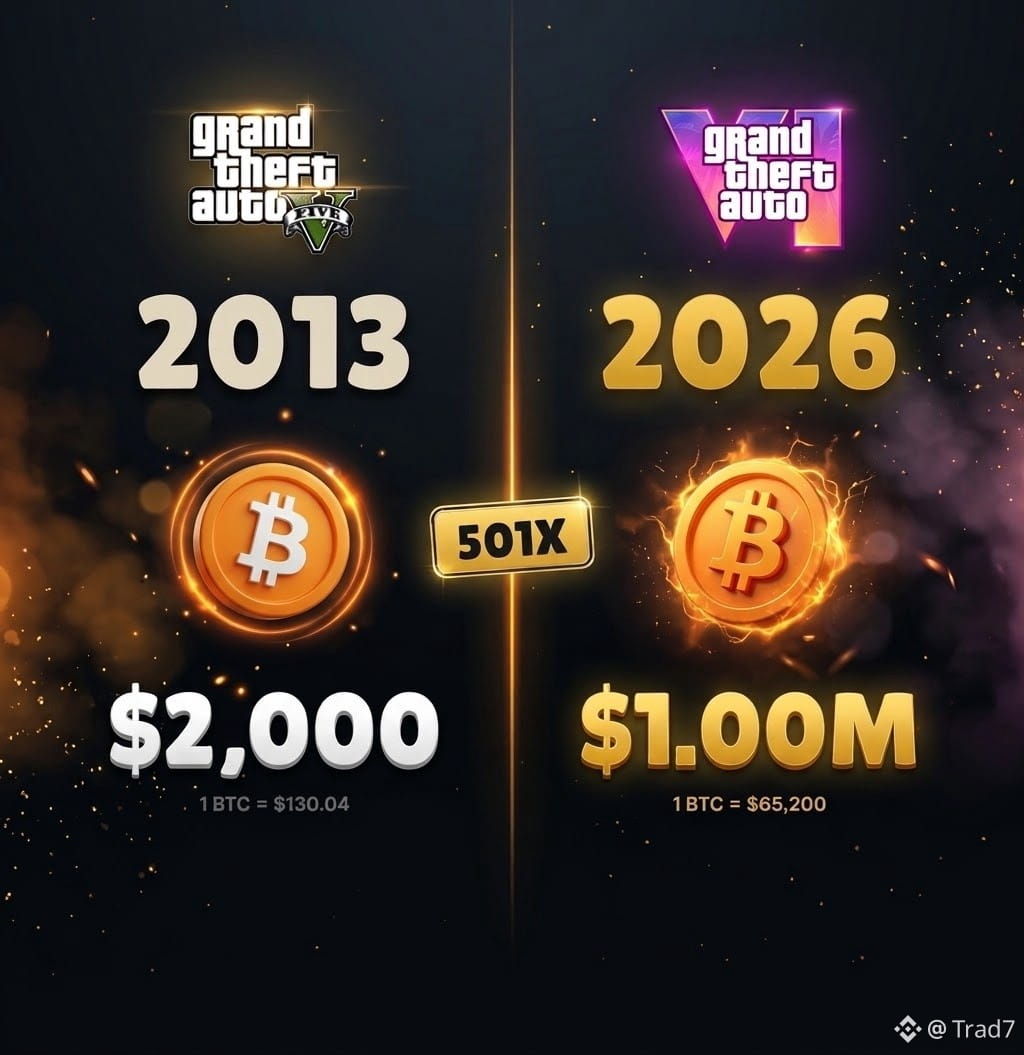
🚀 From $2,000 to $1 million! Can you imagine?
In 2013, one Bitcoin cost around $130. Imagine if you had invested $2,000 back then and held onto it until 2026—based on the figures shown in the image, your investment would be worth nearly $1 million!
The most important lesson isn’t just Bitcoin’s price increase, but the power of long-term vision, patience, and understanding opportunities in the world of investing.
Small opportunities today may seem insignificant, but how will we look at them 10 years from now?
Question: Do you think there’s an investment opportunity today that could become a major success story by 2036? ₿
$BTC
🚀 From $2,000 to $1 million! Can you imagine?
In 2013, one Bitcoin cost around $130. Imagine if you had invested $2,000 back then and held onto it until 2026—based on the figures shown in the image, your investment would be worth nearly $1 million!
The most important lesson isn’t just Bitcoin’s price increase, but the power of long-term vision, patience, and understanding opportunities in the world of investing.
Small opportunities today may seem insignificant, but how will we look at them 10 years from now?
Question: Do you think there’s an investment opportunity today that could become a major success story by 2036? ₿
$BTC
In 2013, one Bitcoin cost around $130. Imagine if you had invested $2,000 back then and held onto it until 2026—based on the figures shown in the image, your investment would be worth nearly $1 million!
The most important lesson isn’t just Bitcoin’s price increase, but the power of long-term vision, patience, and understanding opportunities in the world of investing.
Small opportunities today may seem insignificant, but how will we look at them 10 years from now?
Question: Do you think there’s an investment opportunity today that could become a major success story by 2036? ₿
$BTC
1
110
·
--
Breaking: 🇬🇧 Revolut launches 4 blockchain-based funds for its 80 million customers, making it easier for users to invest in private markets with smaller amounts.
Blockchain adoption is growing 🚀
$BTC
Breaking: 🇬🇧 Revolut launches 4 blockchain-based funds for its 80 million customers, making it easier for users to invest in private markets with smaller amounts.
Blockchain adoption is growing 🚀
$BTC
Blockchain adoption is growing 🚀
$BTC
2
63
·
--
Some sell at a loss out of fear of a crash, while others eagerly wait for these prices to buy
Here the weak hands exit, and here smart money begins accumulating quietly
Buy, hold, and let the impatient regret it
In the end, the market transfers wealth from the hands of the fearful to the hands of the patient
$BTC $ETH $SOL
Some sell at a loss out of fear of a crash, while others eagerly wait for these prices to buy
Here the weak hands exit, and here smart money begins accumulating quietly
Buy, hold, and let the impatient regret it
In the end, the market transfers wealth from the hands of the fearful to the hands of the patient
$BTC $ETH $SOL
Here the weak hands exit, and here smart money begins accumulating quietly
Buy, hold, and let the impatient regret it
In the end, the market transfers wealth from the hands of the fearful to the hands of the patient
$BTC $ETH $SOL
1
23
·
--
Verified
Team $ASTER just burned another 7 million tokens 🚨
From November 2 to 16, 99% of platform fees were used to buy 3.48 million $ASTER for the stakers.
Another 3.48 million $ASTER were burned from the team’s allocation.
Total burned across all programs: 216.17 million .
But the price swung wildly over the last 48 hours: it was down 25%, then rose 50%, then fell again.
Now the price is slowly recovering again, but people are still confused about it.
Team $ASTER just burned another 7 million tokens 🚨
From November 2 to 16, 99% of platform fees were used to buy 3.48 million $ASTER for the stakers.
Another 3.48 million $ASTER were burned from the team’s allocation.
Total burned across all programs: 216.17 million .
But the price swung wildly over the last 48 hours: it was down 25%, then rose 50%, then fell again.
Now the price is slowly recovering again, but people are still confused about it.
From November 2 to 16, 99% of platform fees were used to buy 3.48 million $ASTER for the stakers.
Another 3.48 million $ASTER were burned from the team’s allocation.
Total burned across all programs: 216.17 million .
But the price swung wildly over the last 48 hours: it was down 25%, then rose 50%, then fell again.
Now the price is slowly recovering again, but people are still confused about it.

3
358
·
--
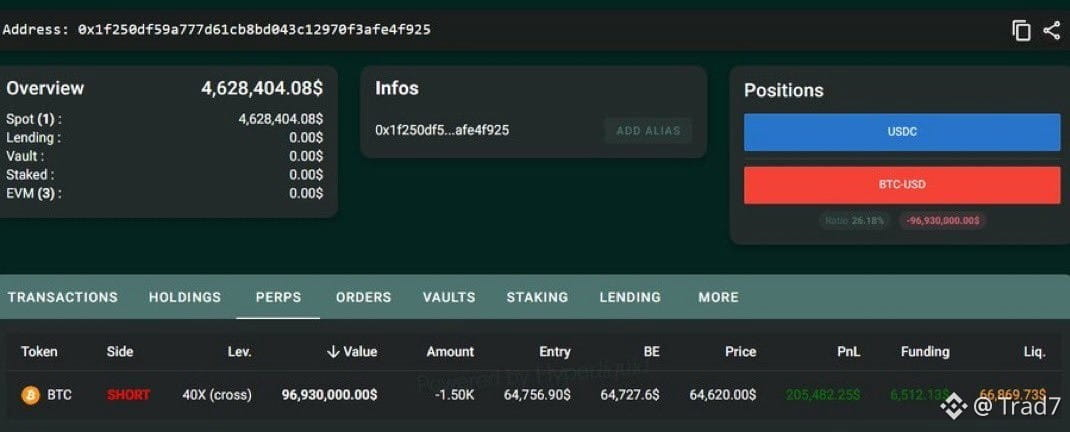
A whale is betting nearly $100 million that Bitcoin will fall.
$BTC
They’ve opened a $96.9 million short position on Bitcoin with 40x leverage.
📉 Entry price: $64,756
💰 Position size: $96.93 million
⚡ Leverage: 40x
🎯 Liquidation price: $66,869
The most striking part is that if Bitcoin rises to $67,000, their entire position could be wiped out.
We’re talking about a highly aggressive bet, where any sudden market move could result in losses worth millions of dollars.
🐻 Is this bearish conviction or overconfidence?
The market will decide whether this whale ends up celebrating or going back to flipping burgers. 🍔
#BTC
A whale is betting nearly $100 million that Bitcoin will fall.
$BTC
They’ve opened a $96.9 million short position on Bitcoin with 40x leverage.
📉 Entry price: $64,756
💰 Position size: $96.93 million
⚡ Leverage: 40x
🎯 Liquidation price: $66,869
The most striking part is that if Bitcoin rises to $67,000, their entire position could be wiped out.
We’re talking about a highly aggressive bet, where any sudden market move could result in losses worth millions of dollars.
🐻 Is this bearish conviction or overconfidence?
The market will decide whether this whale ends up celebrating or going back to flipping burgers. 🍔
#BTC
$BTC
They’ve opened a $96.9 million short position on Bitcoin with 40x leverage.
📉 Entry price: $64,756
💰 Position size: $96.93 million
⚡ Leverage: 40x
🎯 Liquidation price: $66,869
The most striking part is that if Bitcoin rises to $67,000, their entire position could be wiped out.
We’re talking about a highly aggressive bet, where any sudden market move could result in losses worth millions of dollars.
🐻 Is this bearish conviction or overconfidence?
The market will decide whether this whale ends up celebrating or going back to flipping burgers. 🍔
#BTC
2
4
1.4k
·
--
Bullish
Analysis of coin $BULLA on the 1-hour timeframe (1h) 📈
The current price is at 0.018240.
🟦 Support / demand zone (blue zone):
0.015500 – 0.016500
📈 Main scenario (bullish):
As long as the price remains above the blue zone, the trend is bullish, targeting the areas marked in white:
• First target: 0.023305
• Second target: 0.027340
• Main target: 0.031795
📉 Bearish scenario:
If the blue zone is broken and the price closes below it, bearish momentum will begin, and the coin will turn bearish, targeting the area marked in red.
⚠️ Note:
This analysis is intended to monitor price behavior at important levels. Any entry or exit is at your own risk.
Analysis of coin $BULLA on the 1-hour timeframe (1h) 📈
The current price is at 0.018240.
🟦 Support / demand zone (blue zone):
0.015500 – 0.016500
📈 Main scenario (bullish):
As long as the price remains above the blue zone, the trend is bullish, targeting the areas marked in white:
• First target: 0.023305
• Second target: 0.027340
• Main target: 0.031795
📉 Bearish scenario:
If the blue zone is broken and the price closes below it, bearish momentum will begin, and the coin will turn bearish, targeting the area marked in red.
⚠️ Note:
This analysis is intended to monitor price behavior at important levels. Any entry or exit is at your own risk.
The current price is at 0.018240.
🟦 Support / demand zone (blue zone):
0.015500 – 0.016500
📈 Main scenario (bullish):
As long as the price remains above the blue zone, the trend is bullish, targeting the areas marked in white:
• First target: 0.023305
• Second target: 0.027340
• Main target: 0.031795
📉 Bearish scenario:
If the blue zone is broken and the price closes below it, bearish momentum will begin, and the coin will turn bearish, targeting the area marked in red.
⚠️ Note:
This analysis is intended to monitor price behavior at important levels. Any entry or exit is at your own risk.
1
164
·
--
Bullish
$KAVA
There is buying volume 🤑
High risk, as its protocol was hacked a week ago.
If you enter, do so with a carefully considered amount and set an immediate stop at
0.02481 ⛔️
$KAVA
There is buying volume 🤑
High risk, as its protocol was hacked a week ago.
If you enter, do so with a carefully considered amount and set an immediate stop at
0.02481 ⛔️
There is buying volume 🤑
High risk, as its protocol was hacked a week ago.
If you enter, do so with a carefully considered amount and set an immediate stop at
0.02481 ⛔️
1
80
·
--
Bullish
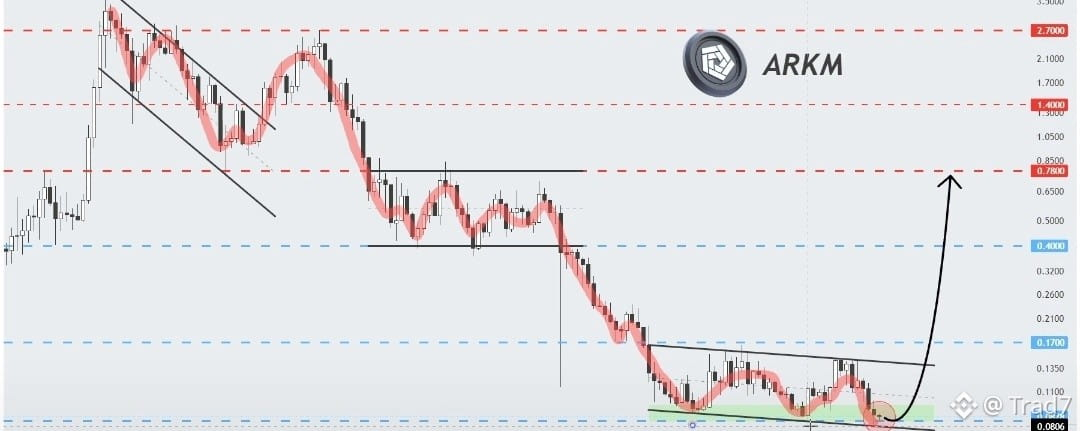
$ARKM $3 billion marked. The chart is ready too 📈
Arkham is trying to bounce off the lower boundary of the descending channel on the weekly chart, just as more than $3 billion in institutional crypto funds are being added to the platform.
CoinShares, VanEck, Morgan Stanley, Franklin Templeton, and other entities are now all visible on Arkham.
The platform is becoming the standard for institutional on-chain tracking.
Target levels:
🎯 $0.17
🎯 $0.40
🎯 $0.78
#BTC
$ARKM $3 billion marked. The chart is ready too 📈
Arkham is trying to bounce off the lower boundary of the descending channel on the weekly chart, just as more than $3 billion in institutional crypto funds are being added to the platform.
CoinShares, VanEck, Morgan Stanley, Franklin Templeton, and other entities are now all visible on Arkham.
The platform is becoming the standard for institutional on-chain tracking.
Target levels:
🎯 $0.17
🎯 $0.40
🎯 $0.78
#BTC
Arkham is trying to bounce off the lower boundary of the descending channel on the weekly chart, just as more than $3 billion in institutional crypto funds are being added to the platform.
CoinShares, VanEck, Morgan Stanley, Franklin Templeton, and other entities are now all visible on Arkham.
The platform is becoming the standard for institutional on-chain tracking.
Target levels:
🎯 $0.17
🎯 $0.40
🎯 $0.78
#BTC
1
73
·
--
Markets are awaiting today's U.S. retail sales data
The report will be released at 8:30 a.m. New York time, before U.S. markets open
Above 0.4%: Positive for markets
Around 0.2%: Neutral impact
Below 0%: Negative for markets
These figures affect expectations for the U.S. economy and movements in Bitcoin, stocks, and the dollar
All eyes are on the report
$BTC $SOL $ETH
Markets are awaiting today's U.S. retail sales data
The report will be released at 8:30 a.m. New York time, before U.S. markets open
Above 0.4%: Positive for markets
Around 0.2%: Neutral impact
Below 0%: Negative for markets
These figures affect expectations for the U.S. economy and movements in Bitcoin, stocks, and the dollar
All eyes are on the report
$BTC $SOL $ETH
The report will be released at 8:30 a.m. New York time, before U.S. markets open
Above 0.4%: Positive for markets
Around 0.2%: Neutral impact
Below 0%: Negative for markets
These figures affect expectations for the U.S. economy and movements in Bitcoin, stocks, and the dollar
All eyes are on the report
$BTC $SOL $ETH
1
1
77
·
--
Bearish
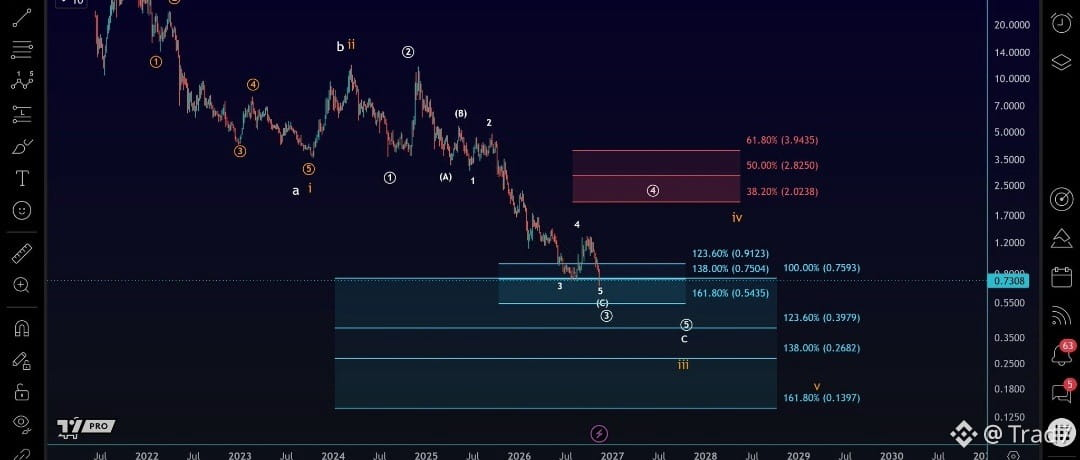
Selling pressure on $DOT is still ongoing… and the third wave is expanding!
The $DOT coin has already broken below the blue level at $0.75, supporting the continuation of the current bearish scenario according to wave analysis.
The focus is currently on the downward Wave 3 Extension, with the next target marked on the chart at the 161.8% Fibonacci level of $0.544.
In other words, the break below $0.75 makes the $0.544 zone the key price level I’m watching at this stage.
Selling pressure on $DOT is still ongoing… and the third wave is expanding!
The $DOT coin has already broken below the blue level at $0.75, supporting the continuation of the current bearish scenario according to wave analysis.
The focus is currently on the downward Wave 3 Extension, with the next target marked on the chart at the 161.8% Fibonacci level of $0.544.
In other words, the break below $0.75 makes the $0.544 zone the key price level I’m watching at this stage.
The $DOT coin has already broken below the blue level at $0.75, supporting the continuation of the current bearish scenario according to wave analysis.
The focus is currently on the downward Wave 3 Extension, with the next target marked on the chart at the 161.8% Fibonacci level of $0.544.
In other words, the break below $0.75 makes the $0.544 zone the key price level I’m watching at this stage.
1
1
487
·
--
Bullish
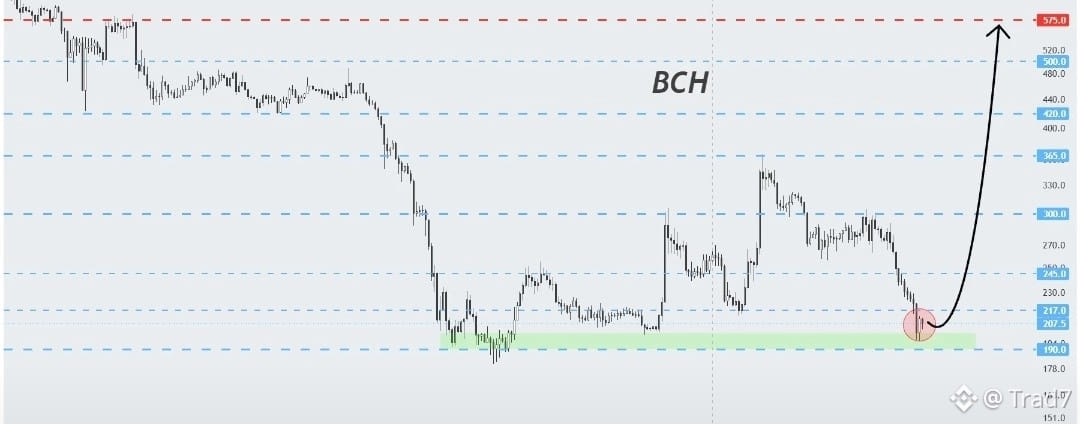
$BCH One-minute blocks are coming. The chart is ready ✈️
Bitcoin Cash is holding steady above the support area on the daily chart, and the network just announced its biggest upgrade in years.
One-minute blocks will arrive on the mainnet in May 2027. This will mean faster confirmations, tighter settlement, and true payment finality, which 0-conf cannot guarantee.
Target levels after a confirmed bounce:
🎯 $245
🎯 $300
🎯 $365
🎯 $420
🎯 $575
#BTC #ETH
$BCH One-minute blocks are coming. The chart is ready ✈️
Bitcoin Cash is holding steady above the support area on the daily chart, and the network just announced its biggest upgrade in years.
One-minute blocks will arrive on the mainnet in May 2027. This will mean faster confirmations, tighter settlement, and true payment finality, which 0-conf cannot guarantee.
Target levels after a confirmed bounce:
🎯 $245
🎯 $300
🎯 $365
🎯 $420
🎯 $575
#BTC #ETH
Bitcoin Cash is holding steady above the support area on the daily chart, and the network just announced its biggest upgrade in years.
One-minute blocks will arrive on the mainnet in May 2027. This will mean faster confirmations, tighter settlement, and true payment finality, which 0-conf cannot guarantee.
Target levels after a confirmed bounce:
🎯 $245
🎯 $300
🎯 $365
🎯 $420
🎯 $575
#BTC #ETH
1
74
·
--
Is $PHA close to ending the downtrend? The chart is testing an important turning point!
After a long period of selling pressure, PHA is currently testing a major downtrend line, while the price is approaching an important support zone at $0.0280.
This zone could be a launching point for an attempted bullish reversal, but the key signal will be a breakout above the downtrend line and confirmation that the price holds above it.
🎯 Potential target: $0.0571
That would represent a rise of around 82% from the $0.0314 level.
This scenario is worth watching, but it’s best not to anticipate the breakout; simply testing the trend line doesn’t mean the trend has actually reversed.
Is $PHA close to ending the downtrend? The chart is testing an important turning point!
After a long period of selling pressure, PHA is currently testing a major downtrend line, while the price is approaching an important support zone at $0.0280.
This zone could be a launching point for an attempted bullish reversal, but the key signal will be a breakout above the downtrend line and confirmation that the price holds above it.
🎯 Potential target: $0.0571
That would represent a rise of around 82% from the $0.0314 level.
This scenario is worth watching, but it’s best not to anticipate the breakout; simply testing the trend line doesn’t mean the trend has actually reversed.
After a long period of selling pressure, PHA is currently testing a major downtrend line, while the price is approaching an important support zone at $0.0280.
This zone could be a launching point for an attempted bullish reversal, but the key signal will be a breakout above the downtrend line and confirmation that the price holds above it.
🎯 Potential target: $0.0571
That would represent a rise of around 82% from the $0.0314 level.
This scenario is worth watching, but it’s best not to anticipate the breakout; simply testing the trend line doesn’t mean the trend has actually reversed.
1
170
·
--
Hackers steal nearly $15.5 MILLION from Lighter using leaked API keys.
Hackers steal nearly $15.5 MILLION from Lighter using leaked API keys.
$LIT crashed 18% on the news.
Hackers steal nearly $15.5 MILLION from Lighter using leaked API keys.
Hackers steal nearly $15.5 MILLION from Lighter using leaked API keys.
$LIT crashed 18% on the news.
Hackers steal nearly $15.5 MILLION from Lighter using leaked API keys.
$LIT crashed 18% on the news.
1
2
·
--
Has the performance of some Altcoins started to improve compared to Bitcoin? 👀
There’s an important observation on the charts lately: several altcoins aren’t showing the same level of selling pressure that we’re seeing in their price action against the dollar.
$SUI is a clear example of this.
Over the past year, the coin has gradually formed a Bullish Divergence against Bitcoin, and over time its relative performance has started to improve. We’ve now reached an important breakout stage.
More important than the breakout itself is that the price has started forming a Higher Low—an indication worth watching for the possibility of continued improvement and an attempt to start a new upward wave.
But there’s one key factor we need to consider: Bitcoin.
For $SUI and altcoins to continue improving their performance, the market needs to remain stable, without selling pressure returning with force.
In my view, the picture isn’t as negative as many people imagine, and there are indicators worth monitoring in the coming period.
Could we be seeing the start of a genuine improvement in Altcoin performance against $BTC ?
Has the performance of some Altcoins started to improve compared to Bitcoin? 👀
There’s an important observation on the charts lately: several altcoins aren’t showing the same level of selling pressure that we’re seeing in their price action against the dollar.
$SUI is a clear example of this.
Over the past year, the coin has gradually formed a Bullish Divergence against Bitcoin, and over time its relative performance has started to improve. We’ve now reached an important breakout stage.
More important than the breakout itself is that the price has started forming a Higher Low—an indication worth watching for the possibility of continued improvement and an attempt to start a new upward wave.
But there’s one key factor we need to consider: Bitcoin.
For $SUI and altcoins to continue improving their performance, the market needs to remain stable, without selling pressure returning with force.
In my view, the picture isn’t as negative as many people imagine, and there are indicators worth monitoring in the coming period.
Could we be seeing the start of a genuine improvement in Altcoin performance against $BTC ?
There’s an important observation on the charts lately: several altcoins aren’t showing the same level of selling pressure that we’re seeing in their price action against the dollar.
$SUI is a clear example of this.
Over the past year, the coin has gradually formed a Bullish Divergence against Bitcoin, and over time its relative performance has started to improve. We’ve now reached an important breakout stage.
More important than the breakout itself is that the price has started forming a Higher Low—an indication worth watching for the possibility of continued improvement and an attempt to start a new upward wave.
But there’s one key factor we need to consider: Bitcoin.
For $SUI and altcoins to continue improving their performance, the market needs to remain stable, without selling pressure returning with force.
In my view, the picture isn’t as negative as many people imagine, and there are indicators worth monitoring in the coming period.
Could we be seeing the start of a genuine improvement in Altcoin performance against $BTC ?
1
146
·
--
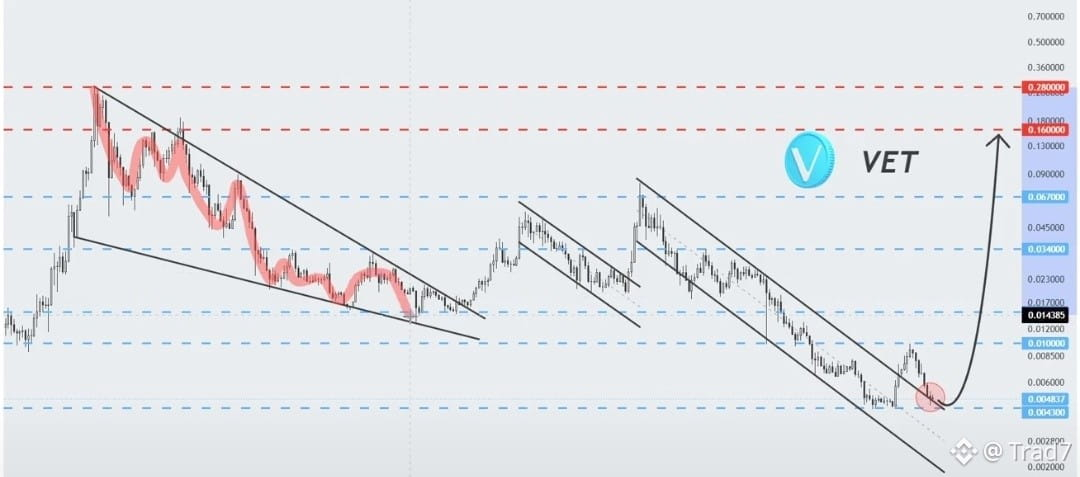
$VET Broken channel. Confirmed retest. The fundamentals are in place.
VeChain is retesting the broken descending channel on the weekly timeframe.
- Fixed supply of 86.7 billion #VET ;
- Genuine institutional partners;
- More than 5 million active users;
- EU Digital Product Passport integration;
- StarGate staking has already locked up 18% of the supply.
This coin was steadily growing while most people weren’t paying attention.
Target levels after a confirmed bounce:
🎯 $0.010
🎯 $0.015
🎯 $0.034
🎯 $0.067
🎯 $0.160
$VET Broken channel. Confirmed retest. The fundamentals are in place.
VeChain is retesting the broken descending channel on the weekly timeframe.
- Fixed supply of 86.7 billion #VET ;
- Genuine institutional partners;
- More than 5 million active users;
- EU Digital Product Passport integration;
- StarGate staking has already locked up 18% of the supply.
This coin was steadily growing while most people weren’t paying attention.
Target levels after a confirmed bounce:
🎯 $0.010
🎯 $0.015
🎯 $0.034
🎯 $0.067
🎯 $0.160
VeChain is retesting the broken descending channel on the weekly timeframe.
- Fixed supply of 86.7 billion #VET ;
- Genuine institutional partners;
- More than 5 million active users;
- EU Digital Product Passport integration;
- StarGate staking has already locked up 18% of the supply.
This coin was steadily growing while most people weren’t paying attention.
Target levels after a confirmed bounce:
🎯 $0.010
🎯 $0.015
🎯 $0.034
🎯 $0.067
🎯 $0.160
2
251
·
--
🚨 A dormant Bitcoin wallet from 2011 moves for the first time in 15 years!
A notable transaction took place on the Bitcoin network after 75 BTC worth nearly $5 million were moved, even though these coins had remained untouched since 2011.
But what’s intriguing about the story isn’t the transfer itself—it’s the wallet’s connection to a massive lawsuit.
The wallet is listed in a $247 billion lawsuit filed by a person known as Noah Doe, who claims to own around 3.8 million BTC distributed across 39,069 addresses.
Even stranger, the transaction included a very small amount carrying the court’s legal notice.
According to reports, the case includes wallet addresses attributed to Satoshi Nakamoto, Bitcoin’s anonymous founder.
The wallet that moved the 75 BTC was listed as defendant number 3,419 and had previously received a court-ordered legal notice.
The question is: are we simply seeing old coins being moved, or is this the beginning of new developments related to the case?
Important note: Listing the wallet in the lawsuit or attributing it to Satoshi does not prove that the plaintiff owns the coins or that the wallet is actually connected to him.
$BTC
#BTC
🚨 A dormant Bitcoin wallet from 2011 moves for the first time in 15 years!
A notable transaction took place on the Bitcoin network after 75 BTC worth nearly $5 million were moved, even though these coins had remained untouched since 2011.
But what’s intriguing about the story isn’t the transfer itself—it’s the wallet’s connection to a massive lawsuit.
The wallet is listed in a $247 billion lawsuit filed by a person known as Noah Doe, who claims to own around 3.8 million BTC distributed across 39,069 addresses.
Even stranger, the transaction included a very small amount carrying the court’s legal notice.
According to reports, the case includes wallet addresses attributed to Satoshi Nakamoto, Bitcoin’s anonymous founder.
The wallet that moved the 75 BTC was listed as defendant number 3,419 and had previously received a court-ordered legal notice.
The question is: are we simply seeing old coins being moved, or is this the beginning of new developments related to the case?
Important note: Listing the wallet in the lawsuit or attributing it to Satoshi does not prove that the plaintiff owns the coins or that the wallet is actually connected to him.
$BTC
#BTC
A notable transaction took place on the Bitcoin network after 75 BTC worth nearly $5 million were moved, even though these coins had remained untouched since 2011.
But what’s intriguing about the story isn’t the transfer itself—it’s the wallet’s connection to a massive lawsuit.
The wallet is listed in a $247 billion lawsuit filed by a person known as Noah Doe, who claims to own around 3.8 million BTC distributed across 39,069 addresses.
Even stranger, the transaction included a very small amount carrying the court’s legal notice.
According to reports, the case includes wallet addresses attributed to Satoshi Nakamoto, Bitcoin’s anonymous founder.
The wallet that moved the 75 BTC was listed as defendant number 3,419 and had previously received a court-ordered legal notice.
The question is: are we simply seeing old coins being moved, or is this the beginning of new developments related to the case?
Important note: Listing the wallet in the lawsuit or attributing it to Satoshi does not prove that the plaintiff owns the coins or that the wallet is actually connected to him.
$BTC
#BTC
1
128
·
--
⚠️ $LINK is at an important support area… but there’s still no clear sign that a bottom has formed!
The price is currently testing the support area highlighted in orange between:
📍 $7.63 – $9.498
Technically, though, there’s still no confirmation that a bottom has actually formed.
According to the Elliott Wave scenario, the fifth wave of wave (C) could still extend downward within the same support area before the correction ends.
So, the price simply reaching this area isn’t enough reason to rush into buying.
It’s better to monitor price action and wait for a clear reversal signal before considering this area an entry opportunity.
⚠️ $LINK is at an important support area… but there’s still no clear sign that a bottom has formed!
The price is currently testing the support area highlighted in orange between:
📍 $7.63 – $9.498
Technically, though, there’s still no confirmation that a bottom has actually formed.
According to the Elliott Wave scenario, the fifth wave of wave (C) could still extend downward within the same support area before the correction ends.
So, the price simply reaching this area isn’t enough reason to rush into buying.
It’s better to monitor price action and wait for a clear reversal signal before considering this area an entry opportunity.
The price is currently testing the support area highlighted in orange between:
📍 $7.63 – $9.498
Technically, though, there’s still no confirmation that a bottom has actually formed.
According to the Elliott Wave scenario, the fifth wave of wave (C) could still extend downward within the same support area before the correction ends.
So, the price simply reaching this area isn’t enough reason to rush into buying.
It’s better to monitor price action and wait for a clear reversal signal before considering this area an entry opportunity.
1
128
Log in to explore more content
Join global crypto users on Binance Square
⚡️ Get latest and useful information about crypto.
💬 Trusted by the world’s largest crypto exchange.
👍 Discover real insights from verified creators.
Email / Phone number
Trending Topics
NvidiaEarningsTonight:AIStocks’NextMove?
105,596 views
1,206 Discussing
Nvidia Earnings Day: Interim CEO's First Appearance — Can the AI Story Hold?
Binance News
·18 Likes
·8k views
A Packed Week of Earnings and Data Tests Markets
140,153 views
649 Discussing
AnthropicIPOTestsInvestorAppetiteForAI
310,300 views
2,835 Discussing