

普罗米羞
35 Posts

普罗米羞
Report
Block User
Opinions are mine. Markets decide.共识形成前下注,共识形成后离场。
Frequent Trader
5.5 Years
6 Following
2 Followers
4 Liked
Posts
All
Videos
·
--
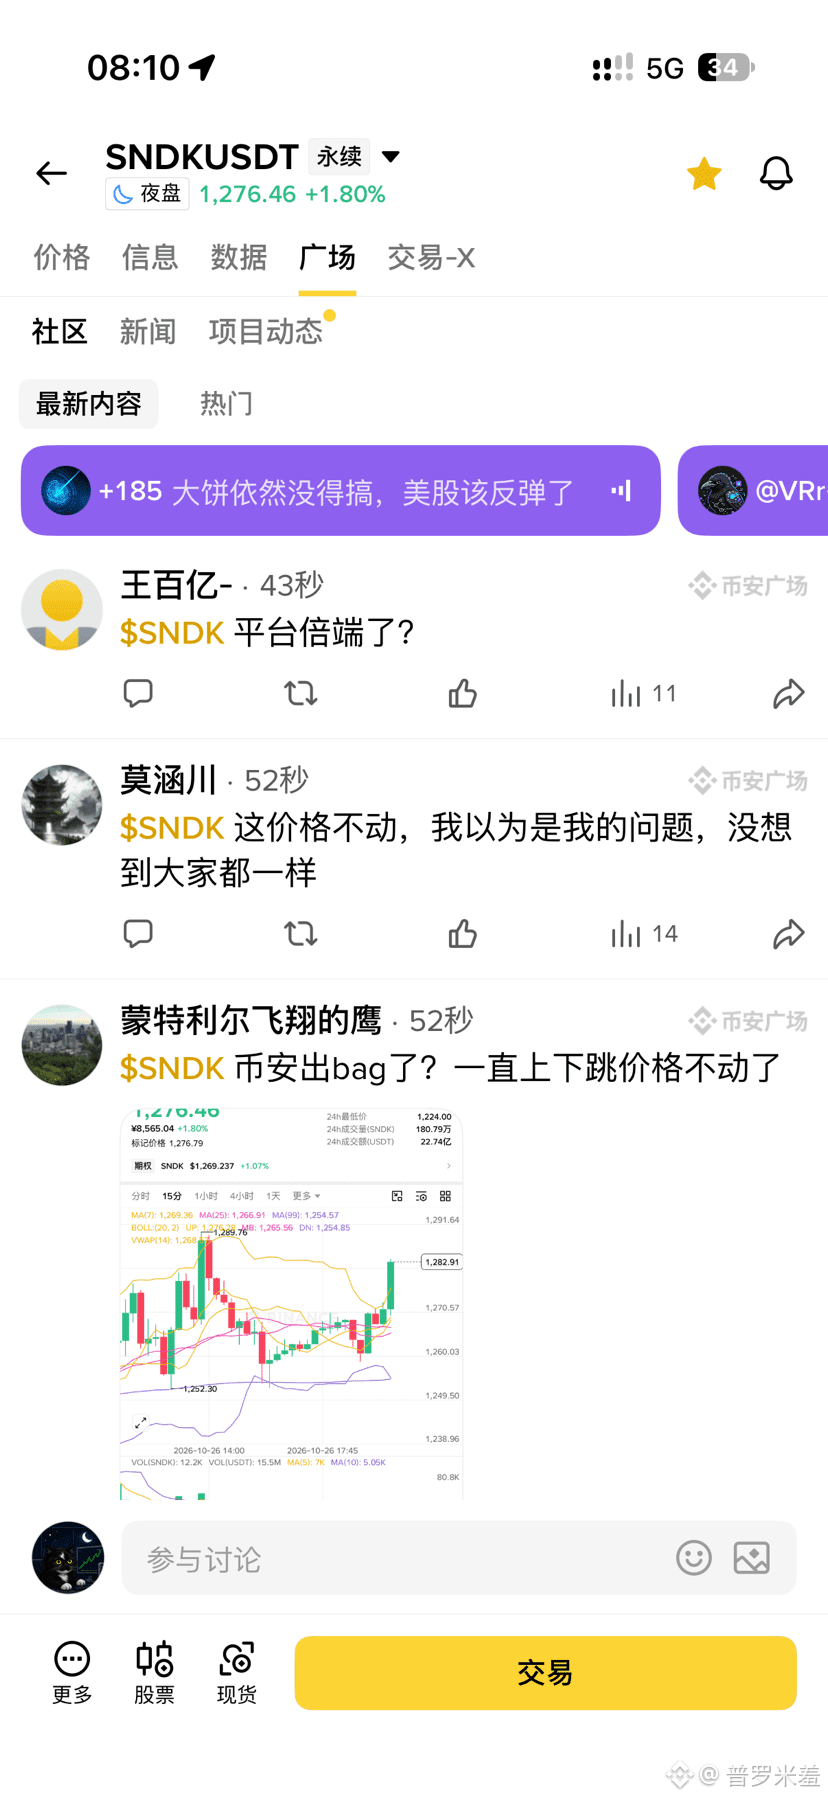
Short sellers, watch out! They’re trapping the shorts on $sndk? Then hurry and push the price up—can’t sell or buy!
Short sellers, watch out! They’re trapping the shorts on $sndk? Then hurry and push the price up—can’t sell or buy!
90
·
--
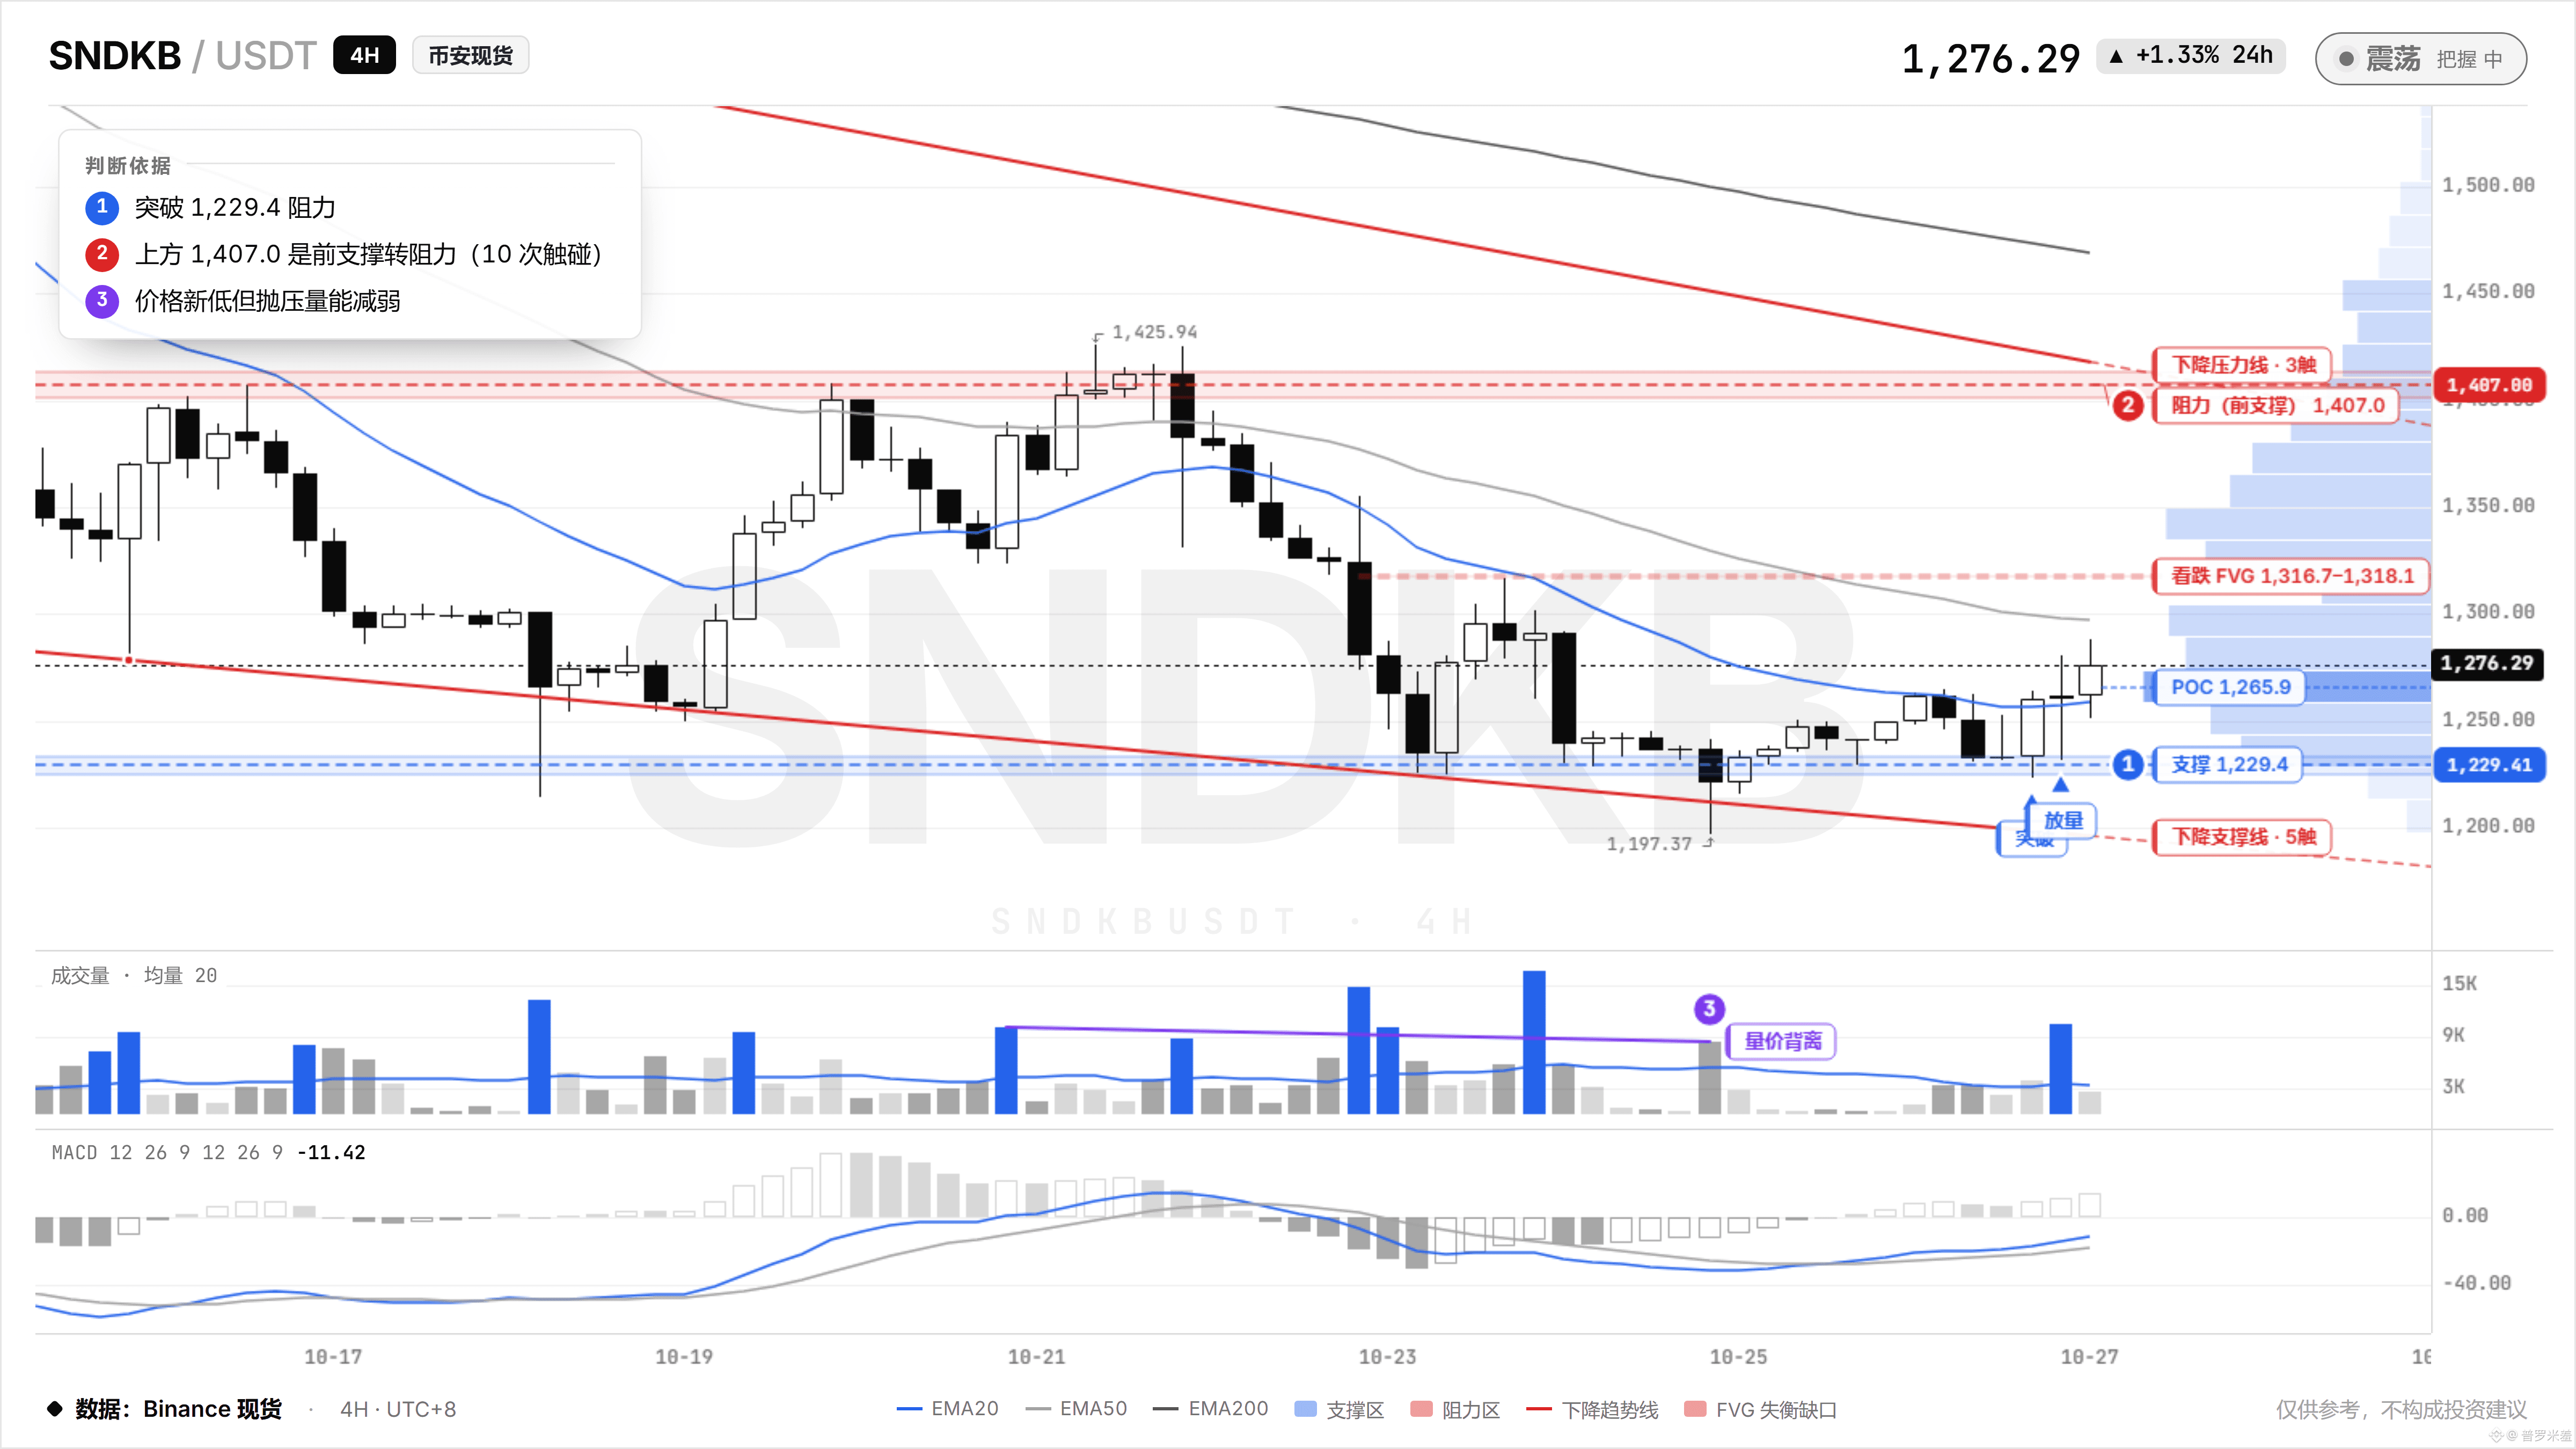
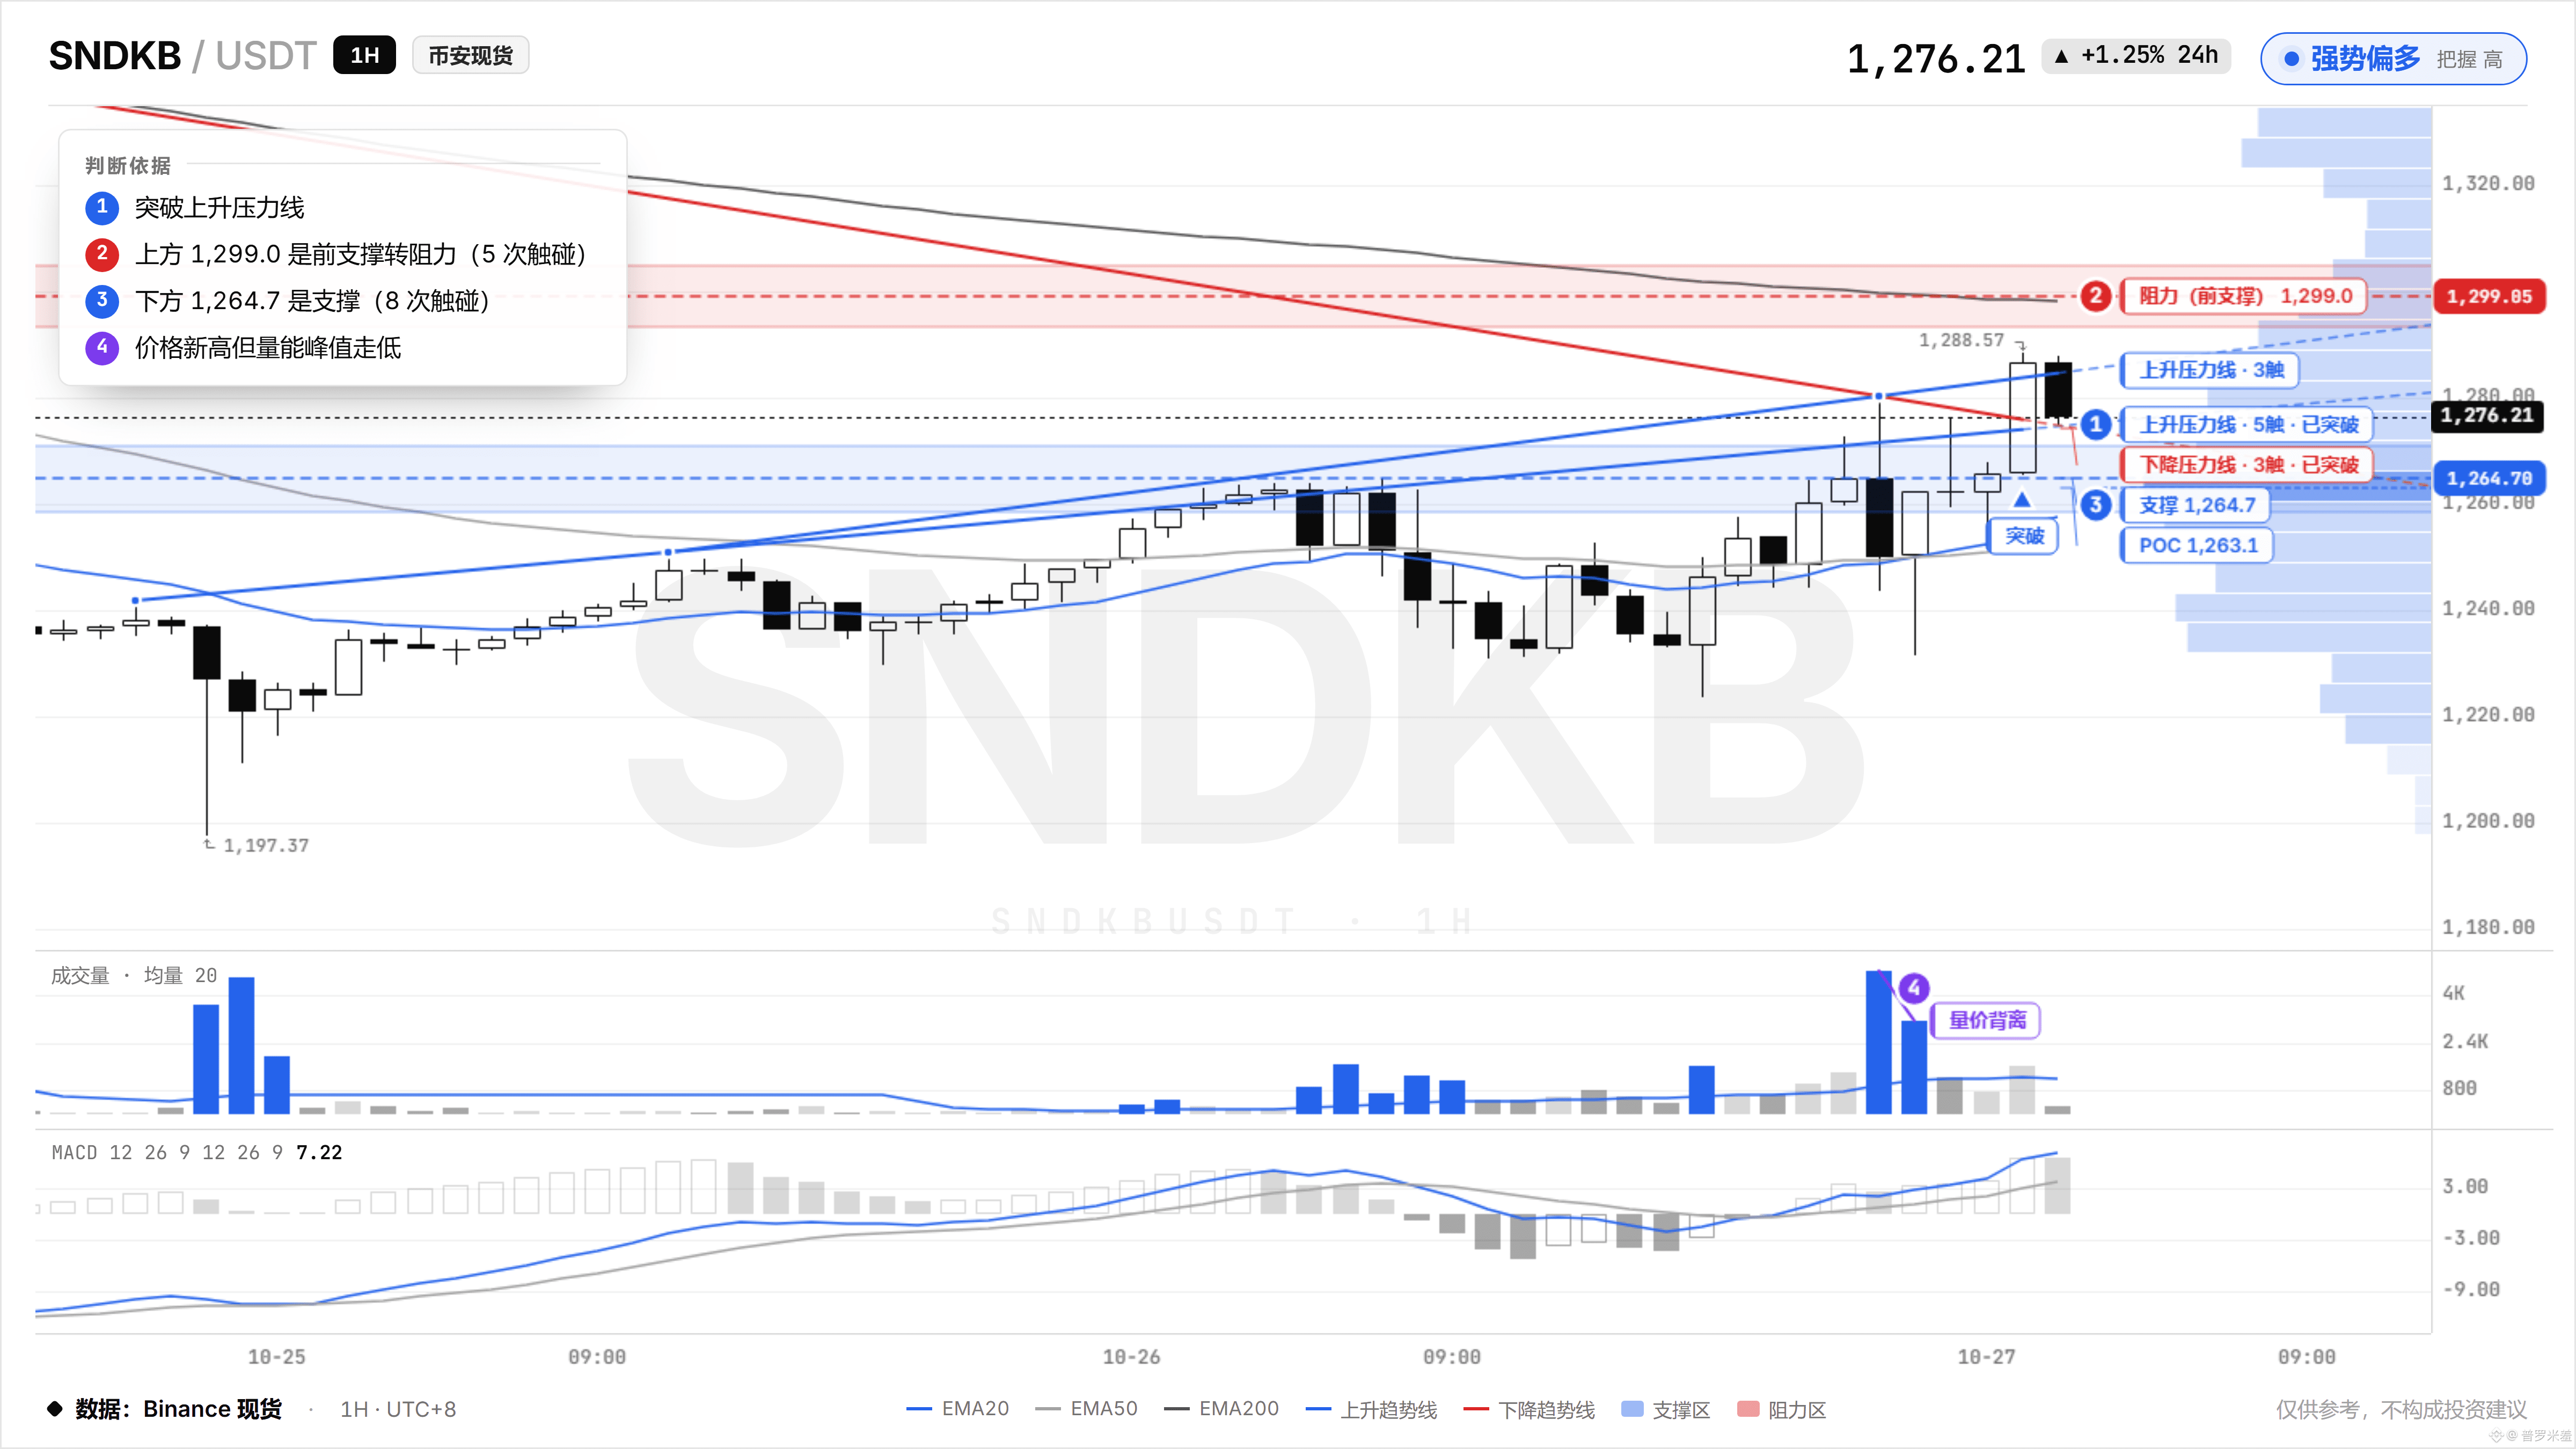
After the price made a new low, sellers couldn’t push it down any further. Selling pressure eased each time, then a candle on 3x volume reclaimed the 1229 level. At this point, I really want to go all-in on $SNDK—I’ve already got my eye on the 1407 area. Fake breakouts in small caps have fooled me several times, but the volume is real this time, so I’m siding with the bulls for now.
After the price made a new low, sellers couldn’t push it down any further. Selling pressure eased each time, then a candle on 3x volume reclaimed the 1229 level. At this point, I really want to go all-in on $SNDK —I’ve already got my eye on the 1407 area. Fake breakouts in small caps have fooled me several times, but the volume is real this time, so I’m siding with the bulls for now.
522
·
--
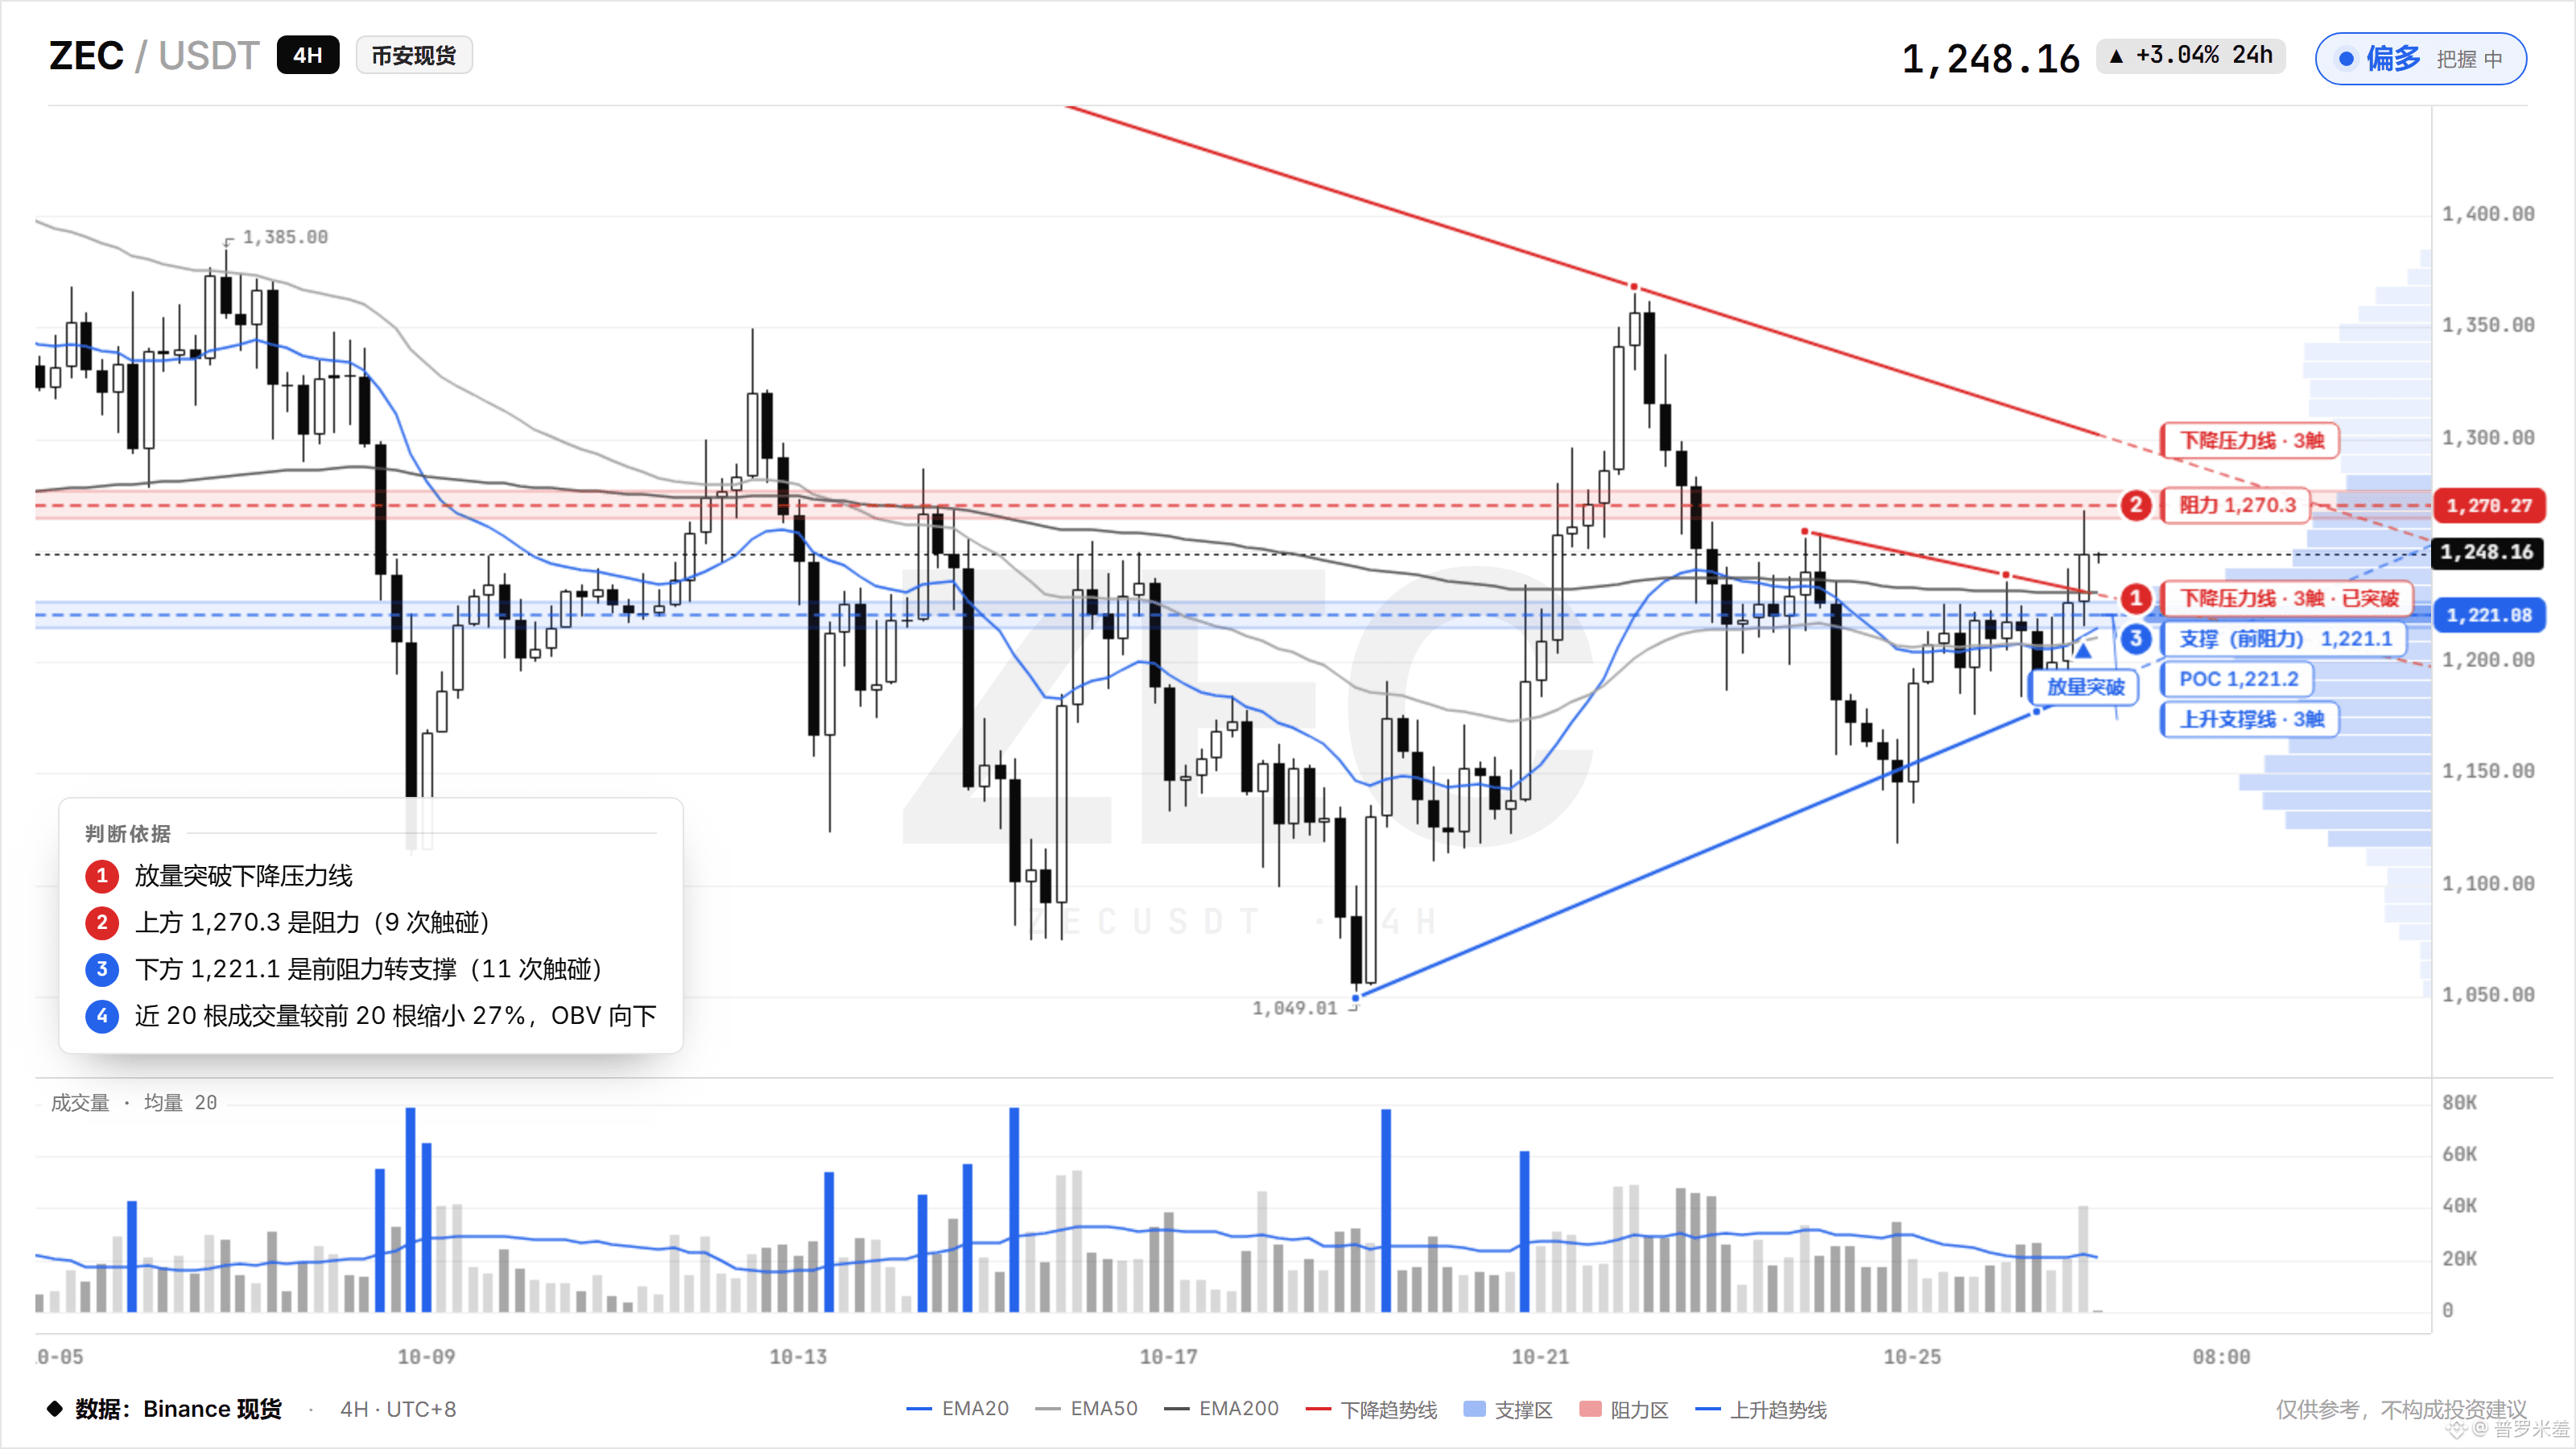
ZEC has been grinding under that descending resistance line for so long, and today it finally gave us a break. This wasn’t just a quick touch and retreat: it closed above the line, volume came in at nearly twice the average, and it held steady on the retest at 1221. Now that’s a breakout.
That line at 1270 has been tested nine times. It looks like a tough hurdle. But whether it can get through depends on whether there’s support underneath. This time it broke through first, then retested—it didn’t just touch the line and turn back. Honestly, I’m not worried at this level.
If those damn market makers really dump it back below 1231 tomorrow, fine, I’ll admit I was wrong. But nobody can pretend they didn’t see today’s bullish candle.
$ZEC
2
1
412
·
--
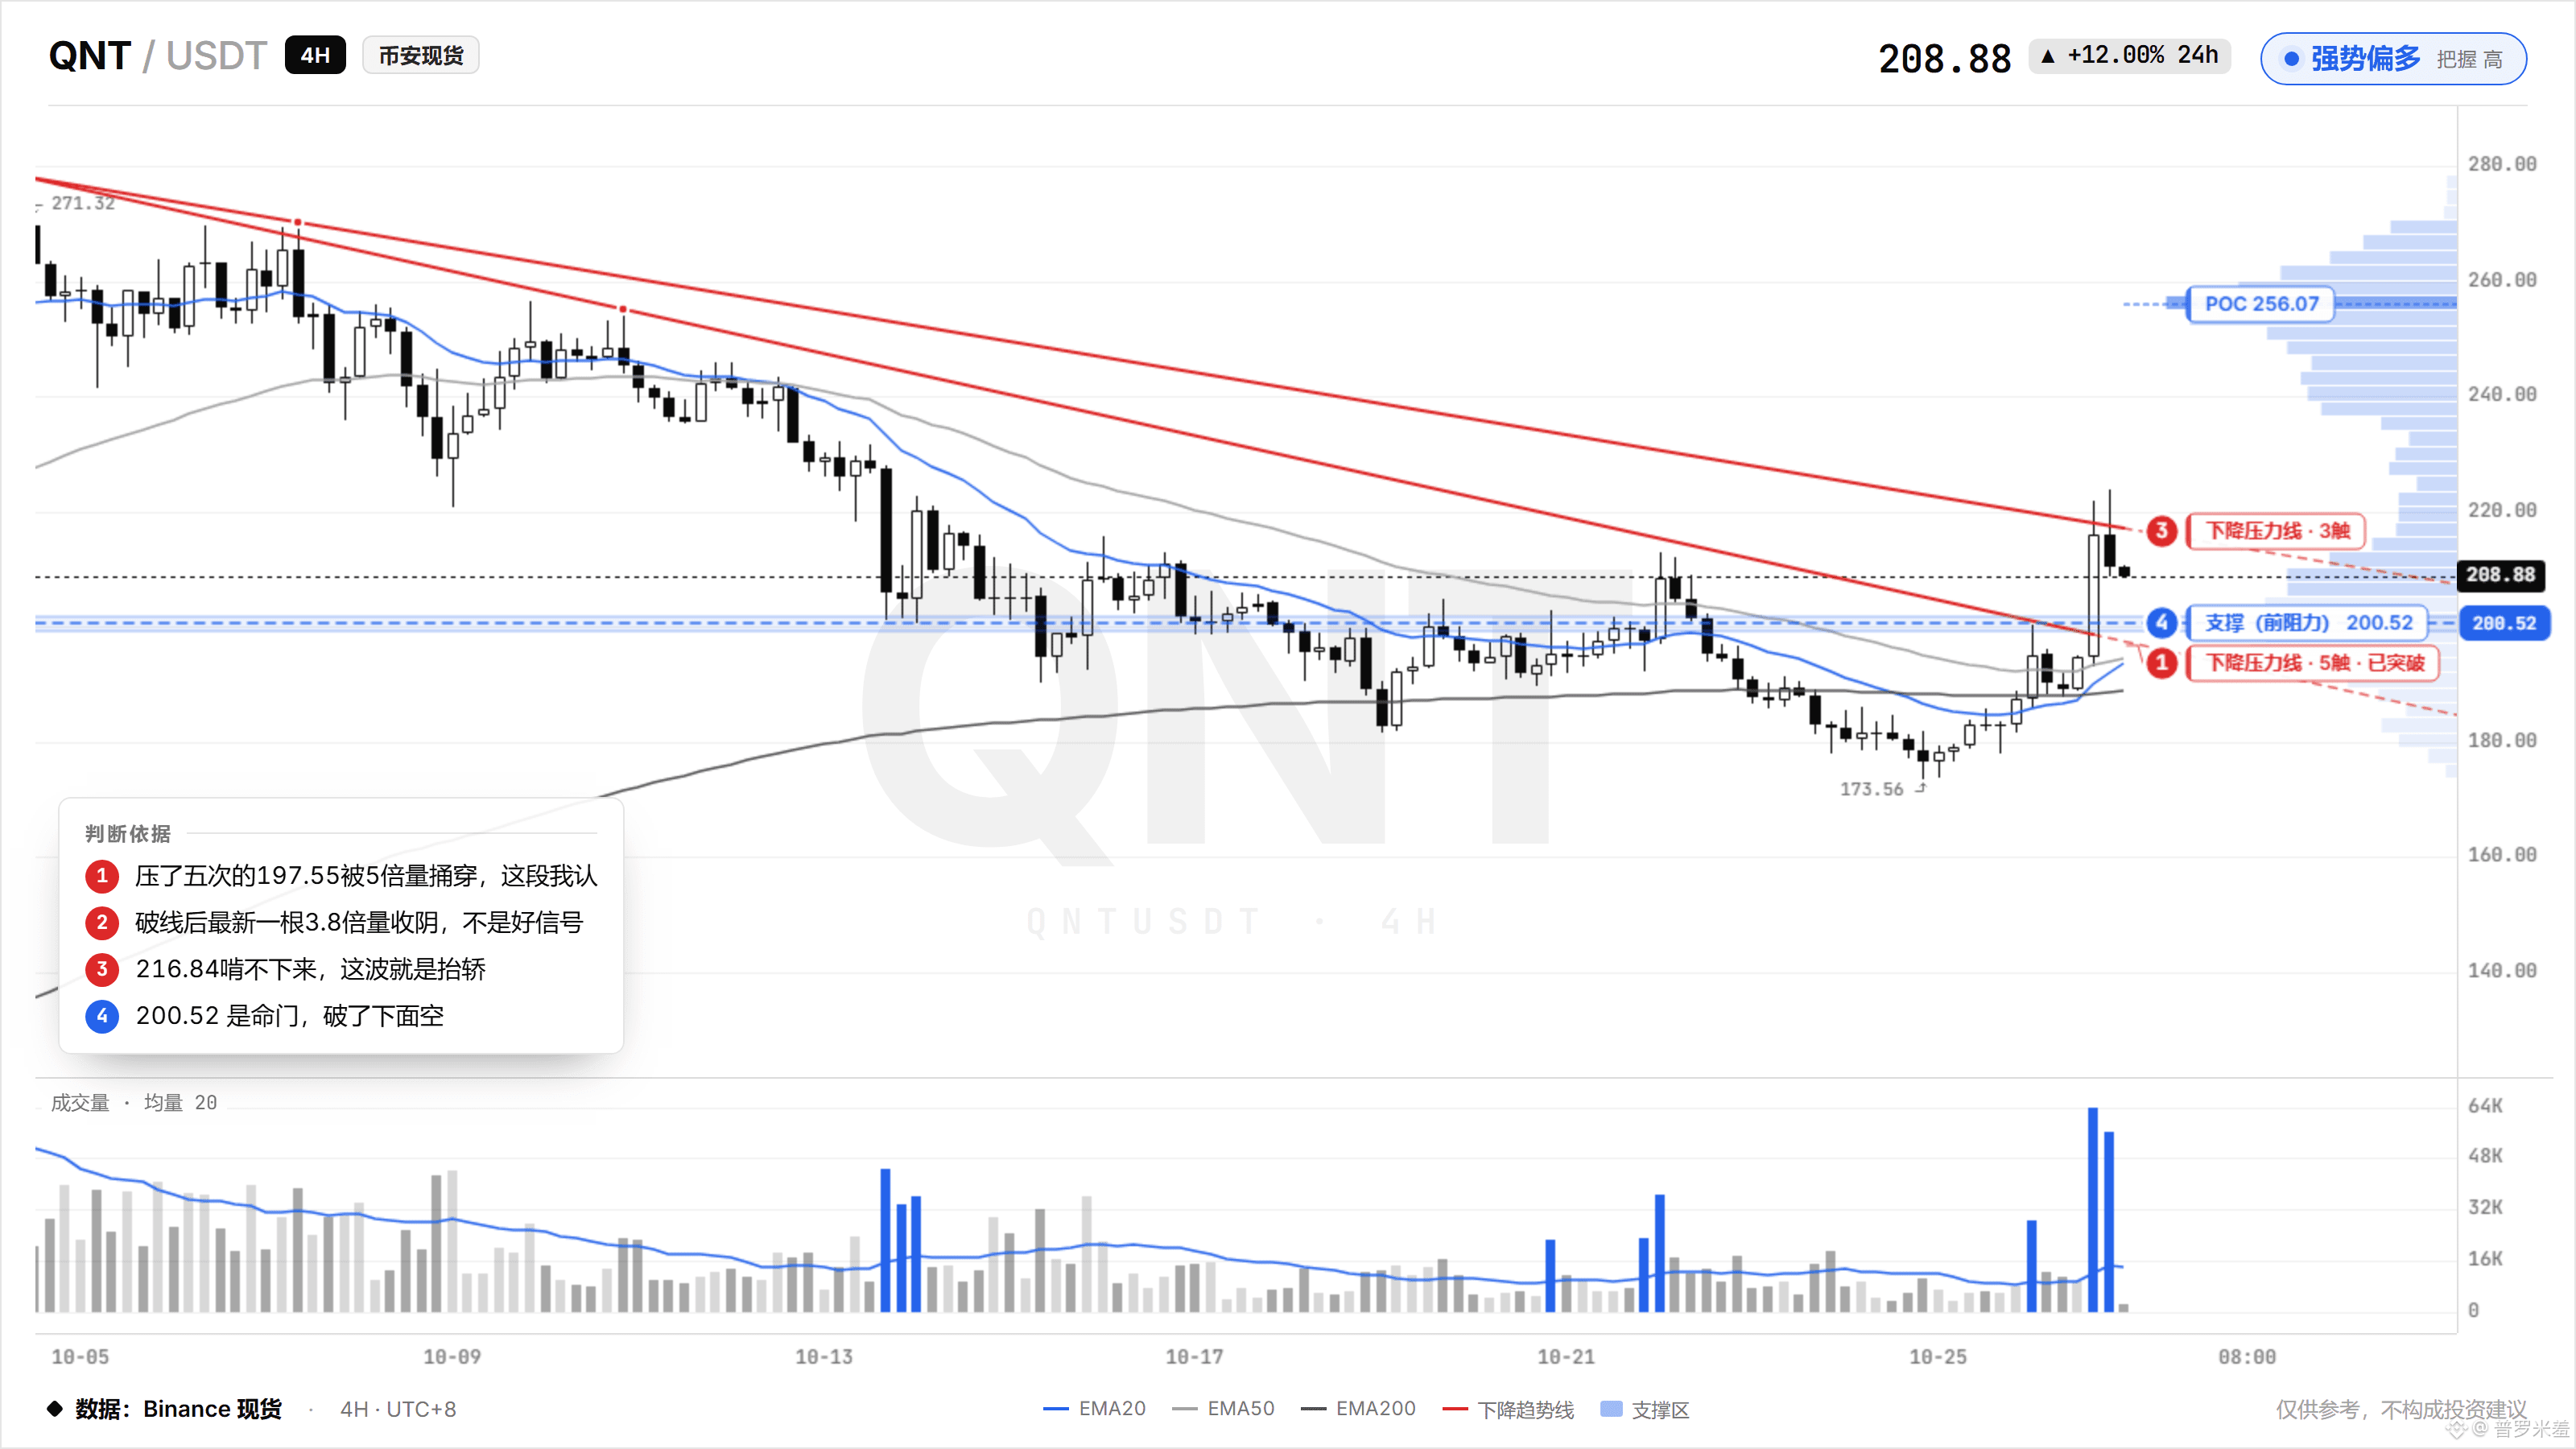
$QNT Yesterday, nobody was talking about it. Today, it’s #4 on CoinGecko’s trending searches, #5 among top gainers at +11.8%, and its trading volume has pushed it to #9. Hype moves faster than the market.
That 197.55 level held it back five times before getting punched through on 5x volume. I’ll give it this: someone was genuinely buying in size.
But on the latest candle after the breakout, volume was only 3.8x, and it closed red. Price made a new high, but volume didn’t follow—that’s being lifted up, not bought up.
Once it hits trending, the promotional banners go up. If it can’t get past 216.84, it’s just carrying the people lying in wait below 200.52. #BinancePick
206
·
--
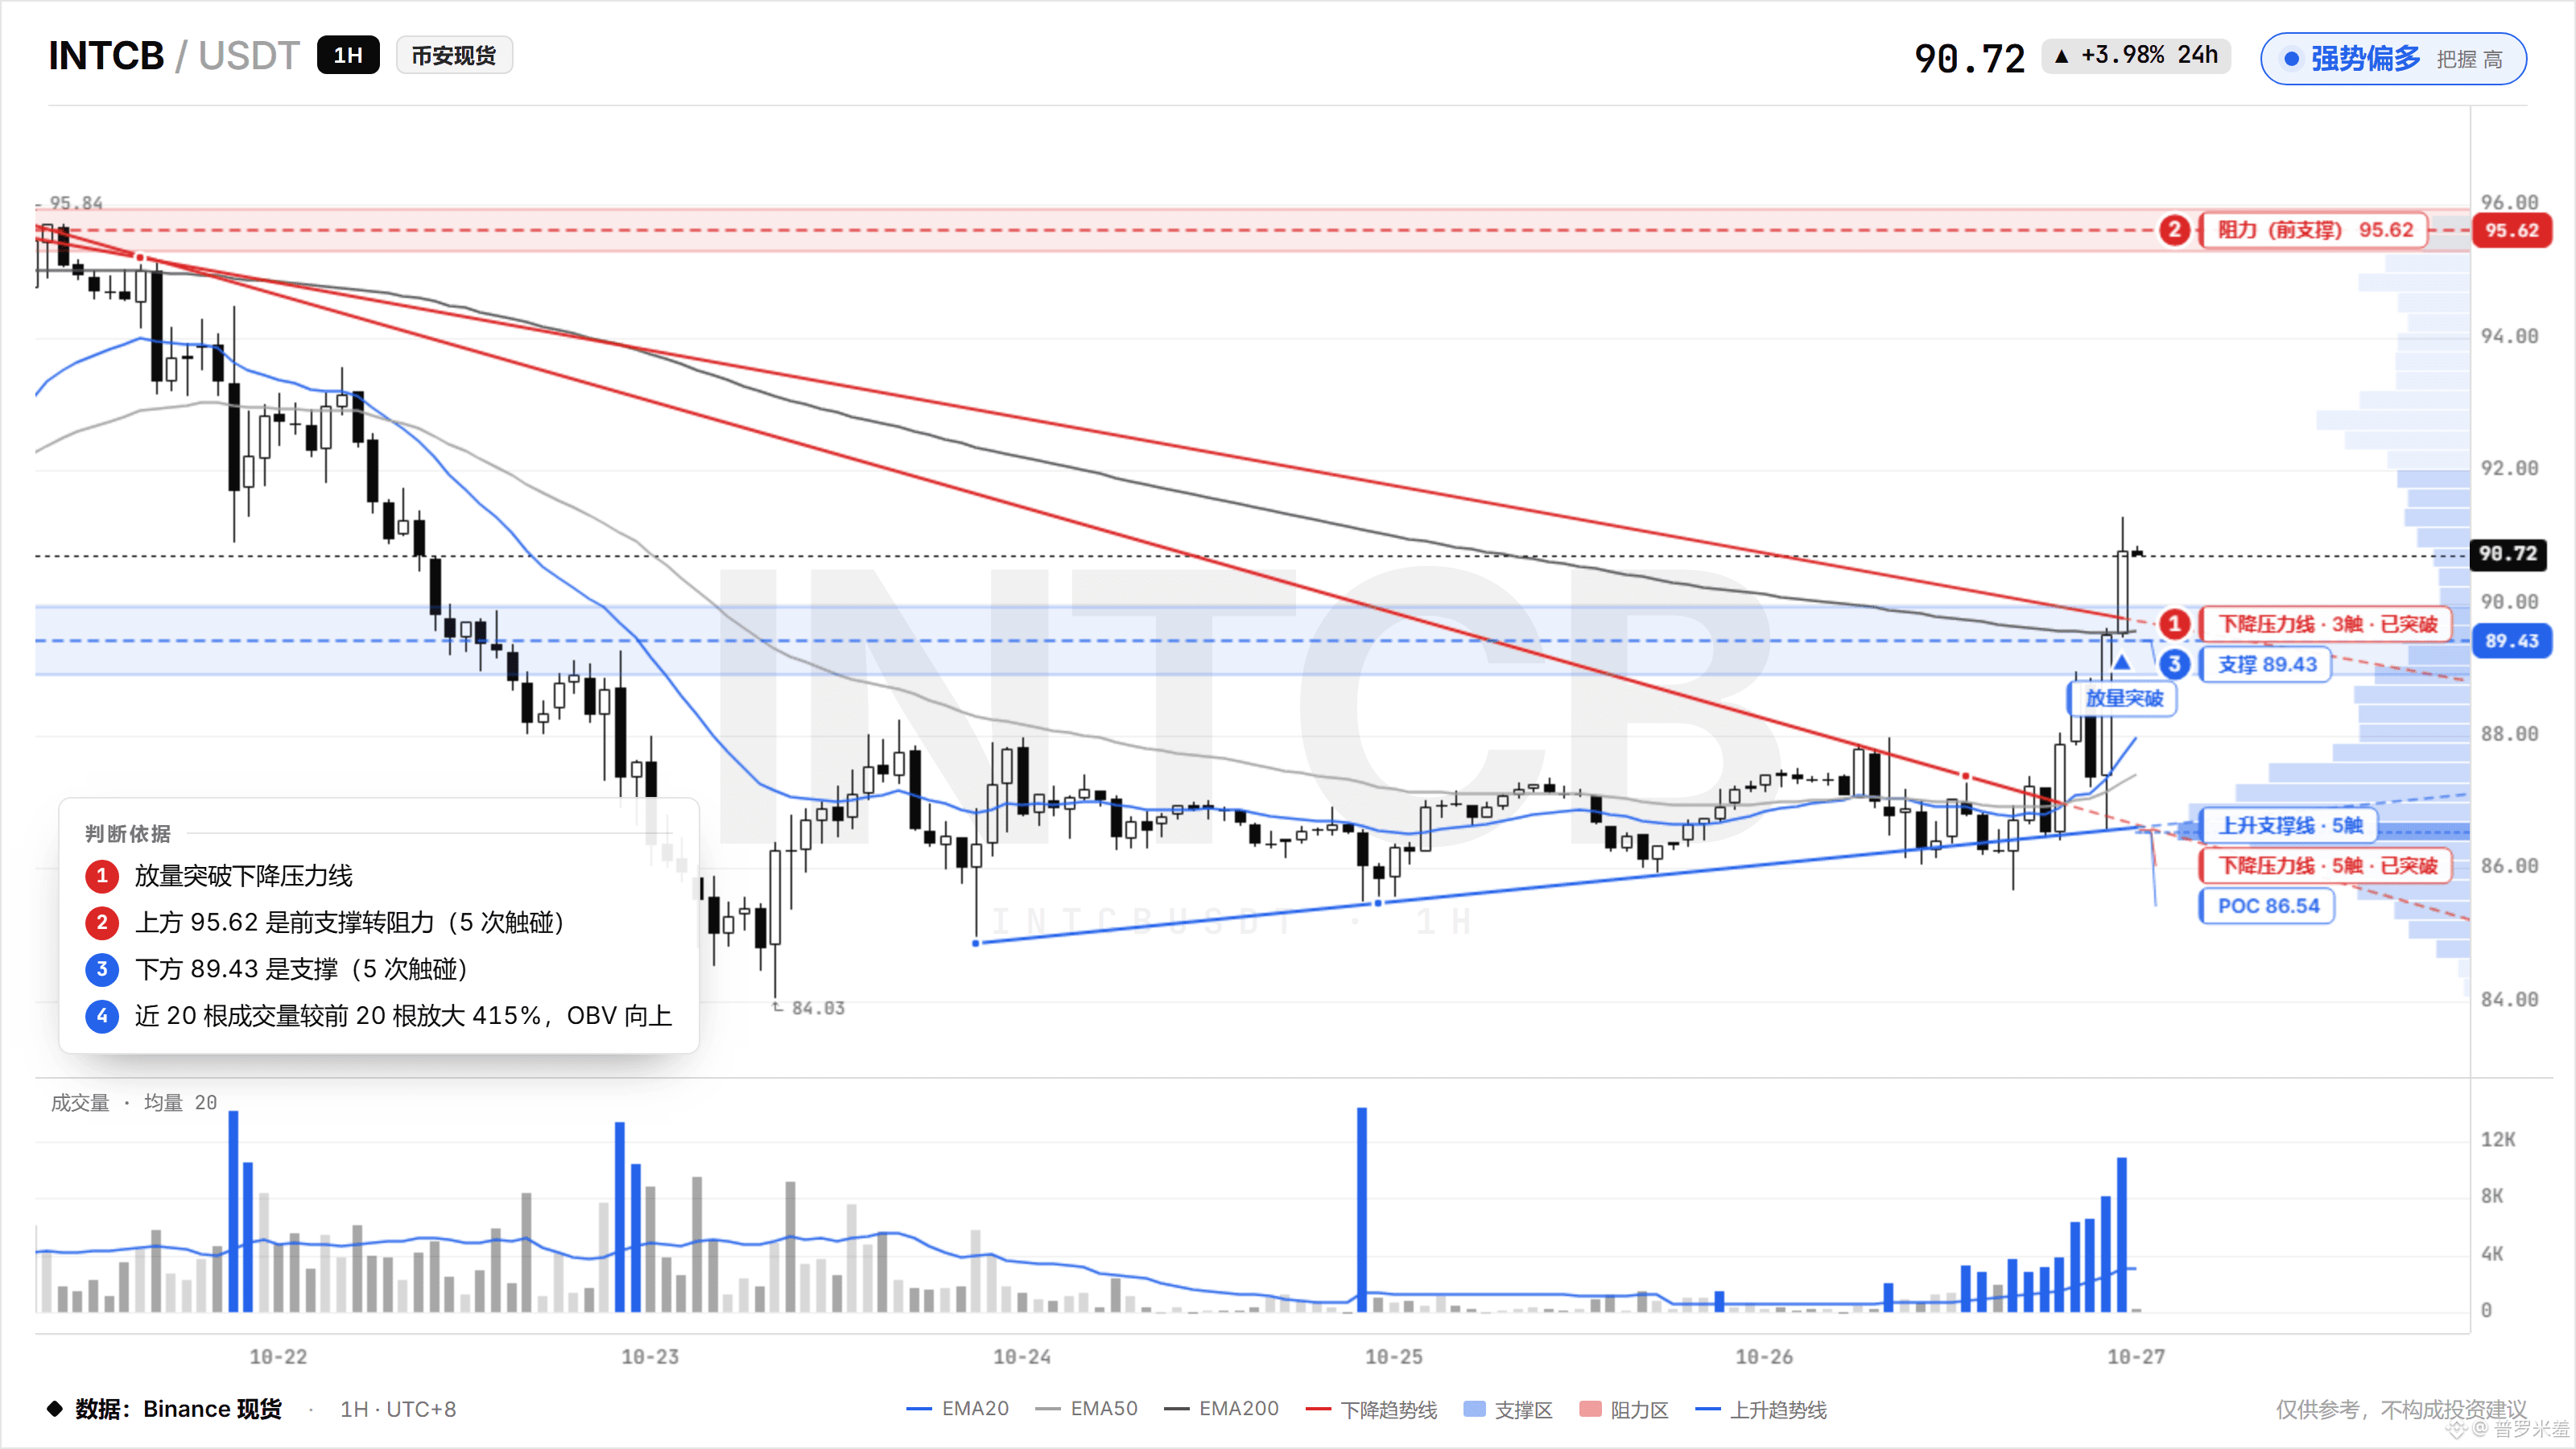
That level capped it three times. On the fourth try, it punched straight through on 3.5x volume—and even closed above it. This wasn’t a fakeout.
It didn’t dip back below around 86.7 on the retest, which tells you the buyers underneath are still there. If they stick around, it’s support; if they leave, it’s just a memory.
95.6 has been tested five times. That’s where the real fight is. $INTC
It didn’t dip back below around 86.7 on the retest, which tells you the buyers underneath are still there. If they stick around, it’s support; if they leave, it’s just a memory.
95.6 has been tested five times. That’s where the real fight is. $INTC
372
·
--
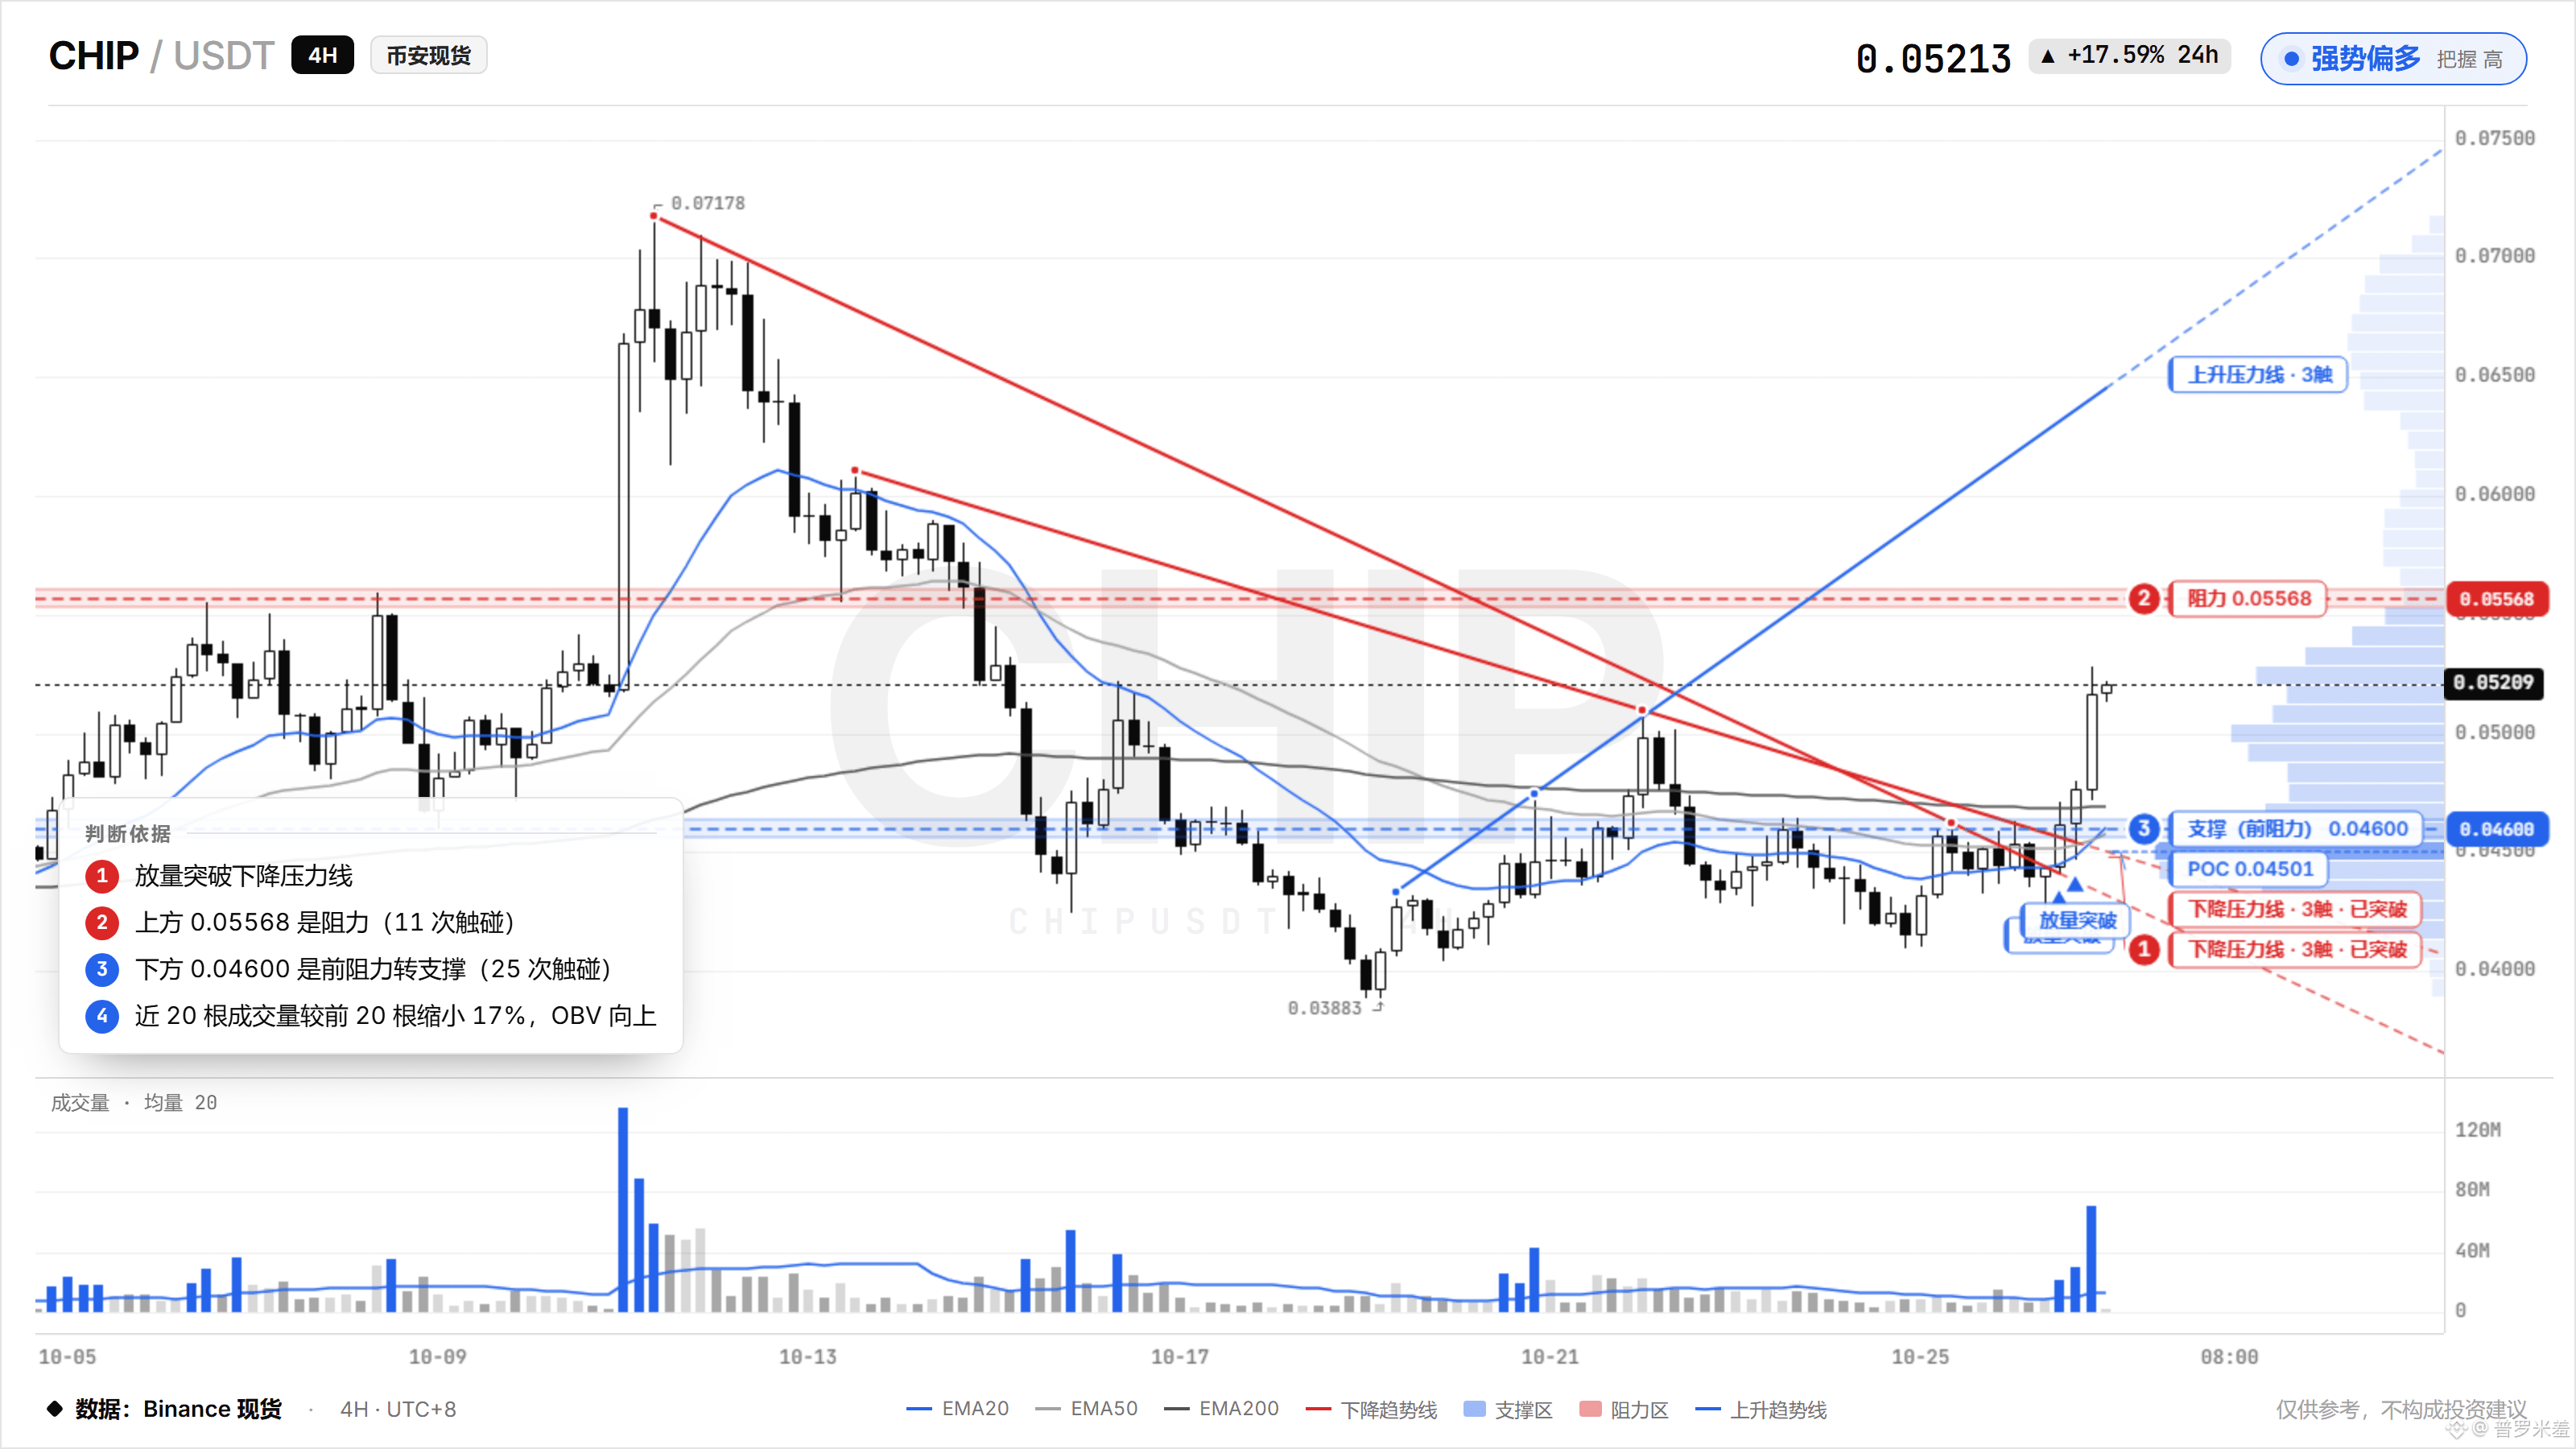
A close above 0.05098 would turn the swing structure bullish. The people calling it a dead coin the other day probably hadn't even opened the chart.
It got slammed down more than twenty times around 0.046, and buyers scooped it all back up. It’d be strange if that level broke. There’s still one resistance overhead at 0.05568—it’s tested it eleven times without breaking through. This time, I think it’s going up.
$CHIP
It got slammed down more than twenty times around 0.046, and buyers scooped it all back up. It’d be strange if that level broke. There’s still one resistance overhead at 0.05568—it’s tested it eleven times without breaking through. This time, I think it’s going up.
$CHIP
116
·
--
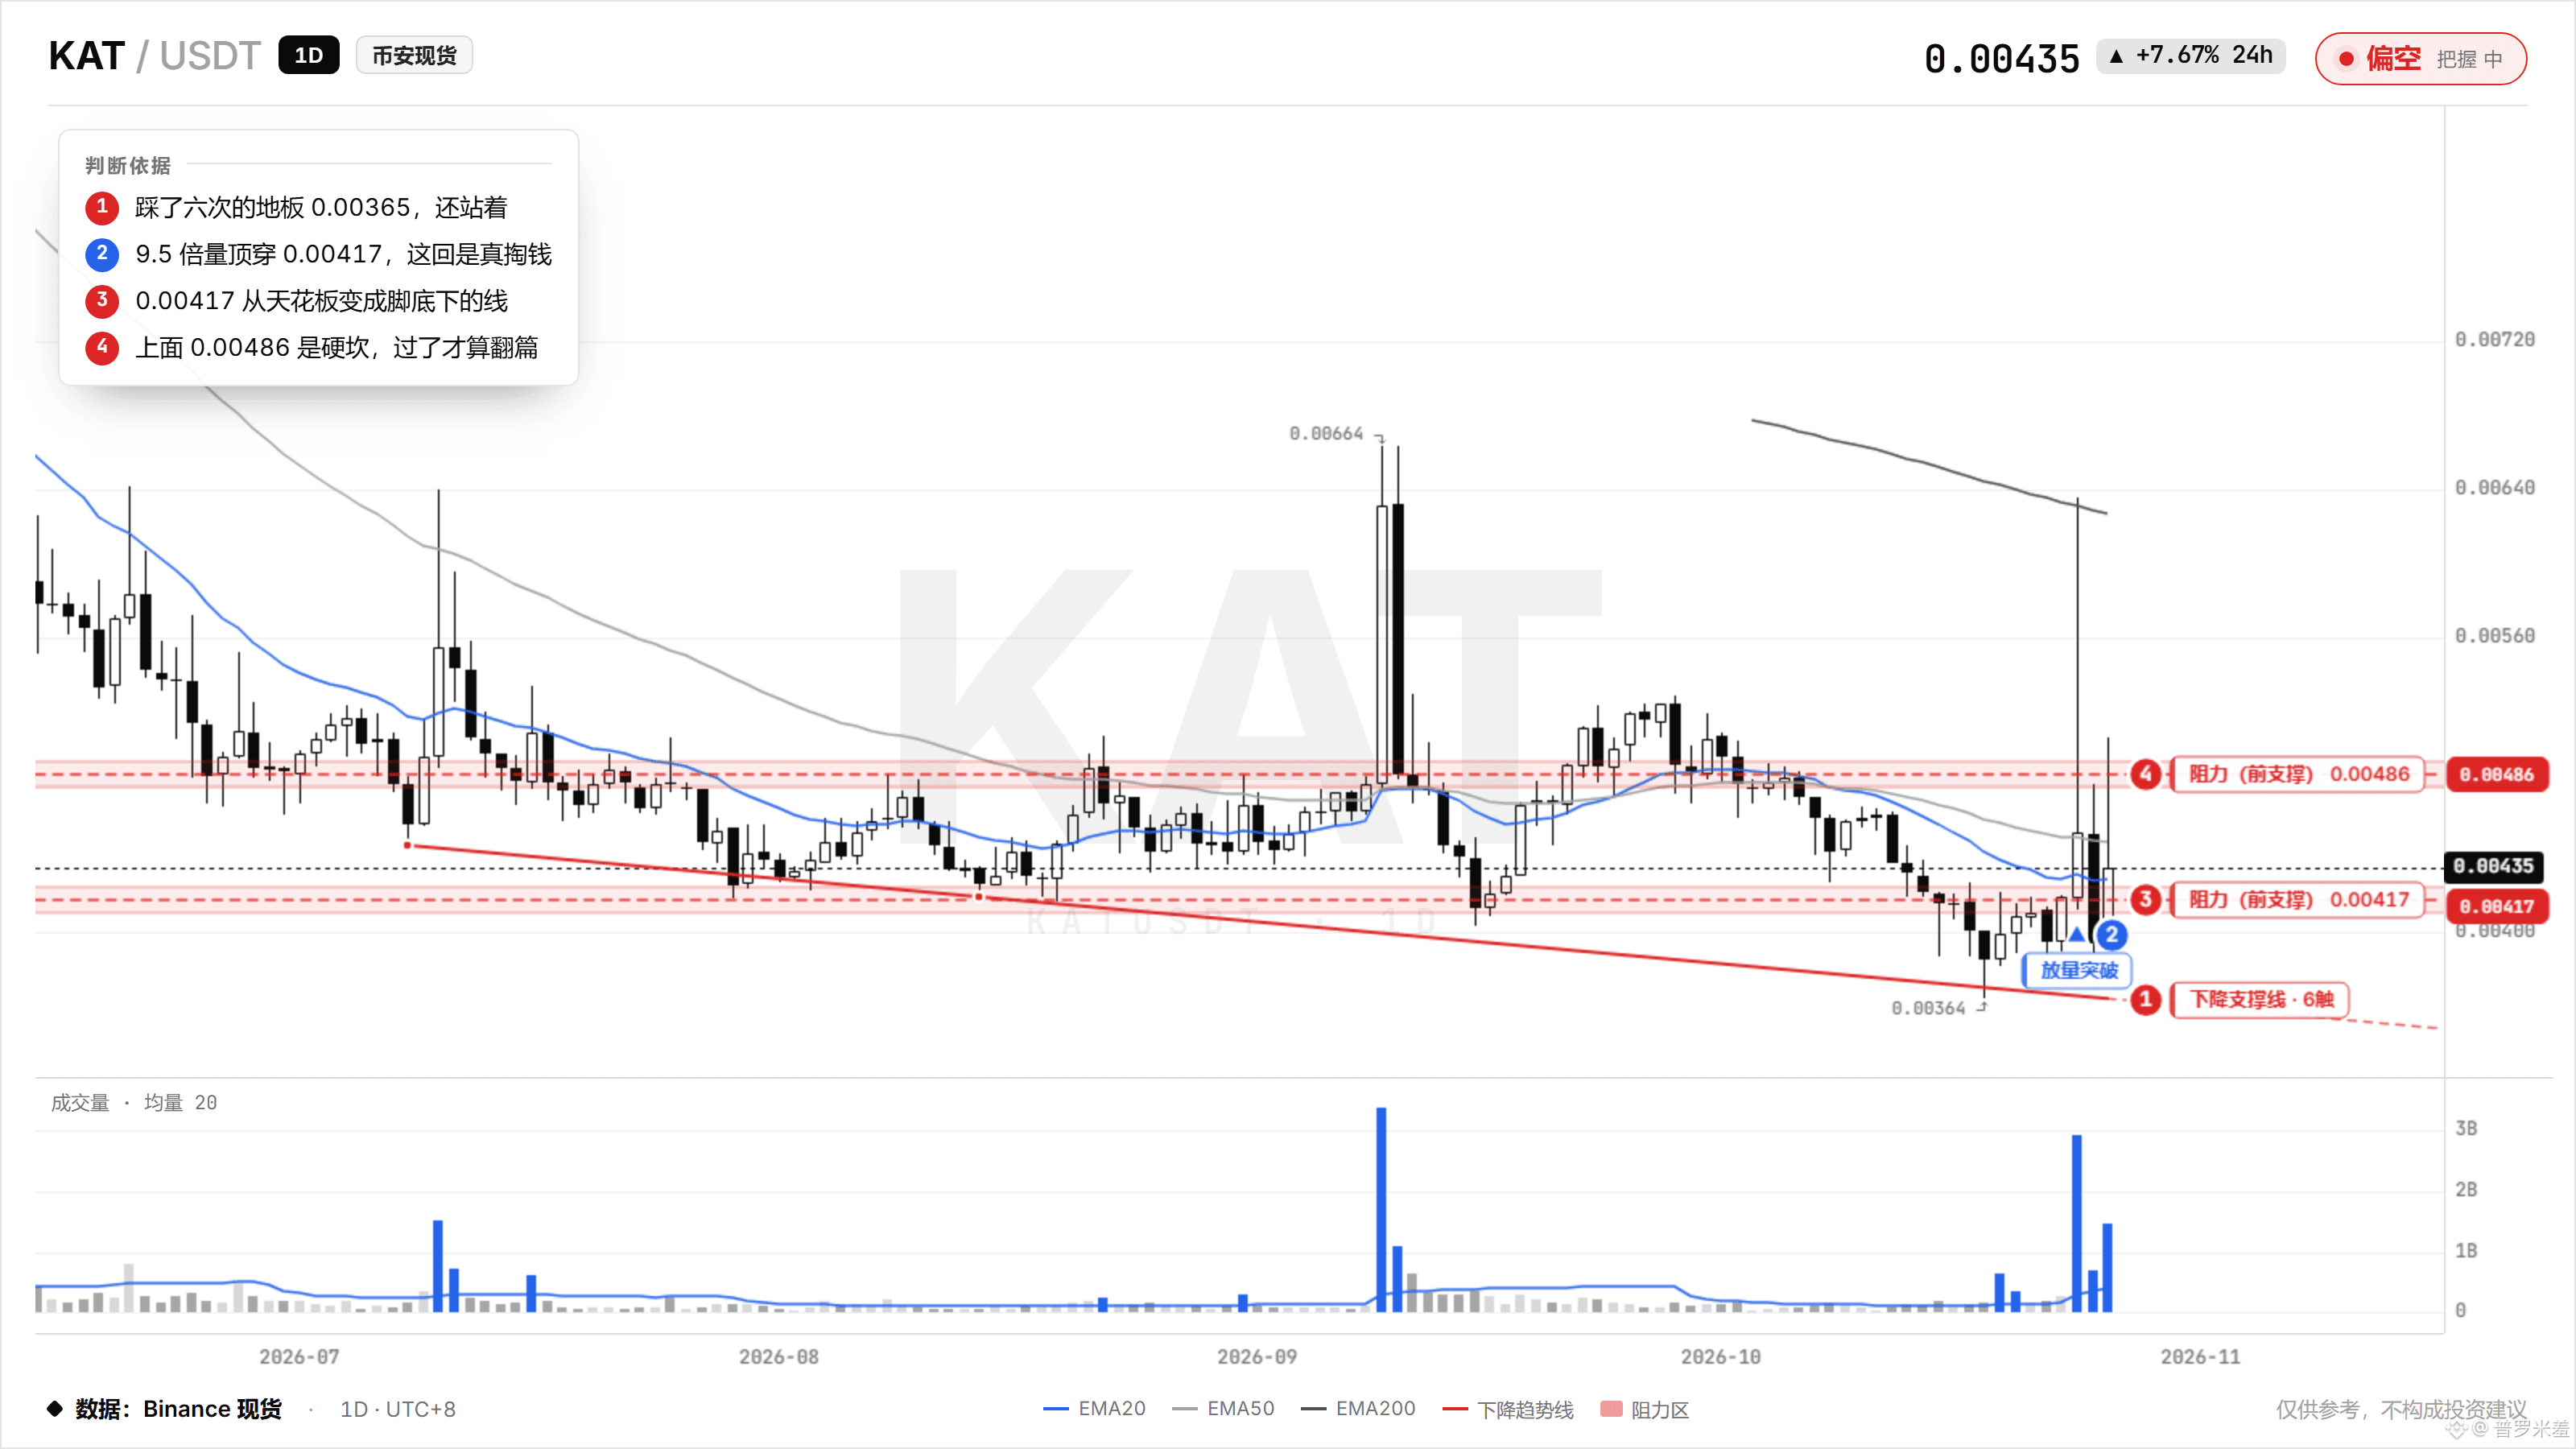
$KAT is down 86% from its peak. I’ve held on this long, but I can barely be bothered to open the app anymore. I get it—looking at the chart at this point is just masochism.
But the chart’s telling us something: it’s touched 0.00365 six times without breaking below it. This week, volume hit 9.5 times normal and pushed it past 0.00417, and the price is still holding above that level. This kind of volume is nothing like those fake moves from the past couple of days—someone actually put money in.
0.00486 is a tough ceiling. If it can’t break through, it’ll keep grinding, so don’t mistake a rebound for a comeback.
Guess I’m stuck holding for now. I’m keeping an eye on this level; if it breaks, I’ll let you know first.
138
·
--
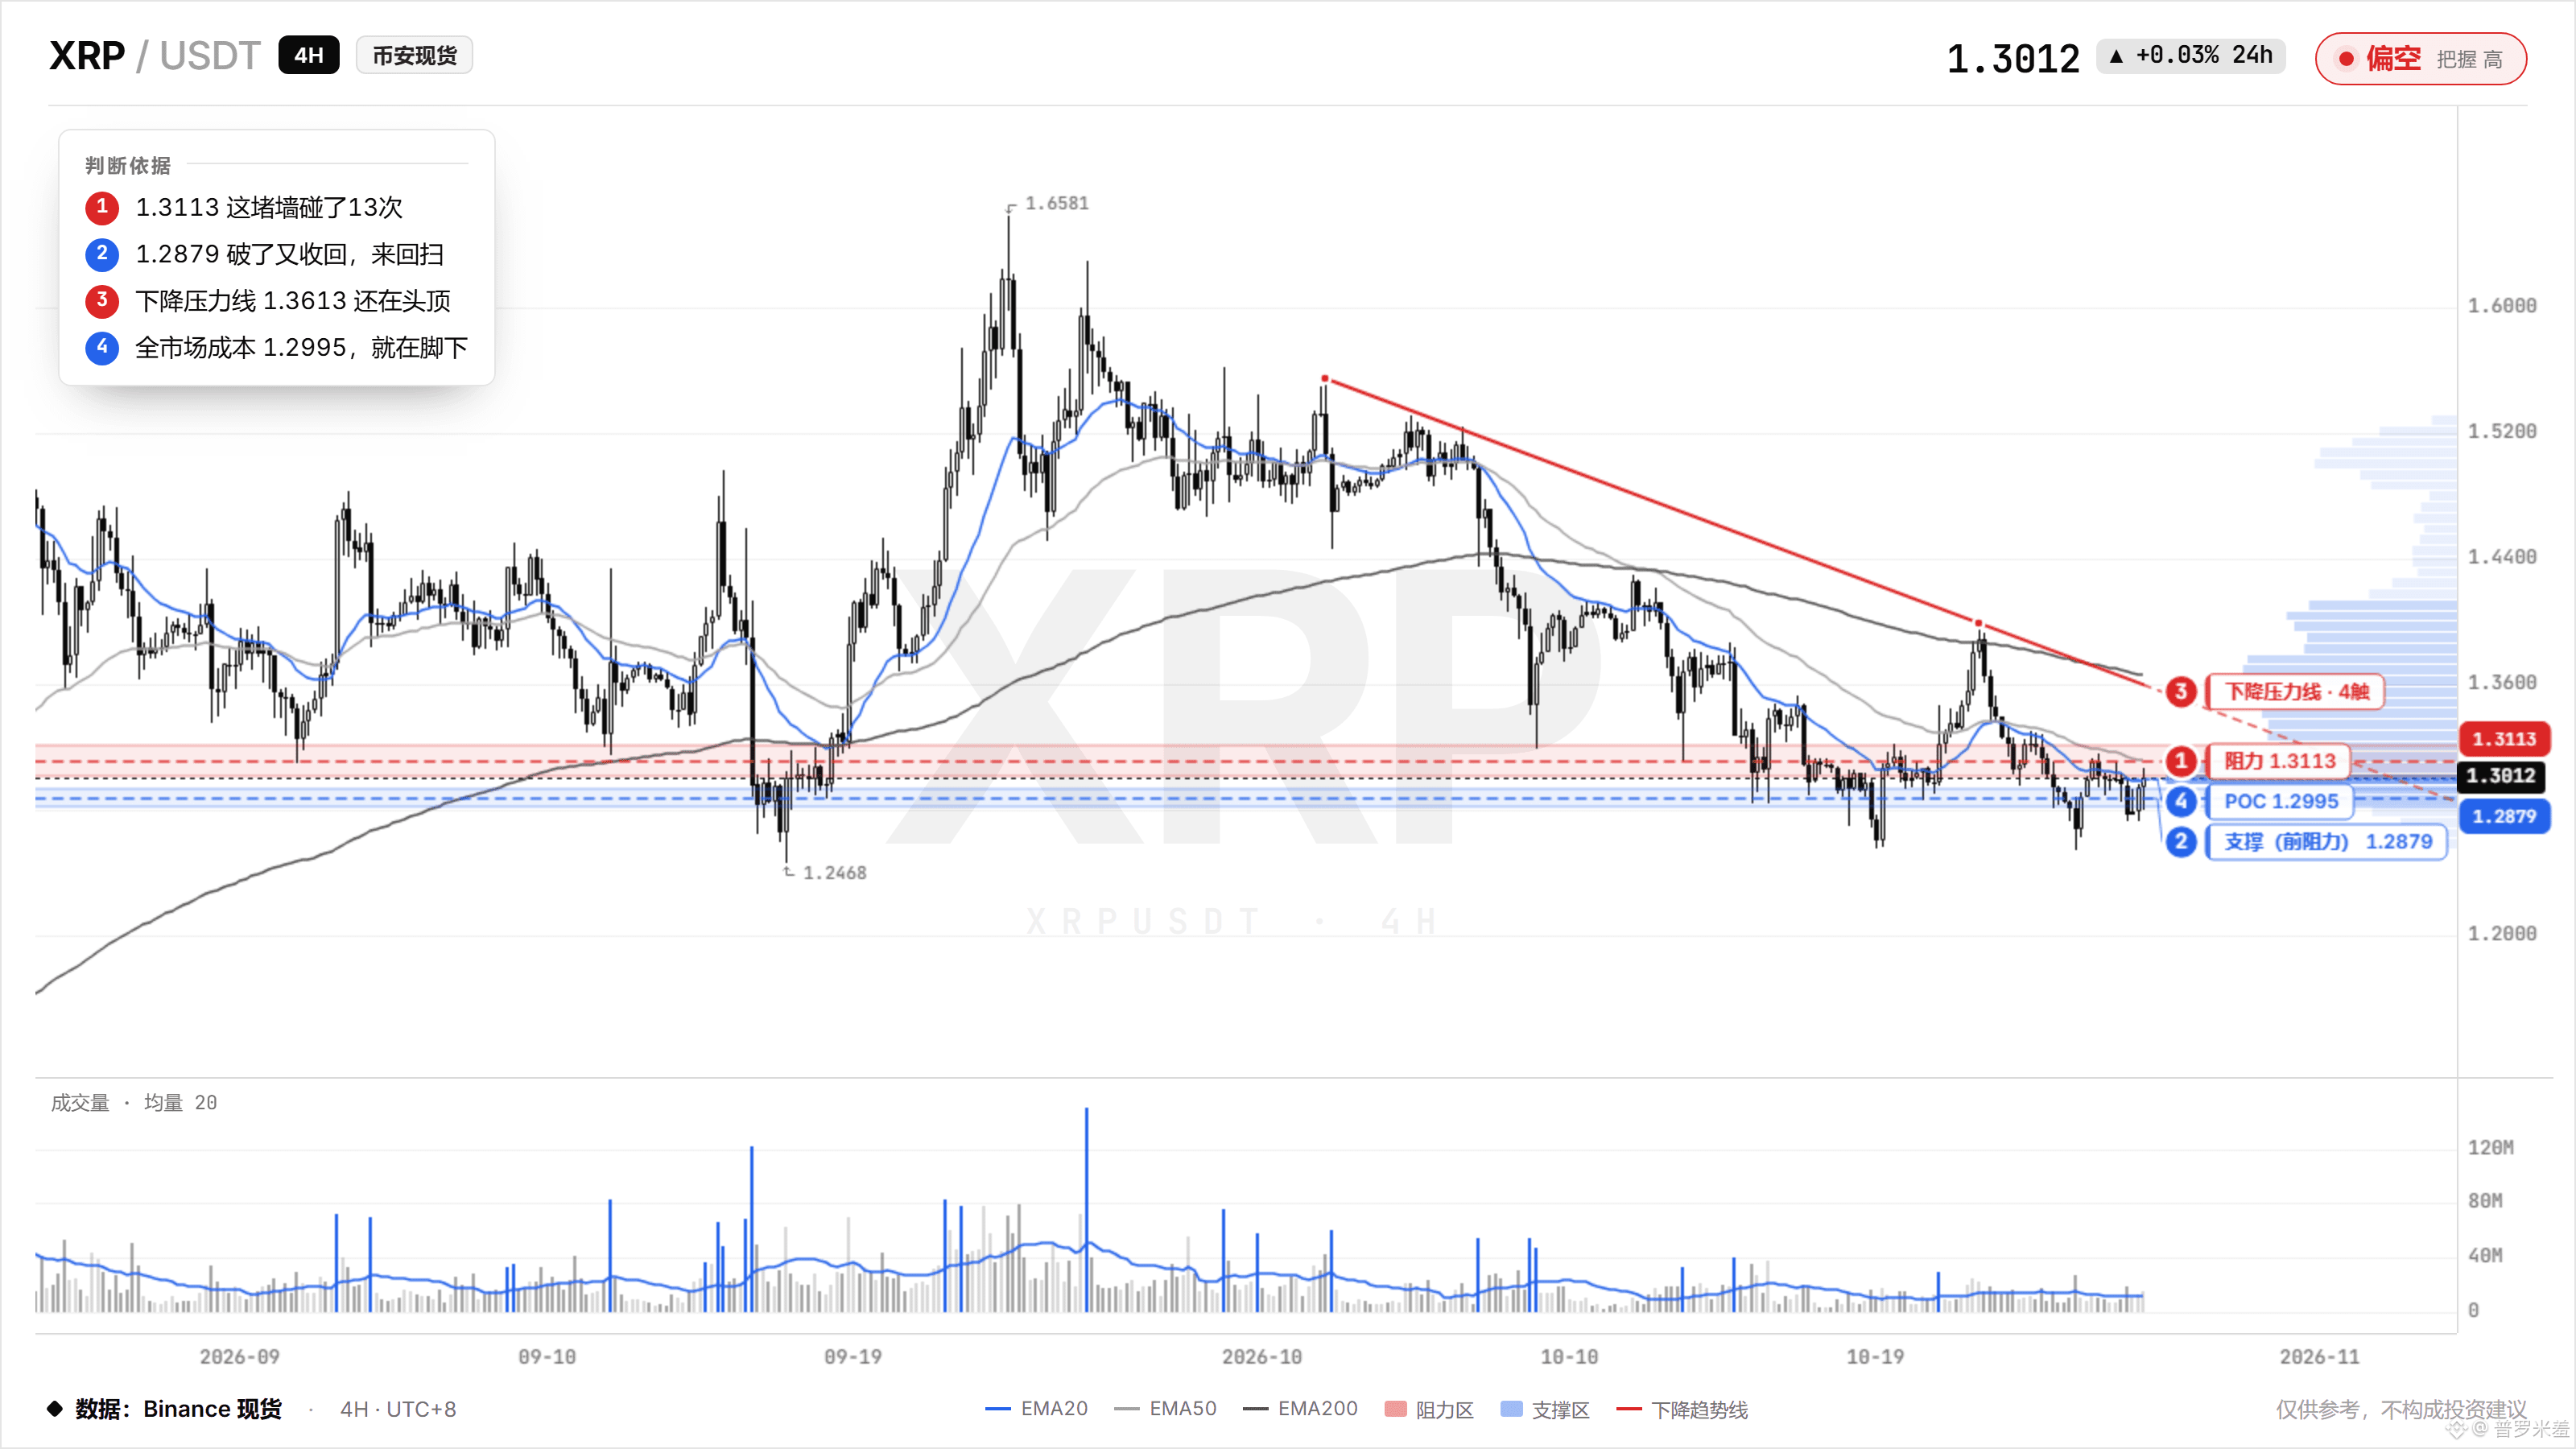
$XRP back to 1.30. Back? It never left.
That wall at 1.3113 above has been hit 13 times, and 1.2995 below is the whole market’s cost basis. A bunch of people have only just broken even, and sell orders are stacked right at this level. Nobody’s willing to pull theirs first.
We’ve been telling the Swell story for years. Every year, someone asks me if it can get above 1.3. Before the move came, I believed in it more than anyone. Once it arrived, I sat in front of the screen, waiting for it to turn those 13 touches into 20.
Don’t call it a comeback. It’s stuck at the cost basis, unable to move.
79
·
--
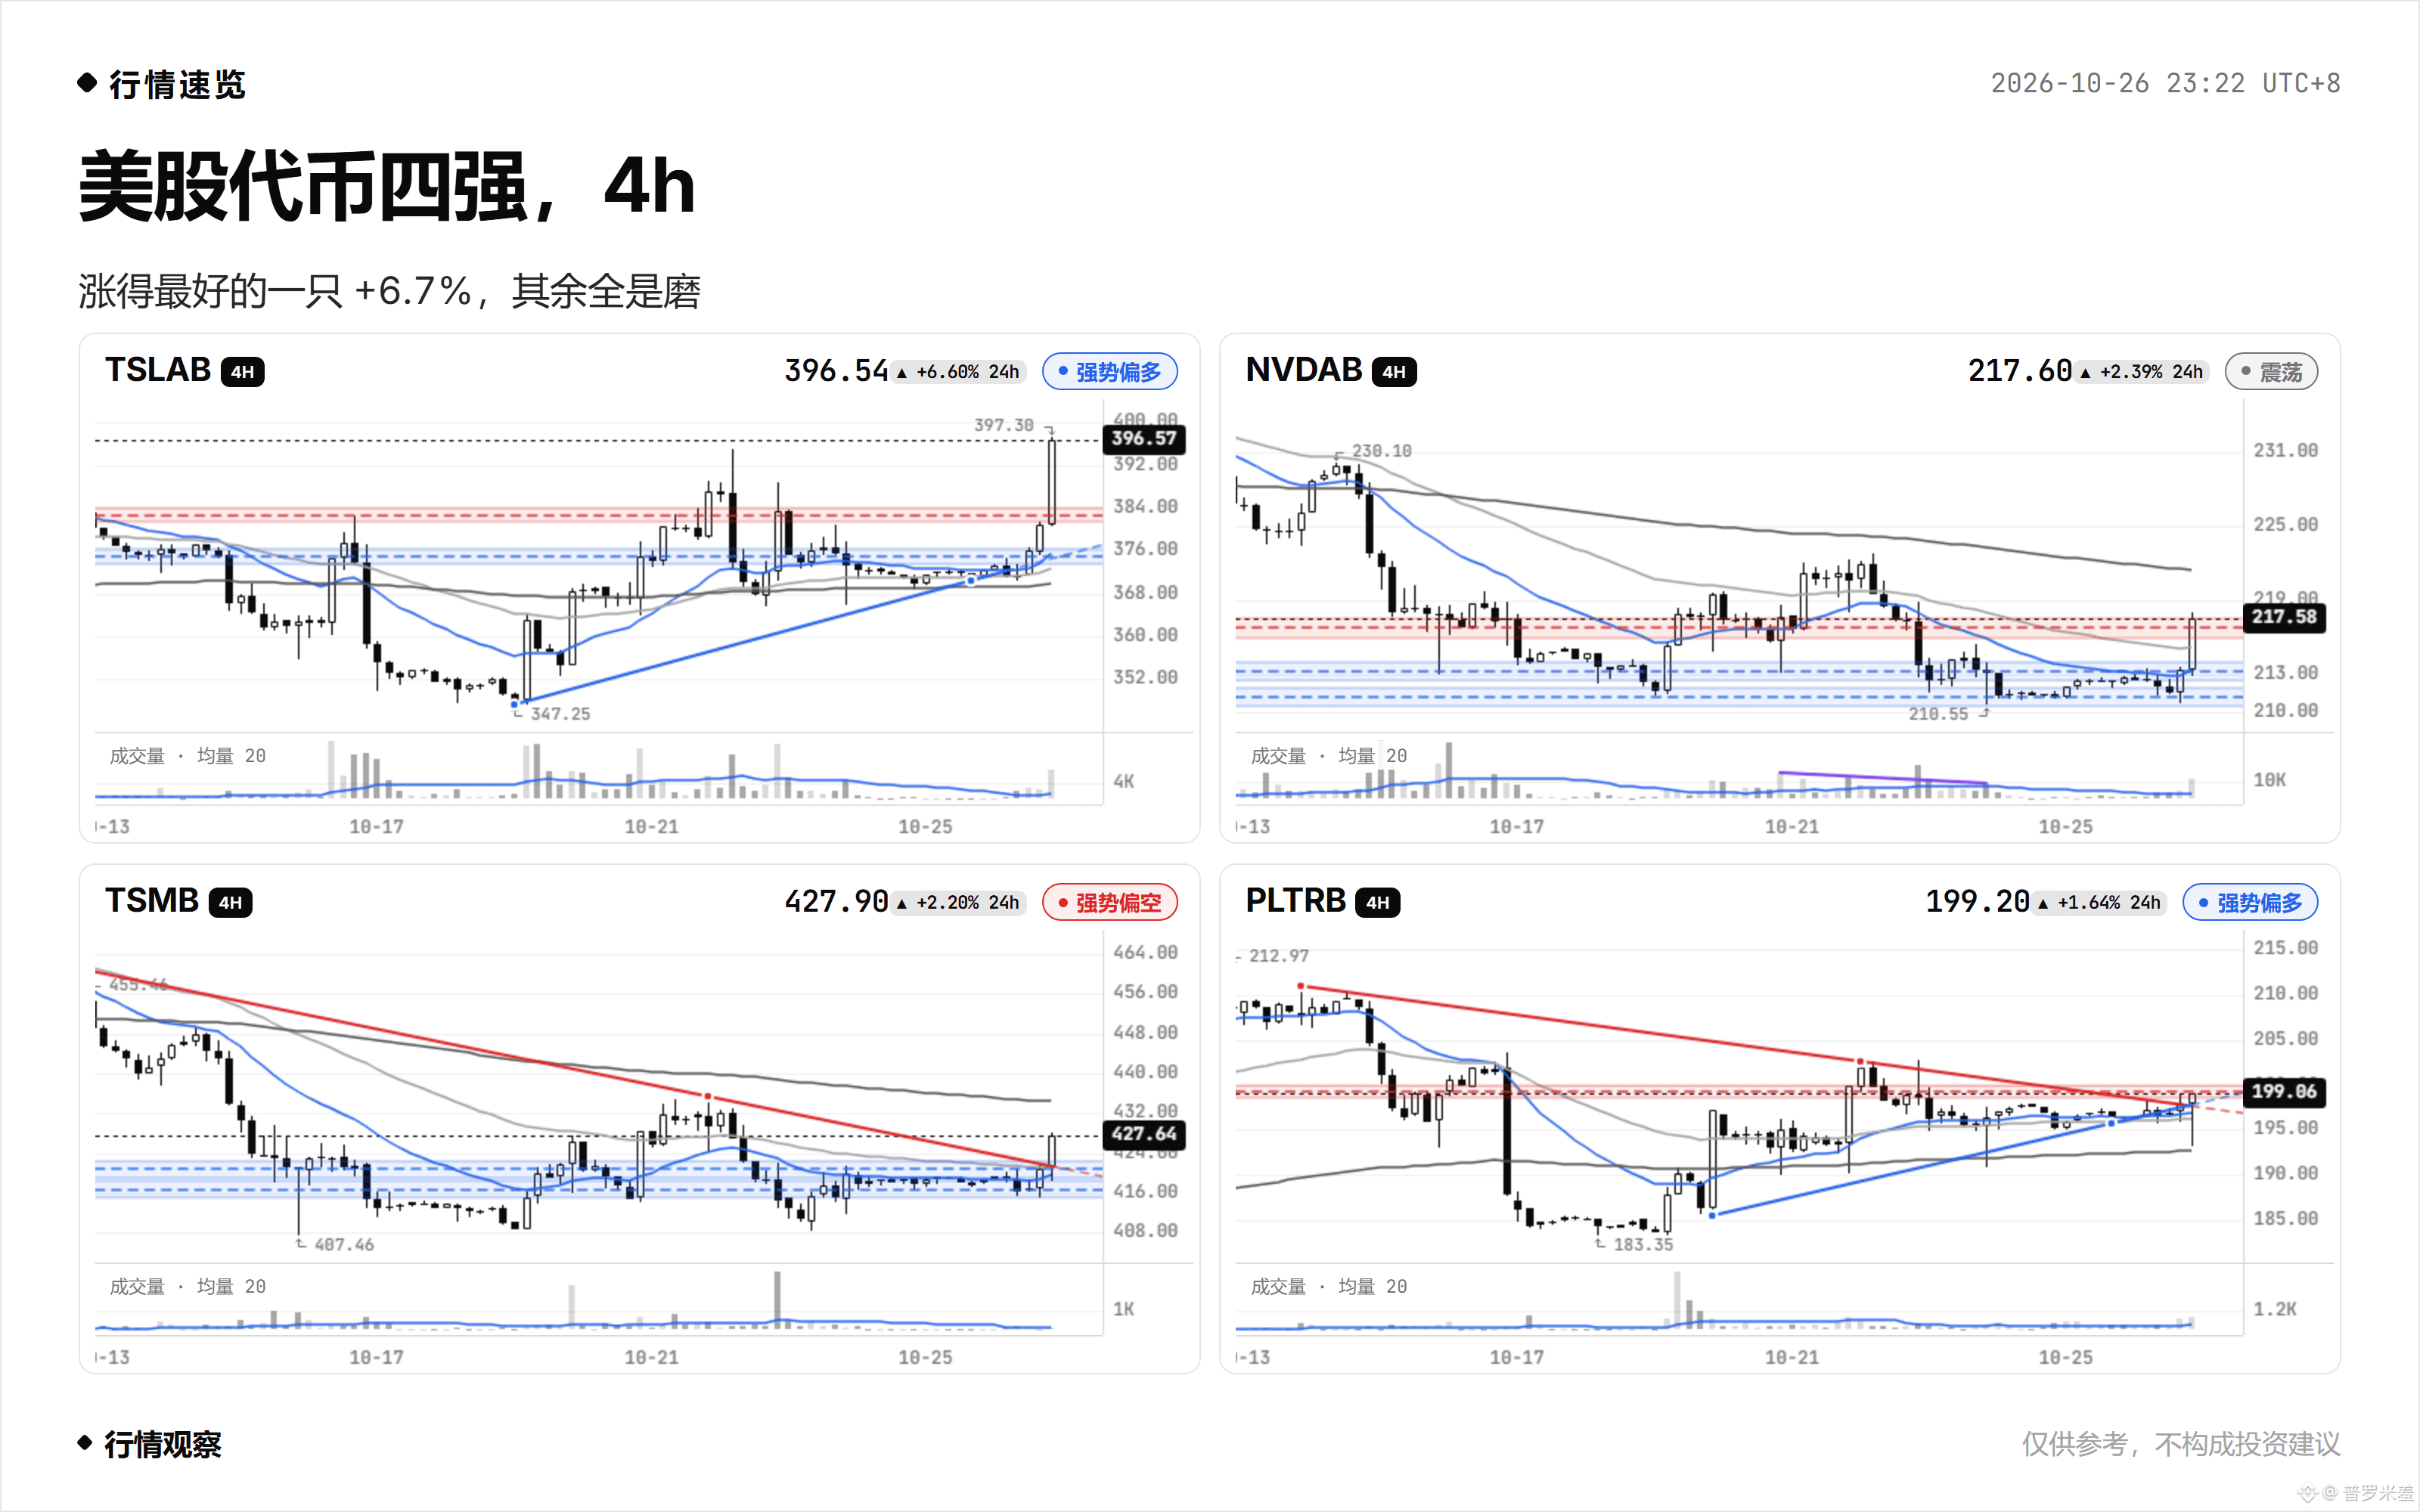
Among today’s U.S. stock tokens, only these four look halfway decent: $TSLAB +6.7%, NVDAB +2.3%, TSMB +2.2%, PLTRB +1.5%.
But zoom out and the truth becomes obvious. TSLA is the only one that actually broke out: volume hit 2.6 times normal as it pushed through 375, with all the moving averages supporting it from below. The other three are grinding beneath resistance: NVDA can’t get past 217, and TSM’s chart still looks bearish—up 2% is just a bounce. Of the four in the green, only one is genuinely strong; the rest are just making U.S. stocks look good.
But zoom out and the truth becomes obvious. TSLA is the only one that actually broke out: volume hit 2.6 times normal as it pushed through 375, with all the moving averages supporting it from below. The other three are grinding beneath resistance: NVDA can’t get past 217, and TSM’s chart still looks bearish—up 2% is just a bounce. Of the four in the green, only one is genuinely strong; the rest are just making U.S. stocks look good.
31
·
--
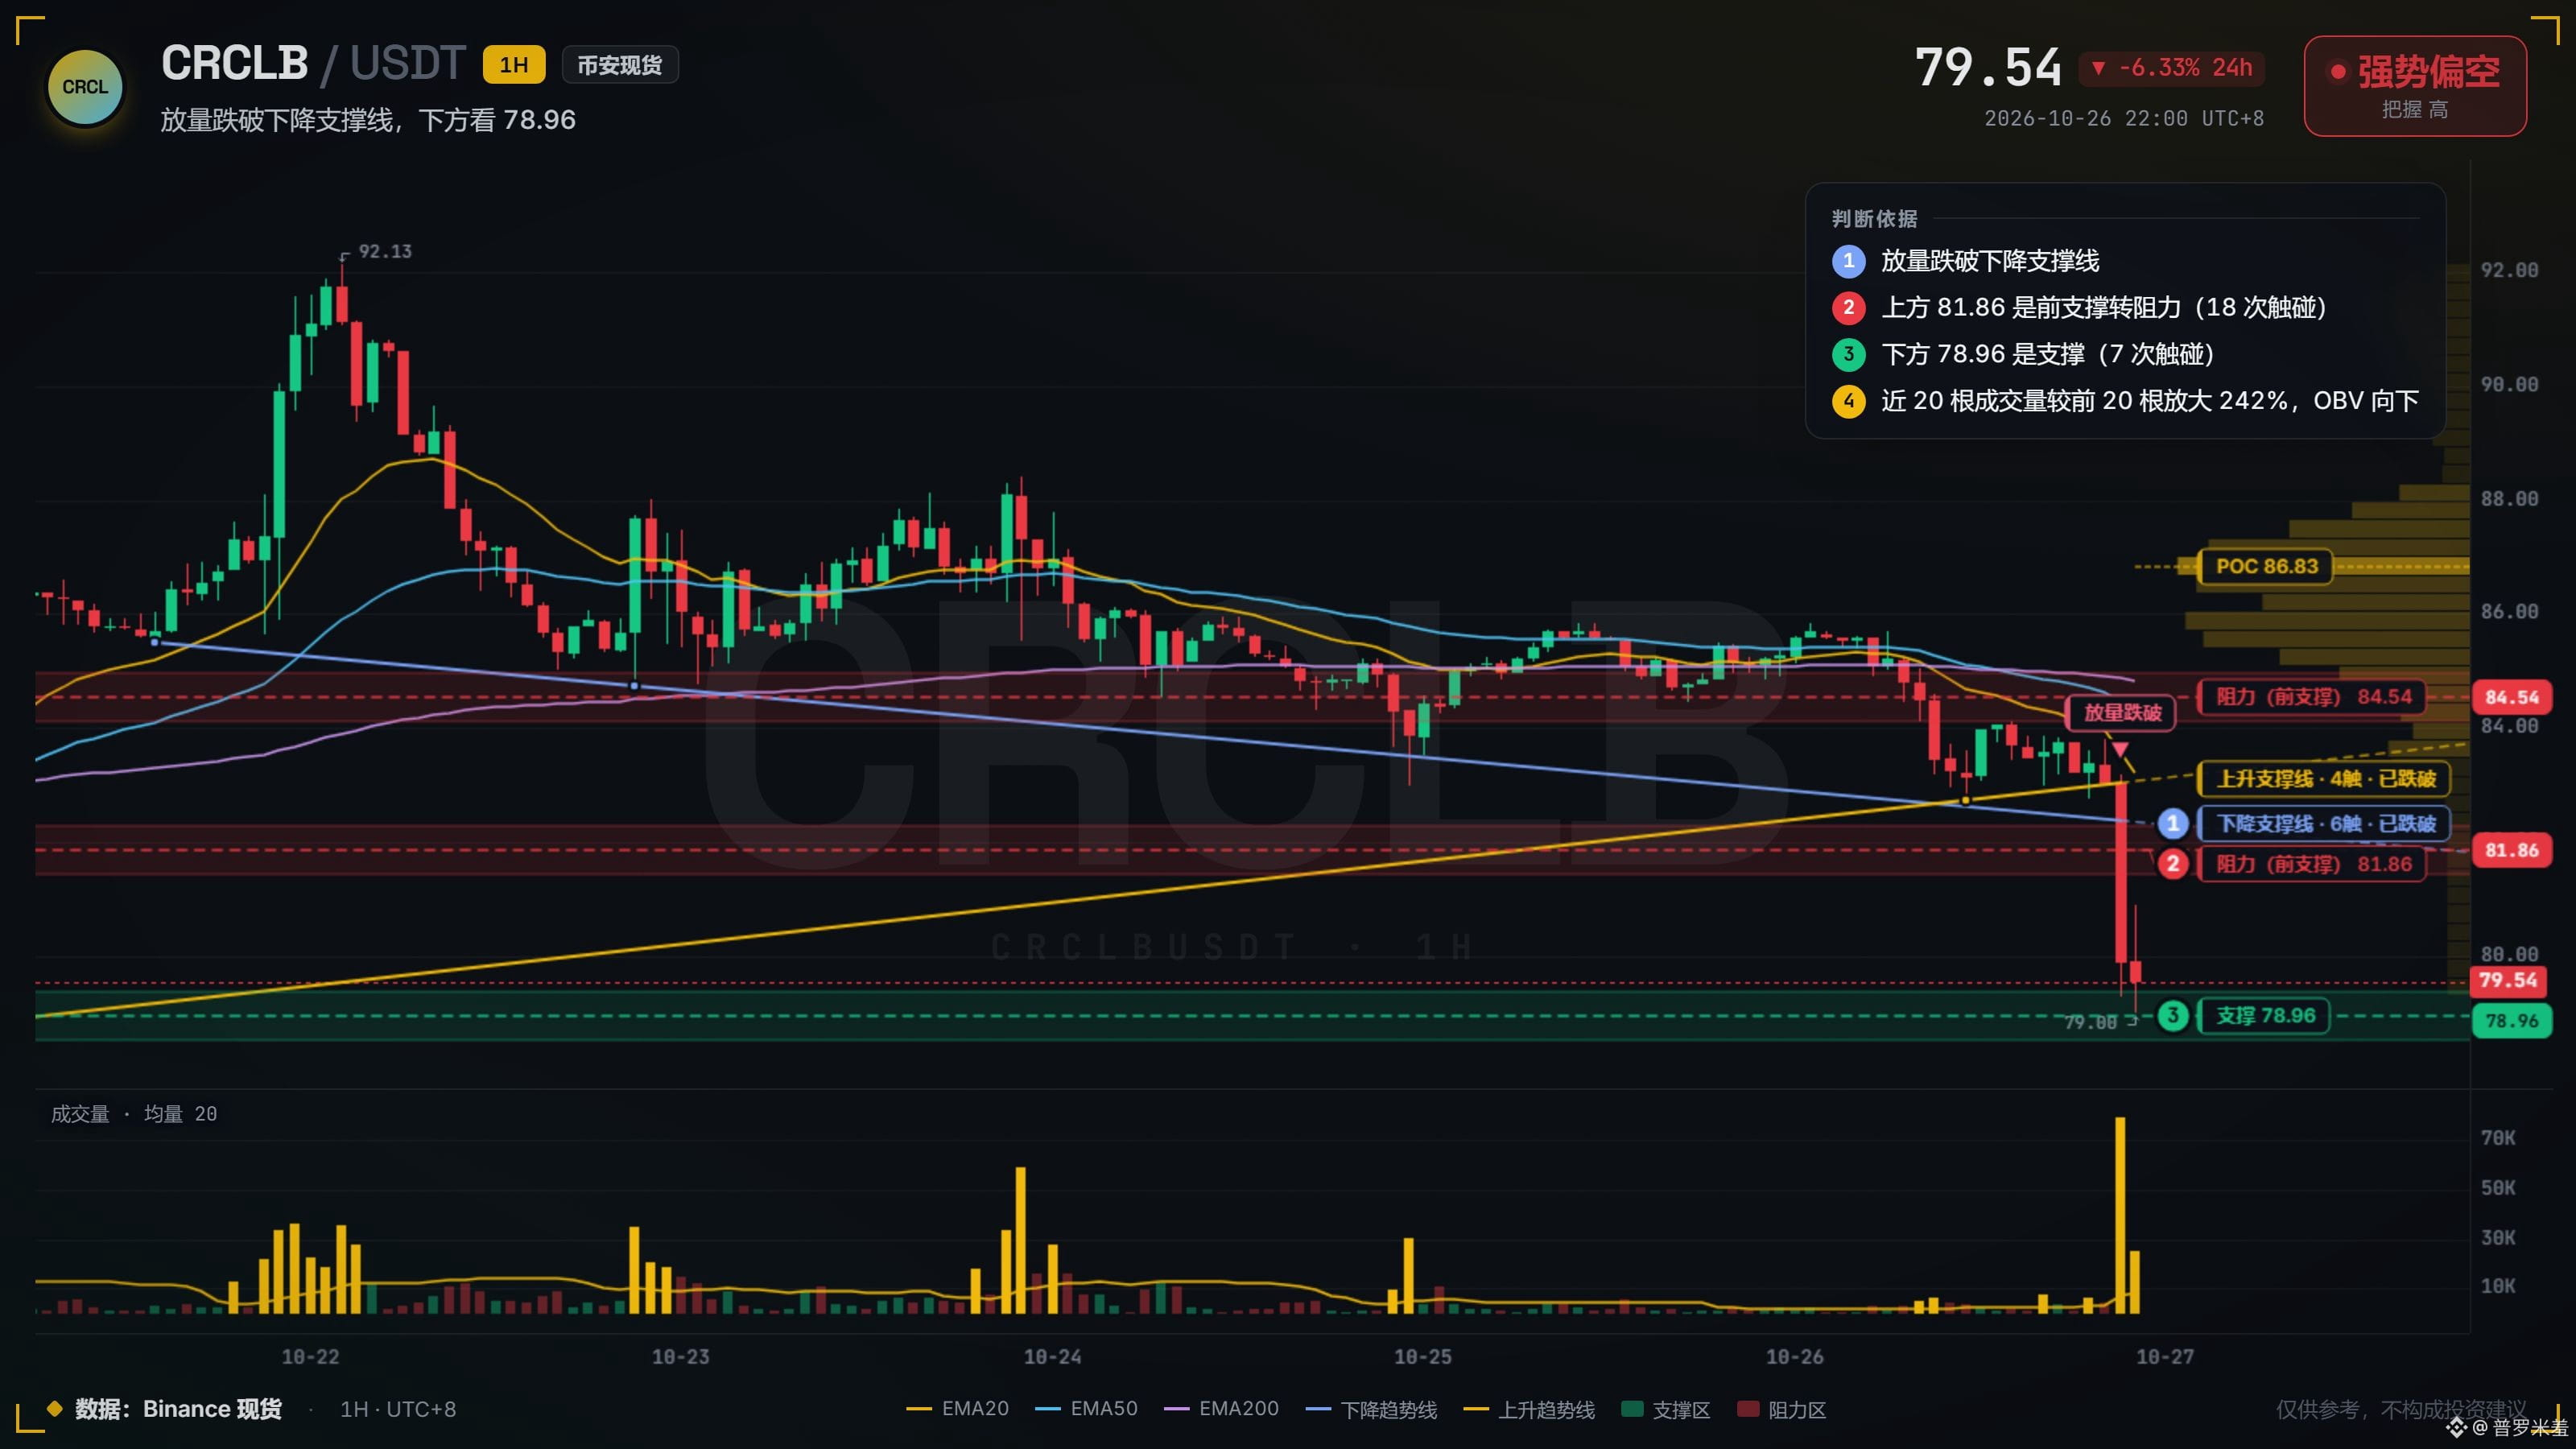
The support line that held six times was finally pierced by a bearish candle, on volume eleven times the usual level. Buyers stepped in on the first five tests, but this time they all got trapped. That’s why I’ve never bought the idea that “support gets stronger the more it’s tested.” Test it too many times, and you’re really just helping the market makers build up the other side of the trade.
Oversold? After a breakdown, it can get even more oversold. That 81.86 level has now flipped into resistance; any bounce back there is an exit window. 78.96 is just the appetizer.
Oversold? After a breakdown, it can get even more oversold. That 81.86 level has now flipped into resistance; any bounce back there is an exit window. 78.96 is just the appetizer.
239
·
--
The uptrend line held for so many days, then one candle on 4x volume sliced straight through it. On the bounce, it couldn’t even reclaim 320.5. Former support immediately turned into resistance and slammed the price back down—showed me absolutely no mercy.
Got wrecked in crypto, switched to stock tokens, and the stocks wrecked me too. Fuck, am I just naturally an inverse signal? $GOOGLBUSDT
Got wrecked in crypto, switched to stock tokens, and the stocks wrecked me too. Fuck, am I just naturally an inverse signal? $GOOGLBUSDT
14
·
--
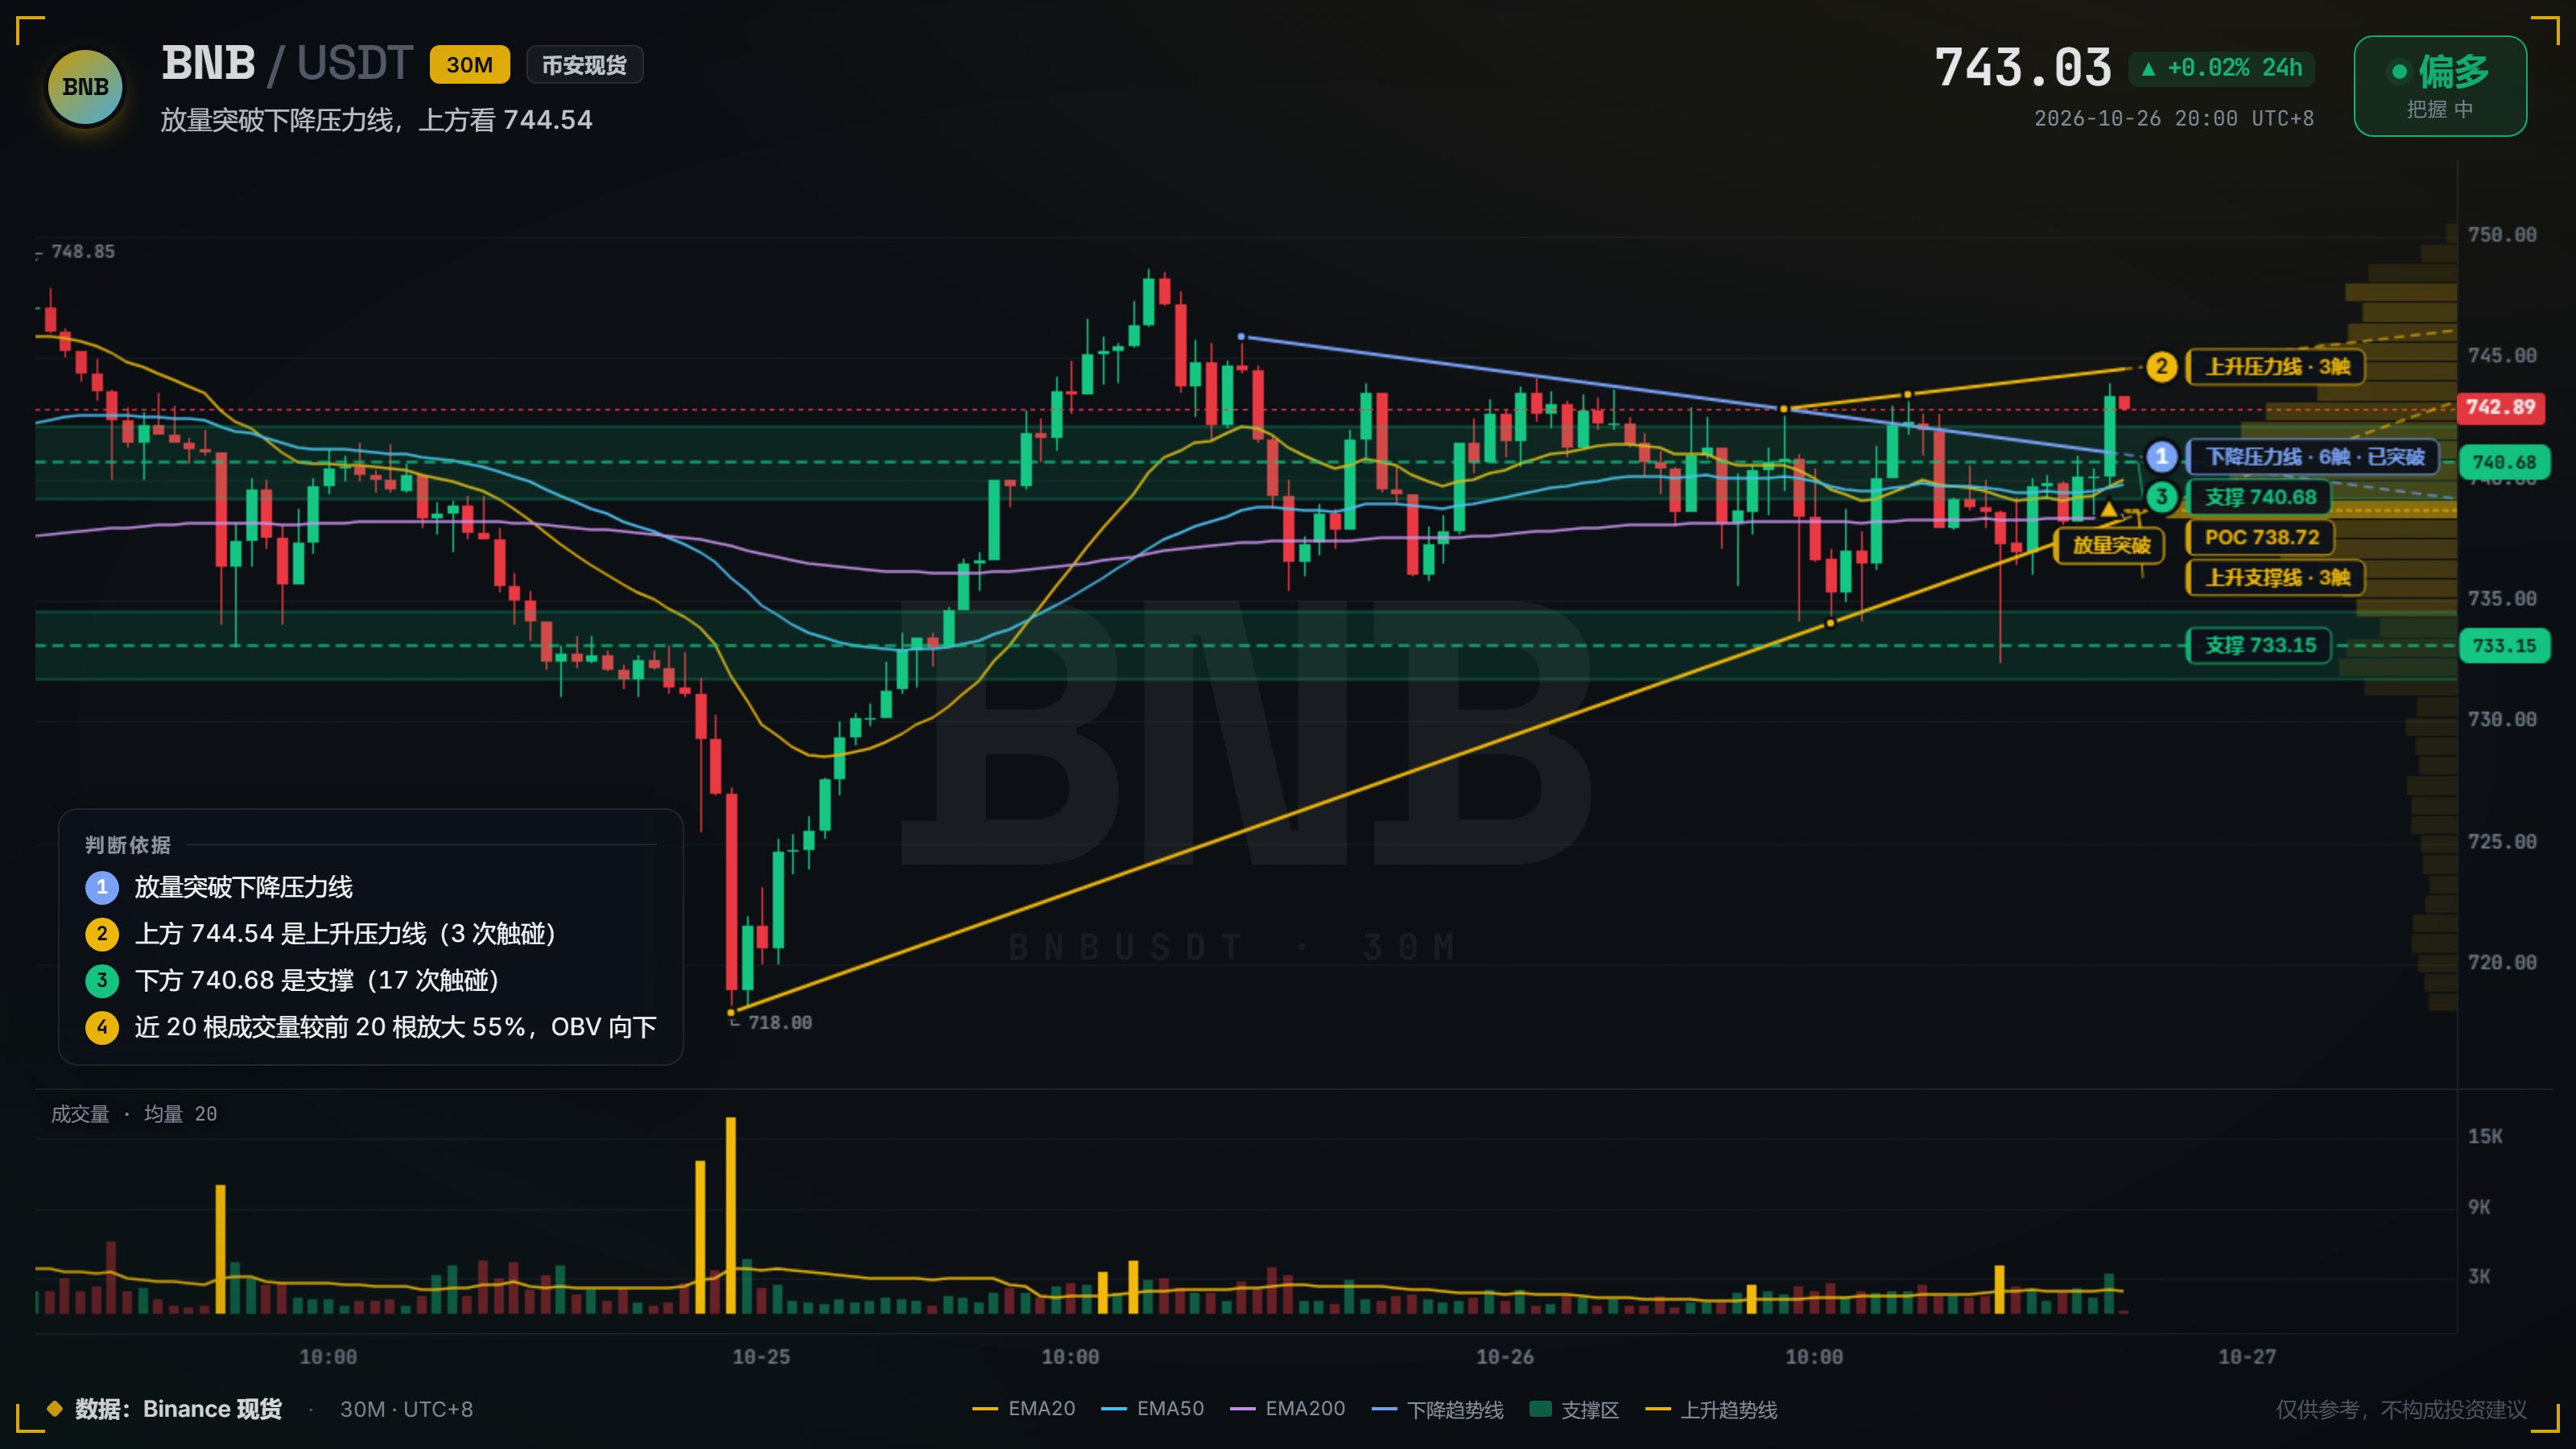
This descending resistance line at $BNB held price down six times, but today it finally got broken. Volume on the breakout candle was about twice the average. This isn't easy to fake—someone is really putting money in to sweep up the offers.
Once it moves above 741, this area becomes the floor. Overhead is the ascending resistance line at 744.54; the upside only really opens up if price gets above it. If it can't, then it's a fakeout—and I'll admit it.
When a line has been coiling for this long, a genuine breakout never lasts just one candle.
#BinancePick
55
·
--
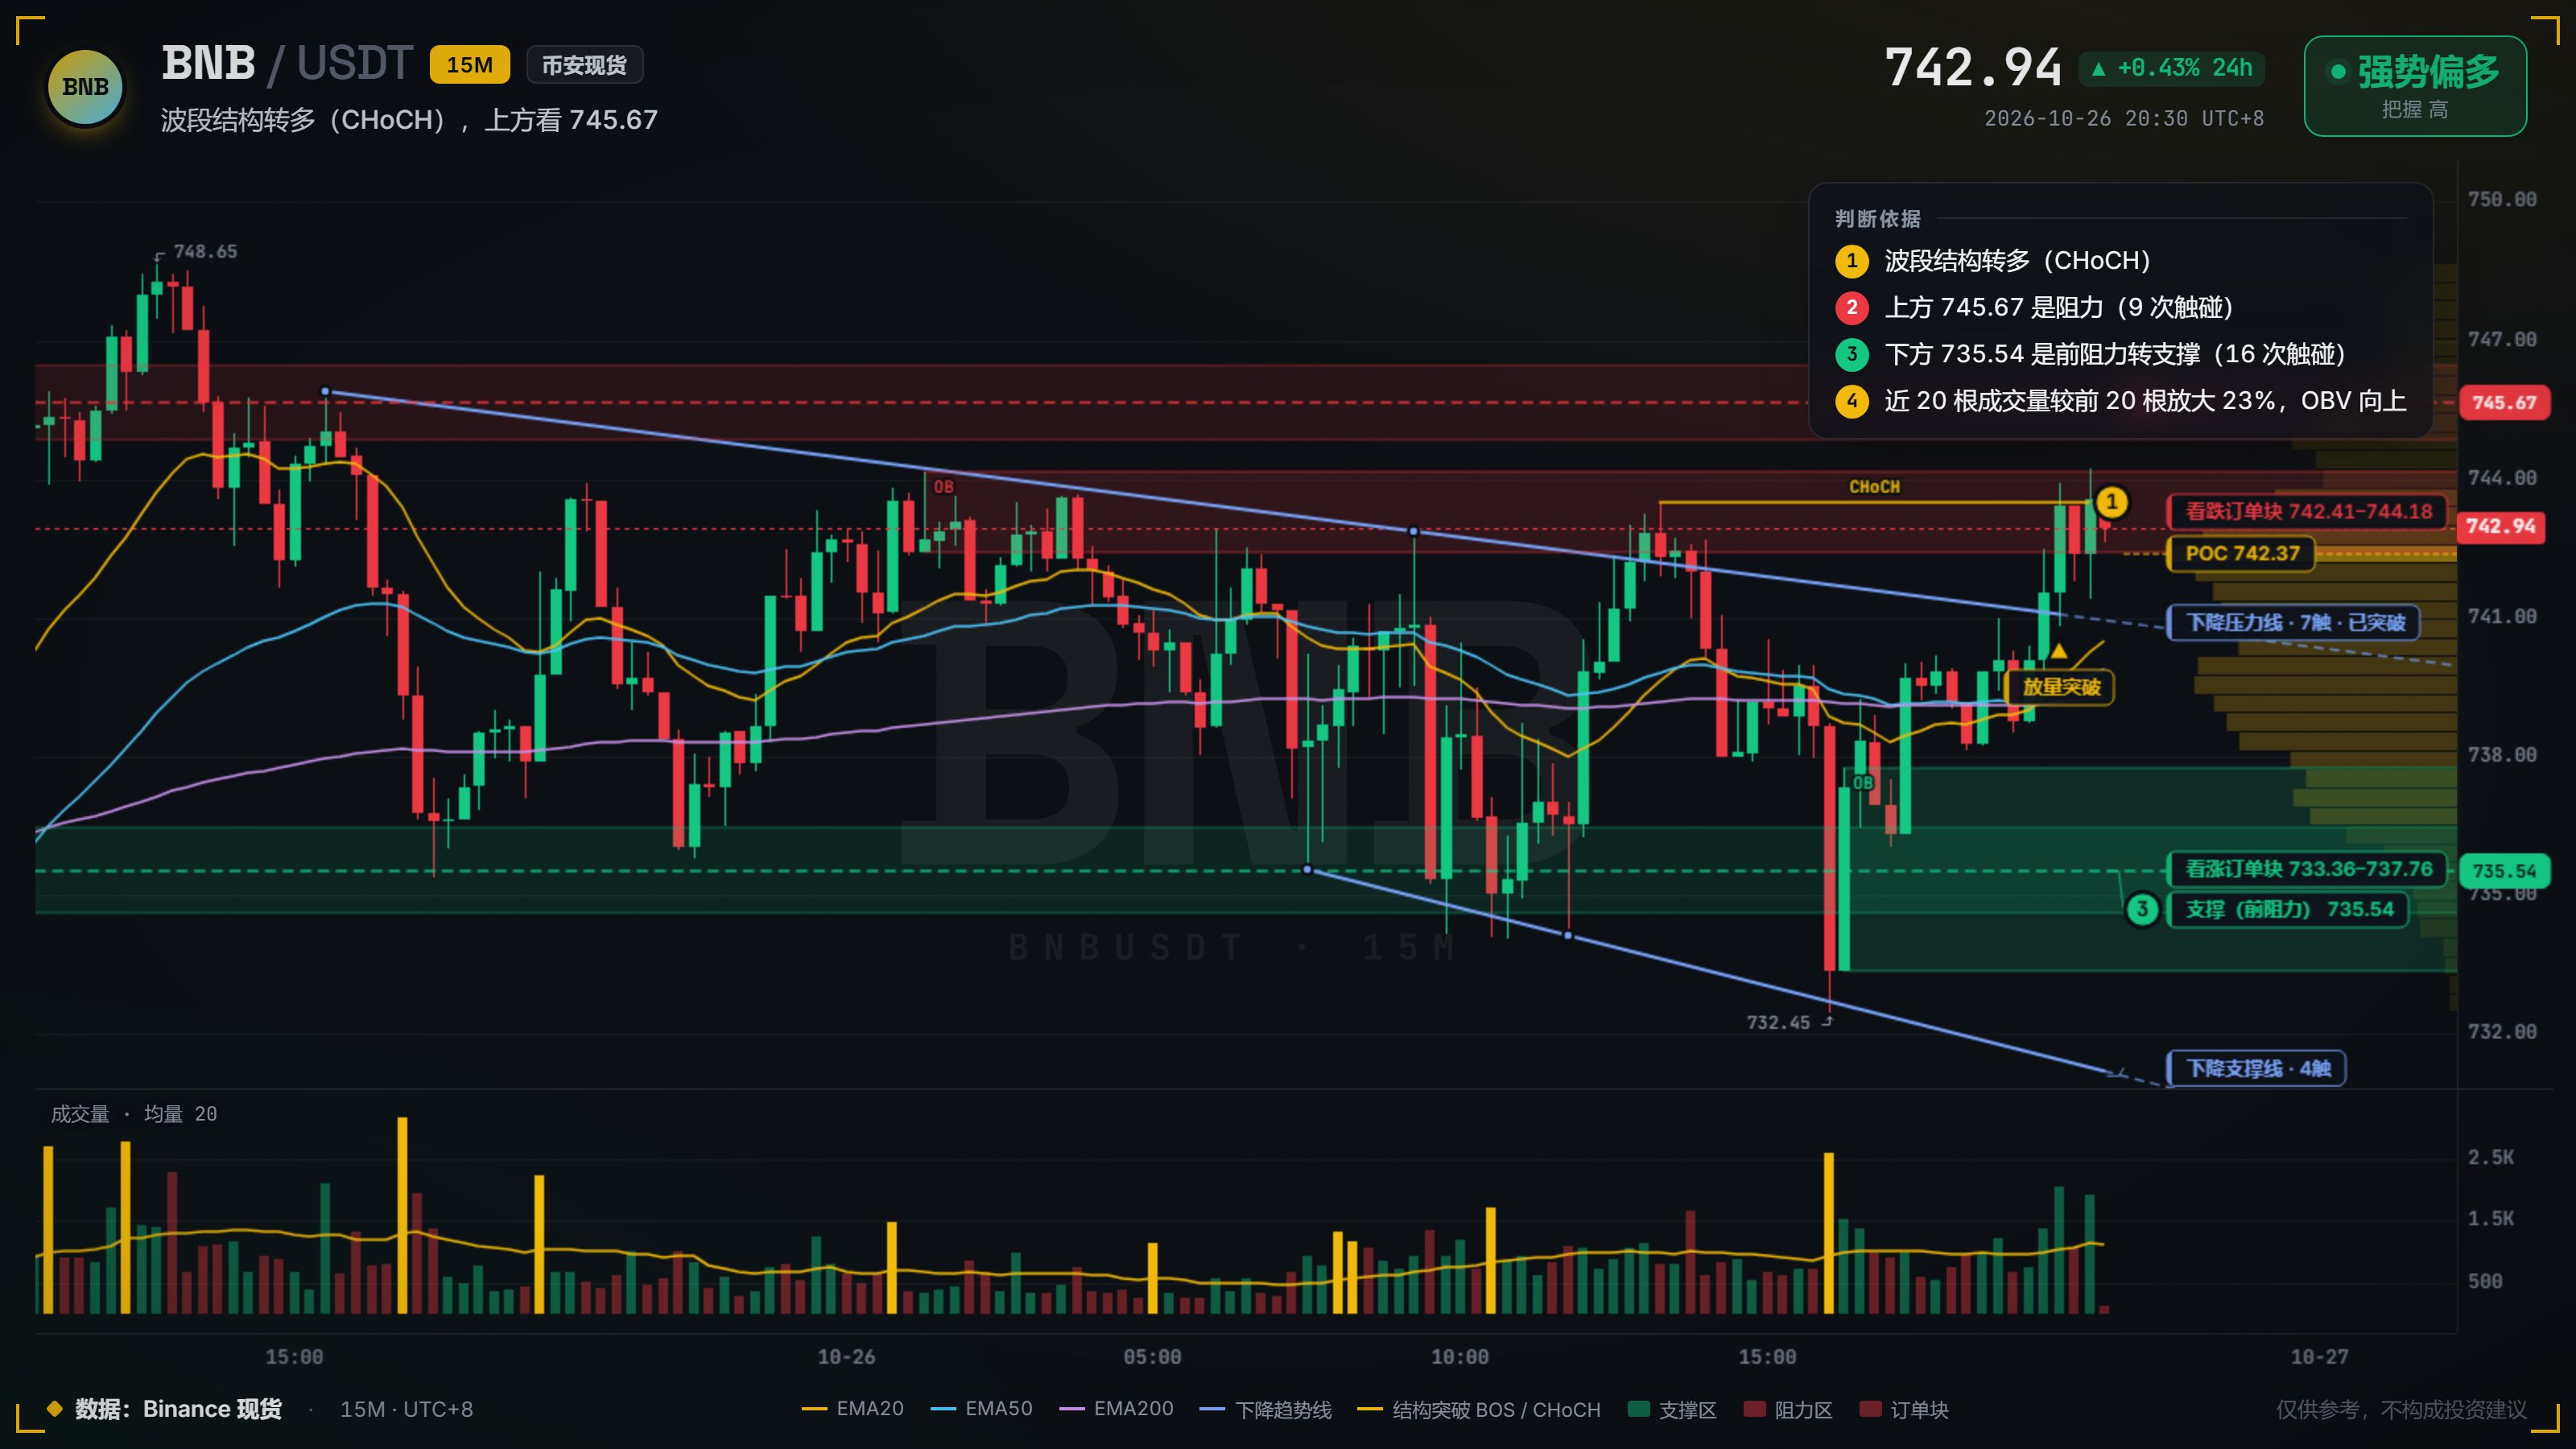
It closed above 743.50, and the swing structure has officially turned bullish. That descending trendline had capped price seven times before; the breakout candle came with twice the average volume—retail traders can’t generate that kind of volume. Now price is grinding below 745.67. This level has already been tested nine times; the longer it grinds here, the thinner the resistance above gets. Once it breaks, 748.67 is the next stop. 735.54 is the line in the sand—if it gives way, this whole move is off. The first pullback after the structure turns bullish feels like the safest entry, but it’s also the easiest one to get suckered into. The urge to jump in is real. $BNB #BinancePick
It closed above 743.50, and the swing structure has officially turned bullish. That descending trendline had capped price seven times before; the breakout candle came with twice the average volume—retail traders can’t generate that kind of volume. Now price is grinding below 745.67. This level has already been tested nine times; the longer it grinds here, the thinner the resistance above gets. Once it breaks, 748.67 is the next stop. 735.54 is the line in the sand—if it gives way, this whole move is off. The first pullback after the structure turns bullish feels like the safest entry, but it’s also the easiest one to get suckered into. The urge to jump in is real. $BNB #BinancePick
23
·
--
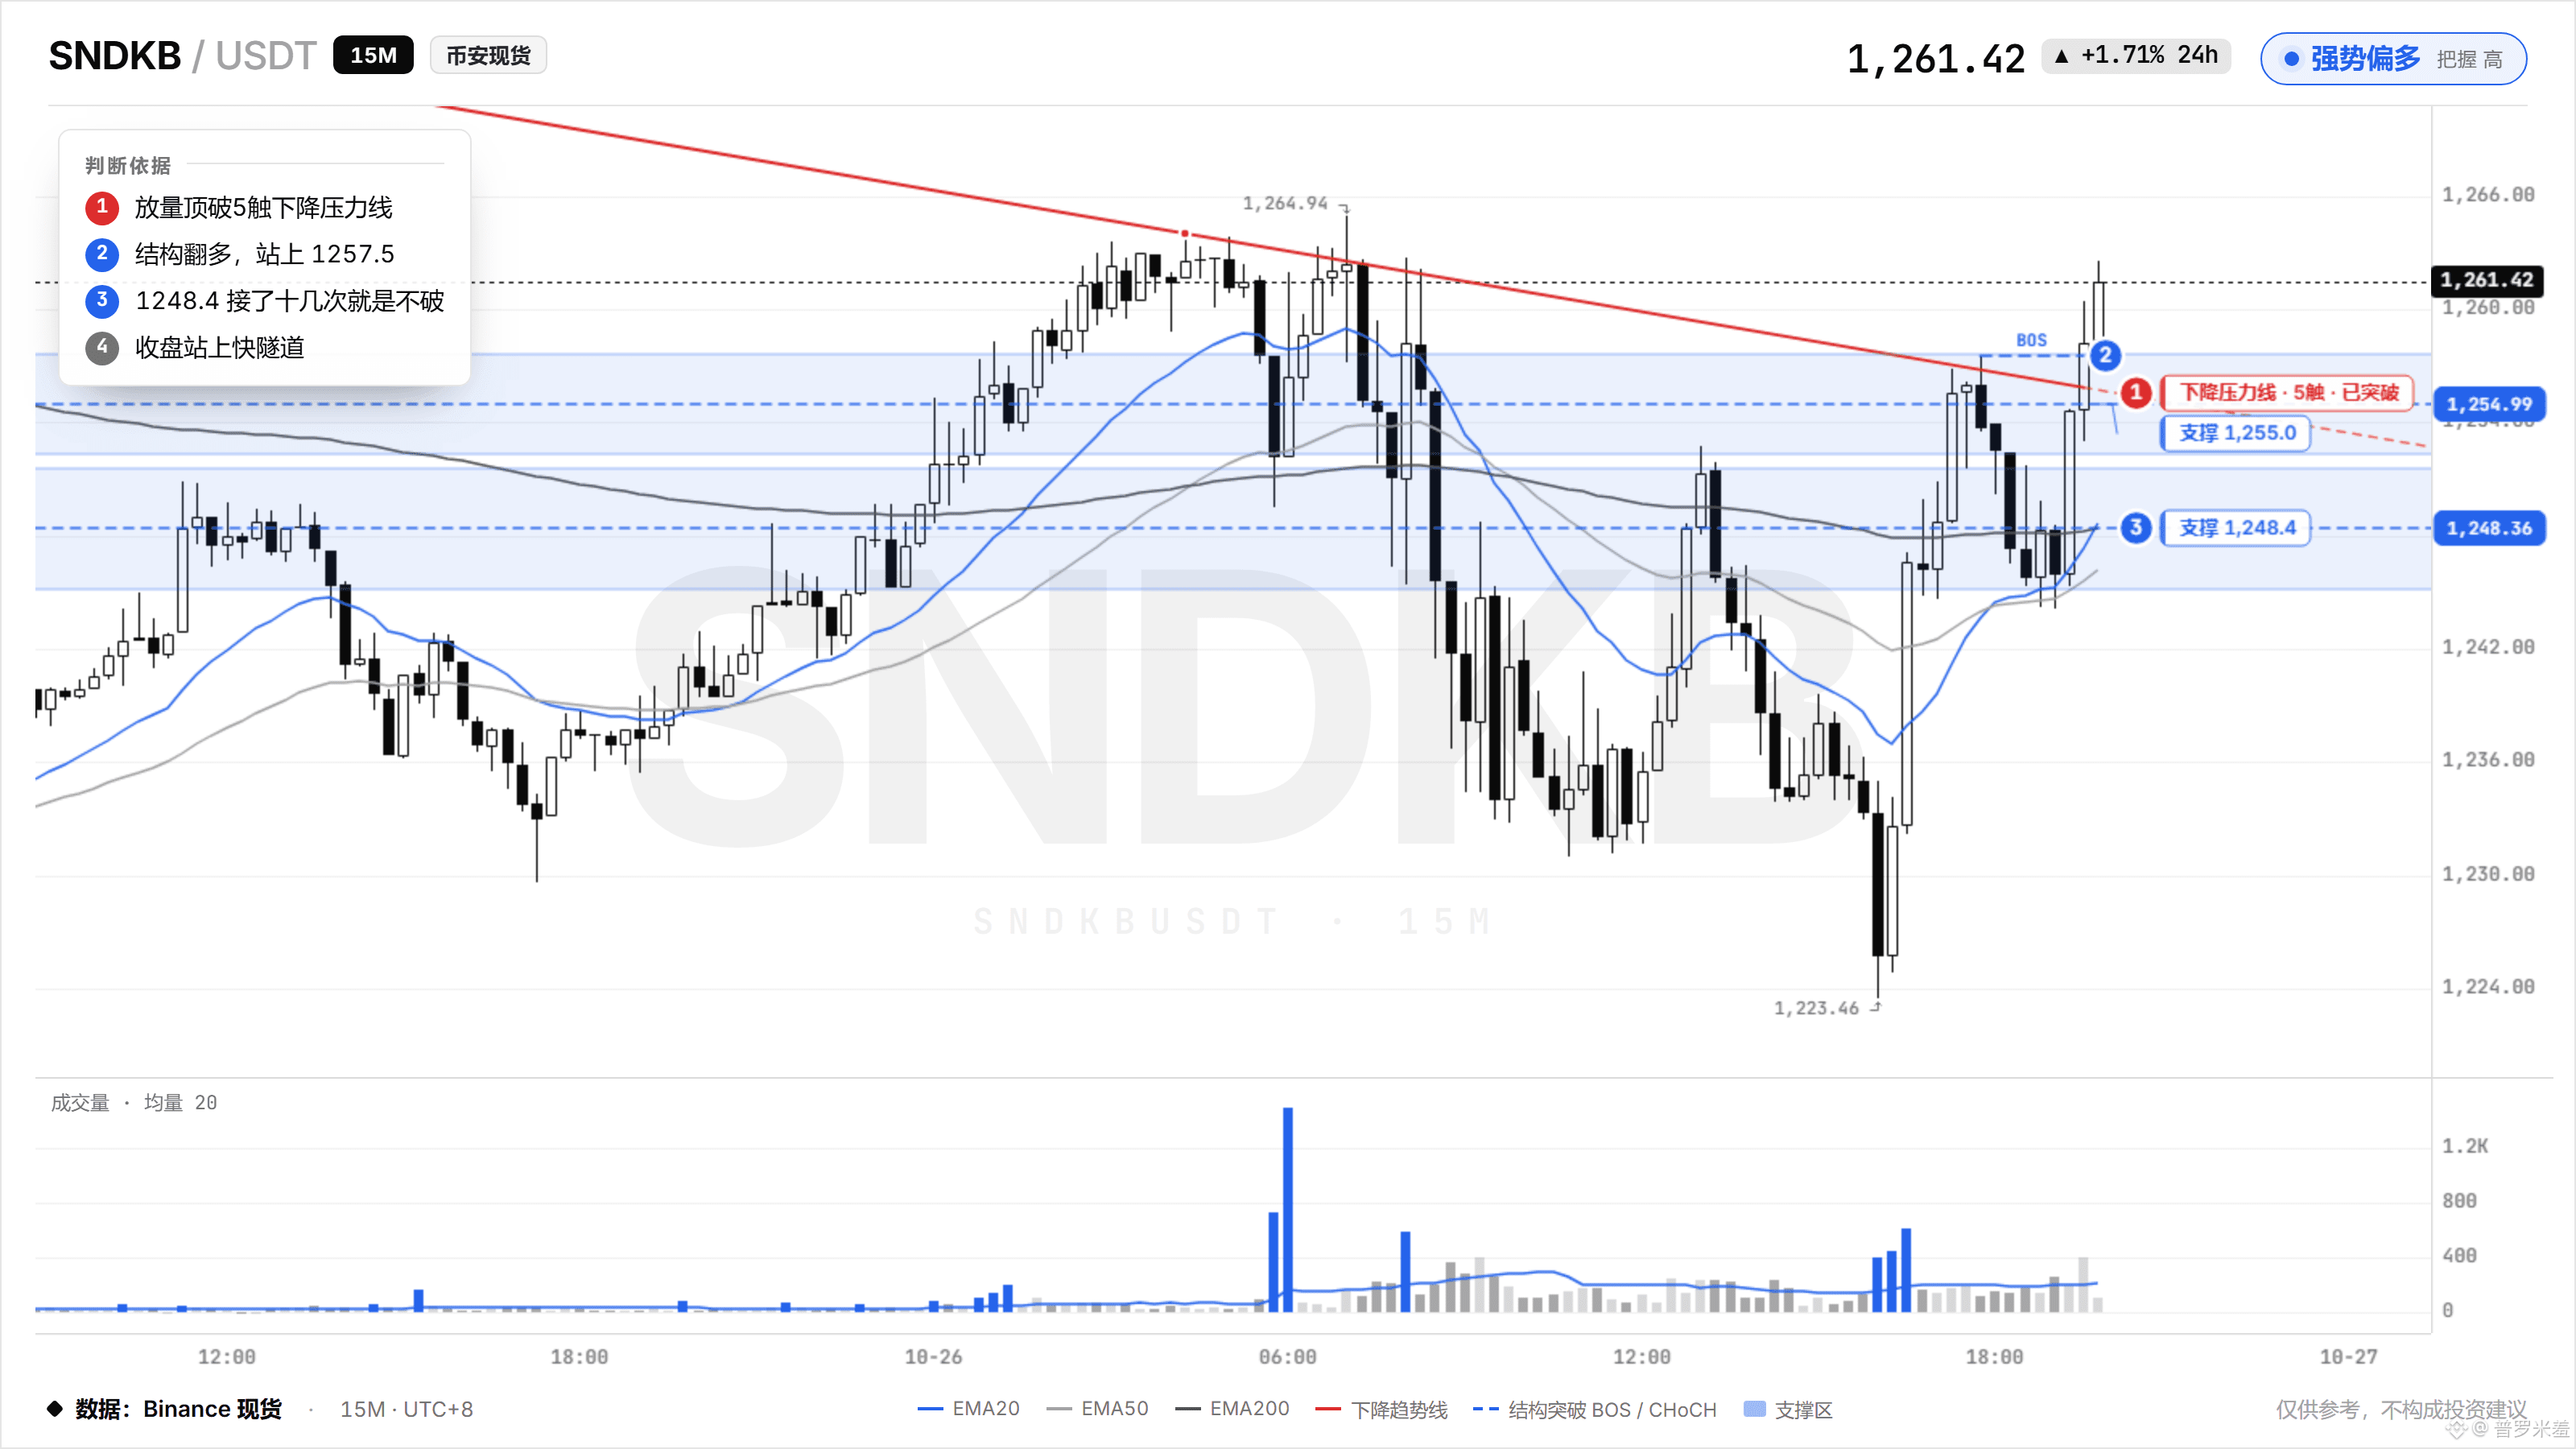
$SNDK : Looking at multiple timeframes together, the 15m chart broke above the descending trendline that had capped price five times, on strong volume, flipping the structure bullish outright. Meanwhile, selling pressure on the 4h chart is also easing, and the 1248 level has been defended more than a dozen times without breaking.
I'm firmly bullish here. It simply can't go any lower—don't talk to me about a pullback.
I'm firmly bullish here. It simply can't go any lower—don't talk to me about a pullback.
286
·
--
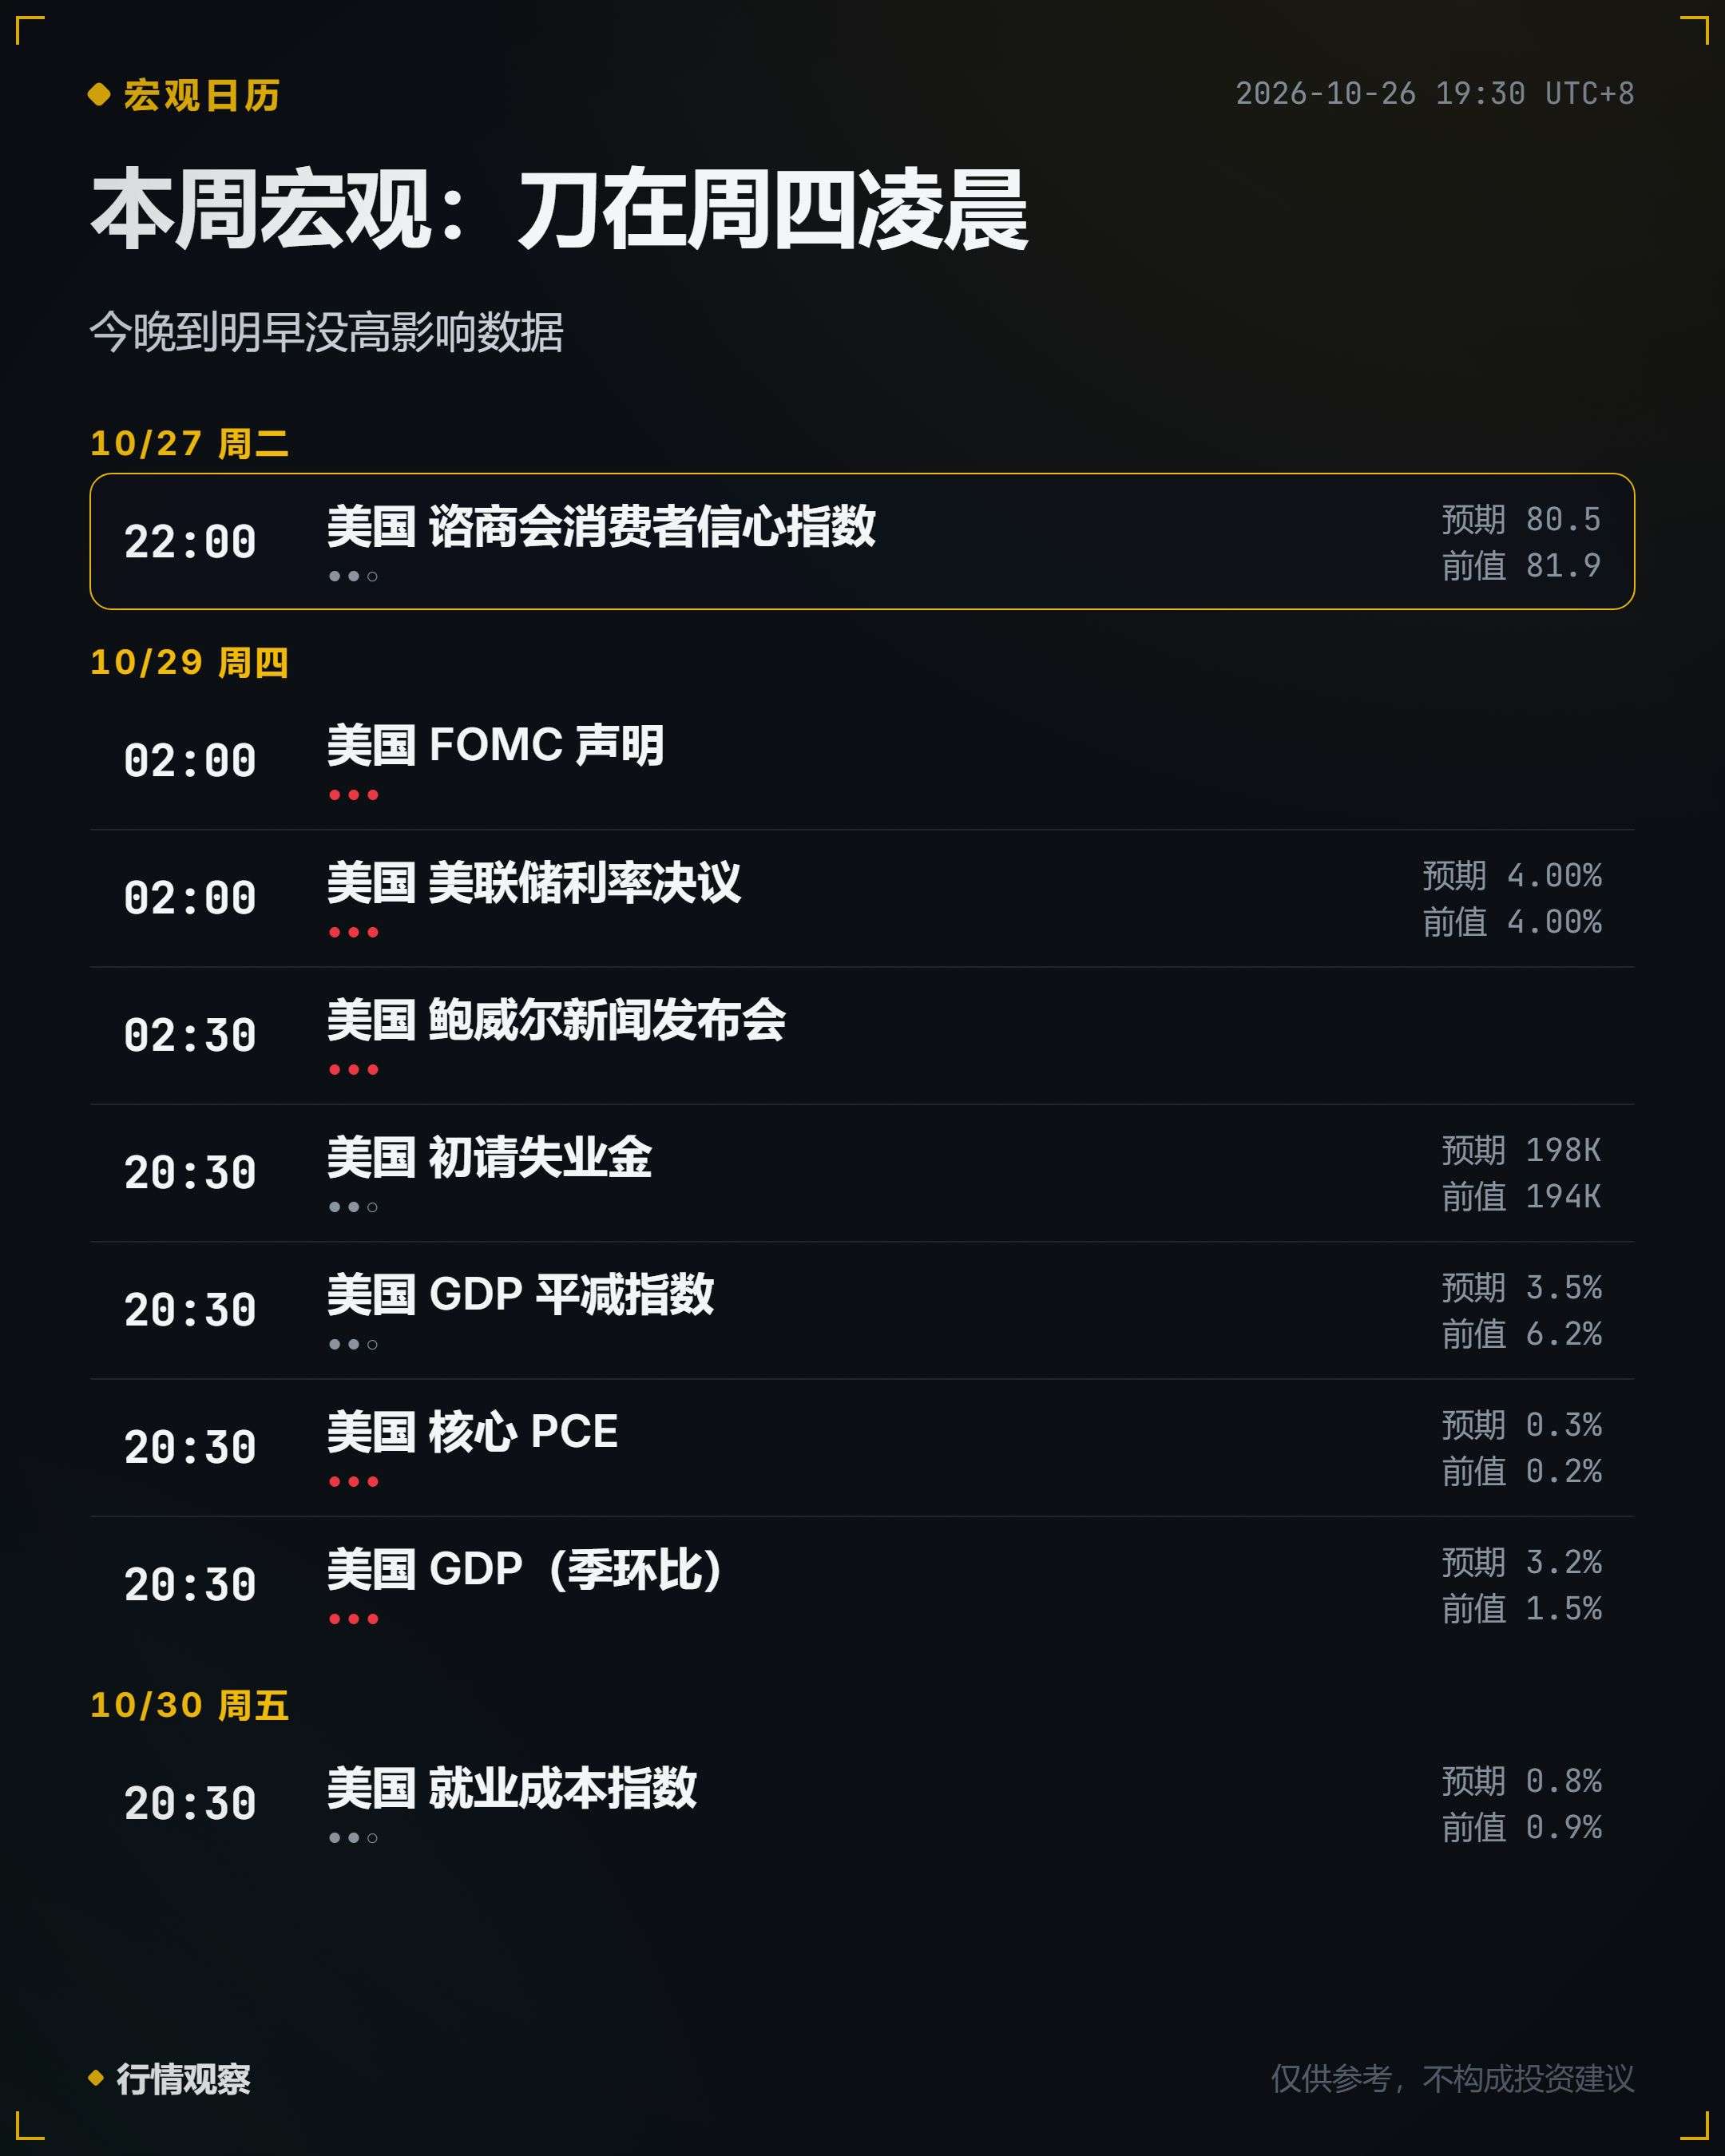
$BTC From tonight through tomorrow morning, there’s nothing on the calendar. The Conference Board Confidence Index isn’t going to produce a decent candlestick—don’t let a few intraday wicks shake you out of your positions.
The real blade this week drops at 2:00 a.m. Thursday. Rates will most likely stay put at 4.00%, but when Powell starts speaking at 2:30, his words could do more damage than the decision itself. Then, at 20:30 Thursday evening, GDP is expected to come in at 3.2%, up from 1.5%, while core PCE is set to rise from 0.2% to 0.3%. The hotter the data, the further rate cuts recede—and BTC doesn’t like that brew.
An old lesson: the calm before the storm is the most precious—and it’s also when people are most likely to shake themselves out of their positions. #USQ3GDPAndSeptemberPCEDueNextWeek
100
·
--
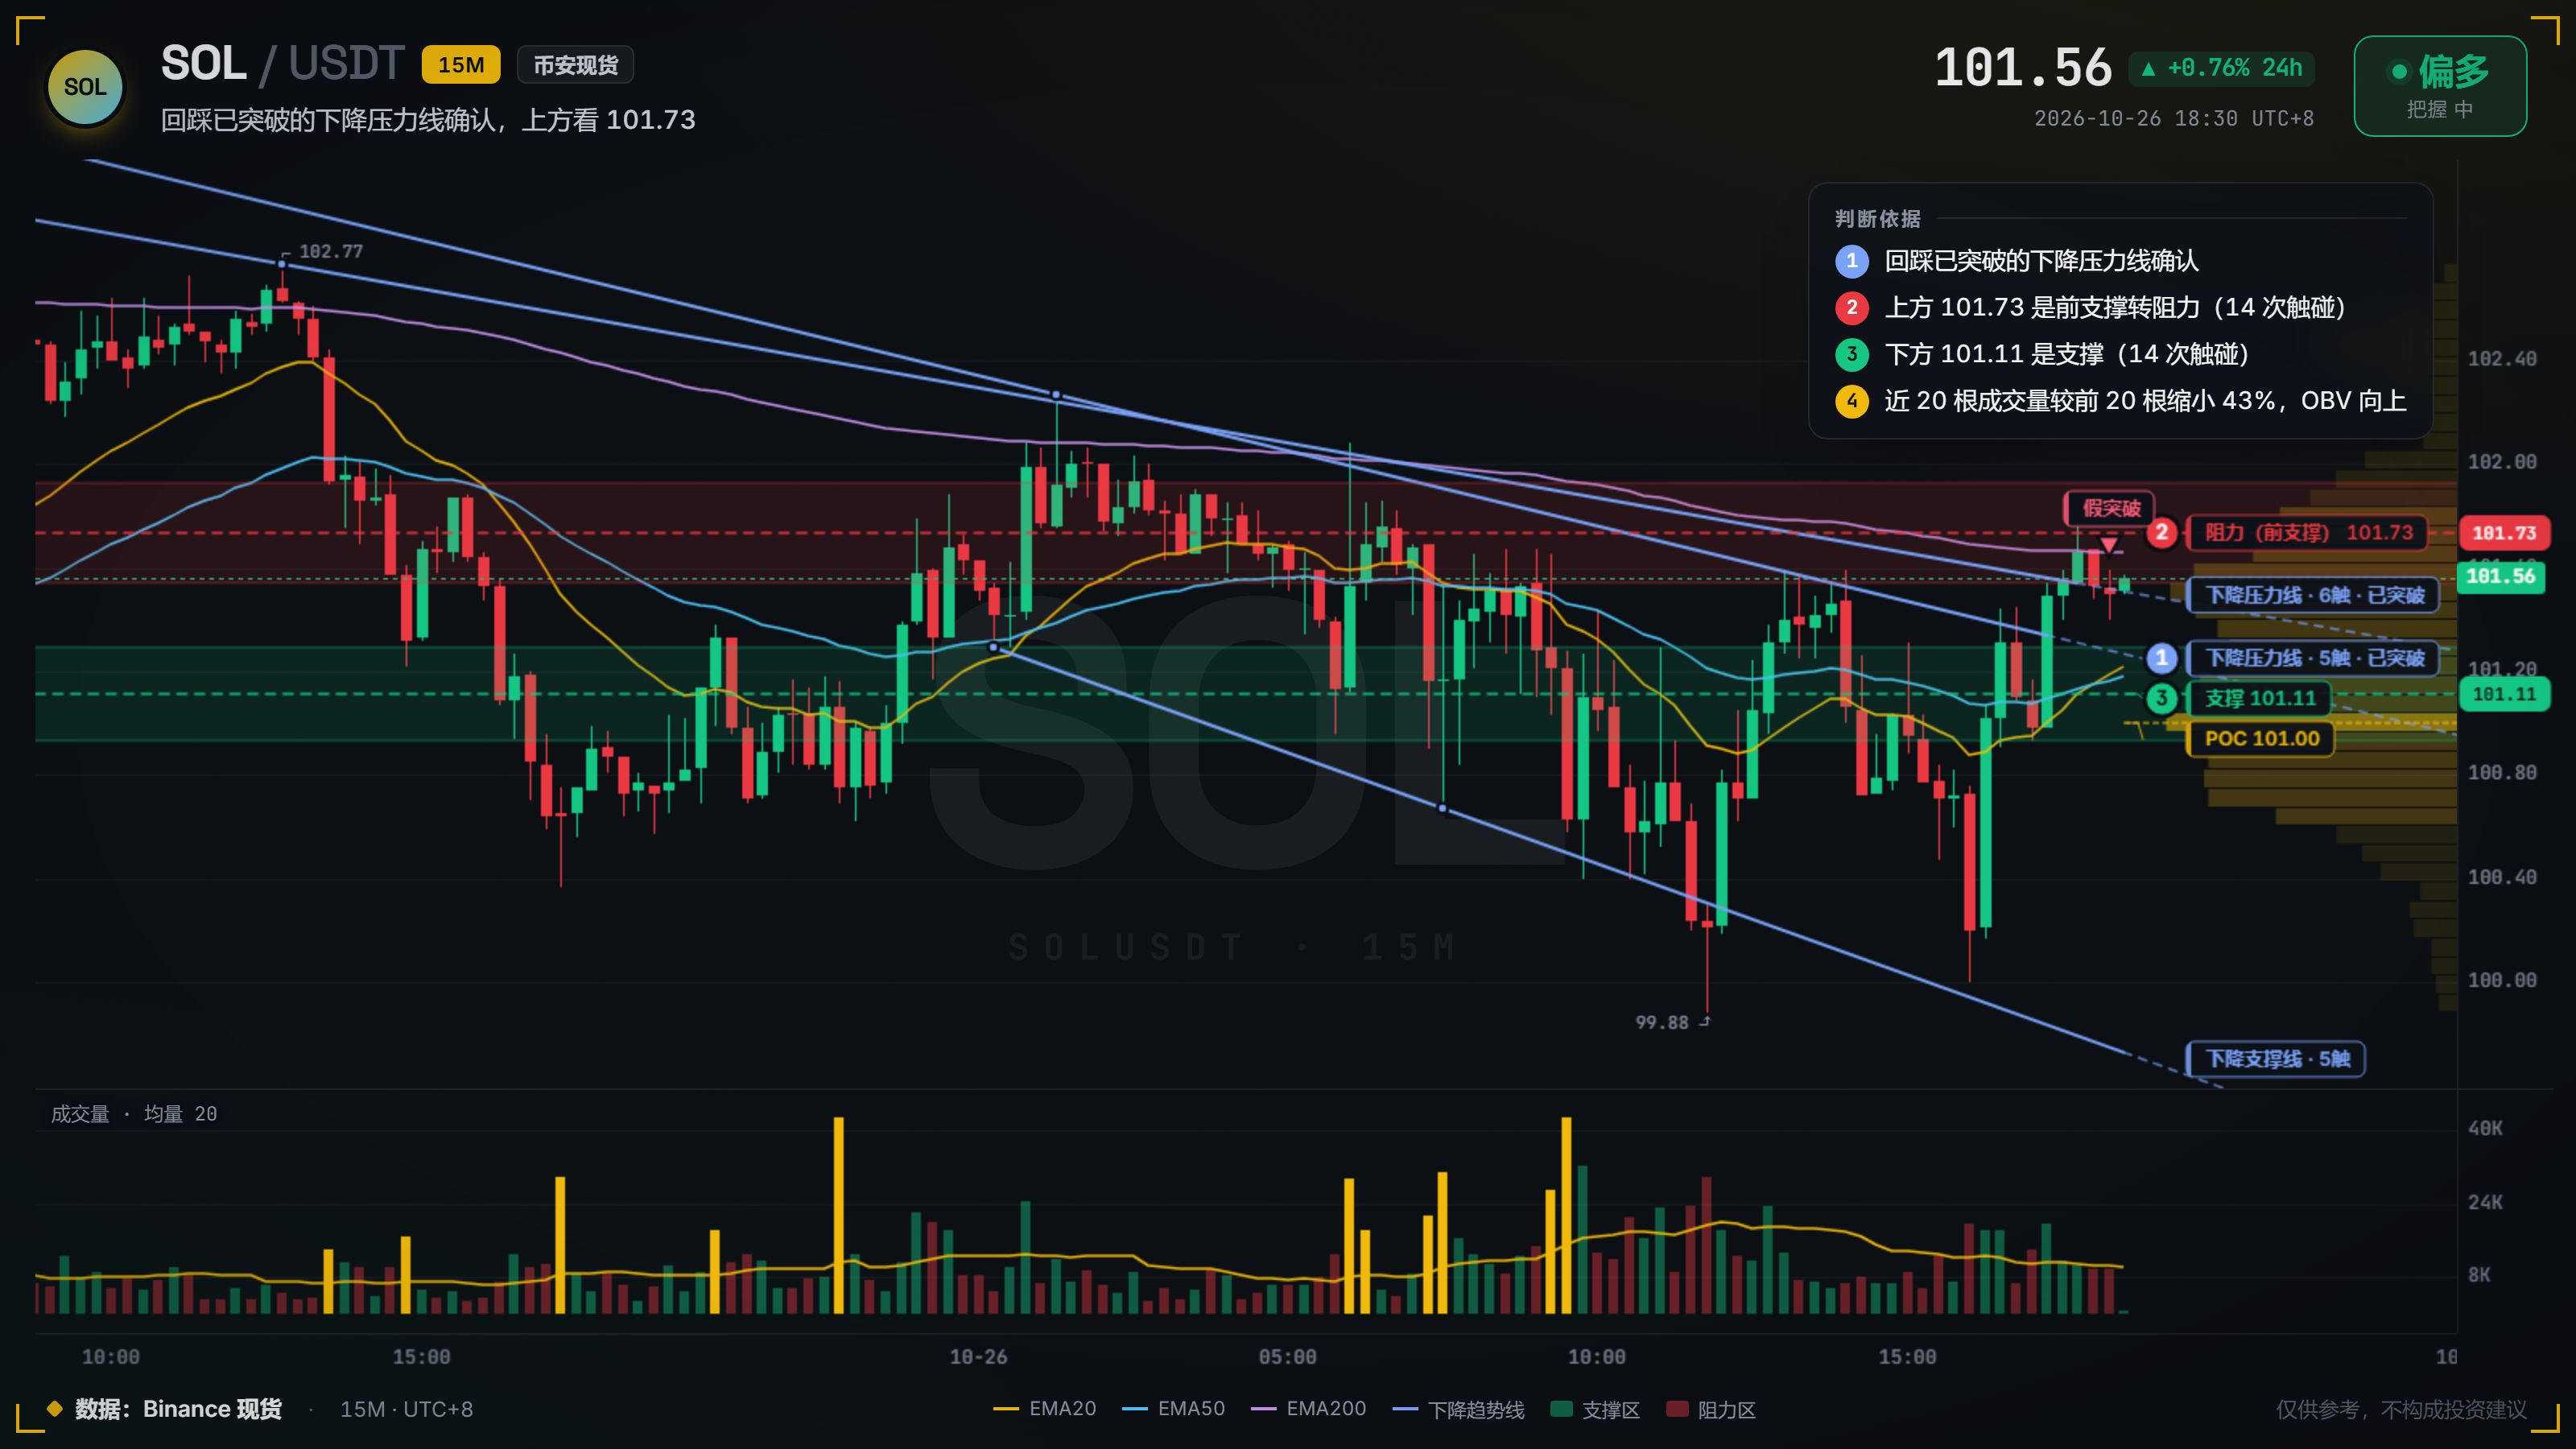
$SOL The retest has been confirmed. The resistance line that had held for so long was finally broken four candles ago. Price came back to test it near 101.28 but didn't fall back below it—a move that gives the bears no second chance to get in.
The price has been knocked back from 101.73 more than a dozen times, but that wall gets thinner with every test. A low-volume pullback while volume quietly builds higher is a pattern I've seen many times. It's not that buyers lack strength; it's that nobody is willing to sell here.
From experience: the first pullback after a breakout that holds is always a setup for a rise. Once 101.73 is taken out, it's no longer just about 102.
{spot}(SOLUSDT)
$SOL The retest has been confirmed. The resistance line that had held for so long was finally broken four candles ago. Price came back to test it near 101.28 but didn't fall back below it—a move that gives the bears no second chance to get in.
The price has been knocked back from 101.73 more than a dozen times, but that wall gets thinner with every test. A low-volume pullback while volume quietly builds higher is a pattern I've seen many times. It's not that buyers lack strength; it's that nobody is willing to sell here.
From experience: the first pullback after a breakout that holds is always a setup for a rise. Once 101.73 is taken out, it's no longer just about 102.
74
·
--
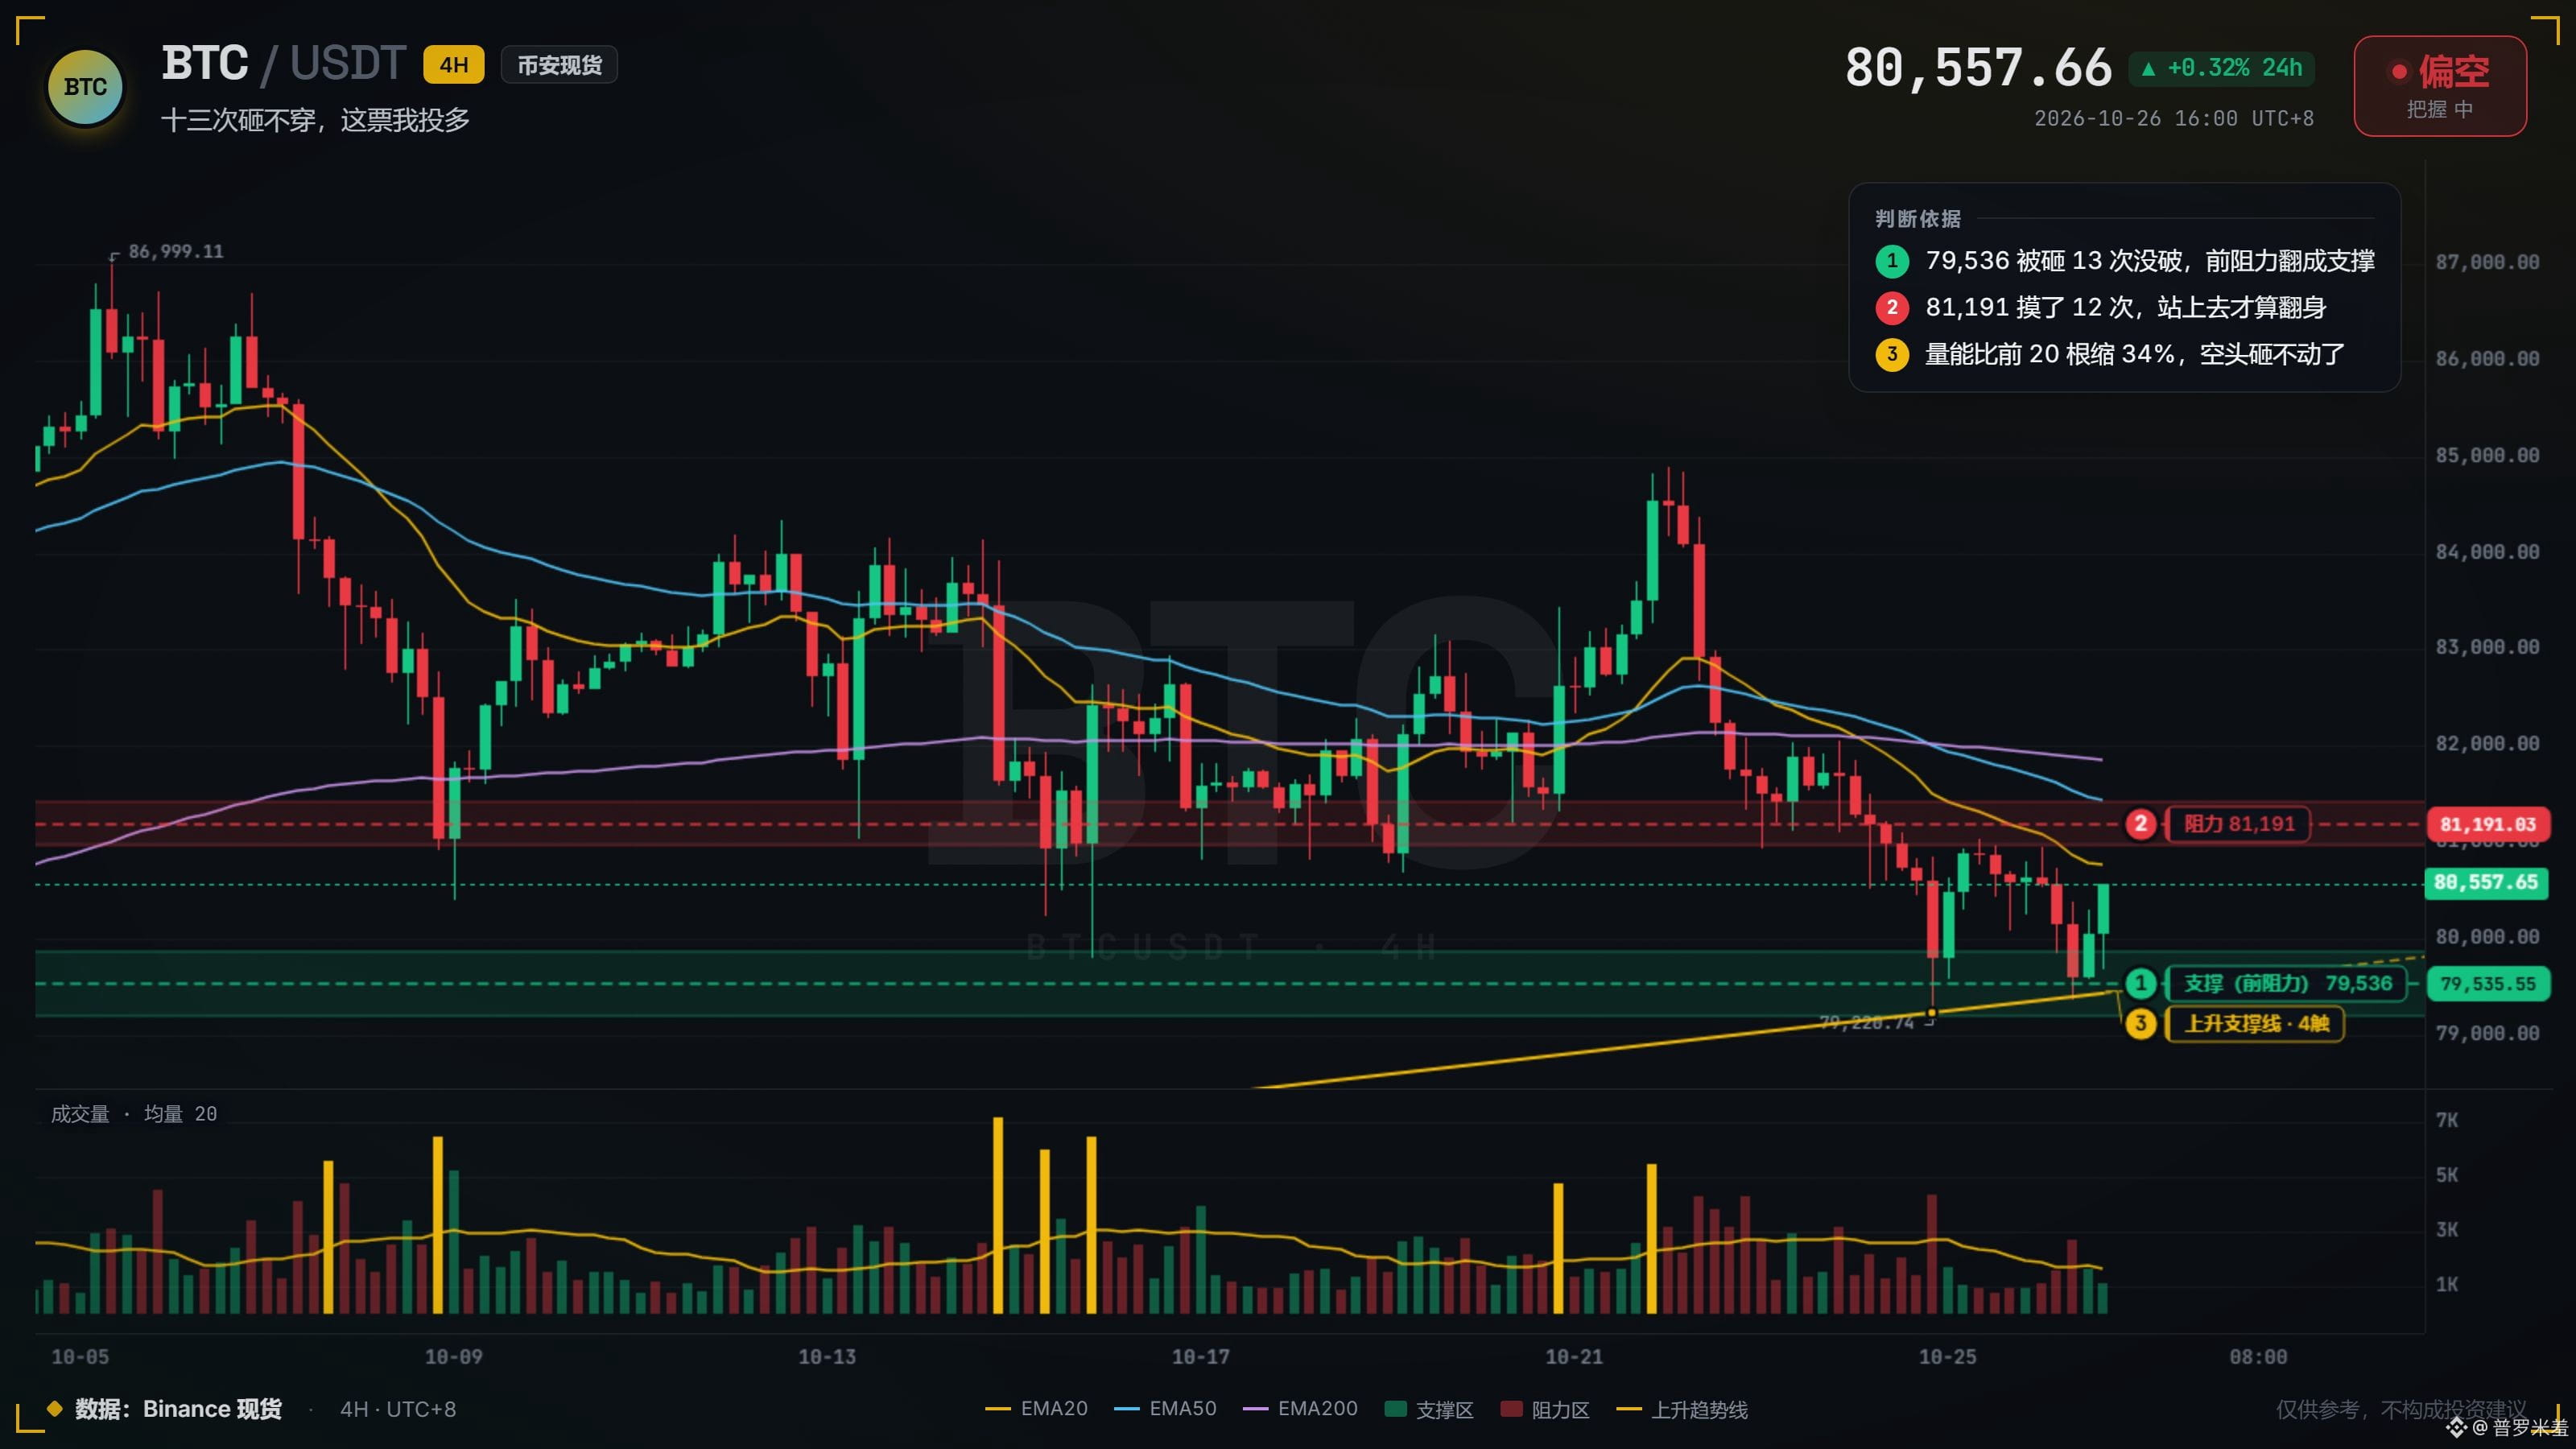
$BTC 79,536 has been hammered thirteen times. Now it’s acting as support, and volume is down 30%—they can’t push it lower anymore. More than half the leaderboard is waiting for a big red candle. I’m betting the other way: above 81,191 this week. That’s the resistance level it’s tested twelve times without breaking. If it breaks through, these bears will have to change their tune overnight. #BinancePick
$BTC 79,536 has been hammered thirteen times. Now it’s acting as support, and volume is down 30%—they can’t push it lower anymore. More than half the leaderboard is waiting for a big red candle. I’m betting the other way: above 81,191 this week. That’s the resistance level it’s tested twelve times without breaking. If it breaks through, these bears will have to change their tune overnight. #BinancePick

70
·
--
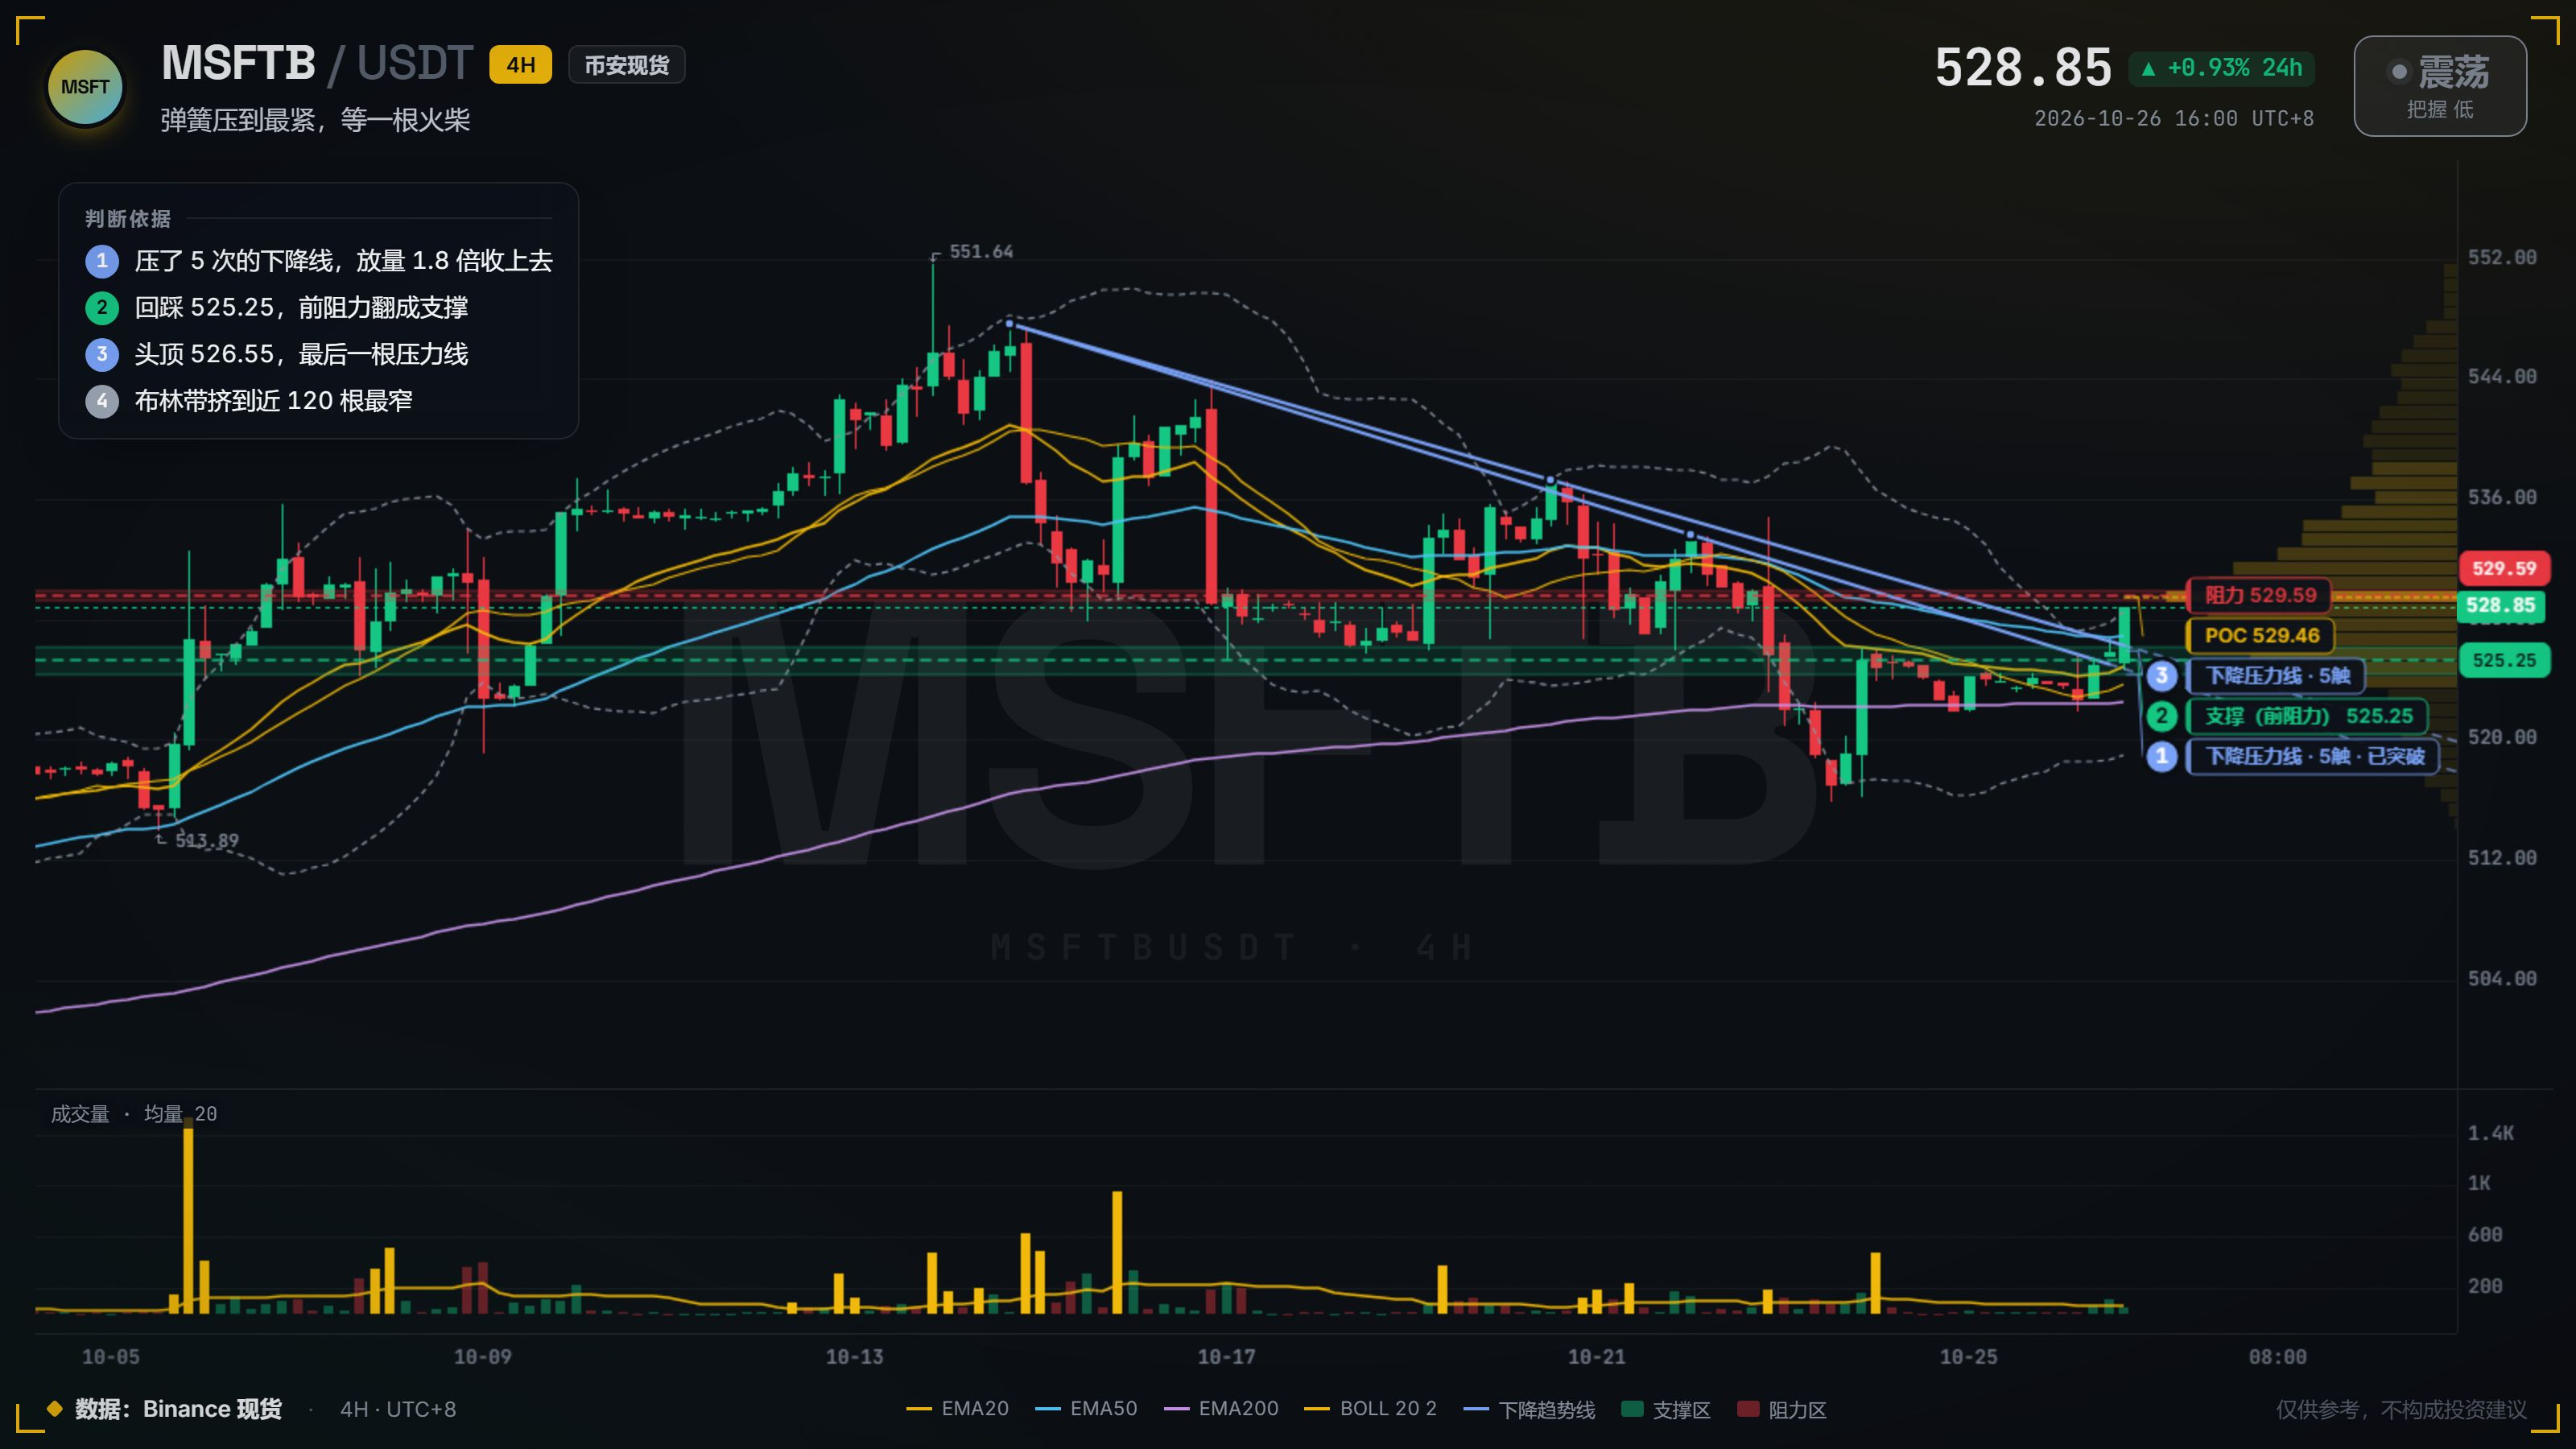
$MSFTB This chart is like a tightly wound spring right now. It broke above the downtrend line that had capped it five times on a surge in volume, and held 525 on the retest. The Bollinger Bands have squeezed to their narrowest in nearly 120 bars, with all that energy bottled up inside. The only level overhead is 529.
Earnings season is here, and the match is practically at hand. I’ve seen plenty of charts coiled up like this; when they explode, they never give you a warning.
#EarningsSeason #美股超话
Earnings season is here, and the match is practically at hand. I’ve seen plenty of charts coiled up like this; when they explode, they never give you a warning.
#EarningsSeason #美股超话
·
--
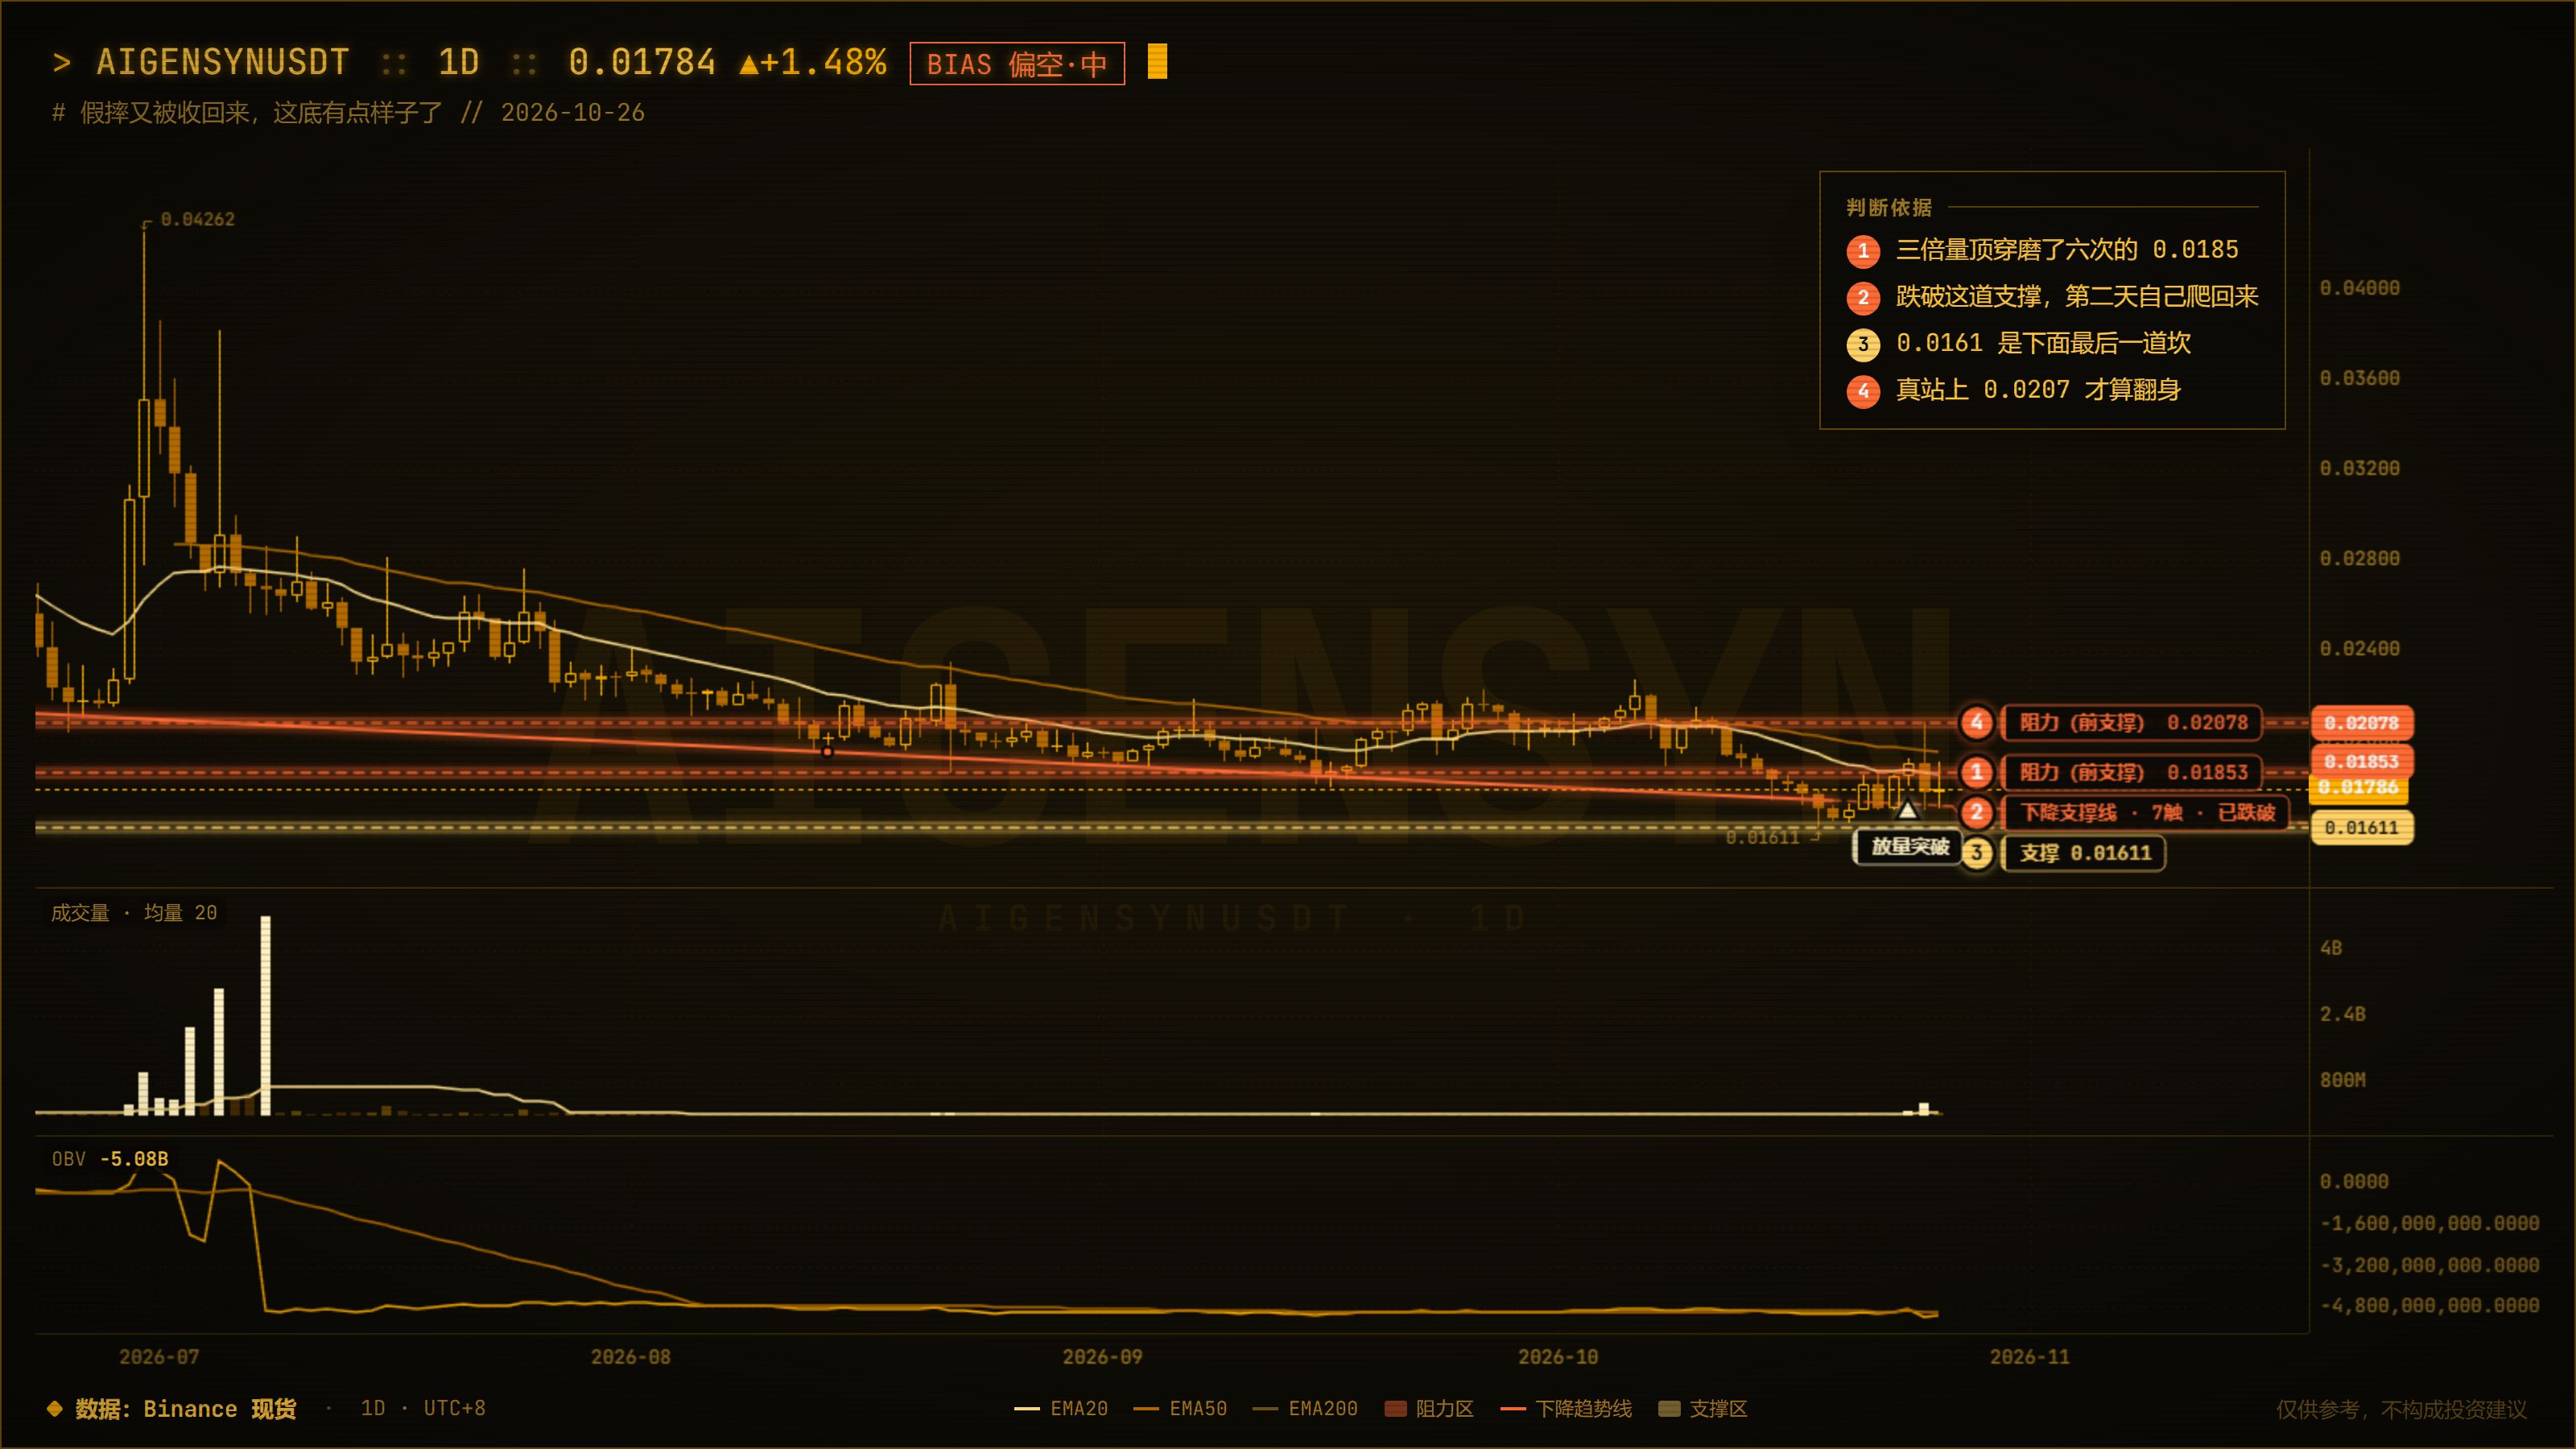
How many of you are still holding $AIGENSYN ?
0.01853 is acting as a ceiling, and the price just can't break through. It's still falling, but the decline is losing steam. 0.01611 is my final line in the sand.
Even obscure coins have their day in the sun. Only those who can hold on long enough will see it.
0.01853 is acting as a ceiling, and the price just can't break through. It's still falling, but the decline is losing steam. 0.01611 is my final line in the sand.
Even obscure coins have their day in the sun. Only those who can hold on long enough will see it.
164
·
--
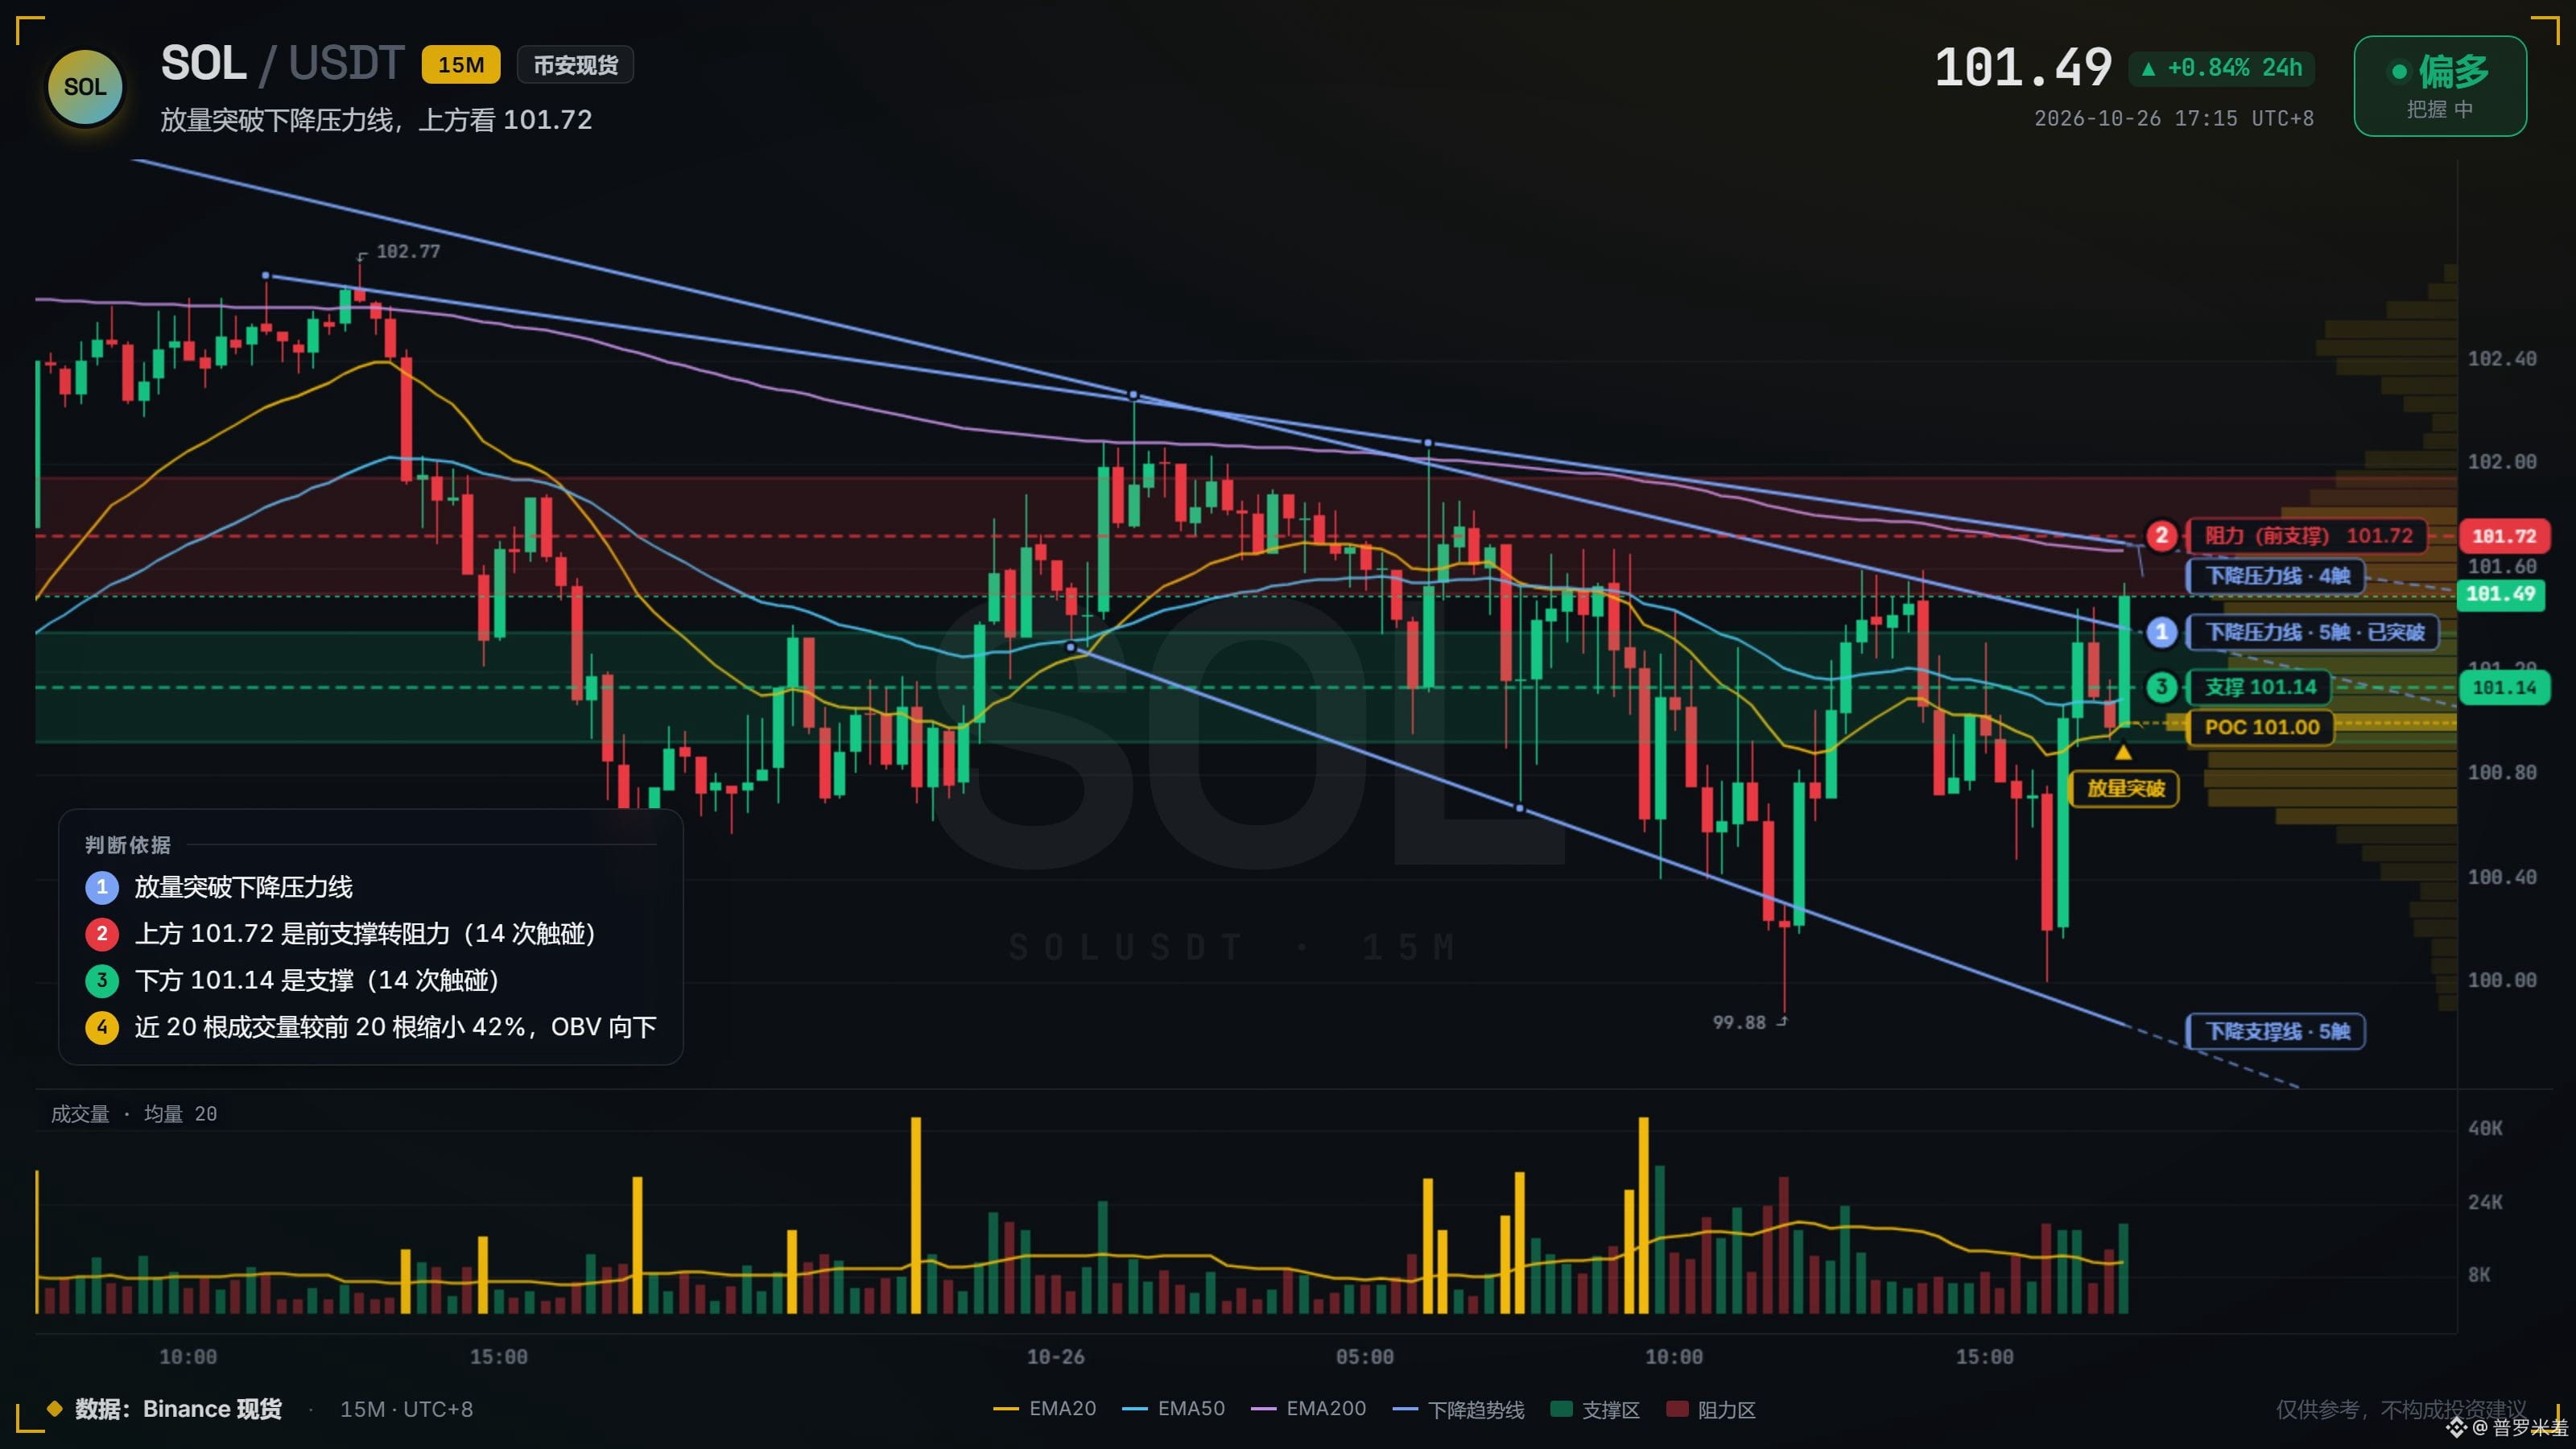
$SOL The descending resistance line had been tested five times, and just now a candle closed above it on 1.7x volume.
The first candle of a breakout like this is never a place to go short. What shorts fear most is a door that’s been shut in their faces for half a day suddenly swinging open. First watch 101.72—the former support, tested fourteen times, has turned into resistance. If price gets above it, look toward 103.69.
After such a long stretch of dwindling volume, when it finally breaks, it won’t go easy on anyone.
446
Log in to explore more content
Join global crypto users on Binance Square
⚡️ Get latest and useful information about crypto.
💬 Trusted by the world’s largest crypto exchange.
👍 Discover real insights from verified creators.
Email / Phone number