
Phuc Plugito
498 Posts

Phuc Plugito
Report
Block User
Occasional Trader
3.2 Years
1 Following
67 Followers
567 Liked
Posts
·
--
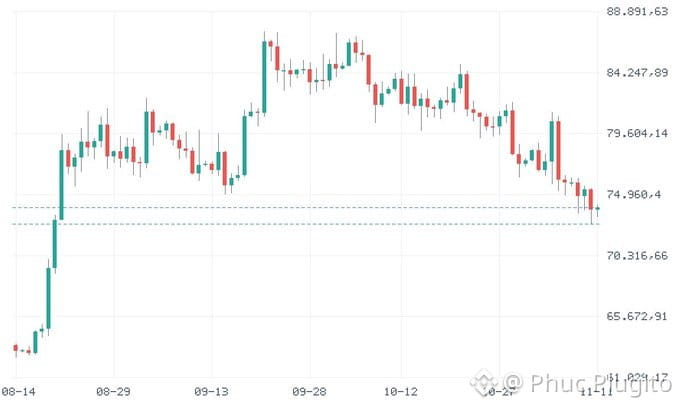
$BTC RSI is below 50. Over 24 hours, $BTC has declined slightly. The recorded price is 73,975.3
RSI on the daily candle closed at 34.07. Downward moves are still slightly stronger; a rebound needs more evidence.
Support at 72,727.3: an H4 close below would confirm the loss of the support zone.
$BTC RSI is below 50. Over 24 hours, $BTC has declined slightly. The recorded price is 73,975.3
RSI on the daily candle closed at 34.07. Downward moves are still slightly stronger; a rebound needs more evidence.
Support at 72,727.3: an H4 close below would confirm the loss of the support zone.
RSI on the daily candle closed at 34.07. Downward moves are still slightly stronger; a rebound needs more evidence.
Support at 72,727.3: an H4 close below would confirm the loss of the support zone.
167
·
--
One detail about $PYTH : MFI is below the 50 mark.
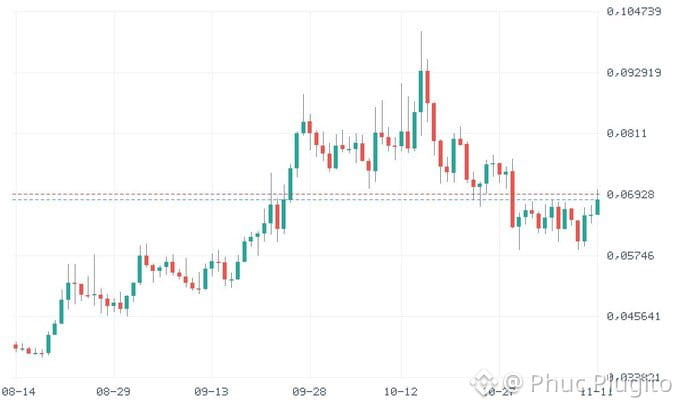
$PYTH is at $0.06831, up sharply by 3.85% in 24 hours.
The BOT signals are mixed: H4 BULL, D1 BEAR. The rebound needs to be read against a downtrend. MFI on the closed daily candle was 42.94. Price and volume in the calculation are leaning bearish. This does not represent money flowing into or out of the coin.
Resistance at 0.069393 $USDT: a D1 close above this level is needed to confirm a breakout.
One detail about $PYTH : MFI is below the 50 mark.
$PYTH is at $0.06831, up sharply by 3.85% in 24 hours.
The BOT signals are mixed: H4 BULL, D1 BEAR. The rebound needs to be read against a downtrend. MFI on the closed daily candle was 42.94. Price and volume in the calculation are leaning bearish. This does not represent money flowing into or out of the coin.
Resistance at 0.069393 $USDT: a D1 close above this level is needed to confirm a breakout.
$PYTH is at $0.06831, up sharply by 3.85% in 24 hours.
The BOT signals are mixed: H4 BULL, D1 BEAR. The rebound needs to be read against a downtrend. MFI on the closed daily candle was 42.94. Price and volume in the calculation are leaning bearish. This does not represent money flowing into or out of the coin.
Resistance at 0.069393 $USDT: a D1 close above this level is needed to confirm a breakout.
1
102
·
--
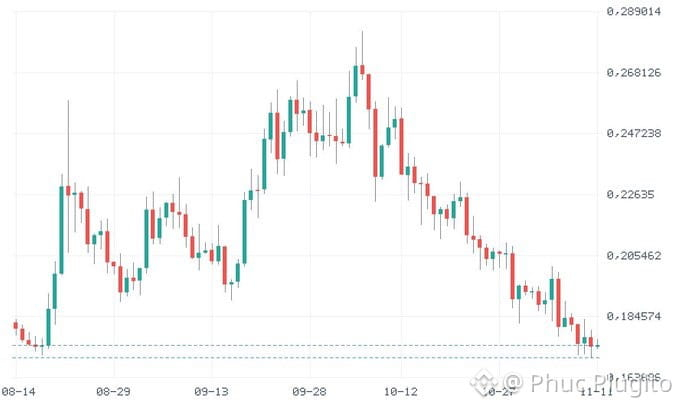
At $ADA , bearish pressure is present on both timeframes. Support at $0.1704: an H4 close below would confirm a loss of the support zone.
At this update, ADA is priced at $0.1747, slightly lower than 24 hours ago.
The Stochastic on the closed daily candle leans bearish. The indicator is low, but that does not confirm that the price has bottomed.
Both the 4-hour and daily timeframes lean bearish.
At $ADA , bearish pressure is present on both timeframes. Support at $0.1704: an H4 close below would confirm a loss of the support zone.
At this update, ADA is priced at $0.1747, slightly lower than 24 hours ago.
The Stochastic on the closed daily candle leans bearish. The indicator is low, but that does not confirm that the price has bottomed.
Both the 4-hour and daily timeframes lean bearish.
At this update, ADA is priced at $0.1747, slightly lower than 24 hours ago.
The Stochastic on the closed daily candle leans bearish. The indicator is low, but that does not confirm that the price has bottomed.
Both the 4-hour and daily timeframes lean bearish.
2
233
·
--
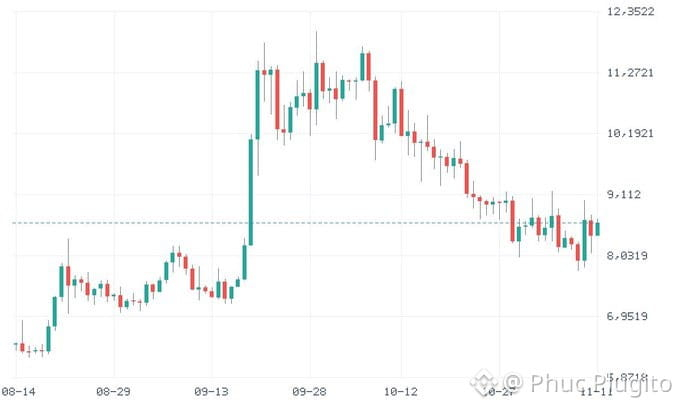
$AVAX DMI leans bearish. $AVAX At 8,609, up slightly over 24 hours.
DMI on the closed daily candle shows bearish momentum edging ahead. ADX is still below 25, so the trend lacks clear strength.
Comparing the two timeframes: BOT signals BEAR on both H4 and D1. EMA on H4 is not yet aligned with this status.
This update has no suitable nearby levels to confirm a breakout or a loss of support.
$AVAX DMI leans bearish. $AVAX At 8,609, up slightly over 24 hours.
DMI on the closed daily candle shows bearish momentum edging ahead. ADX is still below 25, so the trend lacks clear strength.
Comparing the two timeframes: BOT signals BEAR on both H4 and D1. EMA on H4 is not yet aligned with this status.
This update has no suitable nearby levels to confirm a breakout or a loss of support.
DMI on the closed daily candle shows bearish momentum edging ahead. ADX is still below 25, so the trend lacks clear strength.
Comparing the two timeframes: BOT signals BEAR on both H4 and D1. EMA on H4 is not yet aligned with this status.
This update has no suitable nearby levels to confirm a breakout or a loss of support.
1
225
·
--
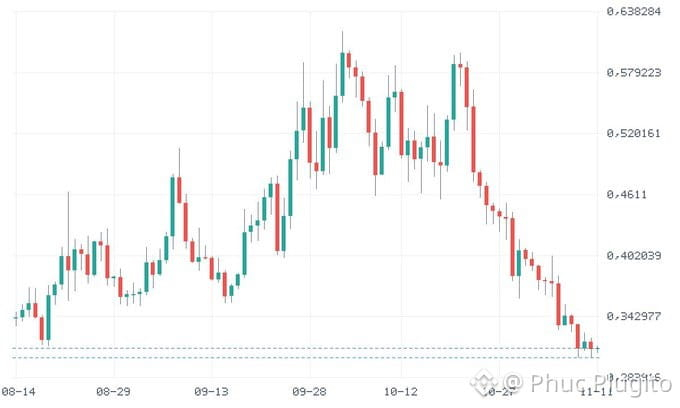
$WLD Regression is sloping downward and is below the signal. Price: 0.3124; 24-hour change: slightly down.
On the closed daily candle, regression is sloping downward and is below the signal. This indicator alone is not enough to conclude that the price trend has changed.
The 4-hour move is downward, in line with the daily trend.
Support at 0.3029: An H4 close below this level would confirm a loss of support.
$WLD Regression is sloping downward and is below the signal. Price: 0.3124; 24-hour change: slightly down.
On the closed daily candle, regression is sloping downward and is below the signal. This indicator alone is not enough to conclude that the price trend has changed.
The 4-hour move is downward, in line with the daily trend.
Support at 0.3029: An H4 close below this level would confirm a loss of support.
On the closed daily candle, regression is sloping downward and is below the signal. This indicator alone is not enough to conclude that the price trend has changed.
The 4-hour move is downward, in line with the daily trend.
Support at 0.3029: An H4 close below this level would confirm a loss of support.
1
898
·
--
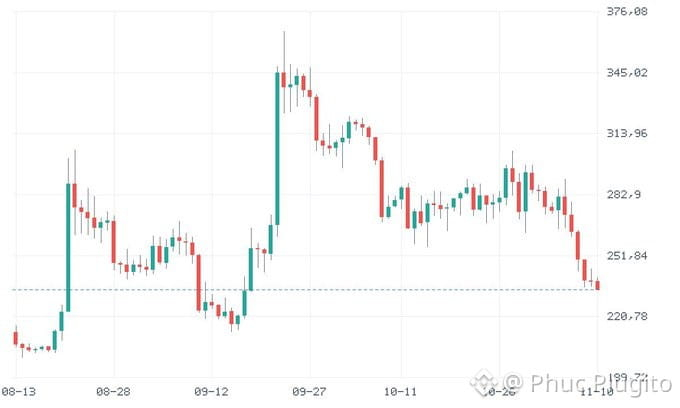
Over 24 hours, $BCH declined slightly. The recorded price was 234.38
CCI on the closed daily candle shows the price is significantly weaker than its recent baseline. A substantial decline isn't enough to conclude that a bottom has been reached.
This update doesn't have a suitable nearby level to confirm a breakout or loss of support.
Over 24 hours, $BCH declined slightly. The recorded price was 234.38
CCI on the closed daily candle shows the price is significantly weaker than its recent baseline. A substantial decline isn't enough to conclude that a bottom has been reached.
This update doesn't have a suitable nearby level to confirm a breakout or loss of support.
CCI on the closed daily candle shows the price is significantly weaker than its recent baseline. A substantial decline isn't enough to conclude that a bottom has been reached.
This update doesn't have a suitable nearby level to confirm a breakout or loss of support.
1
310
·
--
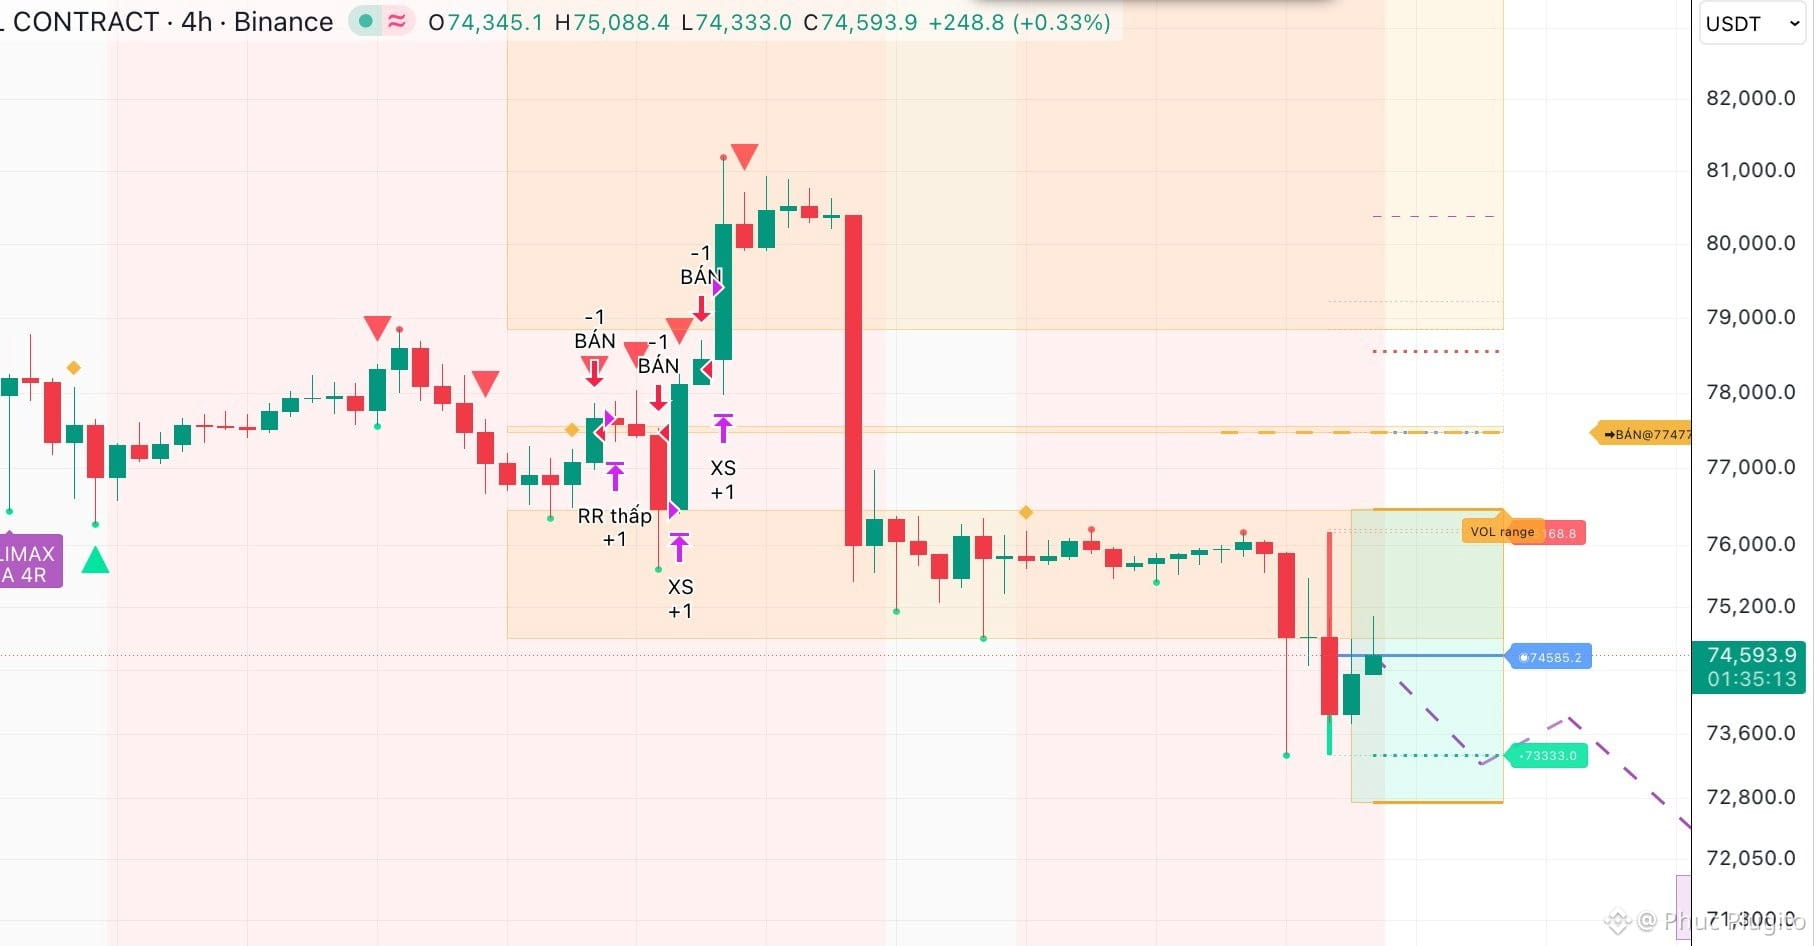
$BTC 21h 09/11/2026 BTC 4H
The bears are waiting for price to pull back to 77,477 before firing another -1 sell. D1 and H4 are both trending down, so the bears still have the upper hand.
The bulls (longs) have lost much of their upward momentum after being hit hard by the bears (shorts).
Tonight, price may chop around 75.5–76.5, then get pushed down if it loses 75.0. The bears remain in control.
$BTC 21h 09/11/2026 BTC 4H
The bears are waiting for price to pull back to 77,477 before firing another -1 sell. D1 and H4 are both trending down, so the bears still have the upper hand.
The bulls (longs) have lost much of their upward momentum after being hit hard by the bears (shorts).
Tonight, price may chop around 75.5–76.5, then get pushed down if it loses 75.0. The bears remain in control.
The bears are waiting for price to pull back to 77,477 before firing another -1 sell. D1 and H4 are both trending down, so the bears still have the upper hand.
The bulls (longs) have lost much of their upward momentum after being hit hard by the bears (shorts).
Tonight, price may chop around 75.5–76.5, then get pushed down if it loses 75.0. The bears remain in control.
1
373
·
--
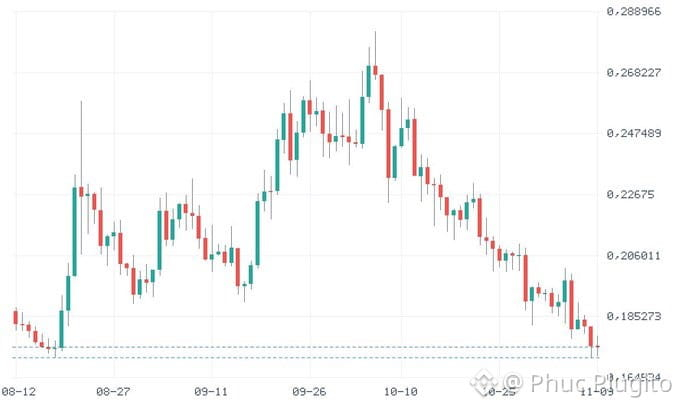
H4 and D1 for $ADA are both trending downward. This is the context for reading OBV.
$ADA is slightly down at 0.175 over the past 24 hours.
Support at 0.1713: an H4 close below this level will confirm a loss of the support zone.
The daily OBV candle closed lower than it did three days ago. Over the past three days, the volume subtracted on down days has outweighed the volume added on up days. The downward direction is confirmed by both the 4-hour and daily charts.
H4 and D1 for $ADA are both trending downward. This is the context for reading OBV.
$ADA is slightly down at 0.175 over the past 24 hours.
Support at 0.1713: an H4 close below this level will confirm a loss of the support zone.
The daily OBV candle closed lower than it did three days ago. Over the past three days, the volume subtracted on down days has outweighed the volume added on up days. The downward direction is confirmed by both the 4-hour and daily charts.
$ADA is slightly down at 0.175 over the past 24 hours.
Support at 0.1713: an H4 close below this level will confirm a loss of the support zone.
The daily OBV candle closed lower than it did three days ago. Over the past three days, the volume subtracted on down days has outweighed the volume added on up days. The downward direction is confirmed by both the 4-hour and daily charts.
1
2
721
·
--
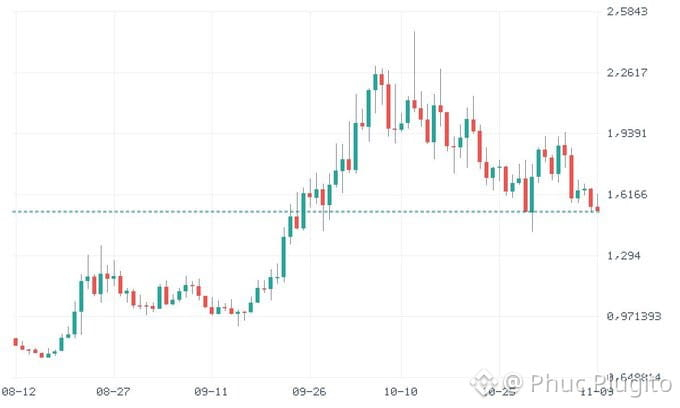
H4 and D1 of $ZRO are both sloping downward. This is the context for reading MFI.
Price: 1.53; the 24-hour change is a sharp drop of 4.49%.
Support at 1.5239: an H4 close below this level will confirm a loss of the support zone.
MFI on the daily candle closed at 62.25. Price and volume in the calculation are leaning bullish. This does not represent money deposited into or withdrawn from the coin. H4 BEAR and D1 BEAR have been confirmed by the BOT signal. The two timeframes are in agreement.
H4 and D1 of $ZRO are both sloping downward. This is the context for reading MFI.
Price: 1.53; the 24-hour change is a sharp drop of 4.49%.
Support at 1.5239: an H4 close below this level will confirm a loss of the support zone.
MFI on the daily candle closed at 62.25. Price and volume in the calculation are leaning bullish. This does not represent money deposited into or withdrawn from the coin. H4 BEAR and D1 BEAR have been confirmed by the BOT signal. The two timeframes are in agreement.
Price: 1.53; the 24-hour change is a sharp drop of 4.49%.
Support at 1.5239: an H4 close below this level will confirm a loss of the support zone.
MFI on the daily candle closed at 62.25. Price and volume in the calculation are leaning bullish. This does not represent money deposited into or withdrawn from the coin. H4 BEAR and D1 BEAR have been confirmed by the BOT signal. The two timeframes are in agreement.
2
331
·
--
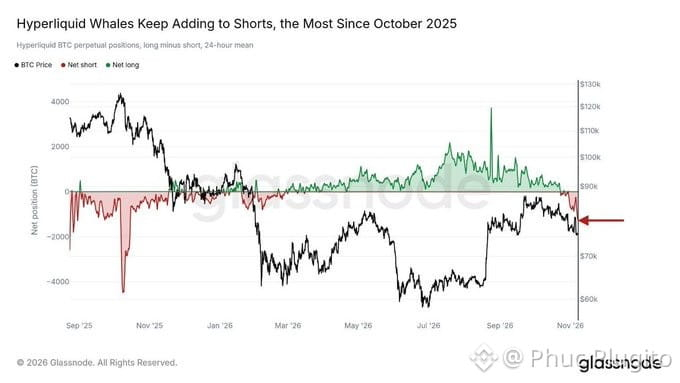
🐋WHALE WATCH: Did a Hyperliquid whale just switch sides after 7 months?
Whales are no longer on the same side as the crowd.
According to Glassnode, the whale group above $HYPE shifted from long to short $BTC after 7 months. Short exposure is now at its highest level since October 2025.
This isn’t a signal to call the top or bottom. But when big wallets change direction, market sentiment is often worth watching more closely than price.
🐋WHALE WATCH: Did a Hyperliquid whale just switch sides after 7 months?
Whales are no longer on the same side as the crowd.
According to Glassnode, the whale group above $HYPE shifted from long to short $BTC after 7 months. Short exposure is now at its highest level since October 2025.
This isn’t a signal to call the top or bottom. But when big wallets change direction, market sentiment is often worth watching more closely than price.
Whales are no longer on the same side as the crowd.
According to Glassnode, the whale group above $HYPE shifted from long to short $BTC after 7 months. Short exposure is now at its highest level since October 2025.
This isn’t a signal to call the top or bottom. But when big wallets change direction, market sentiment is often worth watching more closely than price.
1
1k
·
--
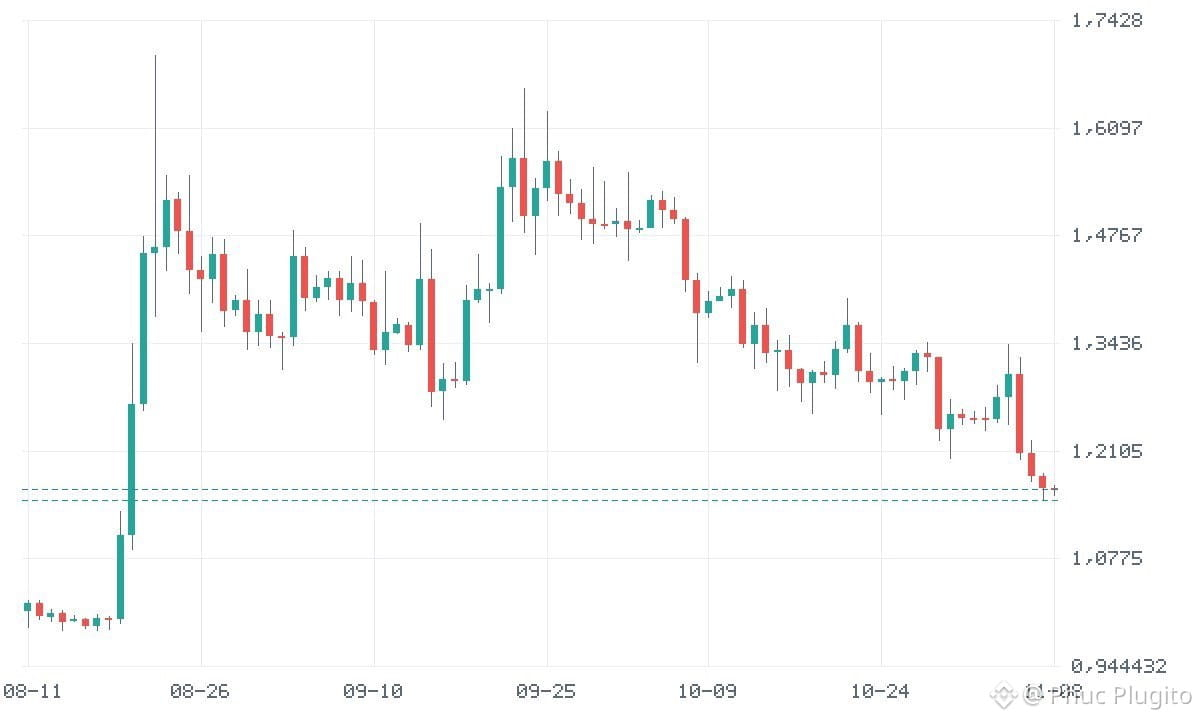
$XRP slightly down over 24 hours. Also check the RSI on the closed daily candle.
The RSI on the closed daily candle is at 31.62. Downward moves still have the edge; the rebound needs more confirmation.
$XRP at 1.1631 $USDT, slightly down over 24 hours. Compare the two timeframes: BOT signals BEAR on H4 and BULL on D1. The EMA on D1 is not yet aligned with this status.
Support at 1.1495 $USDT: an H4 close below would confirm a loss of support.
$XRP slightly down over 24 hours. Also check the RSI on the closed daily candle.
The RSI on the closed daily candle is at 31.62. Downward moves still have the edge; the rebound needs more confirmation.
$XRP at 1.1631 $USDT, slightly down over 24 hours. Compare the two timeframes: BOT signals BEAR on H4 and BULL on D1. The EMA on D1 is not yet aligned with this status.
Support at 1.1495 $USDT: an H4 close below would confirm a loss of support.
The RSI on the closed daily candle is at 31.62. Downward moves still have the edge; the rebound needs more confirmation.
$XRP at 1.1631 $USDT, slightly down over 24 hours. Compare the two timeframes: BOT signals BEAR on H4 and BULL on D1. The EMA on D1 is not yet aligned with this status.
Support at 1.1495 $USDT: an H4 close below would confirm a loss of support.
1
325
·
--
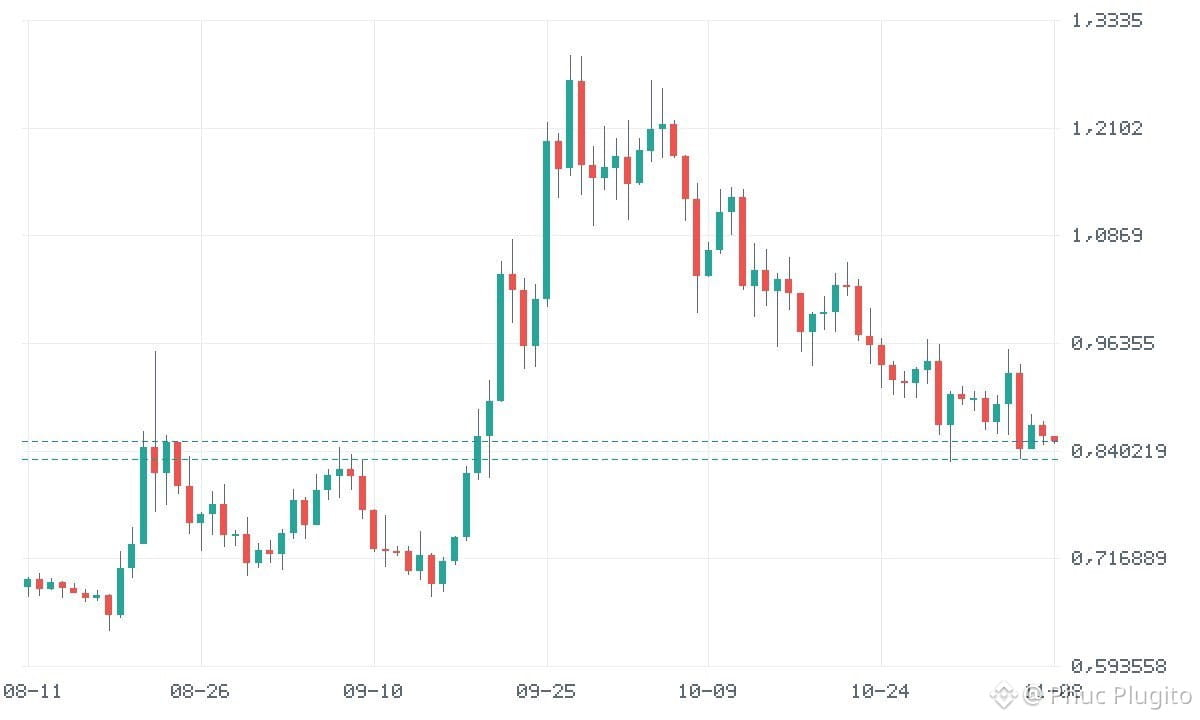
At $SUI , bearish pressure is present on both timeframes.
The Stochastic on the closed daily candle leans bearish. The indicator is low, but that does not confirm that price has bottomed.
The 4-hour move is also bearish, in line with the daily trend.
$SUI at 0.8514 $USDT, down slightly over 24 hours. Support is at 0.8303 $USDT: an H4 close below this level would confirm a loss of support.
At $SUI , bearish pressure is present on both timeframes.
The Stochastic on the closed daily candle leans bearish. The indicator is low, but that does not confirm that price has bottomed.
The 4-hour move is also bearish, in line with the daily trend.
$SUI at 0.8514 $USDT, down slightly over 24 hours. Support is at 0.8303 $USDT: an H4 close below this level would confirm a loss of support.
The Stochastic on the closed daily candle leans bearish. The indicator is low, but that does not confirm that price has bottomed.
The 4-hour move is also bearish, in line with the daily trend.
$SUI at 0.8514 $USDT, down slightly over 24 hours. Support is at 0.8303 $USDT: an H4 close below this level would confirm a loss of support.
1
516
·
--
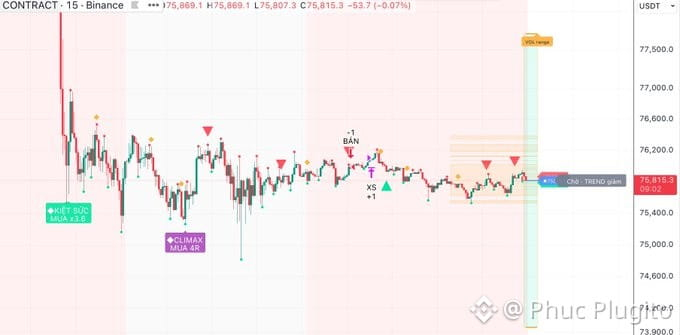
$BTC 11h 08/11/2026 BTC M15 chart
Our side (long) just reached a climax and fired off all its momentum in the buying climax zone, then became exhausted x3.6. The buying pressure has gone limp.
The enemy (short) immediately fired a sell shot -1, pushing the price down and waiting for the downtrend to continue.
Our side is trying to hold 75,800, but the enemy still has the upper hand and is ready to push harder if 75,500 breaks.
$BTC 11h 08/11/2026 BTC M15 chart
Our side (long) just reached a climax and fired off all its momentum in the buying climax zone, then became exhausted x3.6. The buying pressure has gone limp.
The enemy (short) immediately fired a sell shot -1, pushing the price down and waiting for the downtrend to continue.
Our side is trying to hold 75,800, but the enemy still has the upper hand and is ready to push harder if 75,500 breaks.
Our side (long) just reached a climax and fired off all its momentum in the buying climax zone, then became exhausted x3.6. The buying pressure has gone limp.
The enemy (short) immediately fired a sell shot -1, pushing the price down and waiting for the downtrend to continue.
Our side is trying to hold 75,800, but the enemy still has the upper hand and is ready to push harder if 75,500 breaks.
1
329
·
--
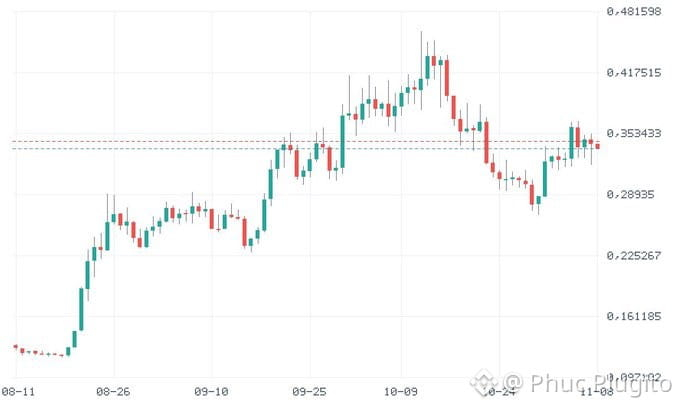
At this update, $STX is priced at 0.3377; slightly down compared with 24 hours ago.
The 4-hour momentum is weaker; the daily base still maintains an upward direction. The EMA on H4/D1 is not yet aligned with this state.
On the closed daily candle, the regression slopes upward and is above the signal. This one indicator is not enough to conclude that the price has changed trend.
Resistance at 0.345514: a D1 close above is needed to confirm a breakout.
At this update, $STX is priced at 0.3377; slightly down compared with 24 hours ago.
The 4-hour momentum is weaker; the daily base still maintains an upward direction. The EMA on H4/D1 is not yet aligned with this state.
On the closed daily candle, the regression slopes upward and is above the signal. This one indicator is not enough to conclude that the price has changed trend.
Resistance at 0.345514: a D1 close above is needed to confirm a breakout.
The 4-hour momentum is weaker; the daily base still maintains an upward direction. The EMA on H4/D1 is not yet aligned with this state.
On the closed daily candle, the regression slopes upward and is above the signal. This one indicator is not enough to conclude that the price has changed trend.
Resistance at 0.345514: a D1 close above is needed to confirm a breakout.
1
130
·
--
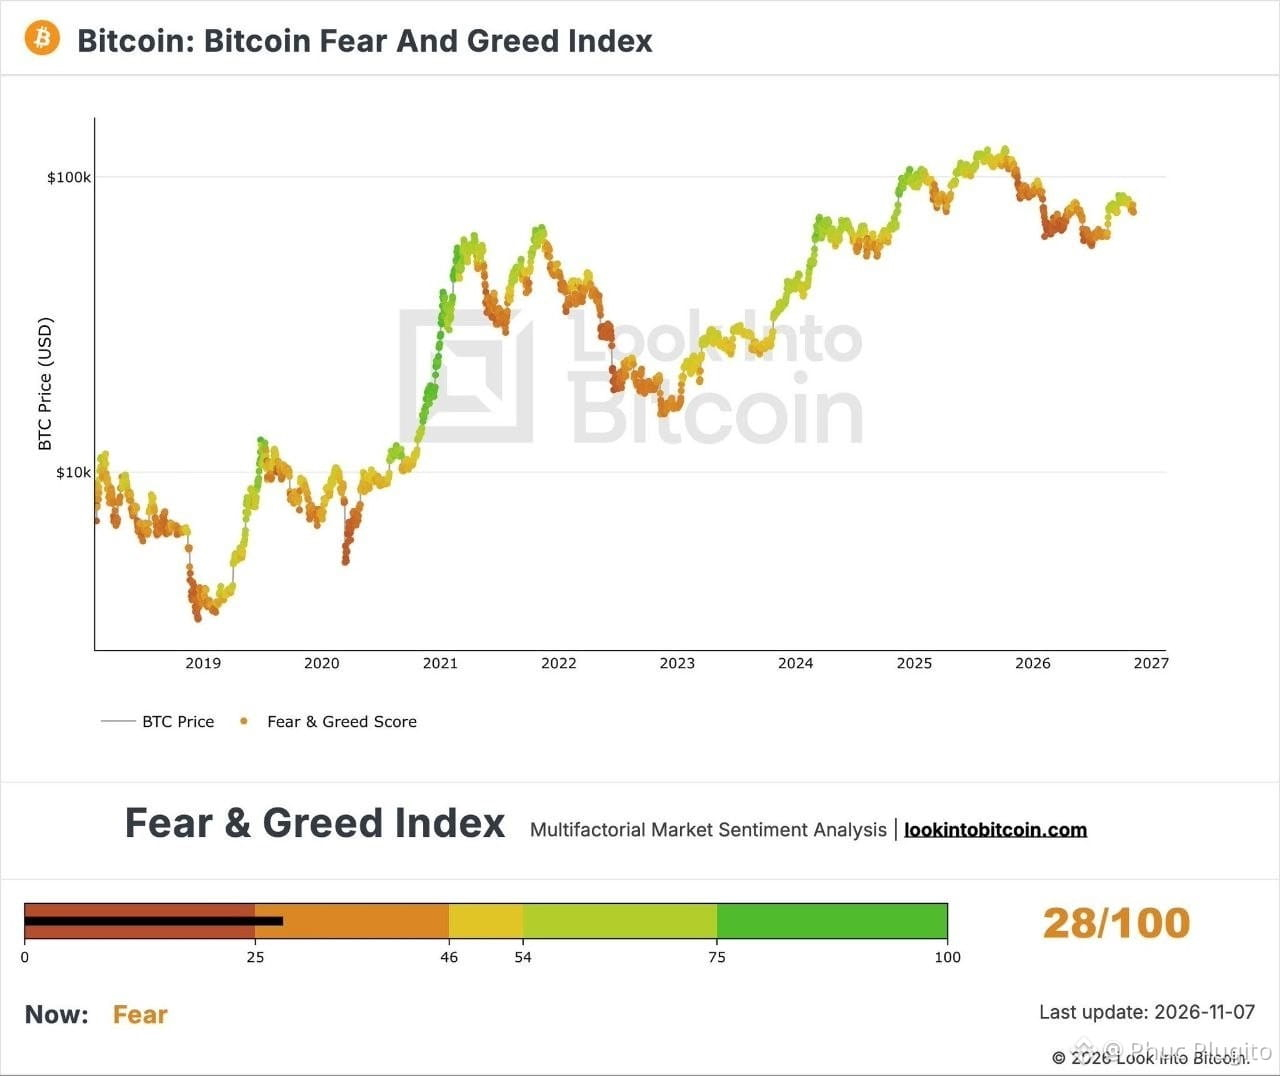
🔍 INSIGHT: Fear is back, but $BTC still hasn’t broken
The market is afraid, but the price hasn’t broken.
The Fear & Greed Index fell to 28, in the “Fear” zone, while Bitcoin is still holding above $75,000.
The gap between sentiment and price is often where the crowd is most likely to react too soon.
🔍 INSIGHT: Fear is back, but $BTC still hasn’t broken
The market is afraid, but the price hasn’t broken.
The Fear & Greed Index fell to 28, in the “Fear” zone, while Bitcoin is still holding above $75,000.
The gap between sentiment and price is often where the crowd is most likely to react too soon.
The market is afraid, but the price hasn’t broken.
The Fear & Greed Index fell to 28, in the “Fear” zone, while Bitcoin is still holding above $75,000.
The gap between sentiment and price is often where the crowd is most likely to react too soon.
1
288
·
--
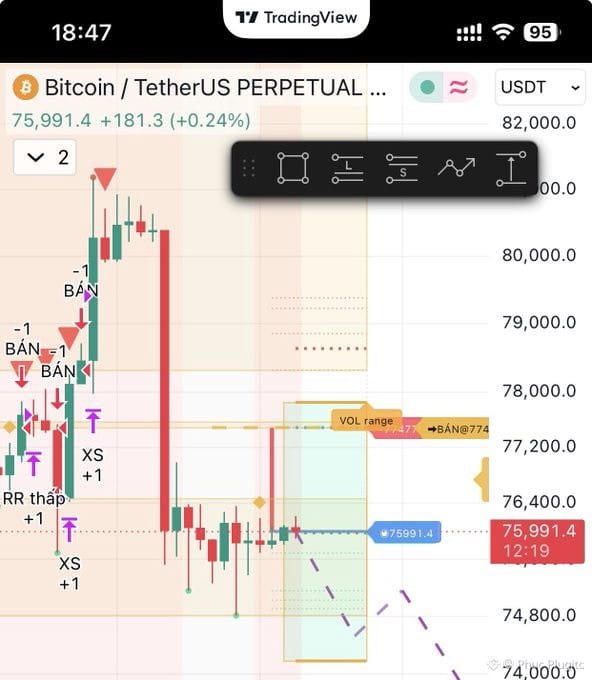
$BTC 07/11/2026 BTC H1 timeframe
Our side (longs) is trying to hold the 75.991 area after being hit by several consecutive heavy sell shots from the enemy (shorts), sending the price straight down from above 81k.
The enemy has just run out of steam; a few low-RR shots, like those from a weak quarter, weren’t enough to push the price any lower. Now the price is sitting right near the area our side is defending.
The enemy is still waiting for a bounce to 77.477 so they can fire again. Our side is holding its position, ready to counterattack if it can hold 75.5–76k.
$BTC 07/11/2026 BTC H1 timeframe
Our side (longs) is trying to hold the 75.991 area after being hit by several consecutive heavy sell shots from the enemy (shorts), sending the price straight down from above 81k.
The enemy has just run out of steam; a few low-RR shots, like those from a weak quarter, weren’t enough to push the price any lower. Now the price is sitting right near the area our side is defending.
The enemy is still waiting for a bounce to 77.477 so they can fire again. Our side is holding its position, ready to counterattack if it can hold 75.5–76k.
Our side (longs) is trying to hold the 75.991 area after being hit by several consecutive heavy sell shots from the enemy (shorts), sending the price straight down from above 81k.
The enemy has just run out of steam; a few low-RR shots, like those from a weak quarter, weren’t enough to push the price any lower. Now the price is sitting right near the area our side is defending.
The enemy is still waiting for a bounce to 77.477 so they can fire again. Our side is holding its position, ready to counterattack if it can hold 75.5–76k.
1
37
·
--
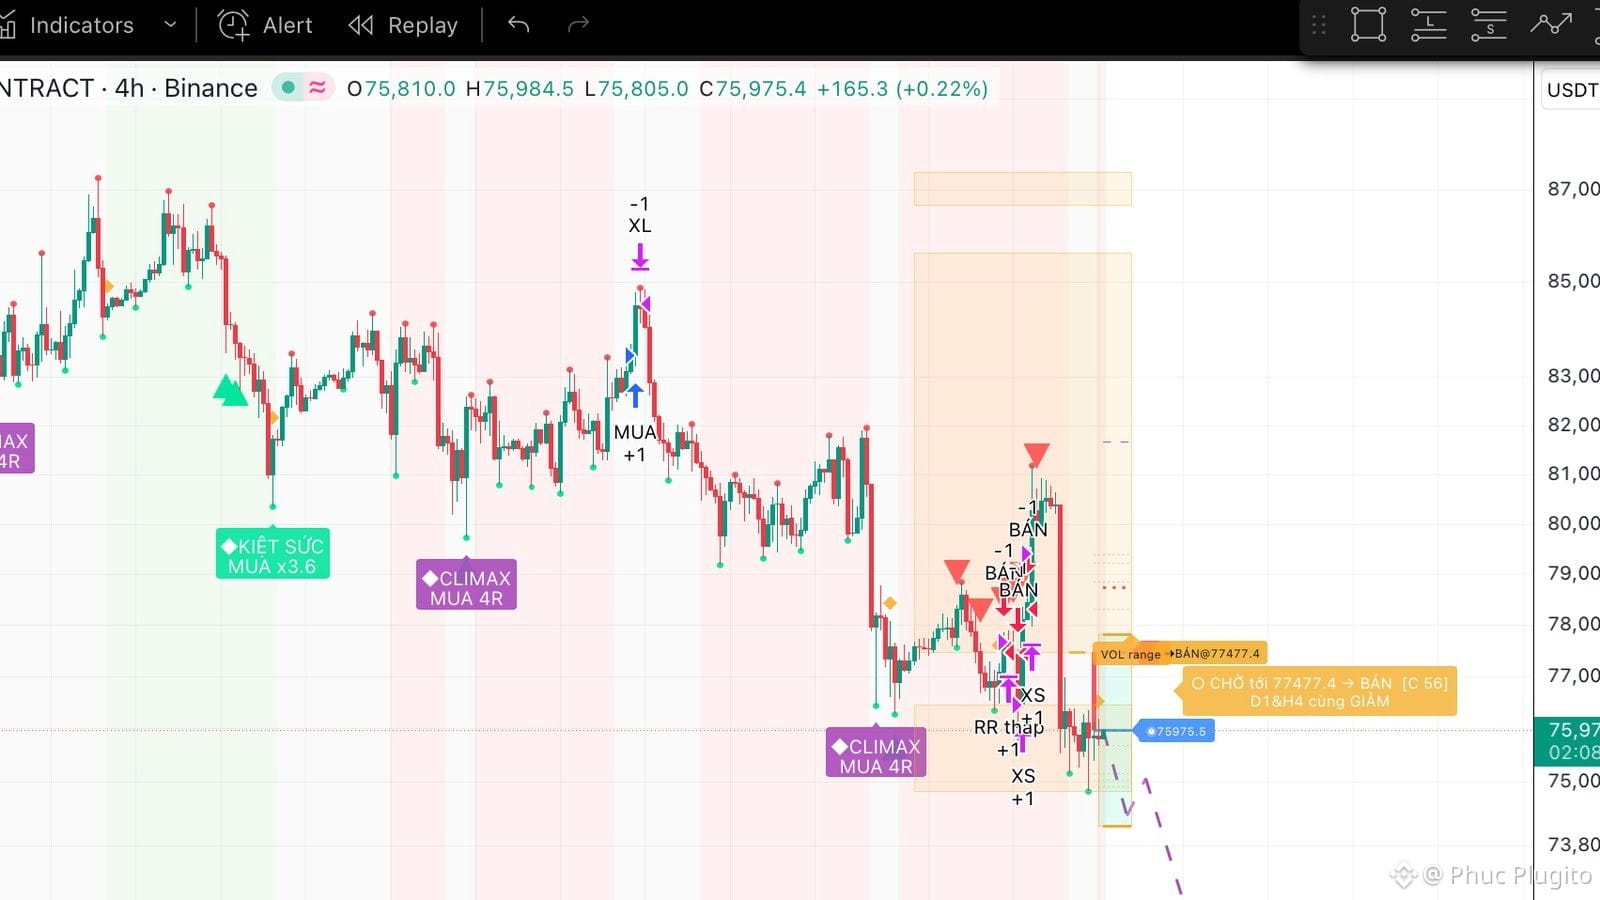
$BTC morning 07/11/2026 BTC 4H timeframe
Too much geopolitical news -> The final event still hasn't happened!
The enemy is gaining the upper hand in this battle. Our side can only hold its ground and isn't strong enough to counterattack yet.
Resistance zones (held by the enemy):
- 77.477–78.000: the enemy is waiting for our side to crawl up so they can shoot down (explicitly marked SELL 77477.4)
- 79.000–81.000: a resistance cluster where the enemy has just pushed down hard, with many consecutive red candles
- 84.500–87.000: a higher resistance zone, where our side was previously pushed down hard
Support zones (our side is trying to hold):
- 75.500–75.975: the current battleground; the price is here
- 74.800–75.200: nearby support below; if it gives way, the enemy could push down further
- 73.800: lower support on the chart
Our side is currently being pressed against the 75.5–76k zone, while the enemy is waiting for the price to rebound to 77.477 so they can attack again.
$BTC morning 07/11/2026 BTC 4H timeframe
Too much geopolitical news -> The final event still hasn't happened!
The enemy is gaining the upper hand in this battle. Our side can only hold its ground and isn't strong enough to counterattack yet.
Resistance zones (held by the enemy):
- 77.477–78.000: the enemy is waiting for our side to crawl up so they can shoot down (explicitly marked SELL 77477.4)
- 79.000–81.000: a resistance cluster where the enemy has just pushed down hard, with many consecutive red candles
- 84.500–87.000: a higher resistance zone, where our side was previously pushed down hard
Support zones (our side is trying to hold):
- 75.500–75.975: the current battleground; the price is here
- 74.800–75.200: nearby support below; if it gives way, the enemy could push down further
- 73.800: lower support on the chart
Our side is currently being pressed against the 75.5–76k zone, while the enemy is waiting for the price to rebound to 77.477 so they can attack again.
Too much geopolitical news -> The final event still hasn't happened!
The enemy is gaining the upper hand in this battle. Our side can only hold its ground and isn't strong enough to counterattack yet.
Resistance zones (held by the enemy):
- 77.477–78.000: the enemy is waiting for our side to crawl up so they can shoot down (explicitly marked SELL 77477.4)
- 79.000–81.000: a resistance cluster where the enemy has just pushed down hard, with many consecutive red candles
- 84.500–87.000: a higher resistance zone, where our side was previously pushed down hard
Support zones (our side is trying to hold):
- 75.500–75.975: the current battleground; the price is here
- 74.800–75.200: nearby support below; if it gives way, the enemy could push down further
- 73.800: lower support on the chart
Our side is currently being pressed against the 75.5–76k zone, while the enemy is waiting for the price to rebound to 77.477 so they can attack again.
1
282
·
--
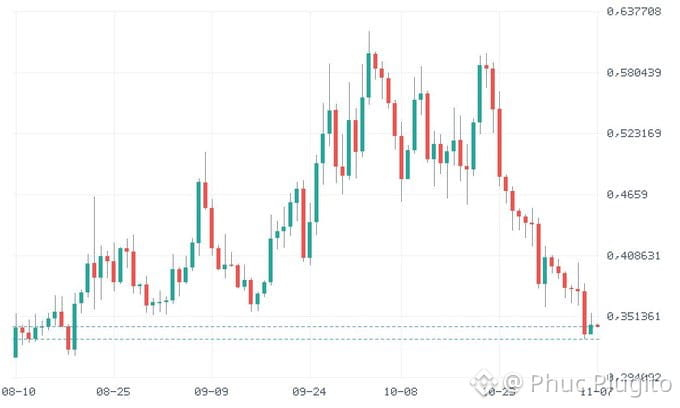
At this update, $WLD is priced at 0.3419, slightly lower than 24 hours ago.
The CCI on the closed daily candle shows that the price is significantly weaker than its recent base. A substantial decline is not enough to conclude that a bottom has been reached.
An H4 close below support at 0.3301 will confirm a loss of the support zone.
At this update, $WLD is priced at 0.3419, slightly lower than 24 hours ago.
The CCI on the closed daily candle shows that the price is significantly weaker than its recent base. A substantial decline is not enough to conclude that a bottom has been reached.
An H4 close below support at 0.3301 will confirm a loss of the support zone.
The CCI on the closed daily candle shows that the price is significantly weaker than its recent base. A substantial decline is not enough to conclude that a bottom has been reached.
An H4 close below support at 0.3301 will confirm a loss of the support zone.
1
1.4k
·
--
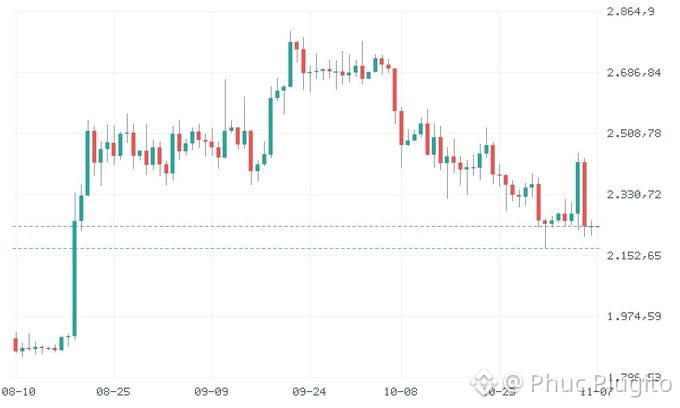
With $ETH , MFI is below the 50 mark.
H4 is BEAR but D1 is BULL according to BOT. The short-term downward move has not changed the daily baseline state. EMA on D1 is not yet aligned with this state.
At this update, ETH is priced at 2,238.9, little changed from 24 hours ago.
MFI on the closed daily candle was 40.67. Price and volume in the calculation are currently leaning bearish. This is not an amount of money deposited into or withdrawn from the coin. Support at 2,174: an H4 close below would confirm a loss of the support zone.
With $ETH , MFI is below the 50 mark.
H4 is BEAR but D1 is BULL according to BOT. The short-term downward move has not changed the daily baseline state. EMA on D1 is not yet aligned with this state.
At this update, ETH is priced at 2,238.9, little changed from 24 hours ago.
MFI on the closed daily candle was 40.67. Price and volume in the calculation are currently leaning bearish. This is not an amount of money deposited into or withdrawn from the coin. Support at 2,174: an H4 close below would confirm a loss of the support zone.
H4 is BEAR but D1 is BULL according to BOT. The short-term downward move has not changed the daily baseline state. EMA on D1 is not yet aligned with this state.
At this update, ETH is priced at 2,238.9, little changed from 24 hours ago.
MFI on the closed daily candle was 40.67. Price and volume in the calculation are currently leaning bearish. This is not an amount of money deposited into or withdrawn from the coin. Support at 2,174: an H4 close below would confirm a loss of the support zone.
1
183
·
--
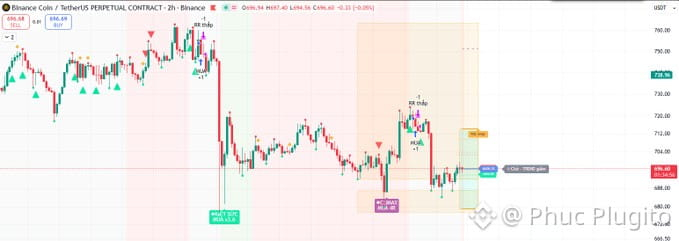
Hey Mr. CZ, with Binance’s security update being that big today, is $BNB ready to take off yet?
Hey Mr. CZ, with Binance’s security update being that big today, is $BNB ready to take off yet?
1
102
Log in to explore more content
Join global crypto users on Binance Square
⚡️ Get latest and useful information about crypto.
💬 Trusted by the world’s largest crypto exchange.
👍 Discover real insights from verified creators.
Email / Phone number
Trending Topics
HotCPIDecemberHikePriced
318,982 views
3,214 Discussing
CPI Market Watch | US CPI Rises 0.4% in October, Hotter Than 0.3% Forecast
Binance News
·34 Likes
·48.6k views
ZcashFallsBelow$1000ForFirstTimeSinceSeptember
9,252 views
56 Discussing
StrategyFaces$2.8BSelloffRiskFromMSCIRemoval
19,871 views
137 Discussing