

林听论币
1k Posts

林听论币
Report
Block User
币圈鏖战十余年,微博🔍 “林听论币” 公众号🔍“A林听论币”
Occasional Trader
2.6 Years
1 Following
1.3K+ Followers
1.2K+ Liked
Posts
All
Quotes
Live
PINNED
·
--
Binance chatroom allows direct communication with Lin Ting
1. Open the Binance APP, type "chatroom" in the top search bar, and click to enter the feature;
2. Once in the chatroom, find the "+" button in the top right corner and select the "Add Friend" option;
3. In the friend search box, accurately enter my exclusive chat ID: 9nnwkbt. After hitting search, you'll find me and can send a friend request to start interacting! $BTC
Binance chatroom allows direct communication with Lin Ting
1. Open the Binance APP, type "chatroom" in the top search bar, and click to enter the feature;
2. Once in the chatroom, find the "+" button in the top right corner and select the "Add Friend" option;
3. In the friend search box, accurately enter my exclusive chat ID: 9nnwkbt. After hitting search, you'll find me and can send a friend request to start interacting! $BTC
1. Open the Binance APP, type "chatroom" in the top search bar, and click to enter the feature;
2. Once in the chatroom, find the "+" button in the top right corner and select the "Add Friend" option;
3. In the friend search box, accurately enter my exclusive chat ID: 9nnwkbt. After hitting search, you'll find me and can send a friend request to start interacting! $BTC

1
142
PINNED
·
--
The big event is coming! After BTC fails to break 116,000 three times, a major drop is inevitable!
1 BTC attempted to reach a peak of 116,000 for the second time without breaking it, and will test the bottom near 105,000 again; it has now entered a downtrend;
2 After dropping to around 105,000, it will rebound again to around 115,000, forming the third peak at 116,000;
3 If it fails to break 116,000 three times, there will be a significant drop below 100,000, testing the bottom near 90,000;
4 100,000 is likely not the bottom, and it may very well drop to around 90,000.
The big event is coming! After BTC fails to break 116,000 three times, a major drop is inevitable!
1 BTC attempted to reach a peak of 116,000 for the second time without breaking it, and will test the bottom near 105,000 again; it has now entered a downtrend;
2 After dropping to around 105,000, it will rebound again to around 115,000, forming the third peak at 116,000;
3 If it fails to break 116,000 three times, there will be a significant drop below 100,000, testing the bottom near 90,000;
4 100,000 is likely not the bottom, and it may very well drop to around 90,000.
1 BTC attempted to reach a peak of 116,000 for the second time without breaking it, and will test the bottom near 105,000 again; it has now entered a downtrend;
2 After dropping to around 105,000, it will rebound again to around 115,000, forming the third peak at 116,000;
3 If it fails to break 116,000 three times, there will be a significant drop below 100,000, testing the bottom near 90,000;
4 100,000 is likely not the bottom, and it may very well drop to around 90,000.

2
206
·
--
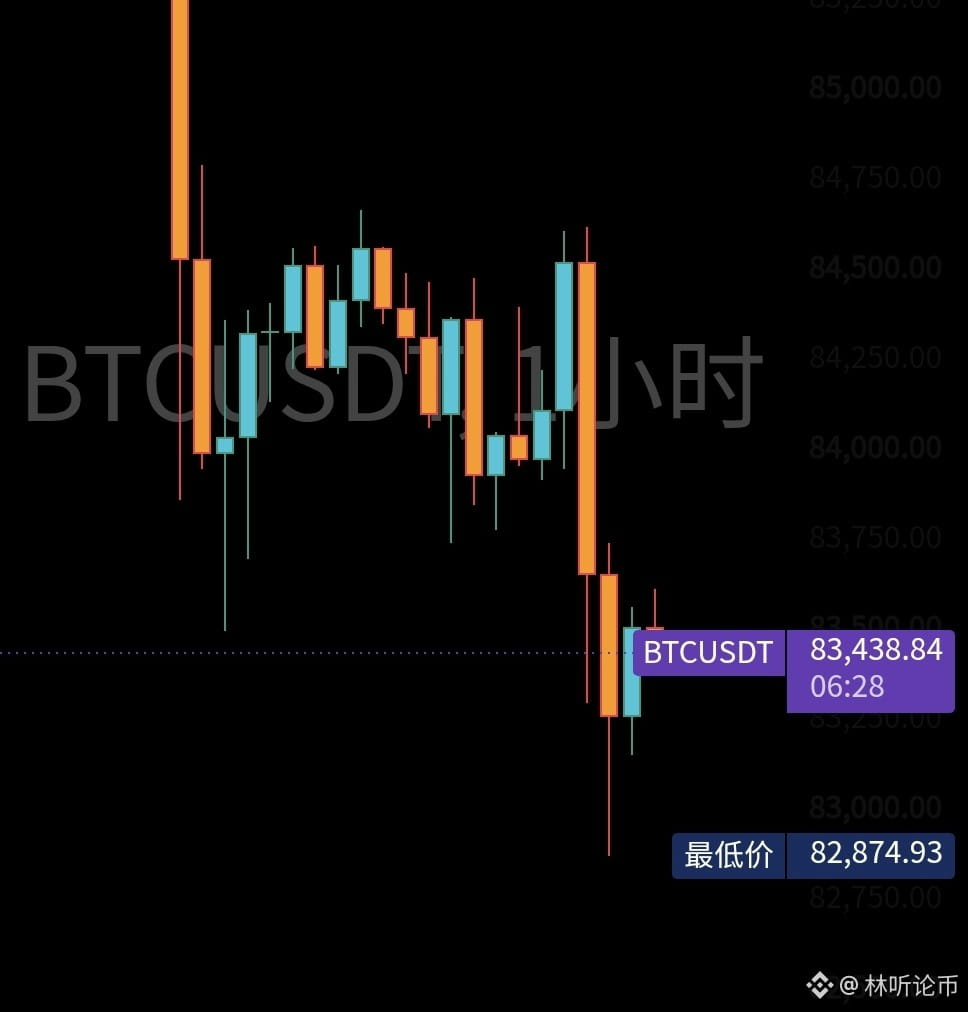
There isn’t much to analyze about BTC right now. The smaller timeframes haven’t bottomed yet, so there’s a high likelihood it will take another dip. Next, keep an eye on the 8.2–8w area below.
There isn’t much to analyze about BTC right now. The smaller timeframes haven’t bottomed yet, so there’s a high likelihood it will take another dip. Next, keep an eye on the 8.2–8w area below.
237
·
--
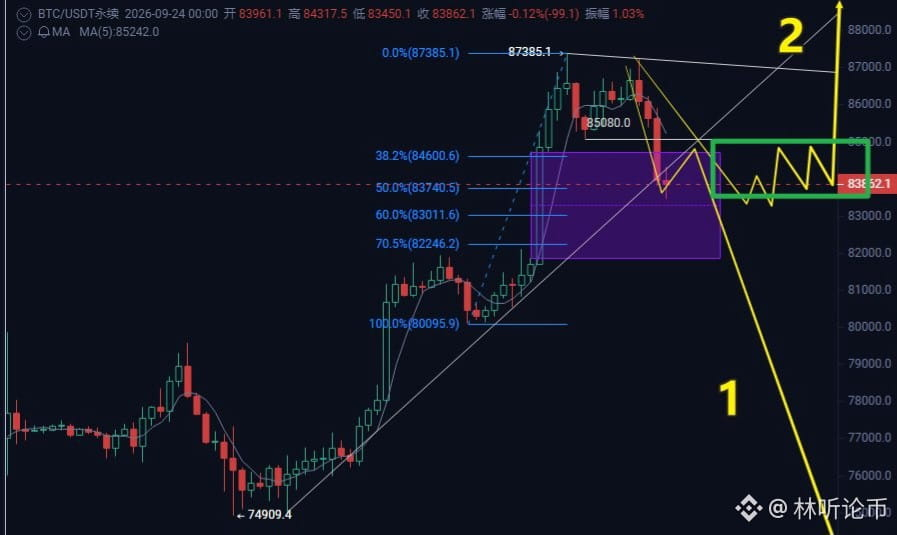
Wait, the pushback feel is still there; for now, it still looks like a normal pullback. The BTC left-side high support at 828 hasn’t been broken yet.
There are two possibilities, depending on the outcome of the US-Iran negotiations.
The first is the majority consensus.
The second is a situation where very few people would think this way—once it goes into the second scenario, many people will get wiped out. There will be a breakdown followed by choppy trading for a few days, then a pullback to the upside.
Going bearish is going long. A BTC sell-off is a good thing. No matter how long any adjustment takes afterward, the trend hasn’t reversed. Finding the right track is important! Hitting the right level matters!! Being temporarily trapped isn’t a big deal.
Wait, the pushback feel is still there; for now, it still looks like a normal pullback. The BTC left-side high support at 828 hasn’t been broken yet.
There are two possibilities, depending on the outcome of the US-Iran negotiations.
The first is the majority consensus.
The second is a situation where very few people would think this way—once it goes into the second scenario, many people will get wiped out. There will be a breakdown followed by choppy trading for a few days, then a pullback to the upside.
Going bearish is going long. A BTC sell-off is a good thing. No matter how long any adjustment takes afterward, the trend hasn’t reversed. Finding the right track is important! Hitting the right level matters!! Being temporarily trapped isn’t a big deal.
There are two possibilities, depending on the outcome of the US-Iran negotiations.
The first is the majority consensus.
The second is a situation where very few people would think this way—once it goes into the second scenario, many people will get wiped out. There will be a breakdown followed by choppy trading for a few days, then a pullback to the upside.
Going bearish is going long. A BTC sell-off is a good thing. No matter how long any adjustment takes afterward, the trend hasn’t reversed. Finding the right track is important! Hitting the right level matters!! Being temporarily trapped isn’t a big deal.
538
·
--
Bitcoin is getting more people on the train again. As long as the daily close stays above 82,300, I’m still treating this as a pullback or a wide-ranging consolidation, and my strategy is to look for opportunities to add at lower levels.
What needs to be done now is to wait for a right-side long setup. During this shakeout, the main force can only use interest-rate hikes for cover; otherwise, they wouldn’t be able to fool these stubborn, long-time “iron” sprouts. I don’t believe the trend has reversed—I’m really looking forward to what comes next in the market.
Bitcoin is getting more people on the train again. As long as the daily close stays above 82,300, I’m still treating this as a pullback or a wide-ranging consolidation, and my strategy is to look for opportunities to add at lower levels.
What needs to be done now is to wait for a right-side long setup. During this shakeout, the main force can only use interest-rate hikes for cover; otherwise, they wouldn’t be able to fool these stubborn, long-time “iron” sprouts. I don’t believe the trend has reversed—I’m really looking forward to what comes next in the market.
What needs to be done now is to wait for a right-side long setup. During this shakeout, the main force can only use interest-rate hikes for cover; otherwise, they wouldn’t be able to fool these stubborn, long-time “iron” sprouts. I don’t believe the trend has reversed—I’m really looking forward to what comes next in the market.

2.7k
·
--
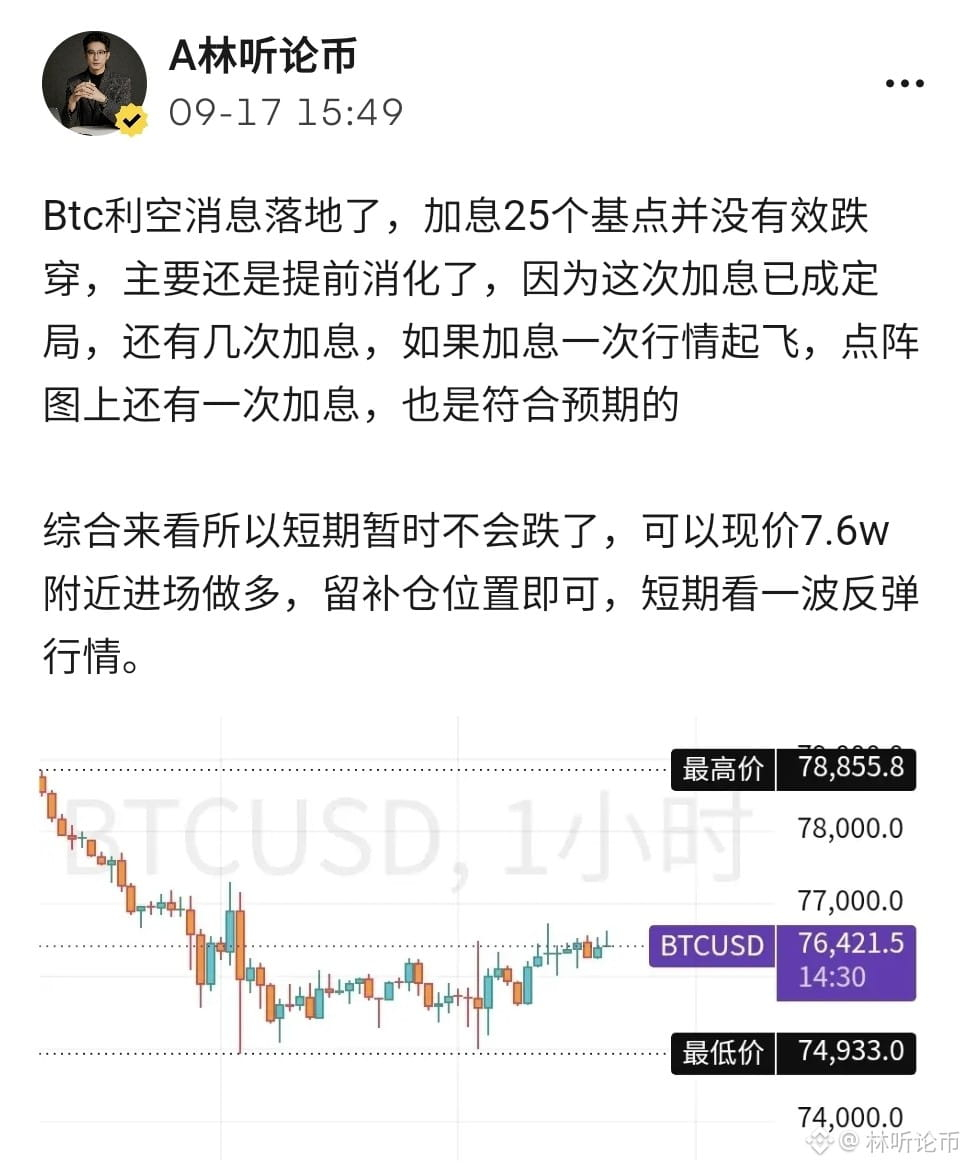
Iron powder’s strength takes down ten-thousand-point room; at a current price of 76,000, it’s giddy up to 86,000.
Since BTC surged to 82,000, many people’s first reaction has been, “They’re at it again—trying to fool people.”
But consider it from another angle: if everyone is waiting for a pullback and getting ready to go short, then the market is most likely to move up first, driving the would-be shorters into madness.
The real liquidation might not be longs getting swept, but shorts getting trampled.
The more neatly and unanimously everyone is bearish, the more likely it becomes fuel for a rally.
Iron powder’s strength takes down ten-thousand-point room; at a current price of 76,000, it’s giddy up to 86,000.
Since BTC surged to 82,000, many people’s first reaction has been, “They’re at it again—trying to fool people.”
But consider it from another angle: if everyone is waiting for a pullback and getting ready to go short, then the market is most likely to move up first, driving the would-be shorters into madness.
The real liquidation might not be longs getting swept, but shorts getting trampled.
The more neatly and unanimously everyone is bearish, the more likely it becomes fuel for a rally.
Since BTC surged to 82,000, many people’s first reaction has been, “They’re at it again—trying to fool people.”
But consider it from another angle: if everyone is waiting for a pullback and getting ready to go short, then the market is most likely to move up first, driving the would-be shorters into madness.
The real liquidation might not be longs getting swept, but shorts getting trampled.
The more neatly and unanimously everyone is bearish, the more likely it becomes fuel for a rally.

1
374
·
--
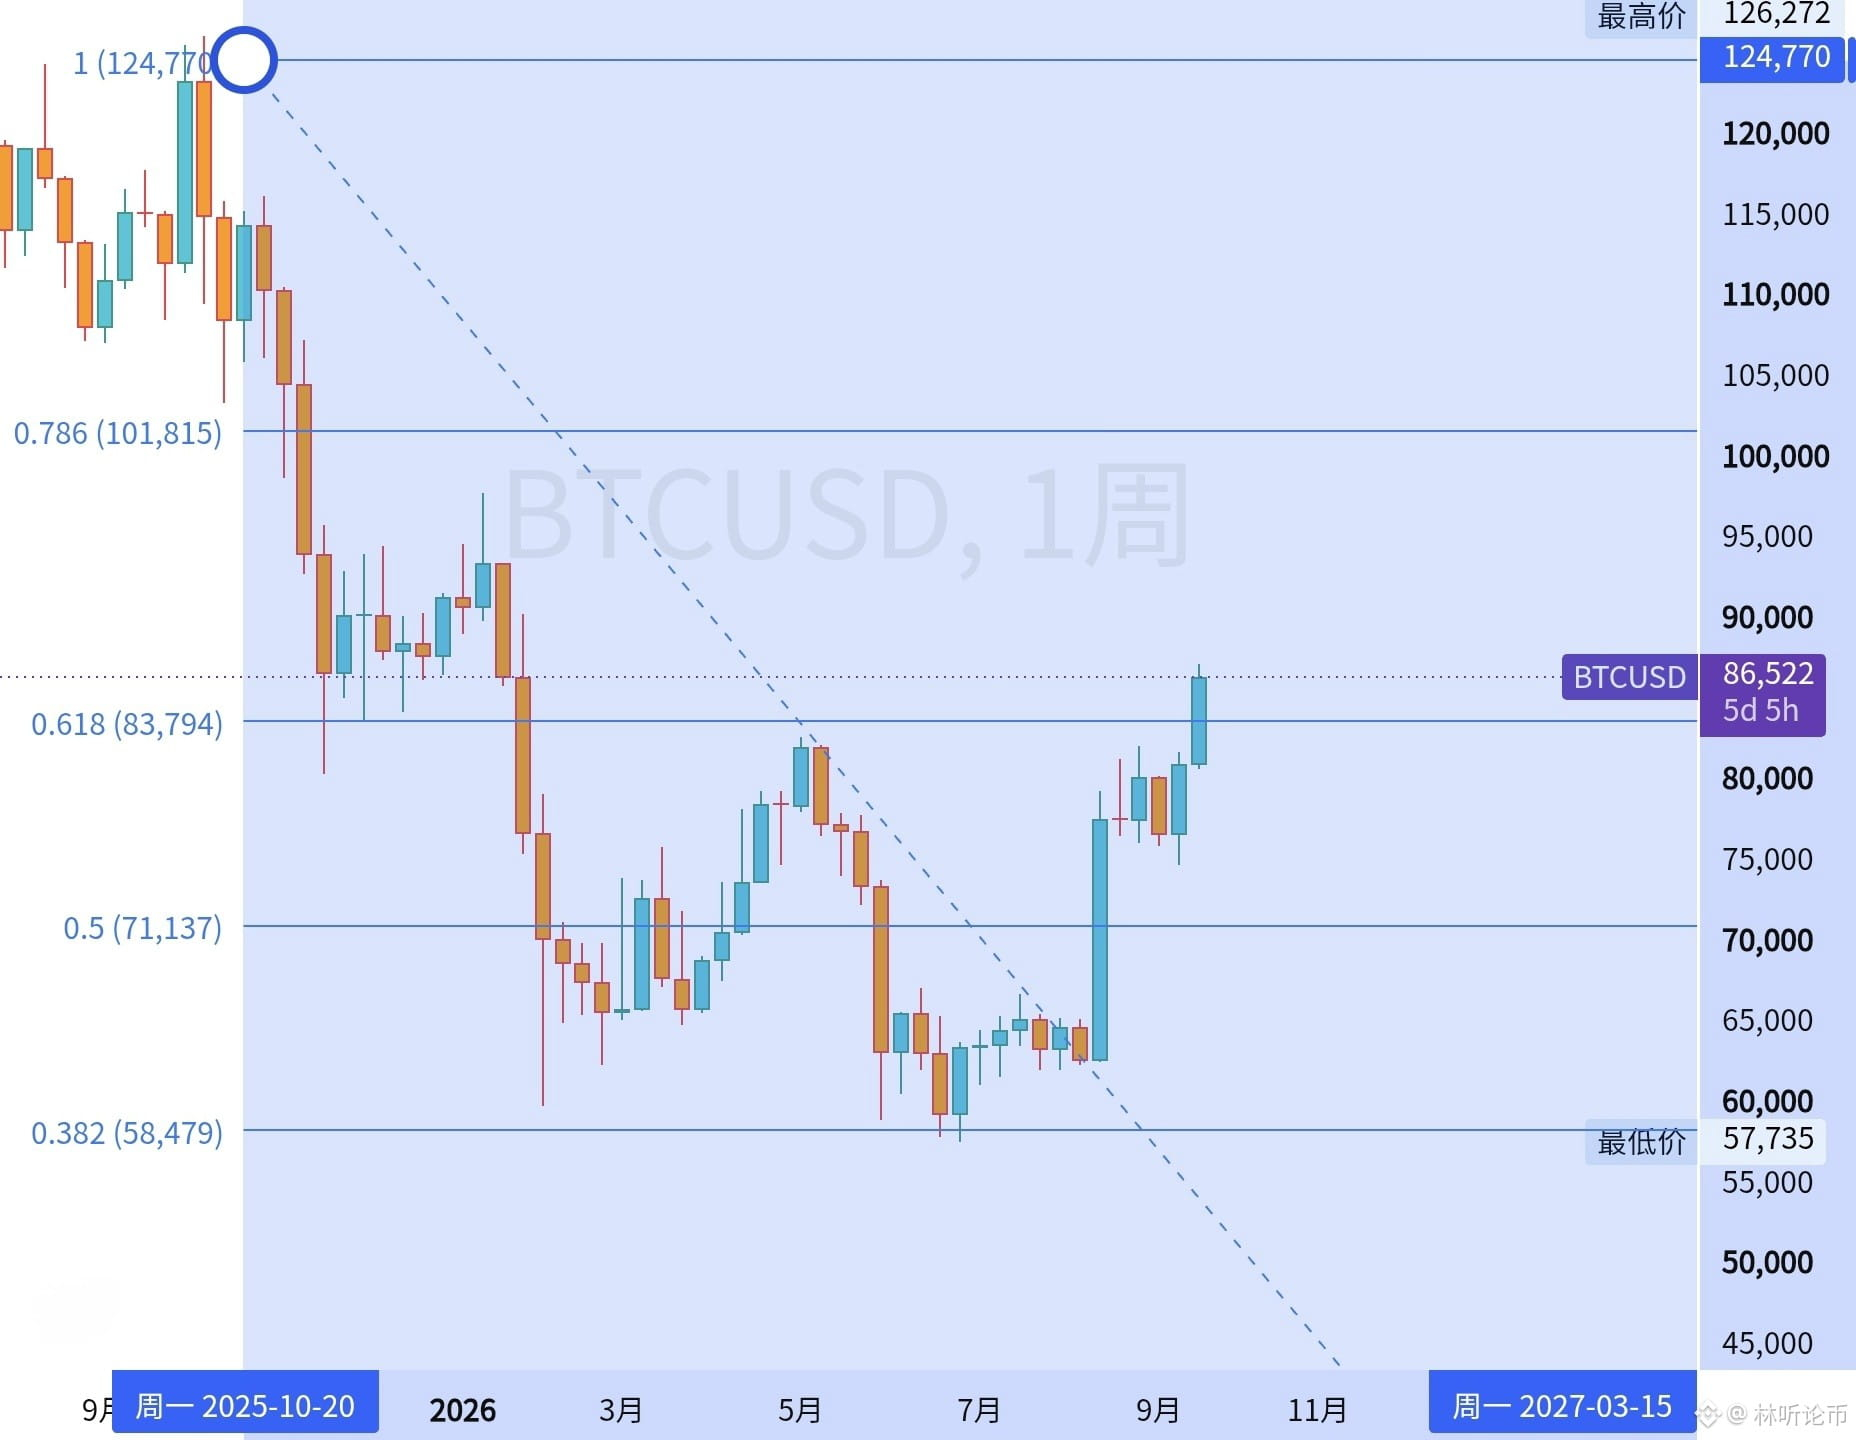
Bitcoin, this is only the first phase of the uptrend. Don’t hesitate—the stronger “pushback” feeling is still ahead. A simulated path for the next round of rally:
Step 1: Break up to 92,500 (mid-cycle 3.618), then pull back to 88K.
Step 2: Break up to 100K (major-cycle 1.618), then pull back to 95K.
Step 3: Break up to 115K (wave 1.618 resonance), then pull back to 105K.
Step 4: Break up to 126,800 (prior high), then a sharp drop for a washout; the range will be from 110K to 115K.
Step 5: Rally toward the final target, around 150K.#AI股持续上涨还有哪些投资机会
Bitcoin, this is only the first phase of the uptrend. Don’t hesitate—the stronger “pushback” feeling is still ahead. A simulated path for the next round of rally:
Step 1: Break up to 92,500 (mid-cycle 3.618), then pull back to 88K.
Step 2: Break up to 100K (major-cycle 1.618), then pull back to 95K.
Step 3: Break up to 115K (wave 1.618 resonance), then pull back to 105K.
Step 4: Break up to 126,800 (prior high), then a sharp drop for a washout; the range will be from 110K to 115K.
Step 5: Rally toward the final target, around 150K.#AI股持续上涨还有哪些投资机会
Step 1: Break up to 92,500 (mid-cycle 3.618), then pull back to 88K.
Step 2: Break up to 100K (major-cycle 1.618), then pull back to 95K.
Step 3: Break up to 115K (wave 1.618 resonance), then pull back to 105K.
Step 4: Break up to 126,800 (prior high), then a sharp drop for a washout; the range will be from 110K to 115K.
Step 5: Rally toward the final target, around 150K.#AI股持续上涨还有哪些投资机会
1
911
·
--
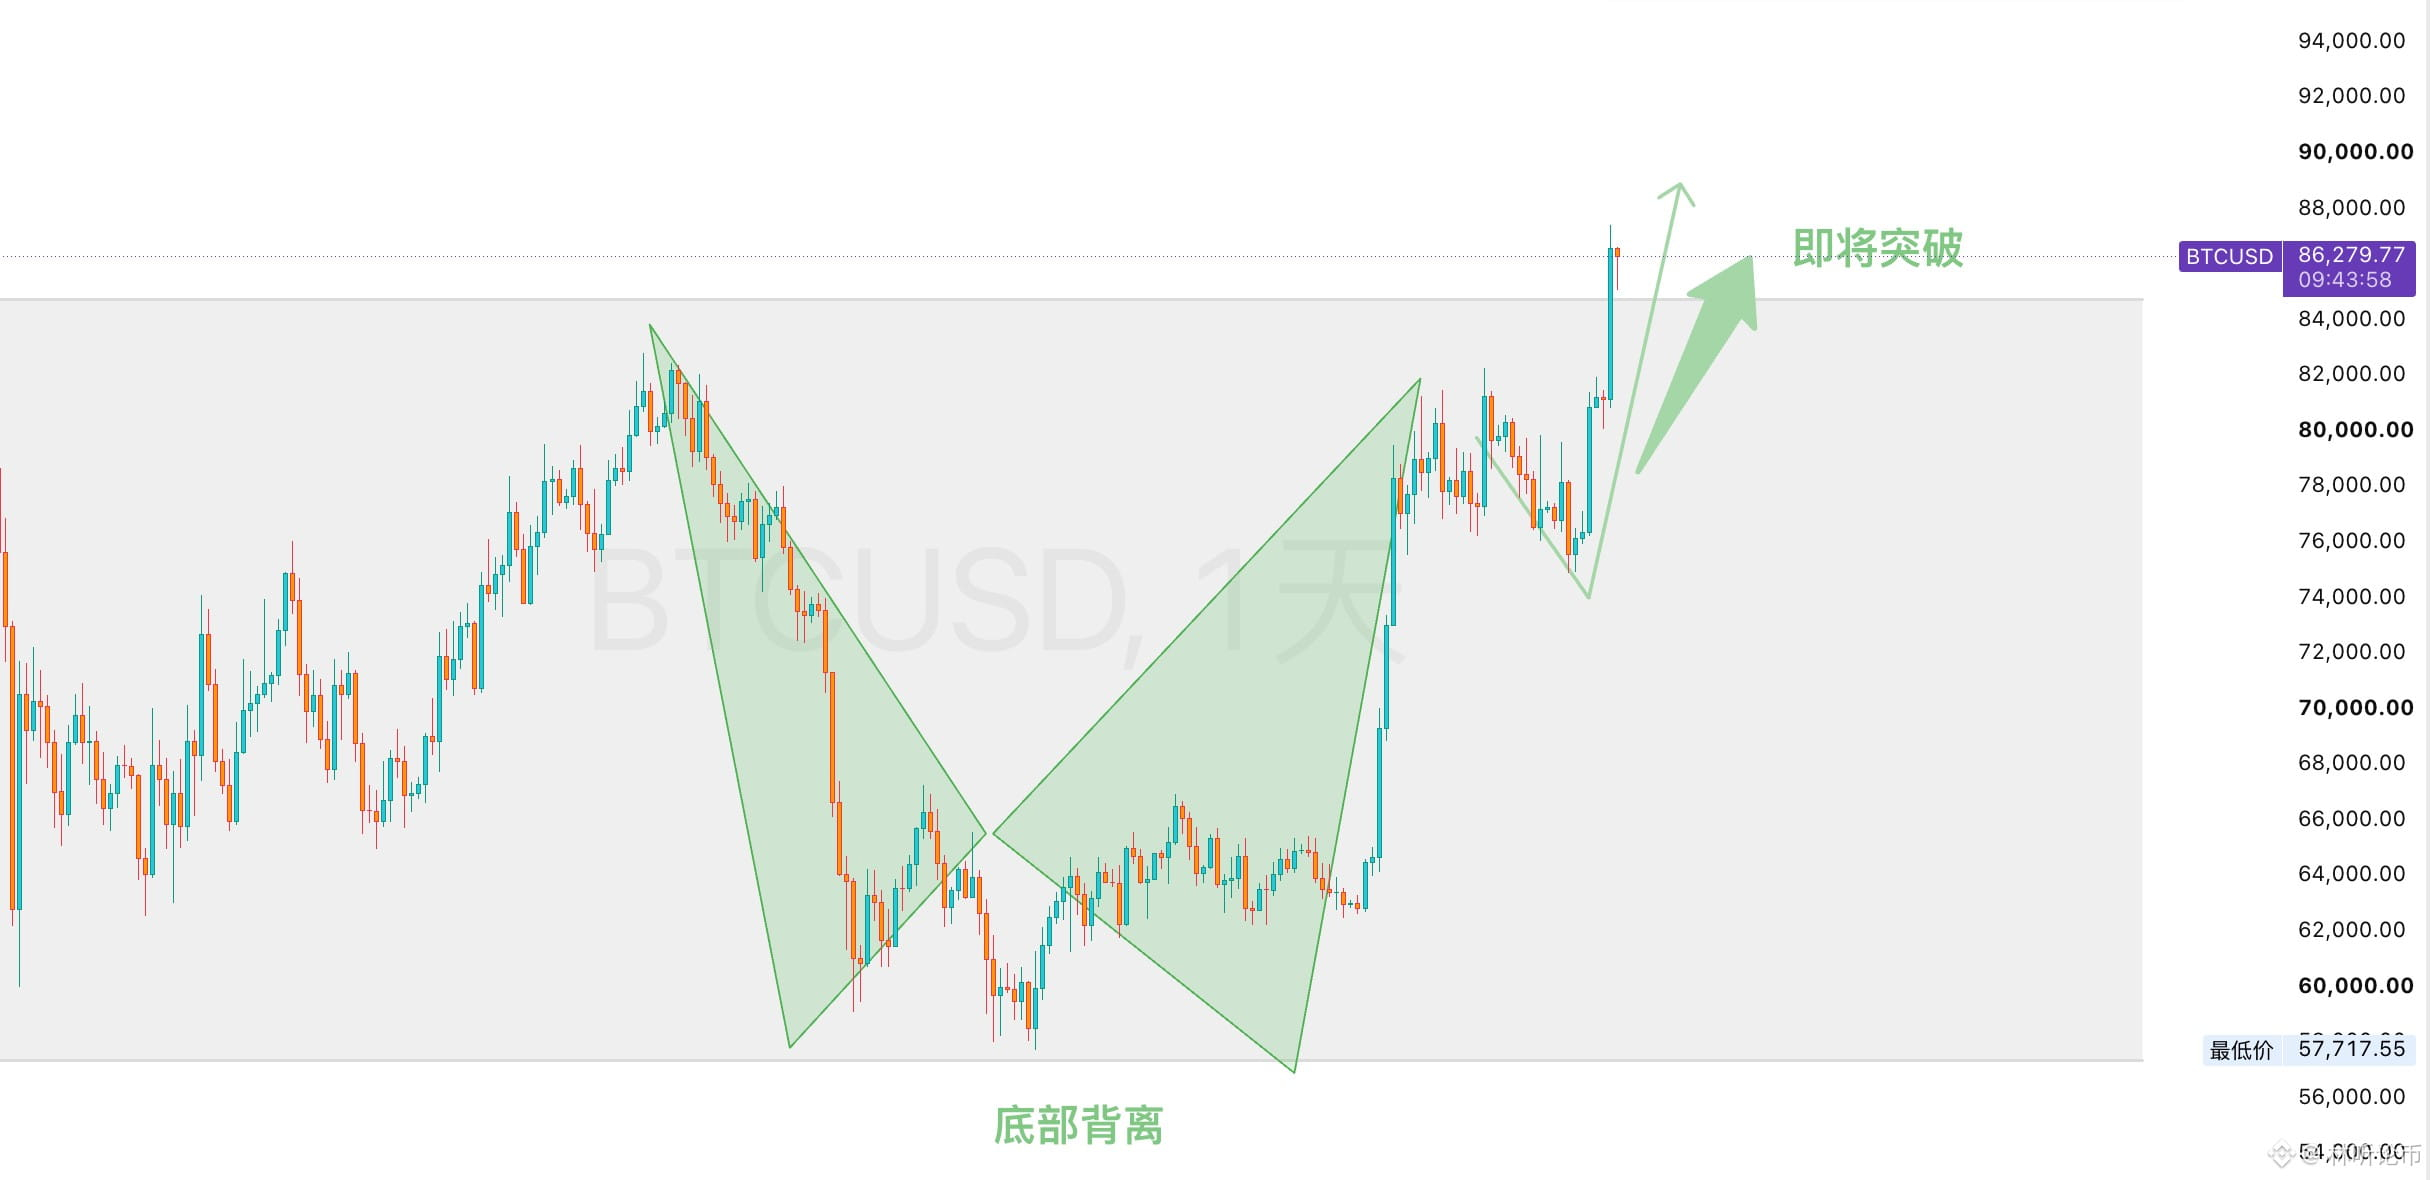
As fake coins’ collective rebound kicks in, starting from 80,700, how much safe upside is left in this cycle?
This is a question everyone is concerned about—especially those who missed the move. I believe this rally has already moved past the initial rebound phase and entered a breakout acceleration and capital diffusion stage. There’s currently no clear sell-off top signal, but the most comfortable low-entry zone has already passed.
At present, we’re roughly at the third step of the entire rebound:
First step: panic liquidation in the 58,000–67,000 range. The market doesn’t believe in the bottom, yet chips are quietly rotating at low levels.
Second step: trend repair from 63,000–82,000. Bitcoin reclaims the medium- and long-term moving averages; shorts cover, but most people still treat the rise as a bear-market dead-cat bounce.
Third step: from 75,000–87,000 right now, sidelined capital starts chasing higher. Once BTC stabilizes at the high end, capital keeps flowing into ETH, SOL, and other altcoins. The money-making effect is clearly heating up.
But the third step can lead either to the main surge or to a local top.
If BTC breaks out above 88,000 with volume, and then pulls back to 85,000 without breaking it, then we can say it has entered the fourth step; afterward, the market will challenge 90,000–100,000.
The fact that altcoins are collectively catching up suggests risk appetite is spreading. However, BTC’s dominance is still close to 59%, which is more like capital overflow after a breakout rather than something that can be directly defined as a full-blown altcoin season.
Next, we only need to watch a few levels:
Hold 83,000–84,000 (USD), and we’ll continue to look for 89,000–92,000;
If it falls back to 80,000–82,000, it would indicate that the breakout momentum is starting to weaken.
My strategy remains unchanged: I’ll keep a bullish bias as long as the trend continues. There’s no longer good value at the current level. For execution, I’m more inclined to take short-term trades—quick in and quick out.
As fake coins’ collective rebound kicks in, starting from 80,700, how much safe upside is left in this cycle?
This is a question everyone is concerned about—especially those who missed the move. I believe this rally has already moved past the initial rebound phase and entered a breakout acceleration and capital diffusion stage. There’s currently no clear sell-off top signal, but the most comfortable low-entry zone has already passed.
At present, we’re roughly at the third step of the entire rebound:
First step: panic liquidation in the 58,000–67,000 range. The market doesn’t believe in the bottom, yet chips are quietly rotating at low levels.
Second step: trend repair from 63,000–82,000. Bitcoin reclaims the medium- and long-term moving averages; shorts cover, but most people still treat the rise as a bear-market dead-cat bounce.
Third step: from 75,000–87,000 right now, sidelined capital starts chasing higher. Once BTC stabilizes at the high end, capital keeps flowing into ETH, SOL, and other altcoins. The money-making effect is clearly heating up.
But the third step can lead either to the main surge or to a local top.
If BTC breaks out above 88,000 with volume, and then pulls back to 85,000 without breaking it, then we can say it has entered the fourth step; afterward, the market will challenge 90,000–100,000.
The fact that altcoins are collectively catching up suggests risk appetite is spreading. However, BTC’s dominance is still close to 59%, which is more like capital overflow after a breakout rather than something that can be directly defined as a full-blown altcoin season.
Next, we only need to watch a few levels:
Hold 83,000–84,000 (USD), and we’ll continue to look for 89,000–92,000;
If it falls back to 80,000–82,000, it would indicate that the breakout momentum is starting to weaken.
My strategy remains unchanged: I’ll keep a bullish bias as long as the trend continues. There’s no longer good value at the current level. For execution, I’m more inclined to take short-term trades—quick in and quick out.
This is a question everyone is concerned about—especially those who missed the move. I believe this rally has already moved past the initial rebound phase and entered a breakout acceleration and capital diffusion stage. There’s currently no clear sell-off top signal, but the most comfortable low-entry zone has already passed.
At present, we’re roughly at the third step of the entire rebound:
First step: panic liquidation in the 58,000–67,000 range. The market doesn’t believe in the bottom, yet chips are quietly rotating at low levels.
Second step: trend repair from 63,000–82,000. Bitcoin reclaims the medium- and long-term moving averages; shorts cover, but most people still treat the rise as a bear-market dead-cat bounce.
Third step: from 75,000–87,000 right now, sidelined capital starts chasing higher. Once BTC stabilizes at the high end, capital keeps flowing into ETH, SOL, and other altcoins. The money-making effect is clearly heating up.
But the third step can lead either to the main surge or to a local top.
If BTC breaks out above 88,000 with volume, and then pulls back to 85,000 without breaking it, then we can say it has entered the fourth step; afterward, the market will challenge 90,000–100,000.
The fact that altcoins are collectively catching up suggests risk appetite is spreading. However, BTC’s dominance is still close to 59%, which is more like capital overflow after a breakout rather than something that can be directly defined as a full-blown altcoin season.
Next, we only need to watch a few levels:
Hold 83,000–84,000 (USD), and we’ll continue to look for 89,000–92,000;
If it falls back to 80,000–82,000, it would indicate that the breakout momentum is starting to weaken.
My strategy remains unchanged: I’ll keep a bullish bias as long as the trend continues. There’s no longer good value at the current level. For execution, I’m more inclined to take short-term trades—quick in and quick out.
1
1
594
·
--
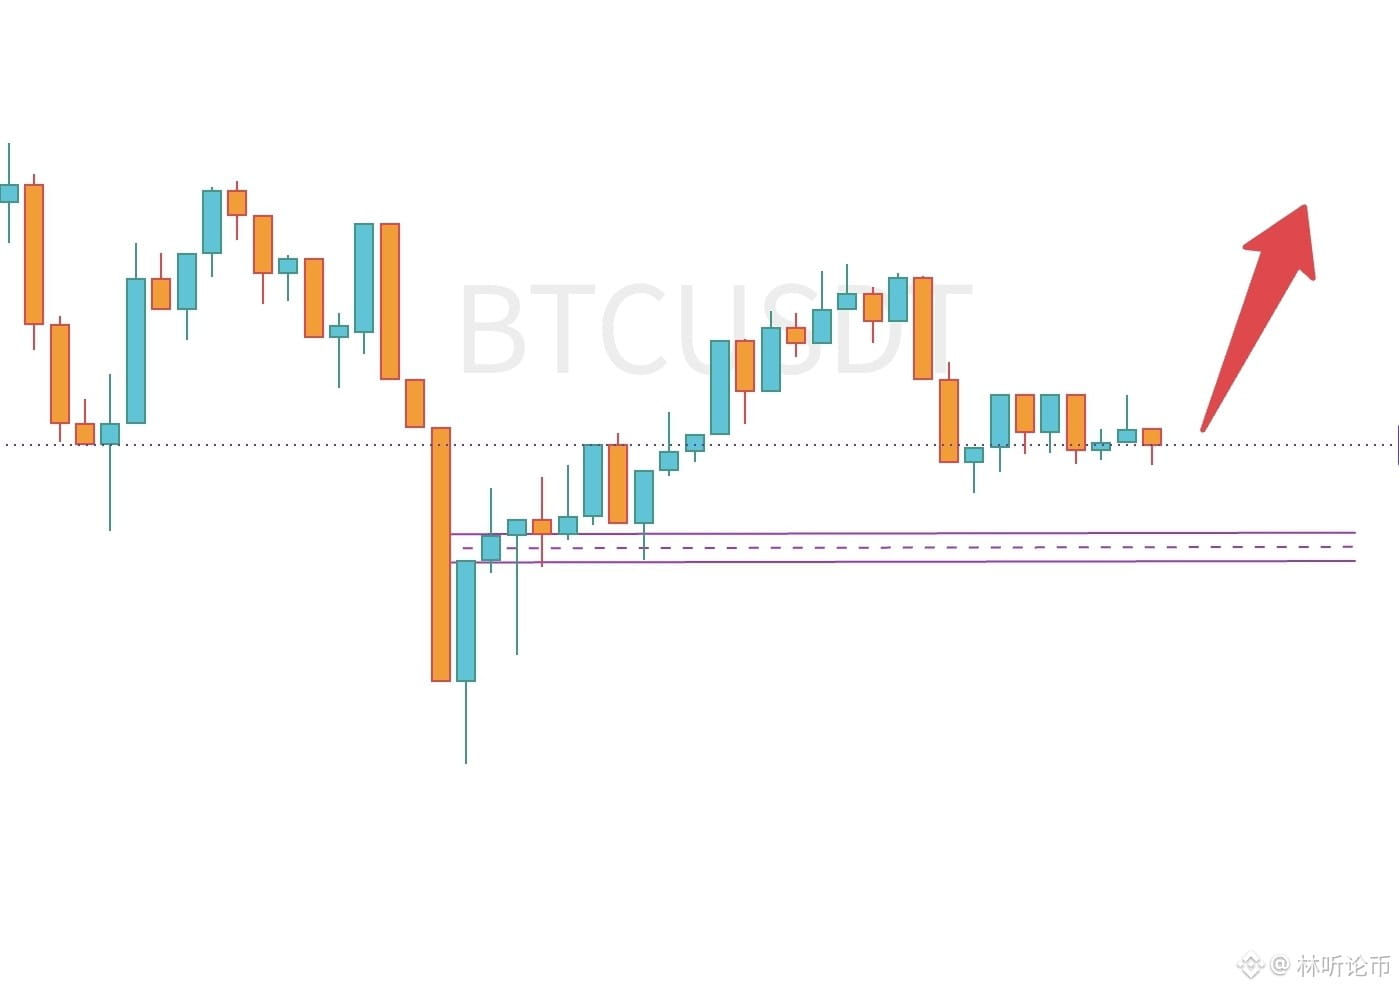
Bitcoin 4-hour price-volume divergence: a short-term pullback is a buying opportunity
BTC price has made a new high, but on the 4-hour level the bullish volume has not expanded in sync—instead, it shows a price-volume divergence. This indicates that there isn’t enough chasing-buying capital in the short term, and upside momentum is gradually weakening. The 4-hour timeframe may need a pullback to digest profit-taking.
Note: this is a buying opportunity, not an exit signal.
The reason is simple: 84K has already broken out on increased volume, and the situation has entered a reversal. The large-cycle Fib 0.618 level has been reclaimed, meaning the structural characteristics have changed. A pullback after a breakout is a normal retest—not a trend change.
A pullback to 85,300–86K is a buying opportunity. If it can also pull back to 84K, that would be a seriously strong add-on position opportunity.
Mid-term targets: around 90,000 → 93,000 → 96,000 → near 100,000
Bitcoin 4-hour price-volume divergence: a short-term pullback is a buying opportunity
BTC price has made a new high, but on the 4-hour level the bullish volume has not expanded in sync—instead, it shows a price-volume divergence. This indicates that there isn’t enough chasing-buying capital in the short term, and upside momentum is gradually weakening. The 4-hour timeframe may need a pullback to digest profit-taking.
Note: this is a buying opportunity, not an exit signal.
The reason is simple: 84K has already broken out on increased volume, and the situation has entered a reversal. The large-cycle Fib 0.618 level has been reclaimed, meaning the structural characteristics have changed. A pullback after a breakout is a normal retest—not a trend change.
A pullback to 85,300–86K is a buying opportunity. If it can also pull back to 84K, that would be a seriously strong add-on position opportunity.
Mid-term targets: around 90,000 → 93,000 → 96,000 → near 100,000
BTC price has made a new high, but on the 4-hour level the bullish volume has not expanded in sync—instead, it shows a price-volume divergence. This indicates that there isn’t enough chasing-buying capital in the short term, and upside momentum is gradually weakening. The 4-hour timeframe may need a pullback to digest profit-taking.
Note: this is a buying opportunity, not an exit signal.
The reason is simple: 84K has already broken out on increased volume, and the situation has entered a reversal. The large-cycle Fib 0.618 level has been reclaimed, meaning the structural characteristics have changed. A pullback after a breakout is a normal retest—not a trend change.
A pullback to 85,300–86K is a buying opportunity. If it can also pull back to 84K, that would be a seriously strong add-on position opportunity.
Mid-term targets: around 90,000 → 93,000 → 96,000 → near 100,000
1
768
·
--
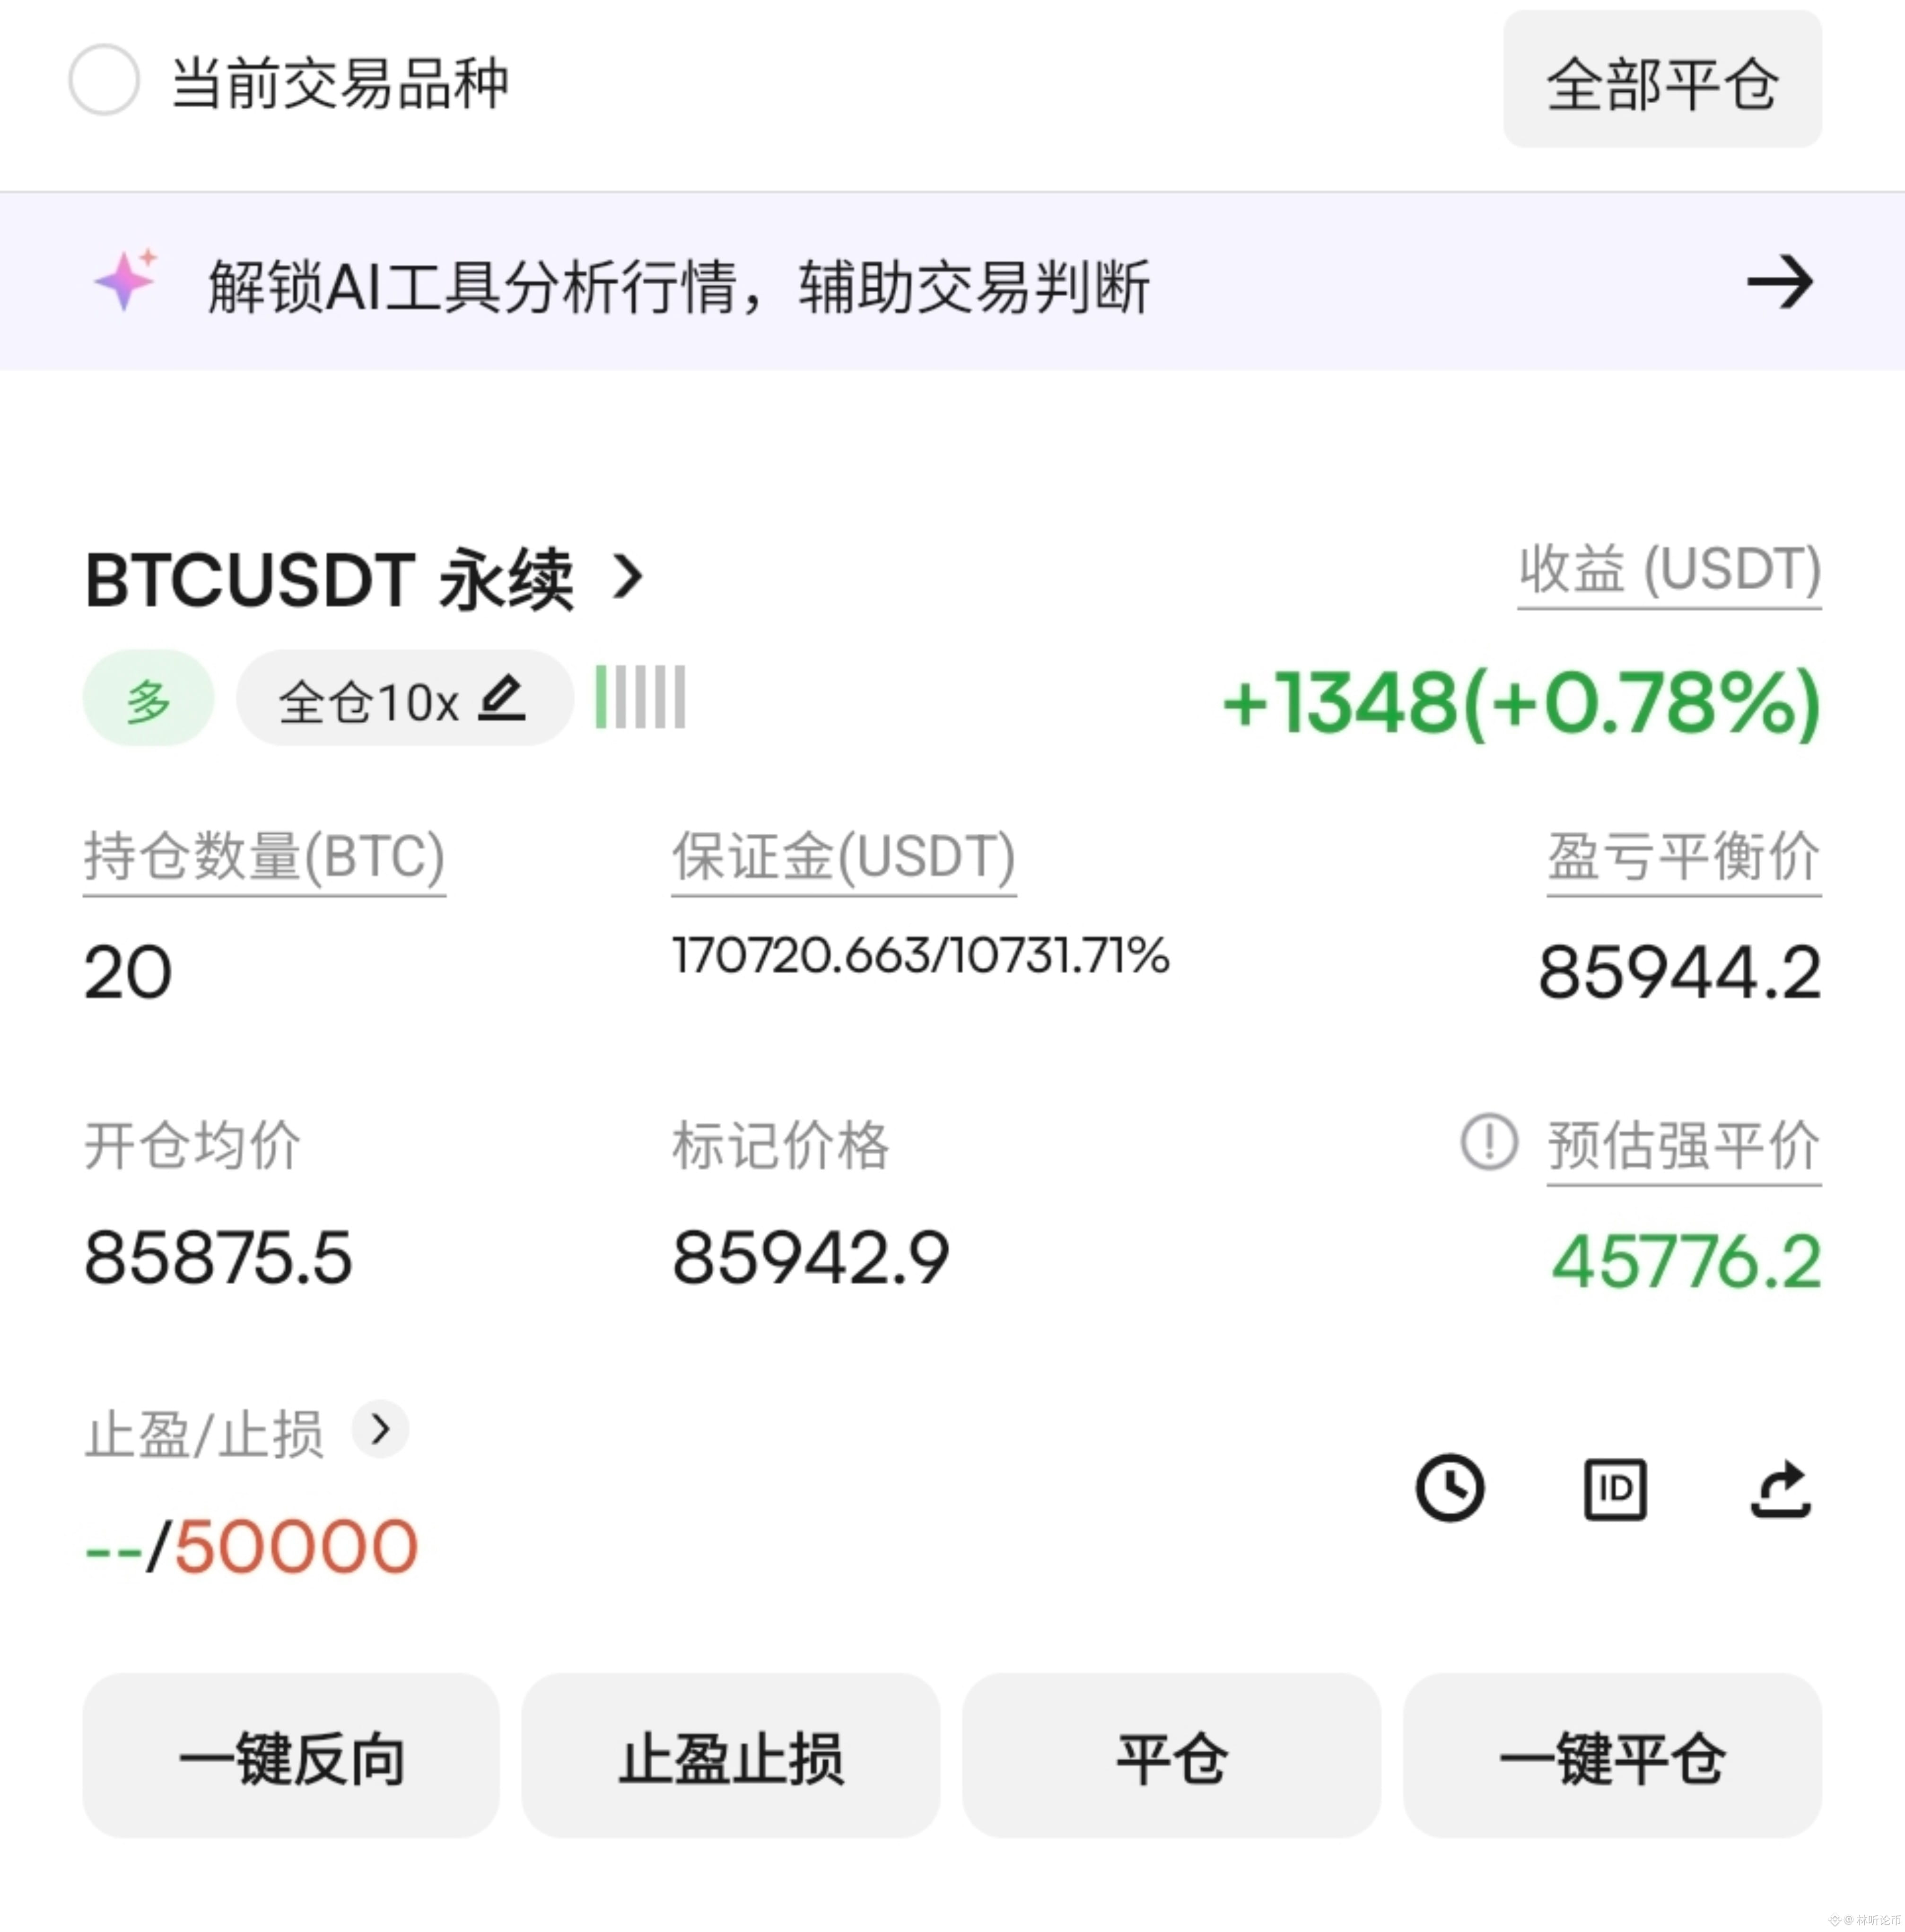
80000 holds firm; the next stop is 100000. For the long term, keep focusing on one direction and don’t move—wait and see. #NEAR一周涨近80%
80000 holds firm; the next stop is 100000. For the long term, keep focusing on one direction and don’t move—wait and see. #NEAR一周涨近80%
384
·
--
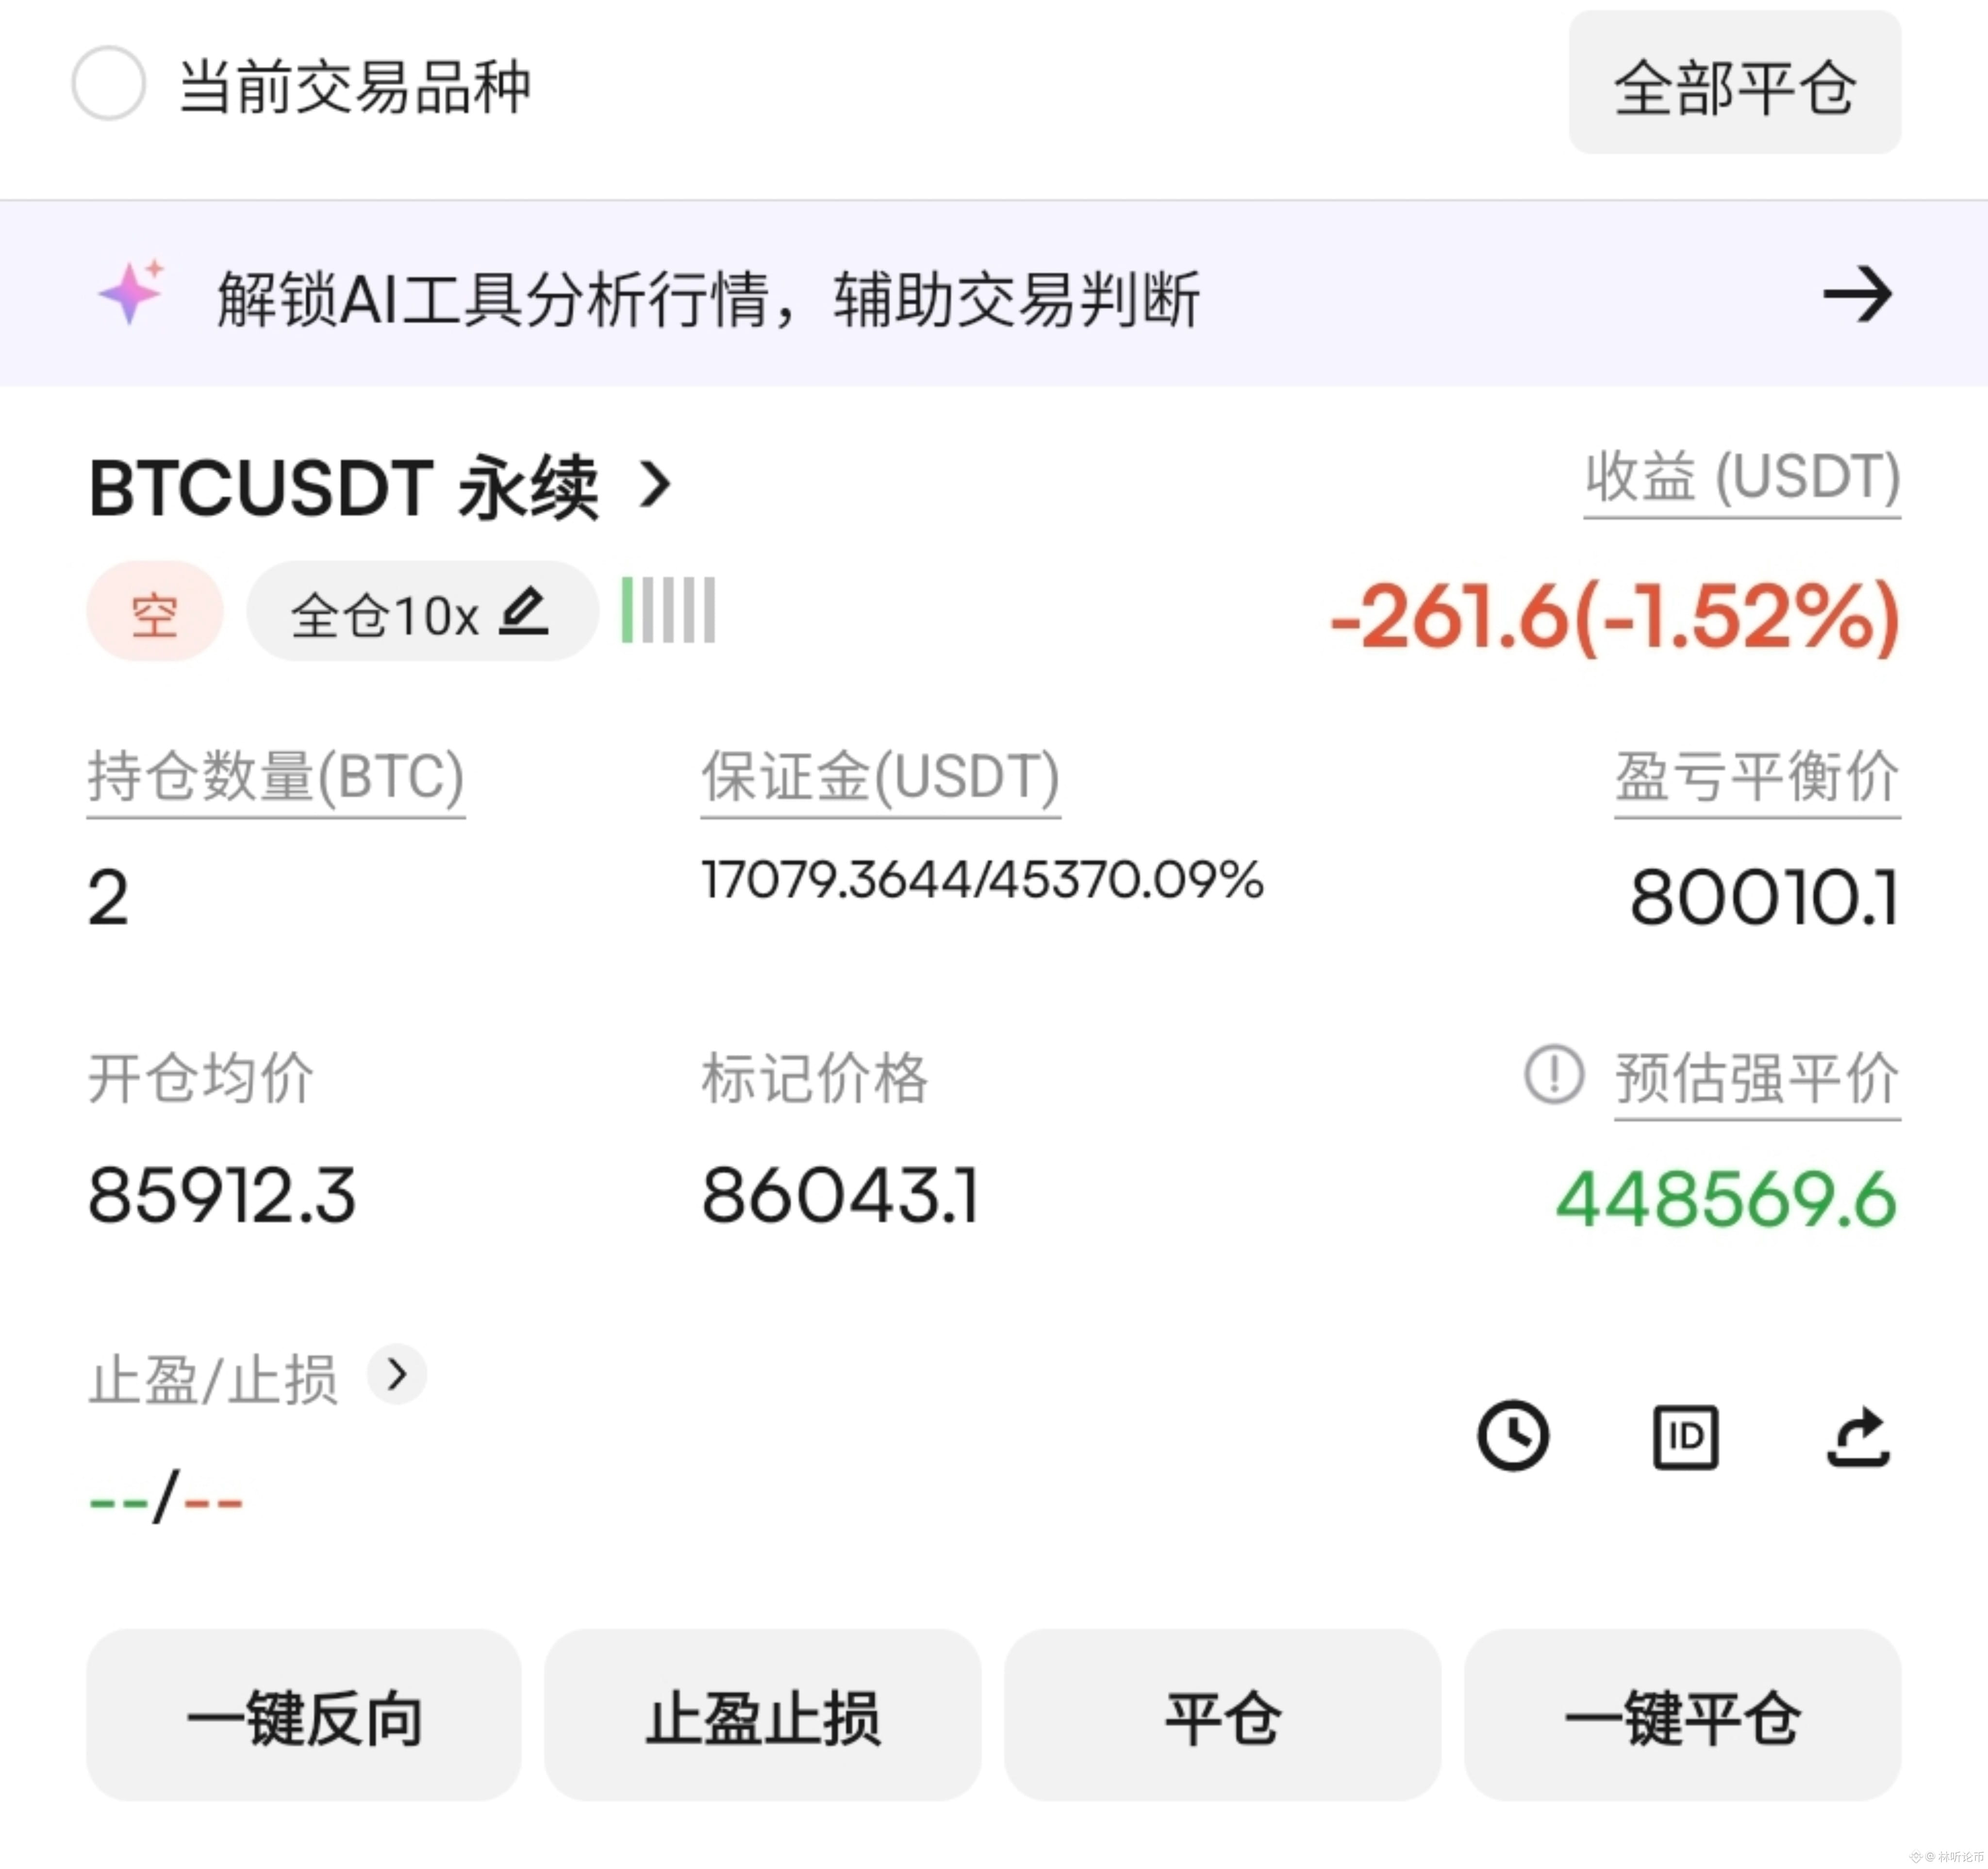
$BTC keeps going up without looking like a rebound, which means it’s not just a temporary bounce. I added another short position for the scalp, and I’m preparing to go long again after a pullback. At this moment, whatever you do, don’t be stubborn and hold against the trade. Most likely, it will continue to rise. First, watch around $90,000.
$BTC keeps going up without looking like a rebound, which means it’s not just a temporary bounce. I added another short position for the scalp, and I’m preparing to go long again after a pullback. At this moment, whatever you do, don’t be stubborn and hold against the trade. Most likely, it will continue to rise. First, watch around $90,000.
340
·
--
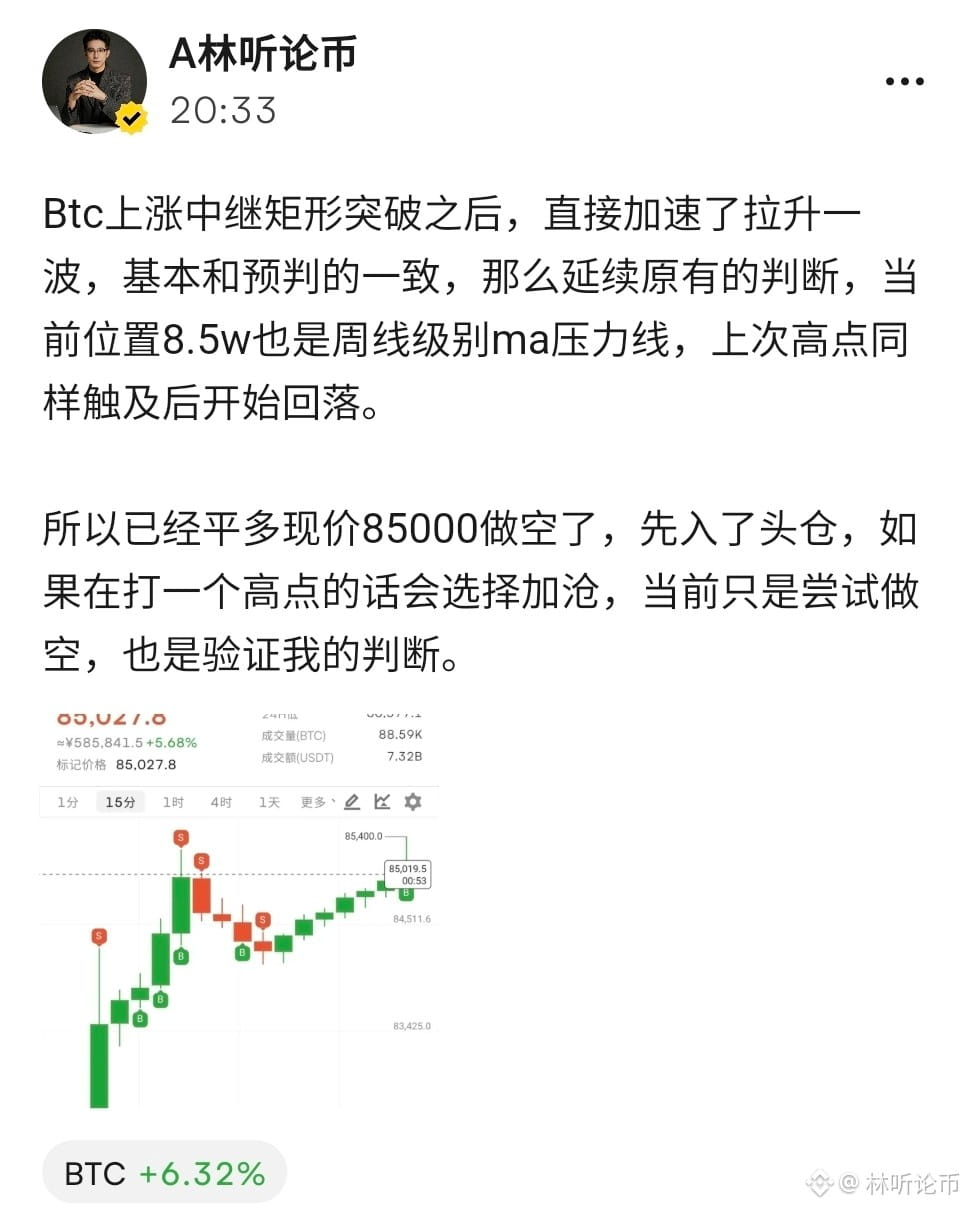
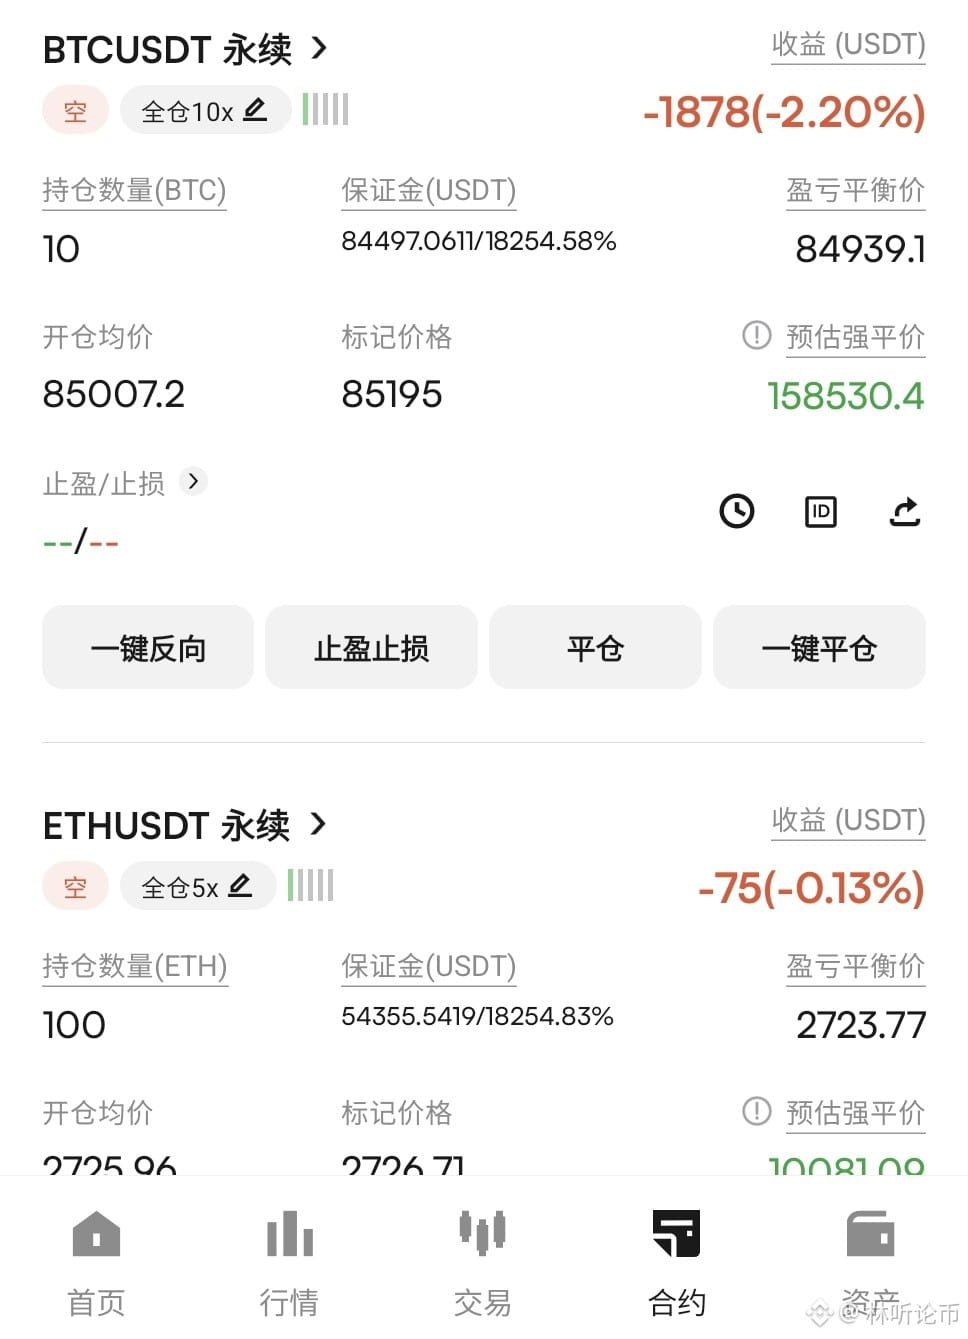
After the BTC uptrend followed by a rectangle breakout, it directly accelerated and kicked off another surge, basically in line with my prediction. So, continuing with the original judgment: the current 85k level is also a weekly-level MA resistance line. Last time, the high point similarly touched it and then started to pull back.
So I’ve already closed longs at the current price and shorted at 85,000. I entered a head position first. If it makes another high point, I’ll choose to follow with shorting into it. For now, this is just an attempt to short—it's also to verify my judgment. #比特币突破8.5万美元
After the BTC uptrend followed by a rectangle breakout, it directly accelerated and kicked off another surge, basically in line with my prediction. So, continuing with the original judgment: the current 85k level is also a weekly-level MA resistance line. Last time, the high point similarly touched it and then started to pull back.
So I’ve already closed longs at the current price and shorted at 85,000. I entered a head position first. If it makes another high point, I’ll choose to follow with shorting into it. For now, this is just an attempt to short—it's also to verify my judgment. #比特币突破8.5万美元
So I’ve already closed longs at the current price and shorted at 85,000. I entered a head position first. If it makes another high point, I’ll choose to follow with shorting into it. For now, this is just an attempt to short—it's also to verify my judgment. #比特币突破8.5万美元
561
·
--
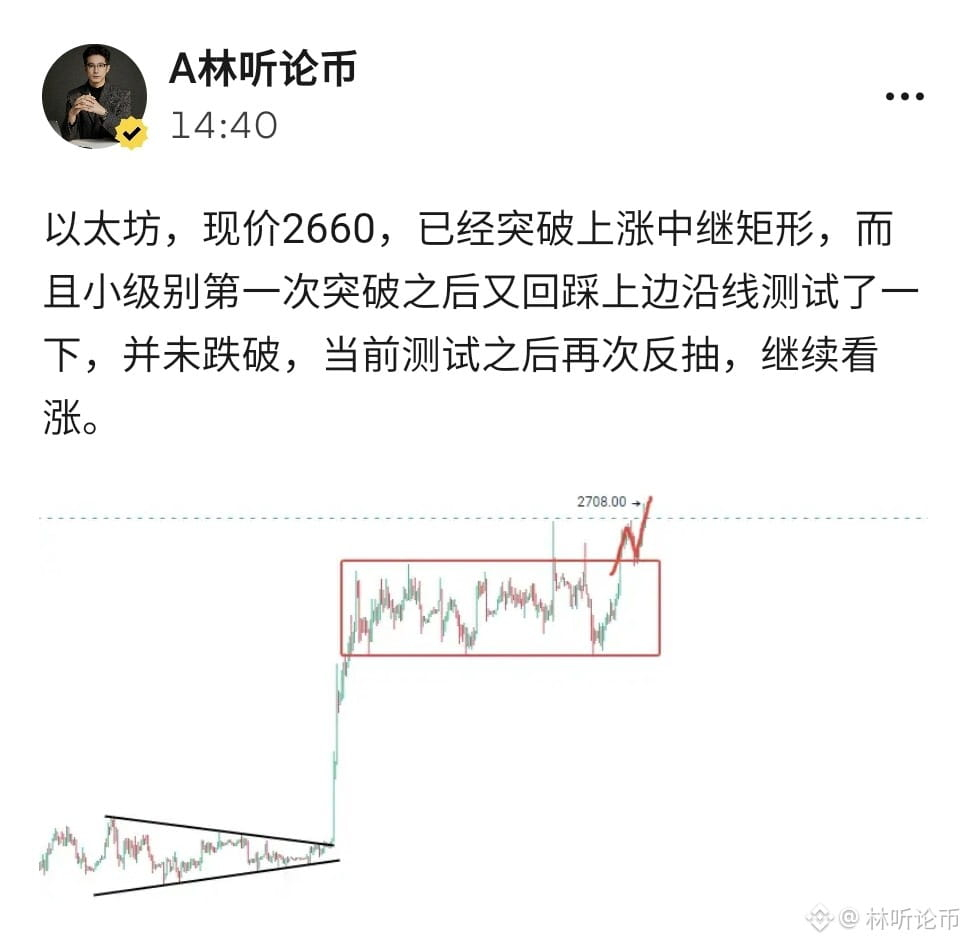
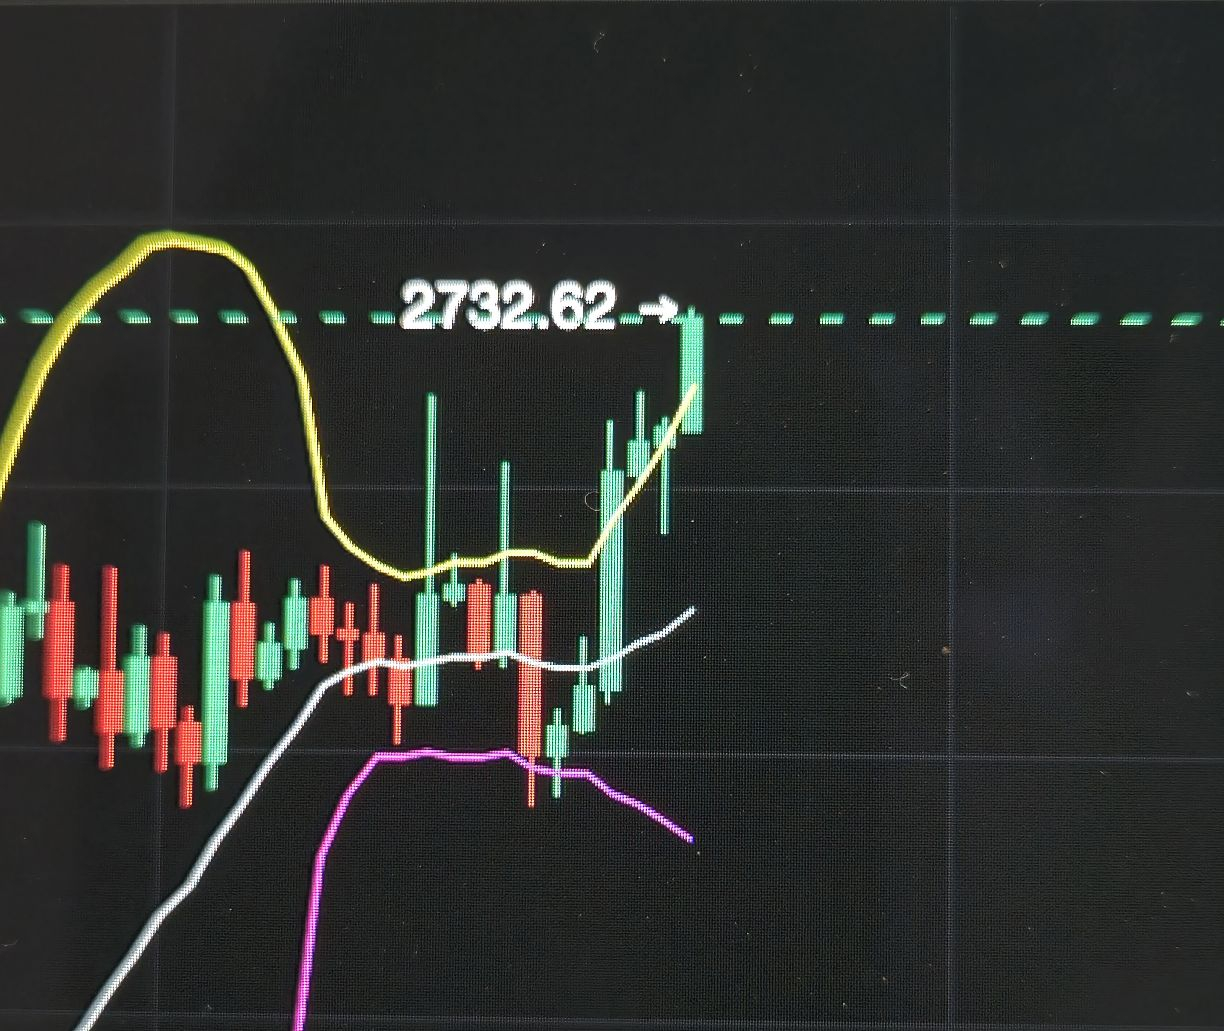
Ethereum, current price is above 2660; the long position was just a little short of reaching the target level. The originally planned target was in the 2780–2800 zone. However, considering that this round of acceleration has already been completed...
Also, there is a weekly-level pressure line that needs attention. So I have already taken profit and exited all the long positions, and I opened the short order head position around 2725. Even if there is another acceleration wave, I estimate the strength won’t be too great, so I’ll try to test the top—this is also to verify my judgment. If my prediction is correct, then at minimum there should be an acceleration and a pullback. I will update the target and pattern analysis afterward.
Ethereum, current price is above 2660; the long position was just a little short of reaching the target level. The originally planned target was in the 2780–2800 zone. However, considering that this round of acceleration has already been completed...
Also, there is a weekly-level pressure line that needs attention. So I have already taken profit and exited all the long positions, and I opened the short order head position around 2725. Even if there is another acceleration wave, I estimate the strength won’t be too great, so I’ll try to test the top—this is also to verify my judgment. If my prediction is correct, then at minimum there should be an acceleration and a pullback. I will update the target and pattern analysis afterward.
Also, there is a weekly-level pressure line that needs attention. So I have already taken profit and exited all the long positions, and I opened the short order head position around 2725. Even if there is another acceleration wave, I estimate the strength won’t be too great, so I’ll try to test the top—this is also to verify my judgment. If my prediction is correct, then at minimum there should be an acceleration and a pullback. I will update the target and pattern analysis afterward.
1
2.7k
·
--
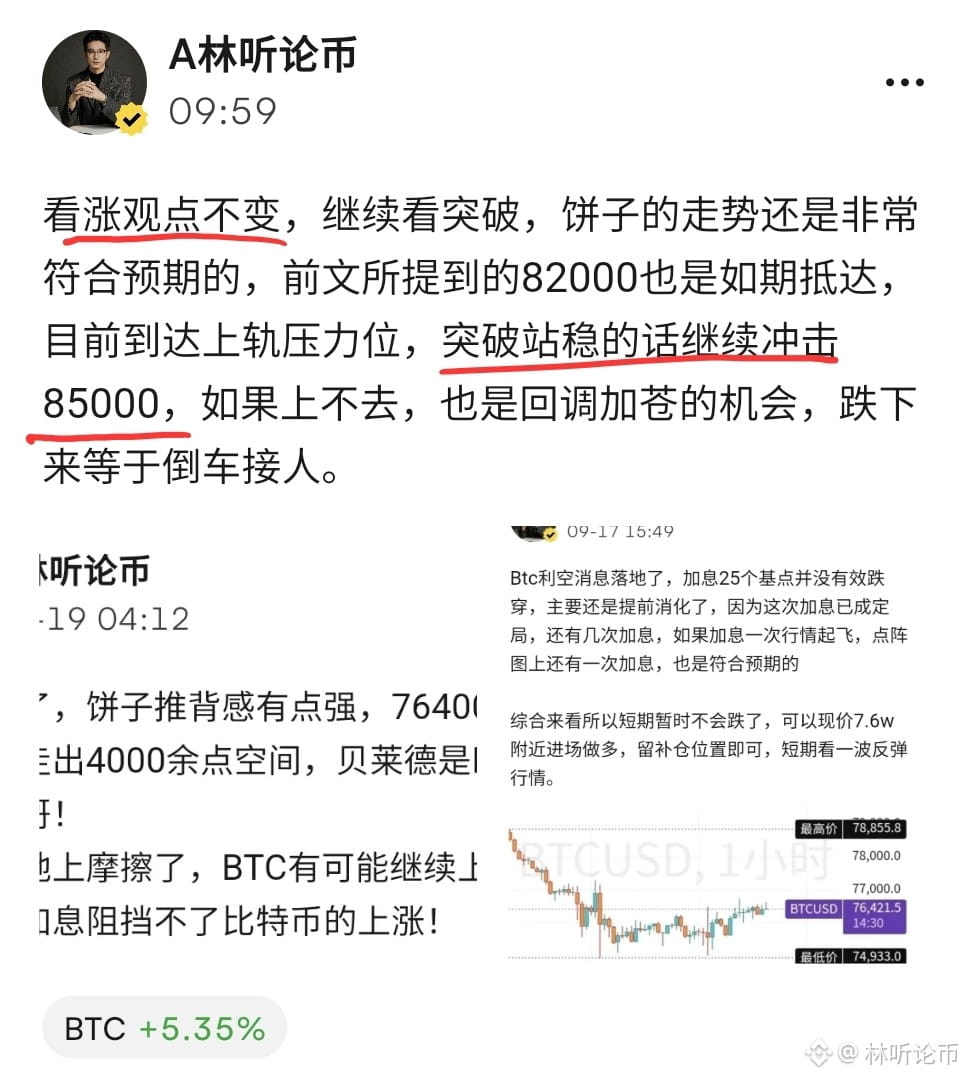
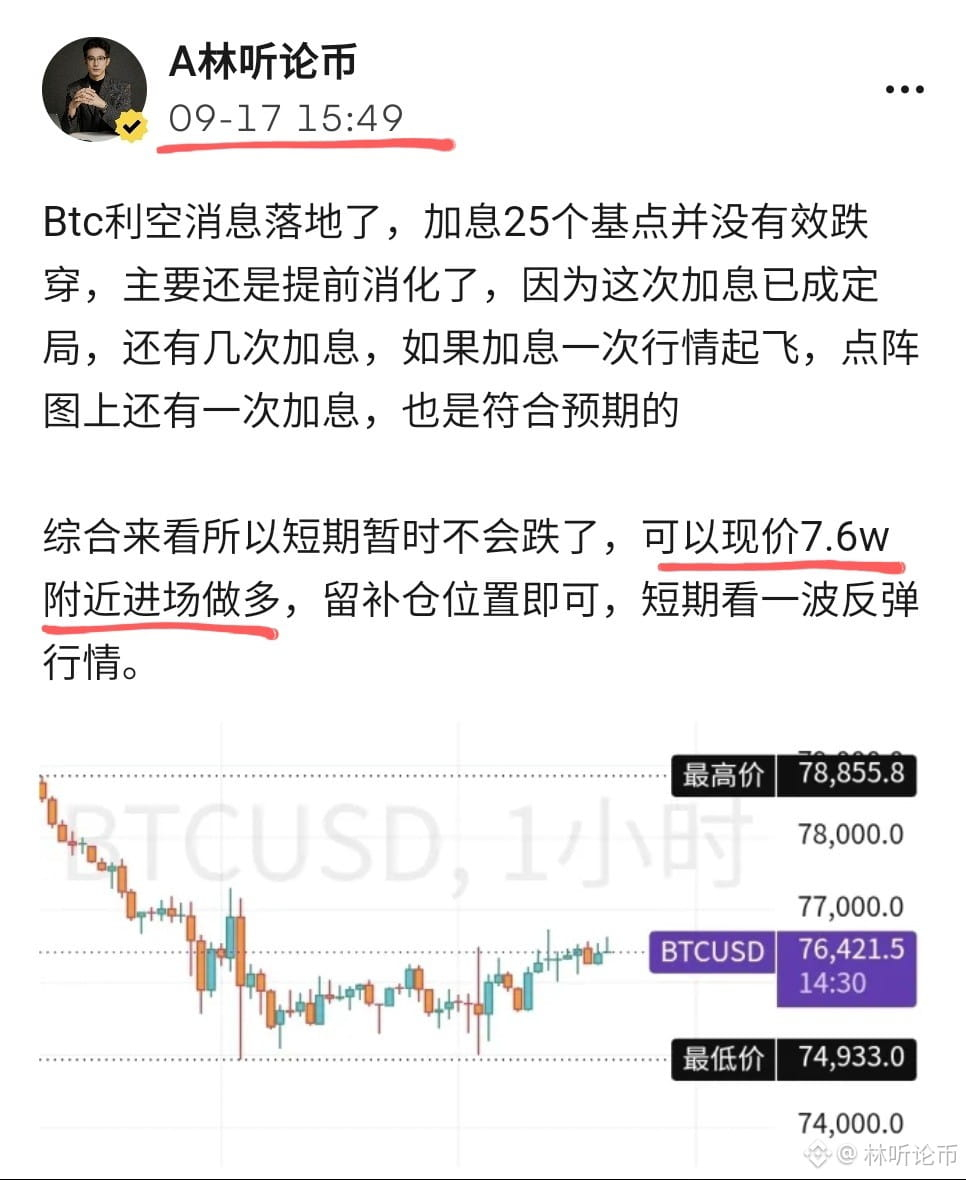
Continuing from the previous episode, the 76,000 mark kept signaling for longs all the way up. The provided take-profit level at 85,000 hit precisely. What I’ve always pursued isn’t the absolute top pinpoint price, but a relatively low entry within a safe range. Now that 85,000 has been reached, won’t 90,000 be far behind? $NVDAB
Continuing from the previous episode, the 76,000 mark kept signaling for longs all the way up. The provided take-profit level at 85,000 hit precisely. What I’ve always pursued isn’t the absolute top pinpoint price, but a relatively low entry within a safe range. Now that 85,000 has been reached, won’t 90,000 be far behind? $NVDAB

1
579
·
--
Ethereum: the 2660 current-price long position has already moved out 90 points of space. Bitcoin's 85000 take-profit level is right on the verge. Here's a reminder: the market is about to break out very soon—don't do anything against the trend, especially don't short.
Ethereum: the 2660 current-price long position has already moved out 90 points of space. Bitcoin's 85000 take-profit level is right on the verge. Here's a reminder: the market is about to break out very soon—don't do anything against the trend, especially don't short.
2.2k
·
--
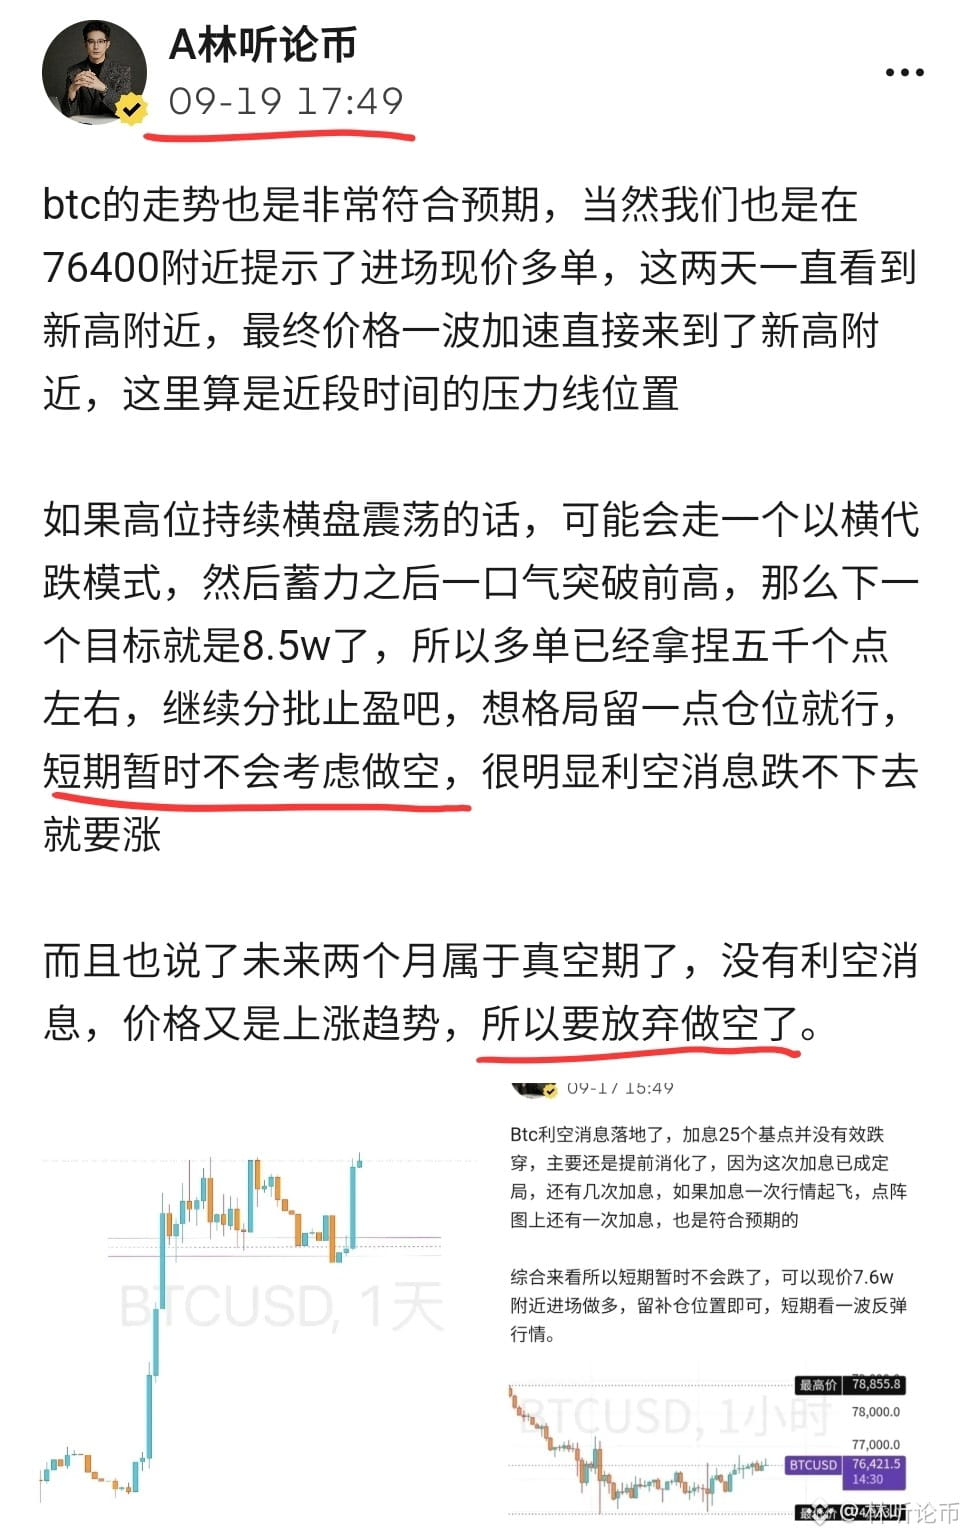
The bullish pushback feeling is genuinely very strong. It’s going crazy and surging upward. Is anyone else still holding long positions with me? Don’t tell me they’re all already gone. I’ve been opening longs continuously—leave some position and hold onto it to wait for 85k. Isn’t that immediately arranged? From 76.3k to 85k, how many points is that? Almost 10,000 points! $NVDAB
The bullish pushback feeling is genuinely very strong. It’s going crazy and surging upward. Is anyone else still holding long positions with me? Don’t tell me they’re all already gone. I’ve been opening longs continuously—leave some position and hold onto it to wait for 85k. Isn’t that immediately arranged? From 76.3k to 85k, how many points is that? Almost 10,000 points! $NVDAB
1.6k
·
--
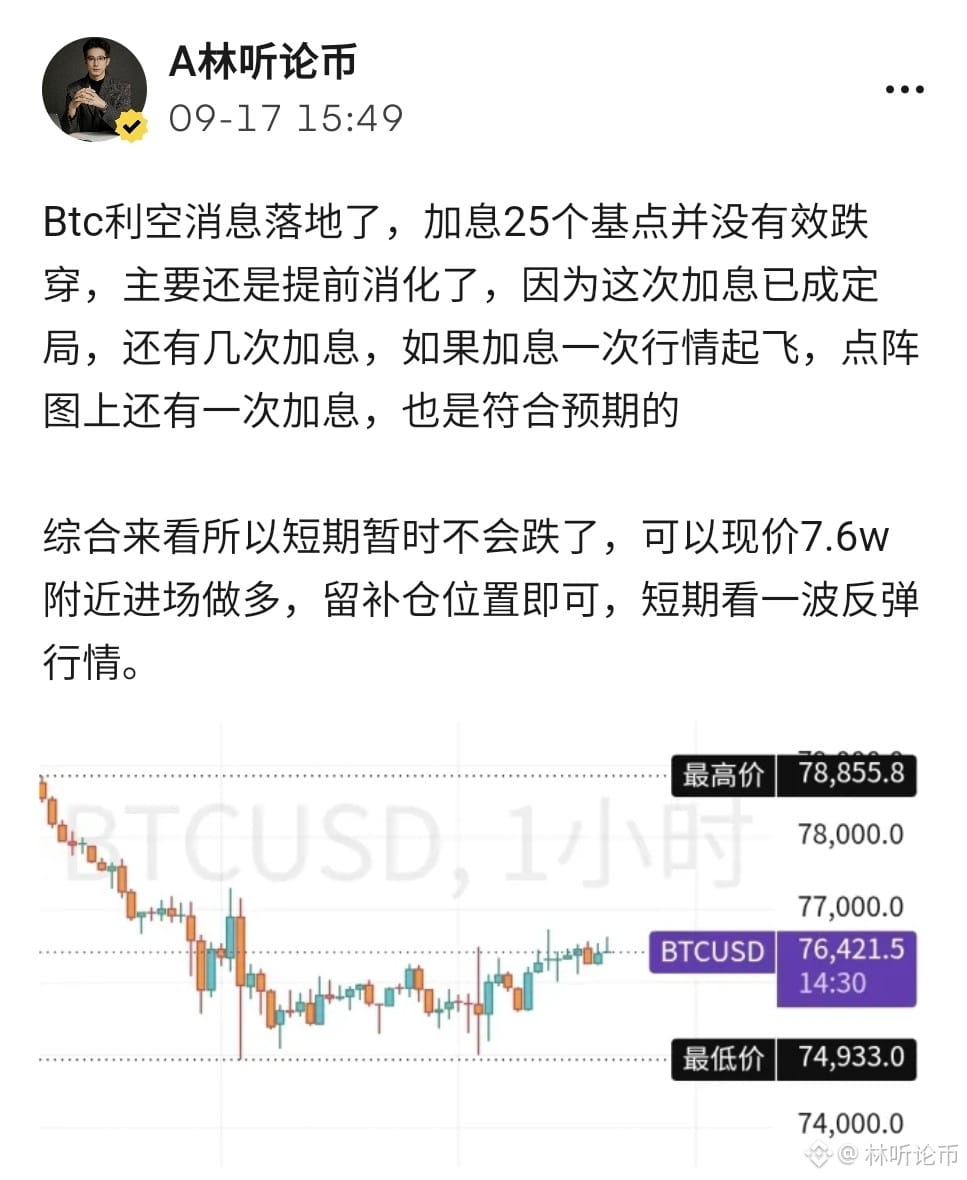
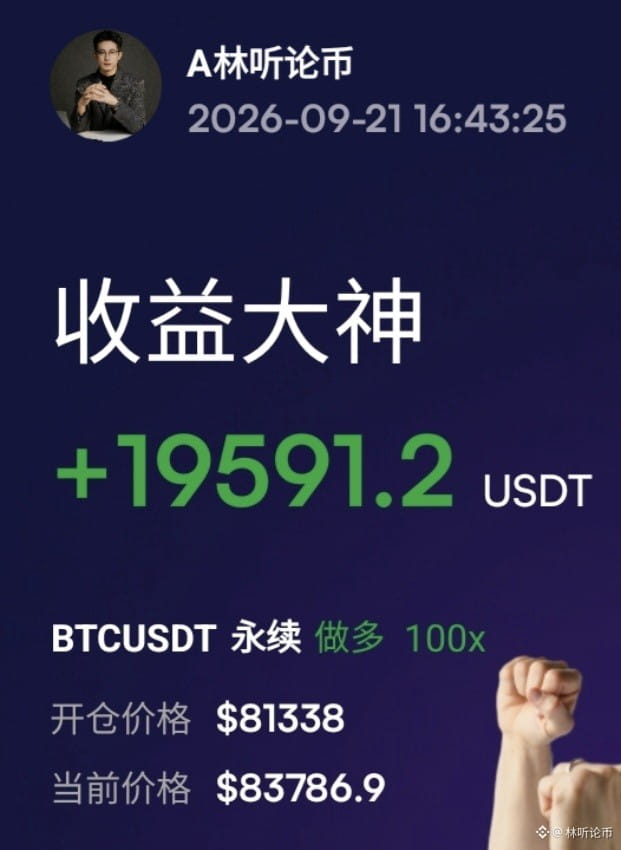
Long positions launched. Since 76,000, the target points of 82,000–85,000 that were guided step by step have been extremely in line with expectations. Once the pie hits 85,000, all ETH at 2,780 will take profit and lock it in!
Long positions launched. Since 76,000, the target points of 82,000–85,000 that were guided step by step have been extremely in line with expectations. Once the pie hits 85,000, all ETH at 2,780 will take profit and lock it in!

1.1k
·
--
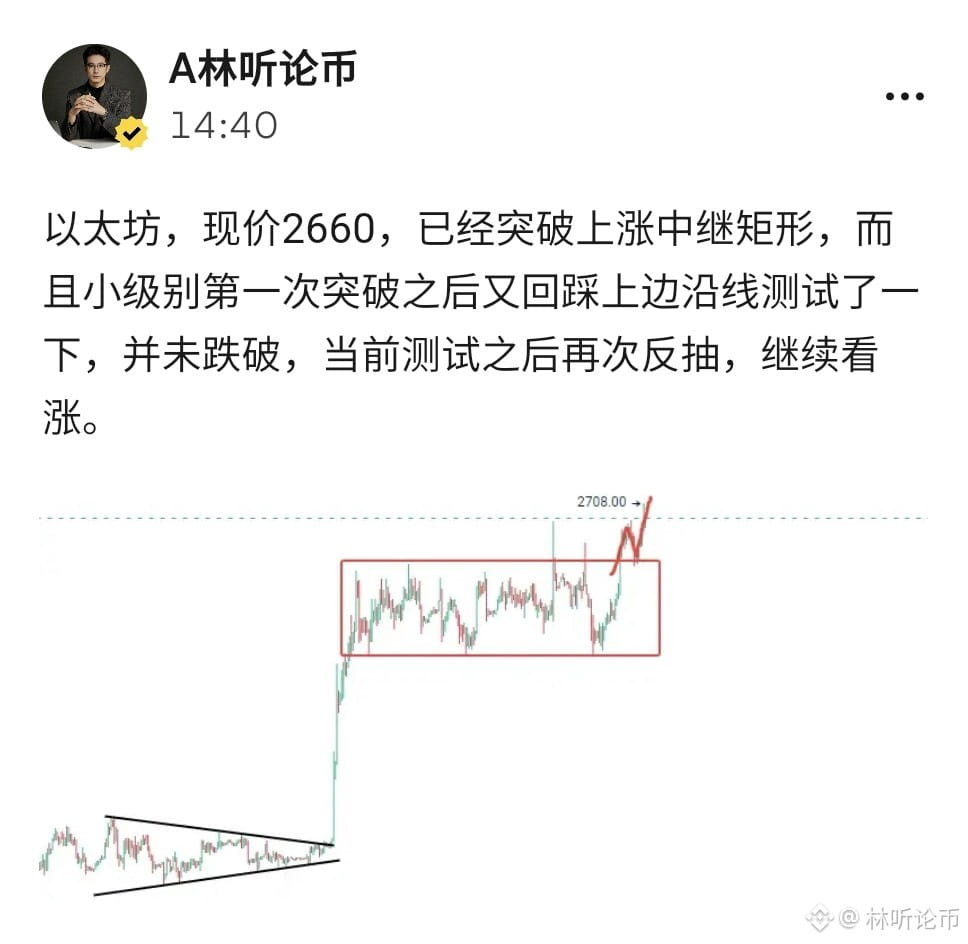
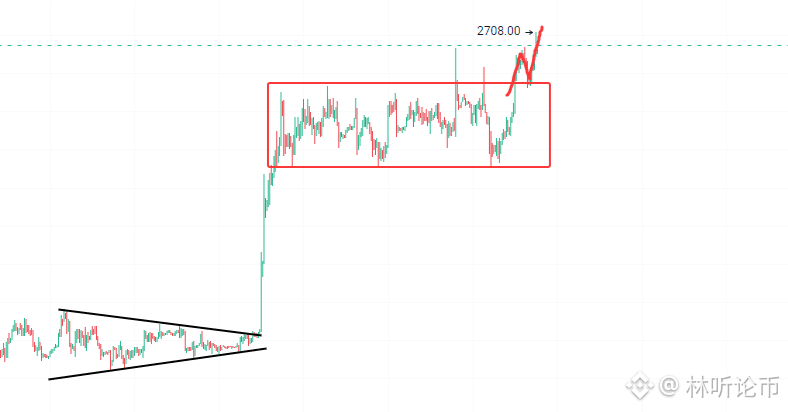
Ethereum, current price 2660. It has already broken through the bullish continuation rectangle. After the first break of the smaller timeframe, it pulled back to retest the upper boundary line once, and it did not break down. After this test, it bounced up again, and we continue to look for bullish movement.$NVDAB
Ethereum, current price 2660. It has already broken through the bullish continuation rectangle. After the first break of the smaller timeframe, it pulled back to retest the upper boundary line once, and it did not break down. After this test, it bounced up again, and we continue to look for bullish movement.$NVDAB
992
·
--
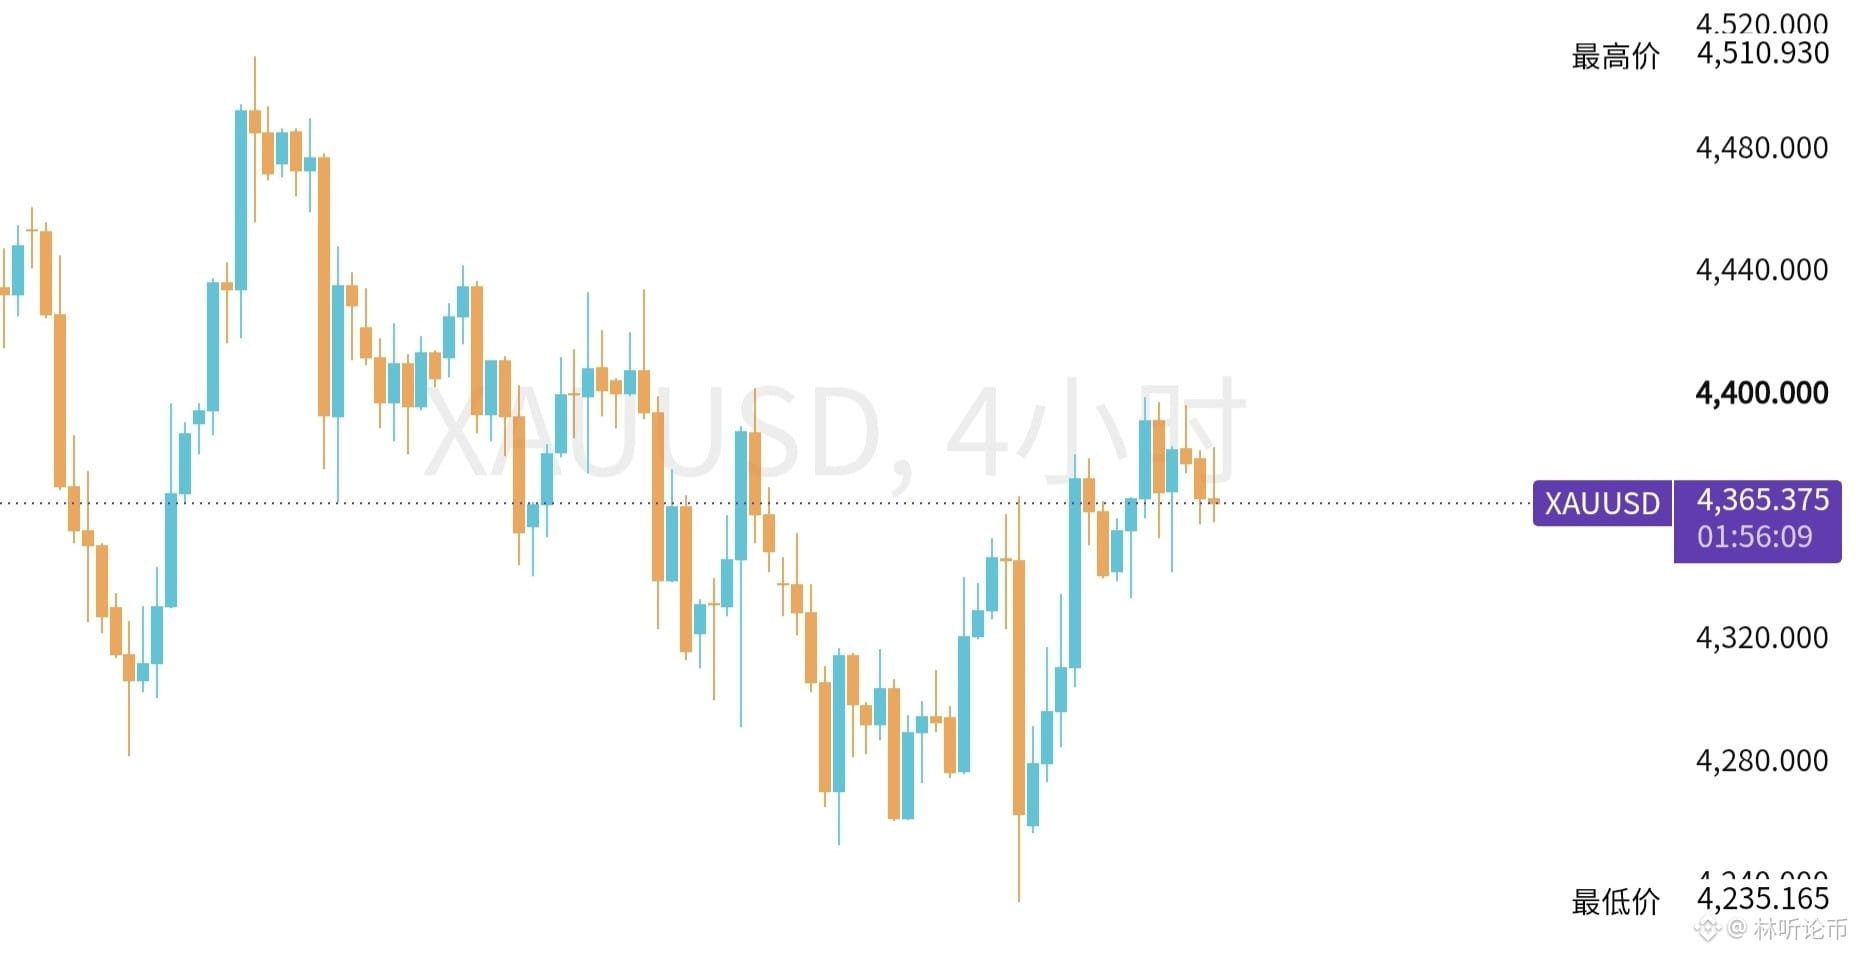
The gold decline in this round is the first pullback within the weekly uptrend. From a technical-structure perspective, price is holding on the weekly support; it has already broken above the 4-hour downtrend line. I believe the bullish trend hasn’t finished yet. If we can pull back to around 4350, I will add to my position, friend. Looking ahead from the bigger-cycle perspective, there is a chance that the market will form a new round of upward movement and challenge the previous high. #以太坊突破2700美元
The gold decline in this round is the first pullback within the weekly uptrend. From a technical-structure perspective, price is holding on the weekly support; it has already broken above the 4-hour downtrend line. I believe the bullish trend hasn’t finished yet. If we can pull back to around 4350, I will add to my position, friend. Looking ahead from the bigger-cycle perspective, there is a chance that the market will form a new round of upward movement and challenge the previous high. #以太坊突破2700美元
207
·
--
Bullish view unchanged, still expecting a breakout. The pie’s price action is still very much in line with expectations. The 82,000 mentioned earlier also reached as expected. It has now reached the upper band resistance level. If it breaks through and holds firm, it will continue to target 85,000. If it can’t go up, then it’s an opportunity for a pullback and a continuation. If it drops, it means the “car” is coming to pick you up. $NVDAB
Bullish view unchanged, still expecting a breakout. The pie’s price action is still very much in line with expectations. The 82,000 mentioned earlier also reached as expected. It has now reached the upper band resistance level. If it breaks through and holds firm, it will continue to target 85,000. If it can’t go up, then it’s an opportunity for a pullback and a continuation. If it drops, it means the “car” is coming to pick you up. $NVDAB

296
Log in to explore more content
Join global crypto users on Binance Square
⚡️ Get latest and useful information about crypto.
💬 Trusted by the world’s largest crypto exchange.
👍 Discover real insights from verified creators.
Email / Phone number
Trending Topics
CircleMints500MUSDCOnSolana
42,422 views
1,108 Discussing
💵 Solana just received another $500M of USDC. But don't make the mistake everyone else is making...
#circlemints500musdconsolana
Circle's USDC Treasury recorded two 250M USDC mints on Solana, creating $500M of fresh supply through its authorized infrastructure.
Circle now reports $75.2B USDC in circulation globally.
But:
A mint is not the same as $500M of fresh market demand.
It tells us Circle created the inventory.
It does not tell us that $500M has already entered Solana DeFi, exchanges, payments or trading.
That's where the interesting signal begins.
Solana's stablecoin economy is already operating at enormous scale, with recent reporting putting network stablecoin volume above $5T in 2026.
So this isn't really a “USDC mint = SOL bullish” story.
It's an inventory → deployment story.
Watch the wallets.
Where does that $500M move next?
If it gets deployed into exchanges, lending, payments or liquidity pools, the market has something much more meaningful than a treasury print.
The mint confirms creation of USDC, not the eventual destination or economic use of the funds.
$SOL $RARE $USDC
#CircleMints500MUSDCOnSolana #solana #BlackRockBuildsTokenizedPortfoliosForOndo #defi
Stink meaner
·6 Likes
·4.8k views
PolymarketBankFailureBetsDrawFDICConcern
55,696 views
1,222 Discussing
BlackRockBuildsTokenizedPortfoliosForOndo
44,351 views
844 Discussing