

Nova Ledger
Crypto Master, Expert Trader and Content Creator • X: @NovaLedgeer
65 Following
9.3K+ Followers
226 Liked
Posts
All
Quotes
PINNED


奕泽YIZZE-1688
·
--
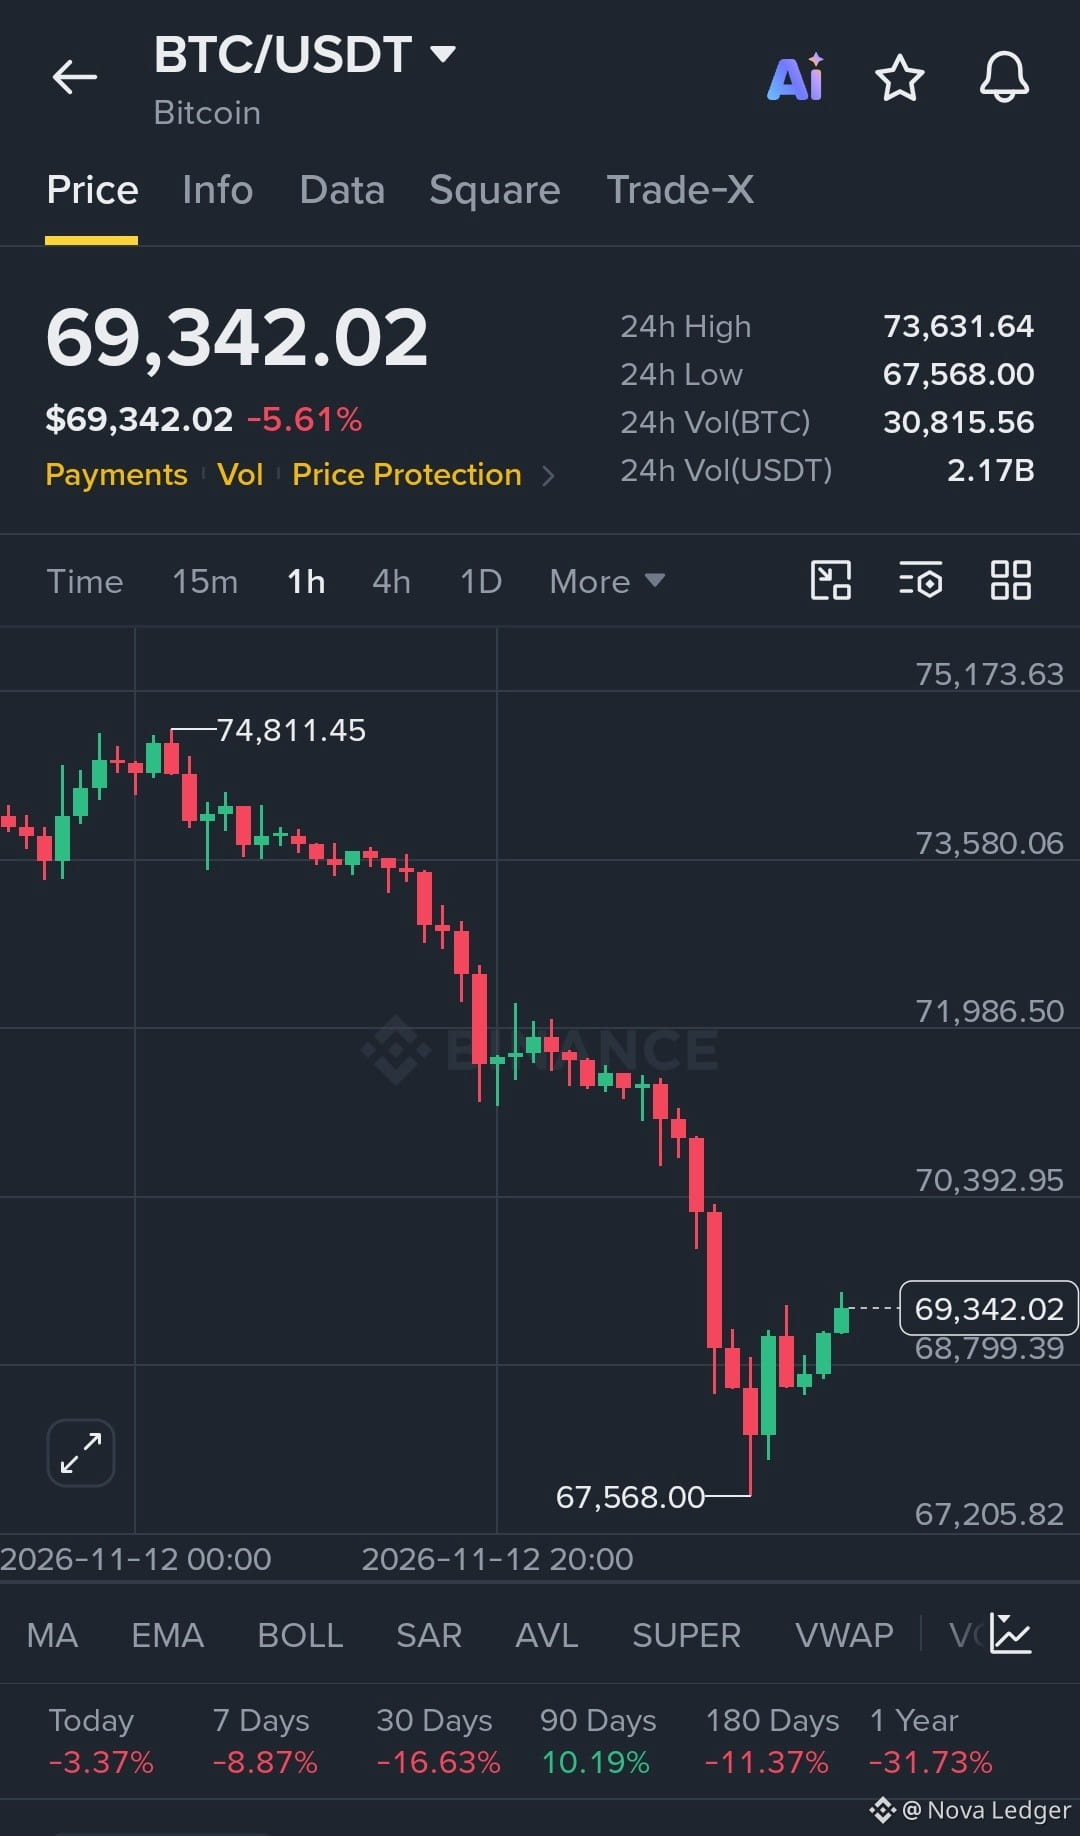
$BTC Falls Below $70,000! Continued Outflows—Are Institutional Investors Changing Course?
Bitcoin’s performance over the past few days has indeed been rather lackluster.
According to a November 13 report from CoinDesk, $BTC briefly fell to $67,770, its lowest level since August 19, and dropped below $70,000 for the first time.
What’s more noteworthy is the flow of funds.
According to data from Farside Investors, as of November 13, U.S. spot Bitcoin ETFs had seen cumulative net outflows of about $1.88 billion this month. Continued institutional outflows have put some pressure on the market.
So, does this mean institutions are no longer bullish on Bitcoin?
I don’t think we can draw that conclusion just yet.
According to a November 13 report from CoinDesk, $BTC briefly fell to $67,770, its lowest level since August 19, and dropped below $70,000 for the first time.
What’s more noteworthy is the flow of funds.
According to data from Farside Investors, as of November 13, U.S. spot Bitcoin ETFs had seen cumulative net outflows of about $1.88 billion this month. Continued institutional outflows have put some pressure on the market.
So, does this mean institutions are no longer bullish on Bitcoin?
I don’t think we can draw that conclusion just yet.


Leo - F0
·
--
Bullish🧧🧧🔥GOOD MORNING MY FAMİLY.🔥🧧🧧
🔥 CLAİM RED PACKET GUYS🧧💋
$NEAR SOON $7💙🔥 $BTC buying dip.$ETH #TradFiForBeginners #WhatWillDriveCryptoandStocks’NextRebound? #WhoWillSucceedJensenHuangatNvidia? #xrp #DOGE
🔥 CLAİM RED PACKET GUYS🧧💋
$NEAR SOON $7💙🔥 $BTC buying dip.$ETH #TradFiForBeginners #WhatWillDriveCryptoandStocks’NextRebound? #WhoWillSucceedJensenHuangatNvidia? #xrp #DOGE



Sheemm
·
--
🎁🎁🎁🎁🎁 HELLO FAMILY 👋👋
LIKE REPOST
COMMENT AND
CLAIM
YOUR GIFT 🎁🎁🎁🎁
$BANANAS31
$AAPLB $SPCXB
LIKE REPOST
COMMENT AND
CLAIM
YOUR GIFT 🎁🎁🎁🎁
$BANANAS31
$AAPLB $SPCXB

Usman_BNB
·
--
1 Million Pepe Coin Reward For 100 Lucky Binance Square Users Hurry Up$PEPE


Dafoor
·
--
🎁🧧🎁🧧🎁🧧🎁🧧🎁🧧🧧🧧🎁🎁🧧🎁🧧🎁🧧🎁🧧🎁🧧🎁🧧🎁🧧🧧🎁🧧🧧🎁🧧🧧🎁🎁🧧🧧🧧🎁🧧🧧🎁🎁🧧🧧🧧🎁


易琳Ten
·
--
☀ Yilin’s Daily Words: Speak gently, act firmly. Being gentle yet powerful is the rarest virtue.


E L E X A
·
--
🚨 IT’S LIVE 🚨
Watching is simple… but winners take action 👀
🎁 Want FREE $USDT?
💬 Comment 888
❤️ Like
🔁 Share
➕ Follow
⏳ Don’t miss your chance — spots are limited!
Drop 888 below and join now 🚀
#Crypto #USDT #Giveaway
Watching is simple… but winners take action 👀
🎁 Want FREE $USDT?
💬 Comment 888
❤️ Like
🔁 Share
➕ Follow
⏳ Don’t miss your chance — spots are limited!
Drop 888 below and join now 🚀
#Crypto #USDT #Giveaway


XY学仪-神话MUA
·
--
#币安神算子 Check in daily, trade, share, and calculate to earn points and share USDC. Come give it a try!$SOL

Sara_ k
·
--
.Don’t let your crypto sit idle earn daily rewards with #BinanceEarn and grow your holdings effortlessly
.
claim sol 🧧🧧🧧🧧🧧🧧🧧
.
.
.
claim sol 🧧🧧🧧🧧🧧🧧🧧
.
.


NOOR_011
·
--
FOLLOW 🥰🥰🥰🥰
CALIM BIG GIFTS 🧧🧧
CALIM BIG GIFTS 🧧🧧


Log in to explore more content