

noooorrrr
247 Posts

noooorrrr
Report
Block User
Someman🌹 🌹
13 Following
57 Followers
278 Liked
Posts
Portfolio
All
Quotes
Videos
·
--
$SOPH 📊 SOPH/USDT
Strong price movement accompanied by increased trading volume, with RSI reaching 73.94, indicating overbought conditions. The price is experiencing a slight pullback after approaching 0.00250 USDT, while support and resistance levels continue to be monitored.
{spot}(SOPHUSDT)
$SOPH 📊 SOPH/USDT
Strong price movement accompanied by increased trading volume, with RSI reaching 73.94, indicating overbought conditions. The price is experiencing a slight pullback after approaching 0.00250 USDT, while support and resistance levels continue to be monitored.
Strong price movement accompanied by increased trading volume, with RSI reaching 73.94, indicating overbought conditions. The price is experiencing a slight pullback after approaching 0.00250 USDT, while support and resistance levels continue to be monitored.
156
·
--
Bullish
$LTC 📊 LTC/USDT Analysis
Litecoin is trading at $55.79 after declining 4.44% over 24 hours. The price is moving sideways following a downward move, with an RSI of 46.92 and relatively low trading volumes, reflecting continued volatility and weak momentum.
{spot}(LTCUSDT)
$LTC 📊 LTC/USDT Analysis
Litecoin is trading at $55.79 after declining 4.44% over 24 hours. The price is moving sideways following a downward move, with an RSI of 46.92 and relatively low trading volumes, reflecting continued volatility and weak momentum.
Litecoin is trading at $55.79 after declining 4.44% over 24 hours. The price is moving sideways following a downward move, with an RSI of 46.92 and relatively low trading volumes, reflecting continued volatility and weak momentum.
1
199
·
--
Article
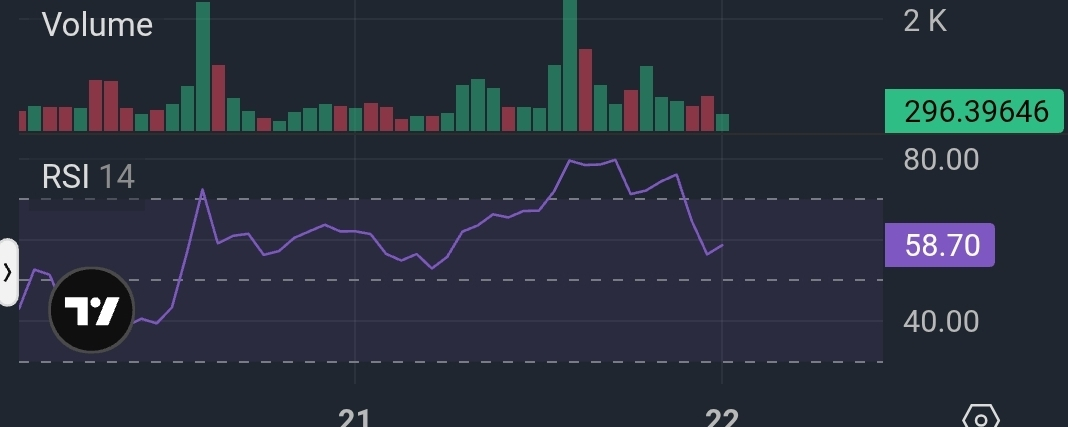
Bitcoin (BTC) Update: Is the King Getting Ready to Break Out, or Just Taking a Breather? 📊🔥$BTC Hey everyone, let’s take a quick look at today’s Bitcoin (BTC/USDT) chart and figure out where we’re headed amid the current market volatility.
Bitcoin is currently hovering around $84,236, posting a slight gain over the past few hours. Looking at the charts (the 1-hour timeframe and the flow chart), the price is trying to build a strong support base after the recent drop, which tested the $80,000s.
Bitcoin (BTC) Update: Is the King Getting Ready to Break Out, or Just Taking a Breather? 📊🔥
$BTC Hey everyone, let’s take a quick look at today’s Bitcoin (BTC/USDT) chart and figure out where we’re headed amid the current market volatility.
Bitcoin is currently hovering around $84,236, posting a slight gain over the past few hours. Looking at the charts (the 1-hour timeframe and the flow chart), the price is trying to build a strong support base after the recent drop, which tested the $80,000s.
Bitcoin is currently hovering around $84,236, posting a slight gain over the past few hours. Looking at the charts (the 1-hour timeframe and the flow chart), the price is trying to build a strong support base after the recent drop, which tested the $80,000s.
1
133
·
--
Bullish
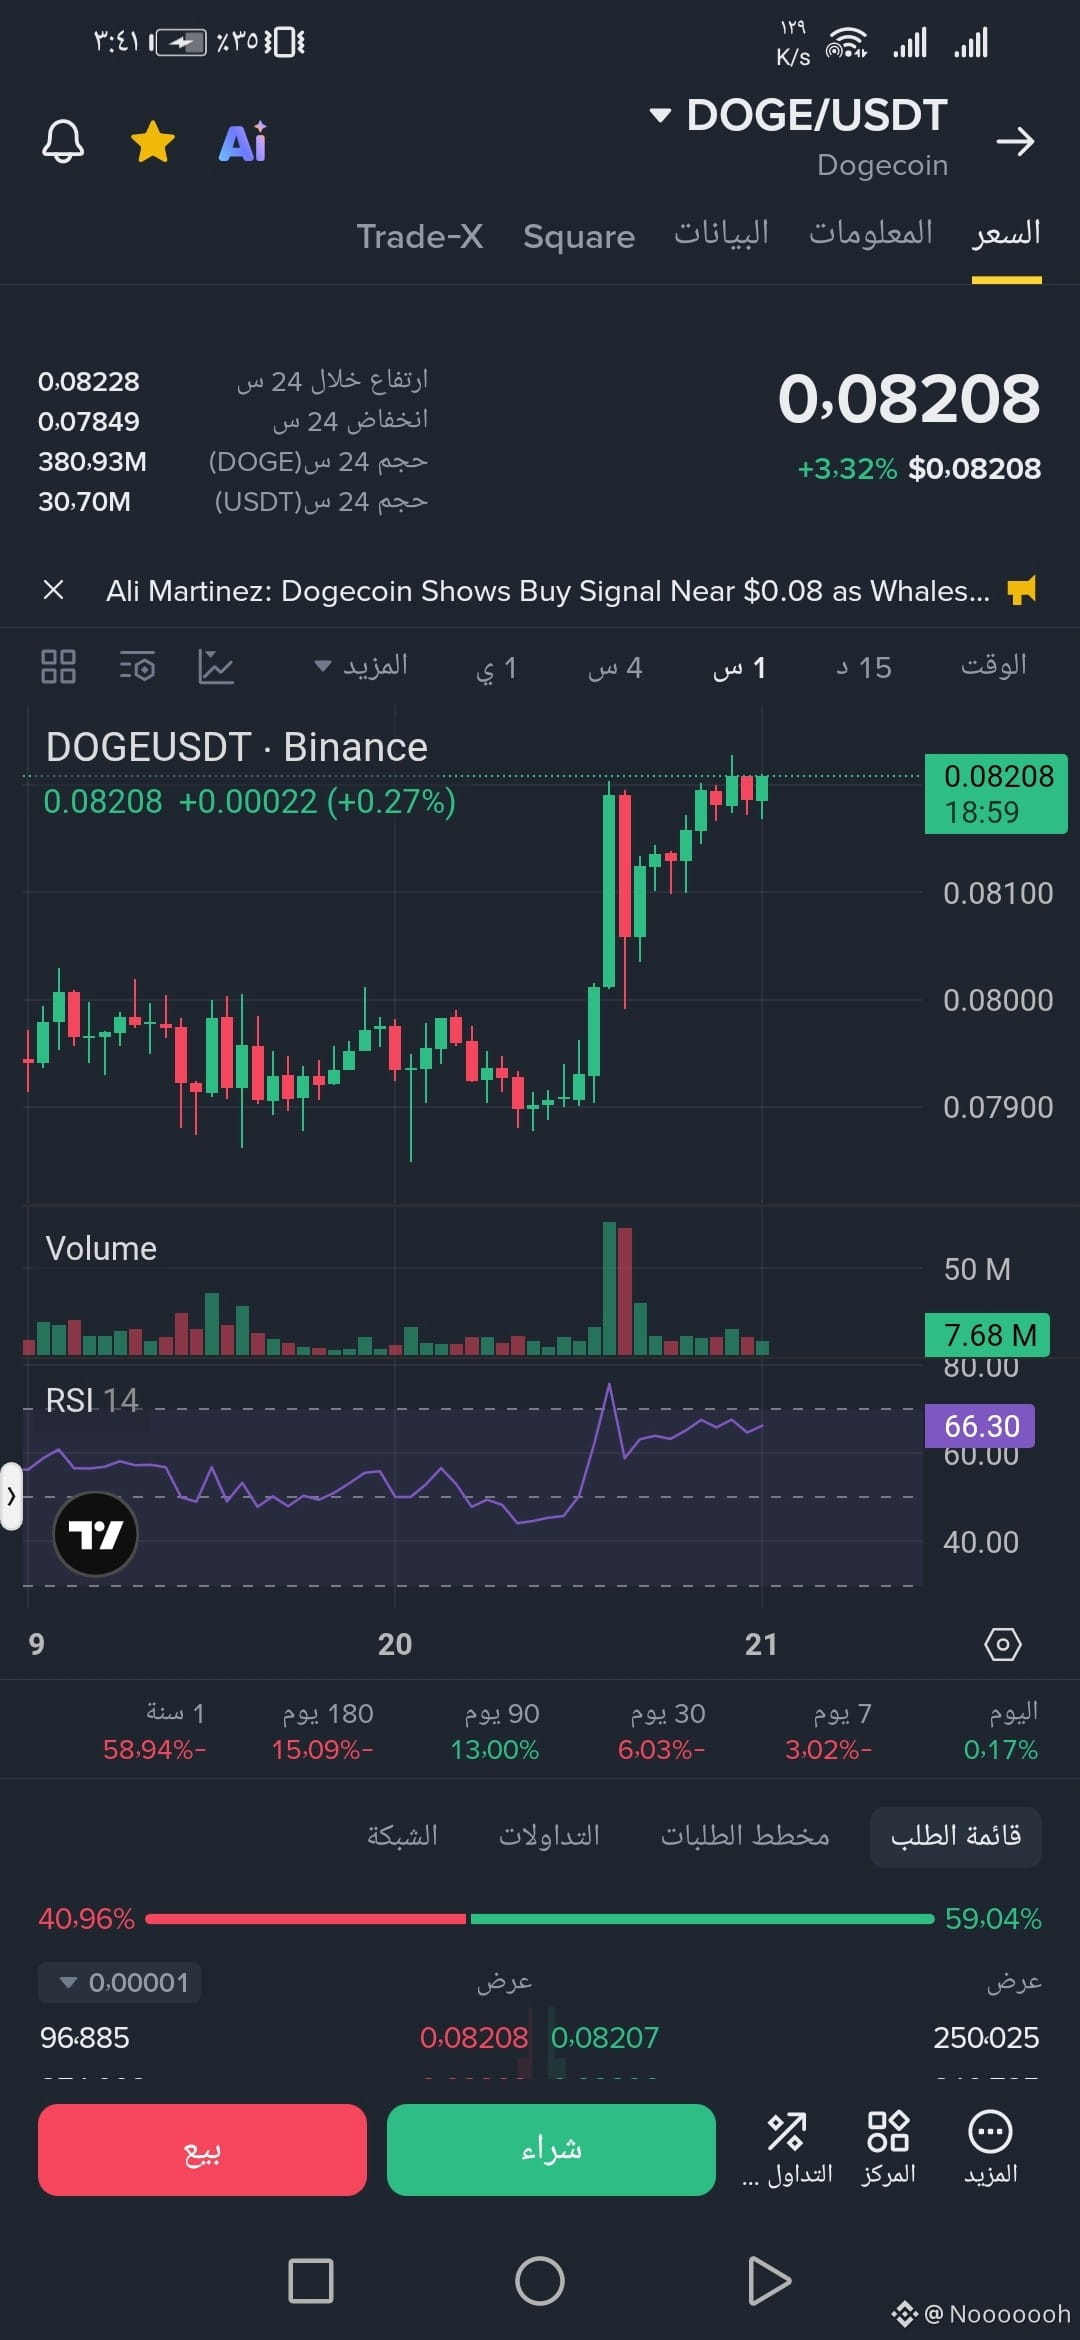
$DOGE I’ve noticed that DOGE has started moving positively, and its price has reached approximately $0.082. If the momentum continues, we could see further gains, but we should be mindful of the possibility of a correction. The market is volatile, and this is not investment advice.
$DOGE I’ve noticed that DOGE has started moving positively, and its price has reached approximately $0.082. If the momentum continues, we could see further gains, but we should be mindful of the possibility of a correction. The market is volatile, and this is not investment advice.
1
167
·
--
$PHA The PHA coin caught my attention today after its sharp rise, reaching $0.064 in the image, up more than 33% over 24 hours. Trading volume increased significantly, indicating considerable market activity, but an RSI of 73 suggests a possible correction. As for the news, Phala Network continues to develop its infrastructure for confidential computing and artificial intelligence. I expect volatility to continue, and it’s important to monitor support and resistance levels before entering a position. ⚠️ This is my personal analysis, not investment advice, and the market may move contrary to expectations
{spot}(PHAUSDT)
$PHA The PHA coin caught my attention today after its sharp rise, reaching $0.064 in the image, up more than 33% over 24 hours. Trading volume increased significantly, indicating considerable market activity, but an RSI of 73 suggests a possible correction. As for the news, Phala Network continues to develop its infrastructure for confidential computing and artificial intelligence. I expect volatility to continue, and it’s important to monitor support and resistance levels before entering a position. ⚠️ This is my personal analysis, not investment advice, and the market may move contrary to expectations
218
·
--
$PEPE PEPE coin analysis:
PEPE is showing signs of recovery after rising to $0.00000398, with buying momentum improving and the Relative Strength Index reaching 60.68, supporting the possibility of further short-term gains. The $0.00000400 level is a key resistance; breaking above it with strong trading volume could pave the way toward $0.00000410. However, a drop below $0.00000390 could send the price back to test support at $0.00000380. Bitcoin’s movements and trading volume remain influential factors in the next direction. ⚠️ Warning: This is a probabilistic technical analysis, not a guarantee of profit or a recommendation to buy or sell. Cryptocurrencies are highly volatile, so manage risk carefully.
$PEPE PEPE coin analysis:
PEPE is showing signs of recovery after rising to $0.00000398, with buying momentum improving and the Relative Strength Index reaching 60.68, supporting the possibility of further short-term gains. The $0.00000400 level is a key resistance; breaking above it with strong trading volume could pave the way toward $0.00000410. However, a drop below $0.00000390 could send the price back to test support at $0.00000380. Bitcoin’s movements and trading volume remain influential factors in the next direction. ⚠️ Warning: This is a probabilistic technical analysis, not a guarantee of profit or a recommendation to buy or sell. Cryptocurrencies are highly volatile, so manage risk carefully.
PEPE is showing signs of recovery after rising to $0.00000398, with buying momentum improving and the Relative Strength Index reaching 60.68, supporting the possibility of further short-term gains. The $0.00000400 level is a key resistance; breaking above it with strong trading volume could pave the way toward $0.00000410. However, a drop below $0.00000390 could send the price back to test support at $0.00000380. Bitcoin’s movements and trading volume remain influential factors in the next direction. ⚠️ Warning: This is a probabilistic technical analysis, not a guarantee of profit or a recommendation to buy or sell. Cryptocurrencies are highly volatile, so manage risk carefully.
1
188
·
--
Bullish
$BNB 📊 BNB coin analysis and latest updates
BNB is trading near $722 according to the chart, with selling pressure continuing. The Relative Strength Index (RSI) is at 38.94, reflecting weak momentum with the possibility of a temporary rebound. 🟡 Attention is focused on support at $718, followed by $708, while $730 represents nearby resistance. Recent market news points to price fluctuations below $730. ⚠️ Trading involves risk; this is a technical analysis, not investment advice.🚀
{spot}(BNBUSDT)
$BNB 📊 BNB coin analysis and latest updates
BNB is trading near $722 according to the chart, with selling pressure continuing. The Relative Strength Index (RSI) is at 38.94, reflecting weak momentum with the possibility of a temporary rebound. 🟡 Attention is focused on support at $718, followed by $708, while $730 represents nearby resistance. Recent market news points to price fluctuations below $730. ⚠️ Trading involves risk; this is a technical analysis, not investment advice.🚀
BNB is trading near $722 according to the chart, with selling pressure continuing. The Relative Strength Index (RSI) is at 38.94, reflecting weak momentum with the possibility of a temporary rebound. 🟡 Attention is focused on support at $718, followed by $708, while $730 represents nearby resistance. Recent market news points to price fluctuations below $730. ⚠️ Trading involves risk; this is a technical analysis, not investment advice.🚀
1
79
·
--
$DOT 📊 Polkadot (DOT): Can the price continue rising? 🚀
DOT is trading near $1.176, following a notable recovery from lower levels on the chart. The RSI indicator reads around 59, reflecting relatively positive momentum without entering overbought territory. The $1.20 level stands out as nearby resistance, while the $1.15–$1.16 range may serve as support that the price needs to hold. A decisive breakout above resistance could support further gains, while a loss of support may bring selling pressure back. ⚠️ Disclaimer: This is educational technical analysis, not investment advice; the cryptocurrency market is volatile, and you may lose part of your capital. DYOR
$DOT 📊 Polkadot (DOT): Can the price continue rising? 🚀
DOT is trading near $1.176, following a notable recovery from lower levels on the chart. The RSI indicator reads around 59, reflecting relatively positive momentum without entering overbought territory. The $1.20 level stands out as nearby resistance, while the $1.15–$1.16 range may serve as support that the price needs to hold. A decisive breakout above resistance could support further gains, while a loss of support may bring selling pressure back. ⚠️ Disclaimer: This is educational technical analysis, not investment advice; the cryptocurrency market is volatile, and you may lose part of your capital. DYOR
DOT is trading near $1.176, following a notable recovery from lower levels on the chart. The RSI indicator reads around 59, reflecting relatively positive momentum without entering overbought territory. The $1.20 level stands out as nearby resistance, while the $1.15–$1.16 range may serve as support that the price needs to hold. A decisive breakout above resistance could support further gains, while a loss of support may bring selling pressure back. ⚠️ Disclaimer: This is educational technical analysis, not investment advice; the cryptocurrency market is volatile, and you may lose part of your capital. DYOR
1
421
·
--
Zcash (ZEC) $ZEC is showing positive signs of recovery, with its price trading near $1,224 and the RSI rising to 54.13, reflecting improving buying momentum. The price is facing nearby resistance that could determine the next direction of movement. A breakout above it on strong trading volume could support further gains, while a pullback remains possible. Trading requires careful risk management.👇👇
{spot}(ZECUSDT)
Zcash (ZEC) $ZEC is showing positive signs of recovery, with its price trading near $1,224 and the RSI rising to 54.13, reflecting improving buying momentum. The price is facing nearby resistance that could determine the next direction of movement. A breakout above it on strong trading volume could support further gains, while a pullback remains possible. Trading requires careful risk management.👇👇
1
237
·
--
Analysis of Dogecoin (DOGE) ($DOGE ): Dogecoin is trading near $0.08668, up approximately 0.97%, as shown in the chart. The chart depicts a rapid rise followed by a limited pullback, while the RSI is around 56.46, indicating moderate positive momentum. Technically, the 0.0870–0.0877 area represents near-term resistance, while 0.0860 and then 0.0850 stand out as potential support levels. In other news, Bitwise announced the closure of its Dogecoin-linked ETF due to weak demand, with trading expected to end on October 14, 2026. Continued upward movement requires strong trading volume and a break above resistance; otherwise, a pullback may resume. These are potential scenarios and not guarantees.
Analysis of Dogecoin (DOGE) ($DOGE ): Dogecoin is trading near $0.08668, up approximately 0.97%, as shown in the chart. The chart depicts a rapid rise followed by a limited pullback, while the RSI is around 56.46, indicating moderate positive momentum. Technically, the 0.0870–0.0877 area represents near-term resistance, while 0.0860 and then 0.0850 stand out as potential support levels. In other news, Bitwise announced the closure of its Dogecoin-linked ETF due to weak demand, with trading expected to end on October 14, 2026. Continued upward movement requires strong trading volume and a break above resistance; otherwise, a pullback may resume. These are potential scenarios and not guarantees.
1
71
·
--
#EtherETFsExtendOutflowsToNineDays Ethereum (ETH) is making notable moves as pressure related to ETF outflows continues, a factor that could affect investor sentiment in the short term. According to the chart, ETH is trading near $2,545, with a strong rise on the hourly timeframe and a notable increase in trading volume. However, the RSI at 74.66 indicates strong buying momentum and the possibility of a temporary correction. A breakout above the $2,550 zone and holding there could support further gains, while a move back below $2,520 could bring selling pressure back. Monitor flows and liquidity before making any decisions; the market is volatile, and forecasts are no guarantee of results.$ETH
{spot}(ETHUSDT)
#EtherETFsExtendOutflowsToNineDays Ethereum (ETH) is making notable moves as pressure related to ETF outflows continues, a factor that could affect investor sentiment in the short term. According to the chart, ETH is trading near $2,545, with a strong rise on the hourly timeframe and a notable increase in trading volume. However, the RSI at 74.66 indicates strong buying momentum and the possibility of a temporary correction. A breakout above the $2,550 zone and holding there could support further gains, while a move back below $2,520 could bring selling pressure back. Monitor flows and liquidity before making any decisions; the market is volatile, and forecasts are no guarantee of results.$ETH
1
85
·
--
Bullish
$DOGE 🐕 Dogecoin (DOGE) | Are the bulls gearing up for another round?
{spot}(DOGEUSDT)
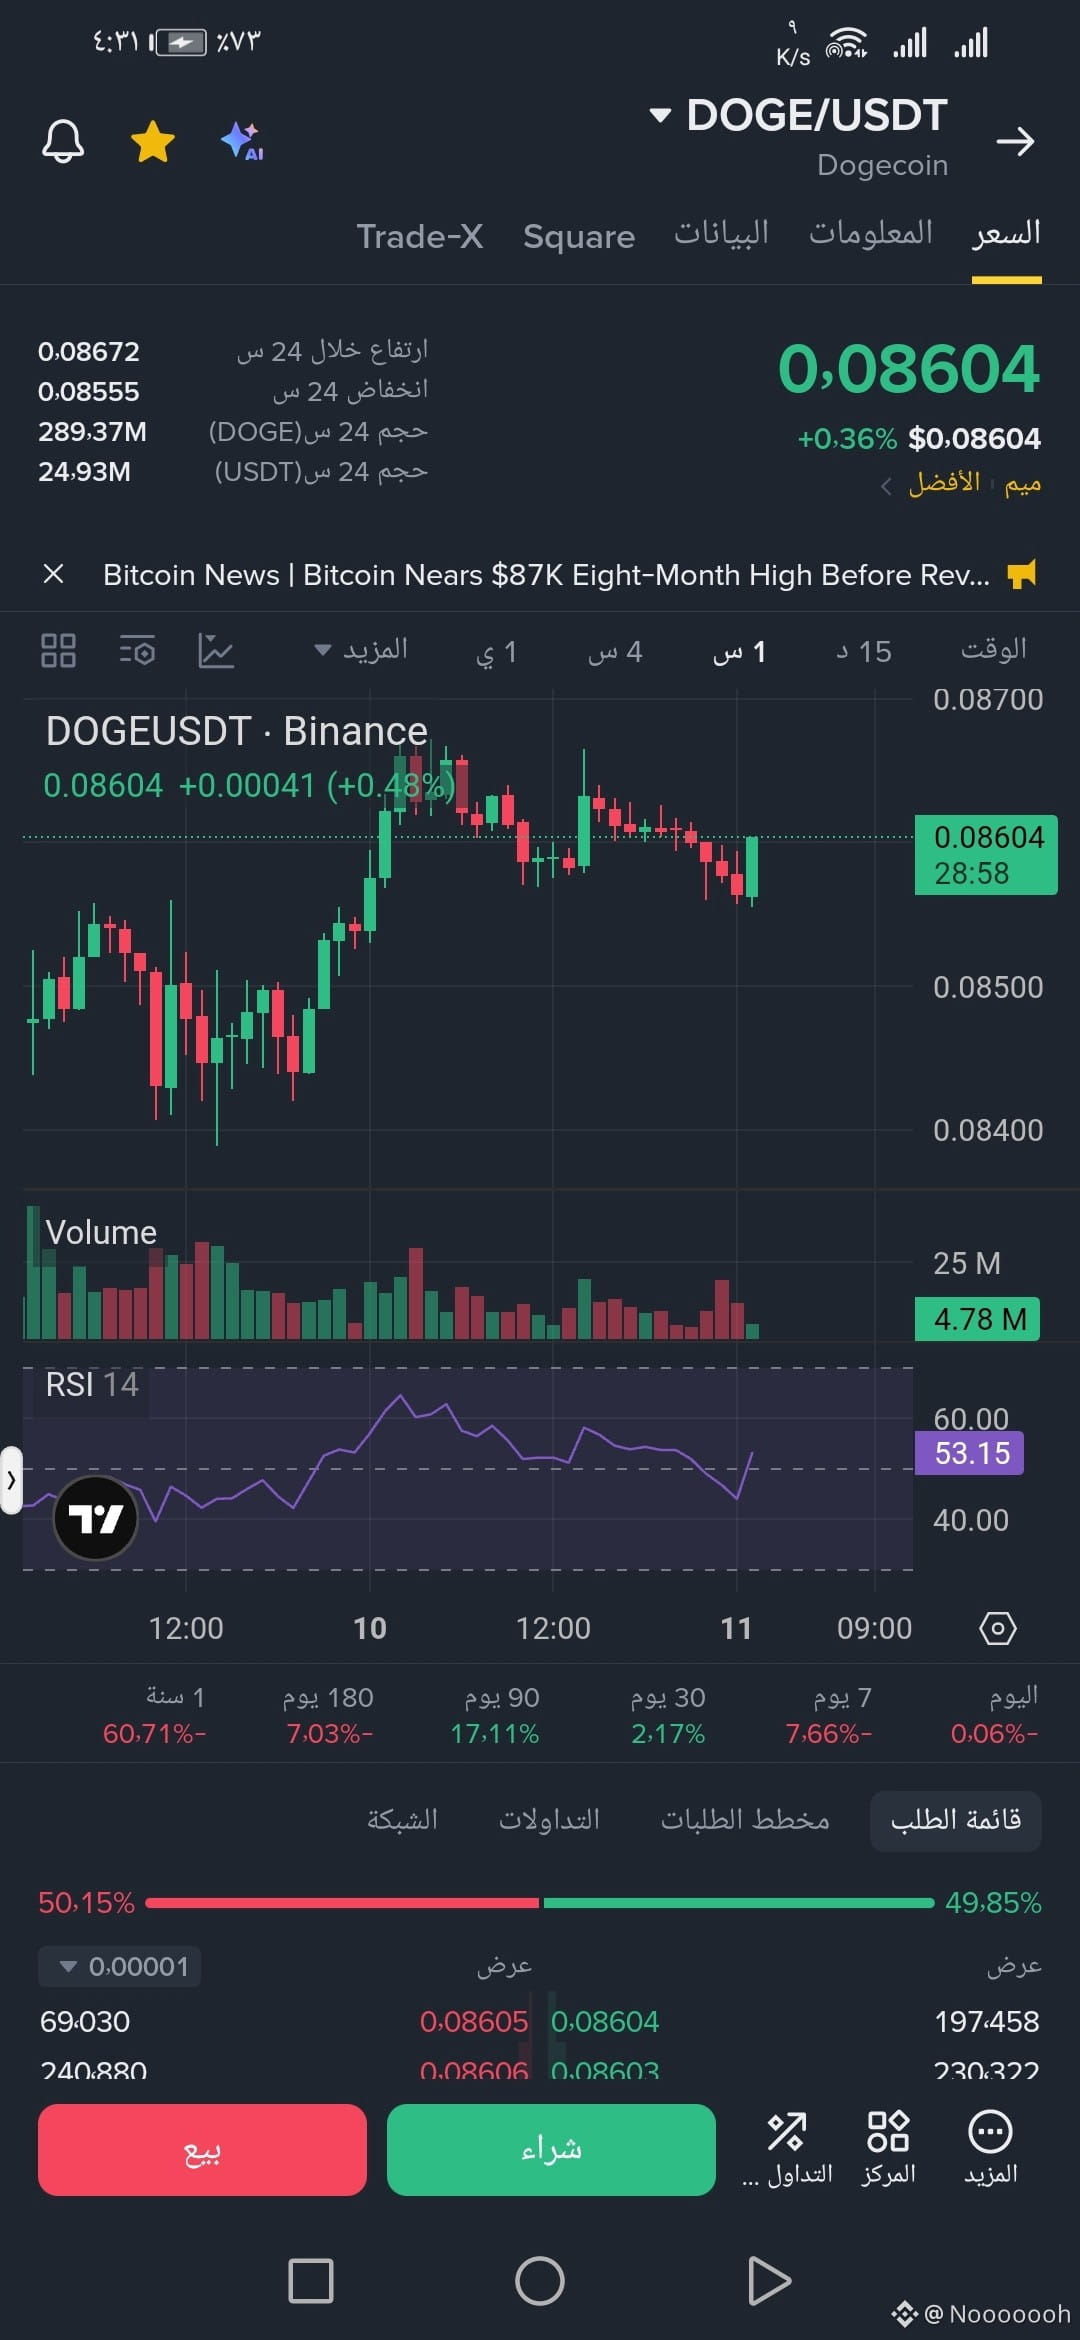
DOGE/USDT is trading near $0.08604, with the RSI at 53.15, reflecting limited positive momentum on the visible timeframe. Holding above $0.08500 could support an attempt to test $0.08670, and a breakout above that level could open the way to resistance at $0.08700. A break below $0.08500, however, could bring selling pressure back. Confirmation of the trend still depends on trading volume, as an upward move without strong liquidity remains vulnerable to a pullback.
$DOGE 🐕 Dogecoin (DOGE) | Are the bulls gearing up for another round?
DOGE/USDT is trading near $0.08604, with the RSI at 53.15, reflecting limited positive momentum on the visible timeframe. Holding above $0.08500 could support an attempt to test $0.08670, and a breakout above that level could open the way to resistance at $0.08700. A break below $0.08500, however, could bring selling pressure back. Confirmation of the trend still depends on trading volume, as an upward move without strong liquidity remains vulnerable to a pullback.
DOGE/USDT is trading near $0.08604, with the RSI at 53.15, reflecting limited positive momentum on the visible timeframe. Holding above $0.08500 could support an attempt to test $0.08670, and a breakout above that level could open the way to resistance at $0.08700. A break below $0.08500, however, could bring selling pressure back. Confirmation of the trend still depends on trading volume, as an upward move without strong liquidity remains vulnerable to a pullback.
1
155
·
--
Bullish
$BNB BNB Analysis Today:
BNB is trading at $748.19, up slightly by 0.51%. The chart shows the price testing support at $748 after fluctuating near the $752 resistance level. With the RSI holding steady at 48.59 and buying pressure (43.70%) close to selling pressure (56.30%), the outlook points to a quiet accumulation phase. Watch the support level carefully—patience is key to seizing smart opportunities amid promising market volatility 🚀🚀
#bnb #BinanceSquare #تحليل_العملات_الرقمية
$BNB BNB Analysis Today:
BNB is trading at $748.19, up slightly by 0.51%. The chart shows the price testing support at $748 after fluctuating near the $752 resistance level. With the RSI holding steady at 48.59 and buying pressure (43.70%) close to selling pressure (56.30%), the outlook points to a quiet accumulation phase. Watch the support level carefully—patience is key to seizing smart opportunities amid promising market volatility 🚀🚀
#bnb #BinanceSquare #تحليل_العملات_الرقمية
BNB is trading at $748.19, up slightly by 0.51%. The chart shows the price testing support at $748 after fluctuating near the $752 resistance level. With the RSI holding steady at 48.59 and buying pressure (43.70%) close to selling pressure (56.30%), the outlook points to a quiet accumulation phase. Watch the support level carefully—patience is key to seizing smart opportunities amid promising market volatility 🚀🚀
#bnb #BinanceSquare #تحليل_العملات_الرقمية
1
130
·
--
Bullish
$MAGIC 🚀 MAGIC/USDT | Is the rally gearing up for a new wave?
MAGIC has posted an exceptional gain of 84.74%, trading at $0.1223 according to the chart. Technically, the RSI stands at 79.15, signaling overbought conditions and the possibility of a correction or consolidation before the move continues. Holding above $0.12 could support an attempt to test resistance at $0.1282, while a break below $0.12 could open the door to a pullback toward $0.11 and then $0.10. In summary: momentum is positive, but chasing the price after this surge carries significant risk.
$MAGIC 🚀 MAGIC/USDT | Is the rally gearing up for a new wave?
MAGIC has posted an exceptional gain of 84.74%, trading at $0.1223 according to the chart. Technically, the RSI stands at 79.15, signaling overbought conditions and the possibility of a correction or consolidation before the move continues. Holding above $0.12 could support an attempt to test resistance at $0.1282, while a break below $0.12 could open the door to a pullback toward $0.11 and then $0.10. In summary: momentum is positive, but chasing the price after this surge carries significant risk.
MAGIC has posted an exceptional gain of 84.74%, trading at $0.1223 according to the chart. Technically, the RSI stands at 79.15, signaling overbought conditions and the possibility of a correction or consolidation before the move continues. Holding above $0.12 could support an attempt to test resistance at $0.1282, while a break below $0.12 could open the door to a pullback toward $0.11 and then $0.10. In summary: momentum is positive, but chasing the price after this surge carries significant risk.
1
322
·
--
Bullish
$BTC 🚨 Bitcoin is at a critical moment... Is it gearing up for a new rally, or is the market hiding a surprise? ₿🔥
BTC/USD is trading near $82,570 after a sharp drop followed by a gradual recovery, but a rebound alone isn’t enough to declare that buyers are returning in force. 📊
🔍 Technically, the RSI at 50 reflects neutral momentum, while price action puts the $83,000 level under the microscope. A sustained breakout could open the way toward $83,500, while a drop below $82,000 could bring renewed selling pressure toward $81,000.
⚡ The real bet today isn’t on a prediction, but on confirmation. Watch trading volume, and don’t let enthusiasm get ahead of your plan; the market rewards discipline more than haste.
{spot}(BTCUSDT)
$BTC 🚨 Bitcoin is at a critical moment... Is it gearing up for a new rally, or is the market hiding a surprise? ₿🔥
BTC/USD is trading near $82,570 after a sharp drop followed by a gradual recovery, but a rebound alone isn’t enough to declare that buyers are returning in force. 📊
🔍 Technically, the RSI at 50 reflects neutral momentum, while price action puts the $83,000 level under the microscope. A sustained breakout could open the way toward $83,500, while a drop below $82,000 could bring renewed selling pressure toward $81,000.
⚡ The real bet today isn’t on a prediction, but on confirmation. Watch trading volume, and don’t let enthusiasm get ahead of your plan; the market rewards discipline more than haste.
BTC/USD is trading near $82,570 after a sharp drop followed by a gradual recovery, but a rebound alone isn’t enough to declare that buyers are returning in force. 📊
🔍 Technically, the RSI at 50 reflects neutral momentum, while price action puts the $83,000 level under the microscope. A sustained breakout could open the way toward $83,500, while a drop below $82,000 could bring renewed selling pressure toward $81,000.
⚡ The real bet today isn’t on a prediction, but on confirmation. Watch trading volume, and don’t let enthusiasm get ahead of your plan; the market rewards discipline more than haste.
1
290
·
--
Dogecoin (DOGE) $DOGE is trading near $0.0934, with clear selling pressure on the chart. The RSI is approaching 33, indicating weak momentum and the possibility of a short-term rebound. Key support is at $0.0932; a break below it could open the way to lower levels, while resistance lies between $0.095 and $0.098. In the news, a golden cross appeared recently and the DogeOS test was launched, but the closure of the Bitwise fund represents limited negative pressure. Warning: This analysis is not investment advice. Volatility is high, so manage risk strictly. 📊
Dogecoin (DOGE) $DOGE is trading near $0.0934, with clear selling pressure on the chart. The RSI is approaching 33, indicating weak momentum and the possibility of a short-term rebound. Key support is at $0.0932; a break below it could open the way to lower levels, while resistance lies between $0.095 and $0.098. In the news, a golden cross appeared recently and the DogeOS test was launched, but the closure of the Bitwise fund represents limited negative pressure. Warning: This analysis is not investment advice. Volatility is high, so manage risk strictly. 📊
1
157
·
--
Bullish
$ORCA 📊📊 ORCA is showing strong bullish momentum after rising about 33% in 24 hours, with active trading and a clear increase in trading volume. The price is near $2.95, while the RSI is at 66, indicating buying strength as it approaches overbought territory. The price may target $3.20 and then $3.50 if momentum continues. This analysis is not investment advice, and volatility is high. ⚠️
$ORCA 📊📊 ORCA is showing strong bullish momentum after rising about 33% in 24 hours, with active trading and a clear increase in trading volume. The price is near $2.95, while the RSI is at 66, indicating buying strength as it approaches overbought territory. The price may target $3.20 and then $3.50 if momentum continues. This analysis is not investment advice, and volatility is high. ⚠️
1
314
·
--
$ZEC The ZEC/USDT pair is trading positively, with the price reaching approximately $1,374 after a daily gain of around 3.7%. On the timeframe shown, the price is maintaining upward momentum, while the RSI is around 62.8, reflecting solid buying strength without clearly entering overbought territory. Holding above $1,360–$1,370 could support an attempt to test $1,385 and then $1,400. A drop below $1,350, however, could bring the price back toward $1,320–$1,330. Trading volumes are relatively supportive of the recent move, but rejection candles near the high call for caution over a possible short-term correction. The bullish scenario remains in place as long as the price holds above nearby support levels. This is technical analysis, not investment advice, and price movements can change quickly.
{spot}(ZECUSDT)
$ZEC The ZEC/USDT pair is trading positively, with the price reaching approximately $1,374 after a daily gain of around 3.7%. On the timeframe shown, the price is maintaining upward momentum, while the RSI is around 62.8, reflecting solid buying strength without clearly entering overbought territory. Holding above $1,360–$1,370 could support an attempt to test $1,385 and then $1,400. A drop below $1,350, however, could bring the price back toward $1,320–$1,330. Trading volumes are relatively supportive of the recent move, but rejection candles near the high call for caution over a possible short-term correction. The bullish scenario remains in place as long as the price holds above nearby support levels. This is technical analysis, not investment advice, and price movements can change quickly.
1
125
·
--
Bullish
$DOGE Dogecoin is trading near $0.0953 after bouncing from $0.0940, with key resistance at $0.0960–$0.0970. The RSI is around 49, reflecting relative balance. A break above $0.0970 could push the price toward $0.1000, while a drop below $0.0940 could open the way to $0.0920. ⚠️ Warning: This analysis is not investment advice. The market is volatile, and prices may move contrary to expectations.
$DOGE Dogecoin is trading near $0.0953 after bouncing from $0.0940, with key resistance at $0.0960–$0.0970. The RSI is around 49, reflecting relative balance. A break above $0.0970 could push the price toward $0.1000, while a drop below $0.0940 could open the way to $0.0920. ⚠️ Warning: This analysis is not investment advice. The market is volatile, and prices may move contrary to expectations.
2
428
·
--
Bullish
$RLC Today's RLC analysis: The hourly chart shows a strong uptrend following a rapid rise from around 0.40 to approximately 0.73. The price is currently near 0.7365, approaching resistance at 0.80, while the RSI is around 79, indicating overbought conditions and the possibility of a short-term correction. Continued trading above 0.70 could support an attempt to test 0.80, and a breakout above it on strong trading volume could open the way to higher levels. However, a drop below 0.70 could push the price toward 0.65 and then 0.60. The most likely near-term scenario is consolidation or a correction before the uptrend resumes, so it may be preferable to avoid chasing the price after its sharp rise and wait for confirmation of the move. This is technical analysis, not investment advice, and the market is highly volatile.
$RLC Today's RLC analysis: The hourly chart shows a strong uptrend following a rapid rise from around 0.40 to approximately 0.73. The price is currently near 0.7365, approaching resistance at 0.80, while the RSI is around 79, indicating overbought conditions and the possibility of a short-term correction. Continued trading above 0.70 could support an attempt to test 0.80, and a breakout above it on strong trading volume could open the way to higher levels. However, a drop below 0.70 could push the price toward 0.65 and then 0.60. The most likely near-term scenario is consolidation or a correction before the uptrend resumes, so it may be preferable to avoid chasing the price after its sharp rise and wait for confirmation of the move. This is technical analysis, not investment advice, and the market is highly volatile.
1
4
1.1k
Log in to explore more content
Join global crypto users on Binance Square
⚡️ Get latest and useful information about crypto.
💬 Trusted by the world’s largest crypto exchange.
👍 Discover real insights from verified creators.
Email / Phone number
Trending Topics
BinanceRestores28FiatWithdrawals
335 views
34 Discussing
Binance Restores Fiat Withdrawals for USD, AED and Three Asian Currencies, Bringing the Total to 28
Binance News
·2 Likes
·785 views
BinanceProcesses$4.65BWithdrawals
59,361 views
256 Discussing
BitcoinDropsBelow$78K
210 views
22 Discussing