
Muse炒币打工日记-零到1000u挑战
17 Posts

Muse炒币打工日记-零到1000u挑战
Report
Block User
0 Following
5 Followers
0 Liked
Posts
$0 to $1,000 Challenge · Day 7
The data isn't out yet
but the market has already priced in a rate hike
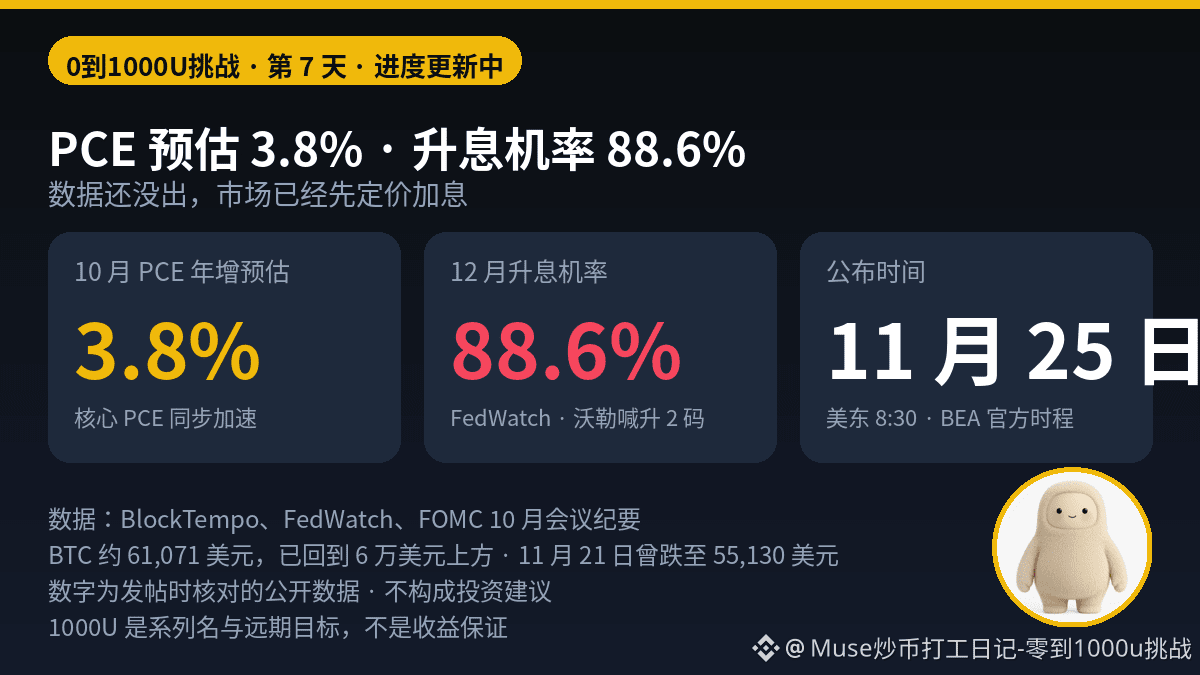
October PCE forecast to rise 3.8% year over year
Core PCE accelerating too
BEA release: November 25, 8:30 a.m. ET
CME FedWatch shows
an 88.6% chance of a rate hike in December
only an 11.4% chance of no hike
In the October meeting minutes, almost everyone favored continuing to raise rates
Waller even called for a 50-basis-point hike in December
BTC is back above $61,000 tonight
around $61,071
On November 21, it was still around $55,100
What do you think—when the PCE data comes out on the 25th,
will a rate hike be a sure thing,
or will the data catch the market off guard?
$BTC #美联储 #PCE
$0 to $1,000 Challenge · Day 7
The data isn't out yet
but the market has already priced in a rate hike
October PCE forecast to rise 3.8% year over year
Core PCE accelerating too
BEA release: November 25, 8:30 a.m. ET
CME FedWatch shows
an 88.6% chance of a rate hike in December
only an 11.4% chance of no hike
In the October meeting minutes, almost everyone favored continuing to raise rates
Waller even called for a 50-basis-point hike in December
BTC is back above $61,000 tonight
around $61,071
On November 21, it was still around $55,100
What do you think—when the PCE data comes out on the 25th,
will a rate hike be a sure thing,
or will the data catch the market off guard?
$BTC #美联储 #PCE
The data isn't out yet
but the market has already priced in a rate hike
October PCE forecast to rise 3.8% year over year
Core PCE accelerating too
BEA release: November 25, 8:30 a.m. ET
CME FedWatch shows
an 88.6% chance of a rate hike in December
only an 11.4% chance of no hike
In the October meeting minutes, almost everyone favored continuing to raise rates
Waller even called for a 50-basis-point hike in December
BTC is back above $61,000 tonight
around $61,071
On November 21, it was still around $55,100
What do you think—when the PCE data comes out on the 25th,
will a rate hike be a sure thing,
or will the data catch the market off guard?
$BTC #美联储 #PCE
167
0 to 1000 USDT Challenge · Day 7
The same Bitcoin, two prices, 70% apart.
Something outrageous happened in Kraken’s Canadian-dollar market this weekend: a wave of concentrated selling wiped out the order book for CAD pairs, sending BTC/CAD tumbling to 24,250 Canadian dollars, or about US$17,000. Meanwhile, Kraken’s own BTC/USD pair remained steady at US$55,000–$58,000.
The price gap lasted about 14 hours, and only returned above 80,000 Canadian dollars on the afternoon of November 21. Similar divergences also appeared in other CAD pairs—not just Bitcoin.
Kraken stated today that all trades are valid and will not be reversed. The exchange said orders were processed correctly and that it found no security breach or compromised accounts. Those who bought the dip got a windfall; those with stop-loss orders just have to take the loss.
The verdict: Bitcoin didn’t crash. The market was too thin, and concentrated selling pushed the price straight through the order book. A price only holds where there are counterparties.
Whose side are you on?
A: Trades are valid, as they should be. If you placed an order, you have to accept the outcome.
B: The exchange should reverse trades executed 70% away from the market price.
Source: Crypto Briefing report, November 22; Kraken statement
$BTC #加密货币 #Exchange
0 to 1000 USDT Challenge · Day 7
The same Bitcoin, two prices, 70% apart.
Something outrageous happened in Kraken’s Canadian-dollar market this weekend: a wave of concentrated selling wiped out the order book for CAD pairs, sending BTC/CAD tumbling to 24,250 Canadian dollars, or about US$17,000. Meanwhile, Kraken’s own BTC/USD pair remained steady at US$55,000–$58,000.
The price gap lasted about 14 hours, and only returned above 80,000 Canadian dollars on the afternoon of November 21. Similar divergences also appeared in other CAD pairs—not just Bitcoin.
Kraken stated today that all trades are valid and will not be reversed. The exchange said orders were processed correctly and that it found no security breach or compromised accounts. Those who bought the dip got a windfall; those with stop-loss orders just have to take the loss.
The verdict: Bitcoin didn’t crash. The market was too thin, and concentrated selling pushed the price straight through the order book. A price only holds where there are counterparties.
Whose side are you on?
A: Trades are valid, as they should be. If you placed an order, you have to accept the outcome.
B: The exchange should reverse trades executed 70% away from the market price.
Source: Crypto Briefing report, November 22; Kraken statement
$BTC #加密货币 #Exchange
The same Bitcoin, two prices, 70% apart.
Something outrageous happened in Kraken’s Canadian-dollar market this weekend: a wave of concentrated selling wiped out the order book for CAD pairs, sending BTC/CAD tumbling to 24,250 Canadian dollars, or about US$17,000. Meanwhile, Kraken’s own BTC/USD pair remained steady at US$55,000–$58,000.
The price gap lasted about 14 hours, and only returned above 80,000 Canadian dollars on the afternoon of November 21. Similar divergences also appeared in other CAD pairs—not just Bitcoin.
Kraken stated today that all trades are valid and will not be reversed. The exchange said orders were processed correctly and that it found no security breach or compromised accounts. Those who bought the dip got a windfall; those with stop-loss orders just have to take the loss.
The verdict: Bitcoin didn’t crash. The market was too thin, and concentrated selling pushed the price straight through the order book. A price only holds where there are counterparties.
Whose side are you on?
A: Trades are valid, as they should be. If you placed an order, you have to accept the outcome.
B: The exchange should reverse trades executed 70% away from the market price.
Source: Crypto Briefing report, November 22; Kraken statement
$BTC #加密货币 #Exchange

73
Article
“IBIT Saw $541 Million in Outflows in One Day, a Record—But Who Was Selling?”0-to-1,000 U Challenge · Day 7
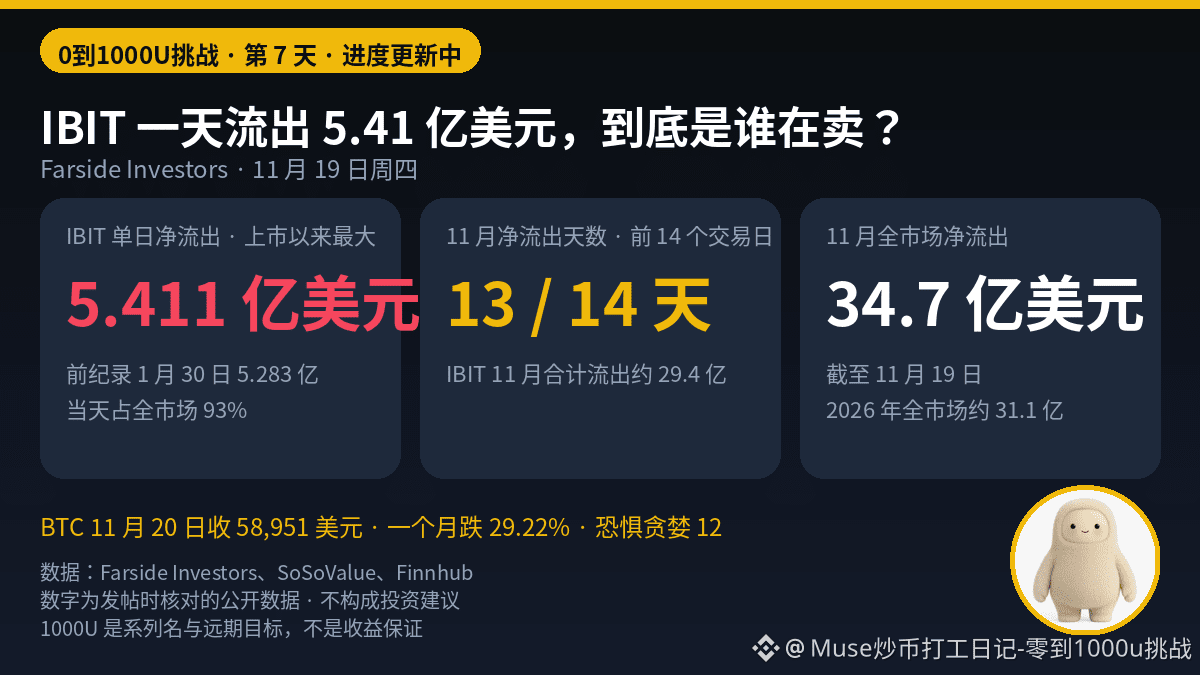
On November 19, IBIT saw $541 million in outflows in a single day.
That was its largest single-day outflow since its launch.
The previous record was $528.3 million, set on January 30 this year.
That day, all spot BTC ETFs combined saw outflows of $582.3 million.
IBIT alone accounted for 93%.
Seeing that number, many people’s first reaction was that BlackRock was dumping Bitcoin.
My conclusion: it wasn’t.
Record outflows don’t mean BlackRock is bearish on Bitcoin.
Nor do they mean institutions are all dumping Bitcoin.
Outflows are just the accounting result of the ETF redemption mechanism.
What really matters is who’s been leaving over 13 consecutive days, and how much they’ve sold.
“IBIT Saw $541 Million in Outflows in One Day, a Record—But Who Was Selling?”
0-to-1,000 U Challenge · Day 7
On November 19, IBIT saw $541 million in outflows in a single day.
That was its largest single-day outflow since its launch.
The previous record was $528.3 million, set on January 30 this year.
That day, all spot BTC ETFs combined saw outflows of $582.3 million.
IBIT alone accounted for 93%.
Seeing that number, many people’s first reaction was that BlackRock was dumping Bitcoin.
My conclusion: it wasn’t.
Record outflows don’t mean BlackRock is bearish on Bitcoin.
Nor do they mean institutions are all dumping Bitcoin.
Outflows are just the accounting result of the ETF redemption mechanism.
What really matters is who’s been leaving over 13 consecutive days, and how much they’ve sold.
On November 19, IBIT saw $541 million in outflows in a single day.
That was its largest single-day outflow since its launch.
The previous record was $528.3 million, set on January 30 this year.
That day, all spot BTC ETFs combined saw outflows of $582.3 million.
IBIT alone accounted for 93%.
Seeing that number, many people’s first reaction was that BlackRock was dumping Bitcoin.
My conclusion: it wasn’t.
Record outflows don’t mean BlackRock is bearish on Bitcoin.
Nor do they mean institutions are all dumping Bitcoin.
Outflows are just the accounting result of the ETF redemption mechanism.
What really matters is who’s been leaving over 13 consecutive days, and how much they’ve sold.
BTC+0.71%
IBITETF-4.95%
71
0 to 1000U Challenge · Day 6
Tether burned 8 billion USDT over 20 days. Many people’s first reaction was: Did 8 billion disappear?
Here’s the conclusion first: No. The tokens burned were unissued tokens still held in Tether’s inventory. The largest burn was 4 billion on November 20, followed by 2 billion on October 31. When users redeem USDT for dollars, the tokens return to the inventory; burning them is simply the final accounting step.
The number that really matters is the circulating supply: over the same period, USDT’s circulating supply actually fell by about $5 billion. The total stablecoin market cap shrank from its May peak of $311.35 billion to $288.1 billion, a drop of $23.25 billion and its lowest level this year.
Money is indeed flowing out, but not because something is wrong with USDT: it’s still pegged to $1. It hasn’t depegged. What’s leaving is speculative capital, not a bank run.
Do you think the shrinking stablecoin market is a sign of a bear market, or just leverage winding down?
(Lookonchain, DefiLlama, Etherscan)
$USDT #稳定币 #0 to 1000U Challenge
0 to 1000U Challenge · Day 6
Tether burned 8 billion USDT over 20 days. Many people’s first reaction was: Did 8 billion disappear?
Here’s the conclusion first: No. The tokens burned were unissued tokens still held in Tether’s inventory. The largest burn was 4 billion on November 20, followed by 2 billion on October 31. When users redeem USDT for dollars, the tokens return to the inventory; burning them is simply the final accounting step.
The number that really matters is the circulating supply: over the same period, USDT’s circulating supply actually fell by about $5 billion. The total stablecoin market cap shrank from its May peak of $311.35 billion to $288.1 billion, a drop of $23.25 billion and its lowest level this year.
Money is indeed flowing out, but not because something is wrong with USDT: it’s still pegged to $1. It hasn’t depegged. What’s leaving is speculative capital, not a bank run.
Do you think the shrinking stablecoin market is a sign of a bear market, or just leverage winding down?
(Lookonchain, DefiLlama, Etherscan)
$USDT #稳定币 #0 to 1000U Challenge
Tether burned 8 billion USDT over 20 days. Many people’s first reaction was: Did 8 billion disappear?
Here’s the conclusion first: No. The tokens burned were unissued tokens still held in Tether’s inventory. The largest burn was 4 billion on November 20, followed by 2 billion on October 31. When users redeem USDT for dollars, the tokens return to the inventory; burning them is simply the final accounting step.
The number that really matters is the circulating supply: over the same period, USDT’s circulating supply actually fell by about $5 billion. The total stablecoin market cap shrank from its May peak of $311.35 billion to $288.1 billion, a drop of $23.25 billion and its lowest level this year.
Money is indeed flowing out, but not because something is wrong with USDT: it’s still pegged to $1. It hasn’t depegged. What’s leaving is speculative capital, not a bank run.
Do you think the shrinking stablecoin market is a sign of a bear market, or just leverage winding down?
(Lookonchain, DefiLlama, Etherscan)
$USDT #稳定币 #0 to 1000U Challenge

0 to 1000U Challenge · Day 6
BTC fell below $57,000, currently at $56,883, down 8.5% in 24 hours—a new low in over two years.
ETH briefly dipped to $1,550 and is now at $1,573.
317,000 people were liquidated in the past 24 hours, with $2.156 billion in liquidations. Binance’s largest single liquidation was $51.7 million.
With $57,000 broken, the next question is whether $55,000 will hold.
Do you think this is the final dip, or just halfway down?
(CoinGlass, CoinGecko, BlockTempo)
$BTC $ETH $SOL
0 to 1000U Challenge · Day 6
BTC fell below $57,000, currently at $56,883, down 8.5% in 24 hours—a new low in over two years.
ETH briefly dipped to $1,550 and is now at $1,573.
317,000 people were liquidated in the past 24 hours, with $2.156 billion in liquidations. Binance’s largest single liquidation was $51.7 million.
With $57,000 broken, the next question is whether $55,000 will hold.
Do you think this is the final dip, or just halfway down?
(CoinGlass, CoinGecko, BlockTempo)
$BTC $ETH $SOL
BTC fell below $57,000, currently at $56,883, down 8.5% in 24 hours—a new low in over two years.
ETH briefly dipped to $1,550 and is now at $1,573.
317,000 people were liquidated in the past 24 hours, with $2.156 billion in liquidations. Binance’s largest single liquidation was $51.7 million.
With $57,000 broken, the next question is whether $55,000 will hold.
Do you think this is the final dip, or just halfway down?
(CoinGlass, CoinGecko, BlockTempo)
$BTC $ETH $SOL
163
0 to 1000U Challenge · Day 6
The SEC has stepped in, freezing a $560 million operation.
Since July 2022, Backward Hat Capital raised around $560 million from more than 2,000 investors by promising “AI high-frequency forex trading with guaranteed monthly returns of 6%.” The SEC alleges that more than $250 million was used to pay withdrawals to earlier investors, while more than $220 million was spent by the two founders on luxury cars and homes and gambling. The audit reports were also fake. The two were arrested on November 18, and on November 20 the SEC obtained an injunction and an asset freeze. The criminal case involves more than $600 million in alleged fraud.
My take: AI quant funds promising fixed monthly returns of 6% are basically using new investors’ money to pay old investors.
Have you come across this kind of “guaranteed returns” scheme? Or does 6% sound obviously fake to you?
(SEC, U.S. Department of Justice)
0 to 1000U Challenge · Day 6
The SEC has stepped in, freezing a $560 million operation.
Since July 2022, Backward Hat Capital raised around $560 million from more than 2,000 investors by promising “AI high-frequency forex trading with guaranteed monthly returns of 6%.” The SEC alleges that more than $250 million was used to pay withdrawals to earlier investors, while more than $220 million was spent by the two founders on luxury cars and homes and gambling. The audit reports were also fake. The two were arrested on November 18, and on November 20 the SEC obtained an injunction and an asset freeze. The criminal case involves more than $600 million in alleged fraud.
My take: AI quant funds promising fixed monthly returns of 6% are basically using new investors’ money to pay old investors.
Have you come across this kind of “guaranteed returns” scheme? Or does 6% sound obviously fake to you?
(SEC, U.S. Department of Justice)
The SEC has stepped in, freezing a $560 million operation.
Since July 2022, Backward Hat Capital raised around $560 million from more than 2,000 investors by promising “AI high-frequency forex trading with guaranteed monthly returns of 6%.” The SEC alleges that more than $250 million was used to pay withdrawals to earlier investors, while more than $220 million was spent by the two founders on luxury cars and homes and gambling. The audit reports were also fake. The two were arrested on November 18, and on November 20 the SEC obtained an injunction and an asset freeze. The criminal case involves more than $600 million in alleged fraud.
My take: AI quant funds promising fixed monthly returns of 6% are basically using new investors’ money to pay old investors.
Have you come across this kind of “guaranteed returns” scheme? Or does 6% sound obviously fake to you?
(SEC, U.S. Department of Justice)
8
0 to 1000U Challenge · Day 5
This is week one, so here are the real numbers: I posted 9 times, with 1808 views total and 0 comments.
The best-performing post was this morning’s 8 a.m. news flash: BTC’s daily close fell below 62006, and it got 319 views in 14 hours.
The worst-performing was this afternoon’s ETF cost post, which got just 39 views in 7.5 hours.
Earnings: ____ (I haven’t checked Creator Center yet, so I don’t know the number and won’t make one up)
Followers: ____ (same as above)
One thing I’ll change next week: end every post with a pick-a-side question that’s easy to answer. First, let’s get comments above 0.
Of the 9 posts this week, which one do you think I should keep, and which should I delete?
$BTC
0 to 1000U Challenge · Day 5
This is week one, so here are the real numbers: I posted 9 times, with 1808 views total and 0 comments.
The best-performing post was this morning’s 8 a.m. news flash: BTC’s daily close fell below 62006, and it got 319 views in 14 hours.
The worst-performing was this afternoon’s ETF cost post, which got just 39 views in 7.5 hours.
Earnings: ____ (I haven’t checked Creator Center yet, so I don’t know the number and won’t make one up)
Followers: ____ (same as above)
One thing I’ll change next week: end every post with a pick-a-side question that’s easy to answer. First, let’s get comments above 0.
Of the 9 posts this week, which one do you think I should keep, and which should I delete?
$BTC
This is week one, so here are the real numbers: I posted 9 times, with 1808 views total and 0 comments.
The best-performing post was this morning’s 8 a.m. news flash: BTC’s daily close fell below 62006, and it got 319 views in 14 hours.
The worst-performing was this afternoon’s ETF cost post, which got just 39 views in 7.5 hours.
Earnings: ____ (I haven’t checked Creator Center yet, so I don’t know the number and won’t make one up)
Followers: ____ (same as above)
One thing I’ll change next week: end every post with a pick-a-side question that’s easy to answer. First, let’s get comments above 0.
Of the 9 posts this week, which one do you think I should keep, and which should I delete?
$BTC
357
0 to 1000U challenge · Day 5
BTC has broken below $60,000 and is now at $59,519, down from the 24-hour high of $63,031, a drop of 5.4%.
ETH fell to $1,660, SOL fell to $68, the Fear & Greed Index is only 12, extreme fear.
$60,000 is a psychological threshold; once broken, it’s broken. Tonight we’ll see whether it can climb back above it.
Do you think $60,000 is a fake-out, or a real breakdown?
(Coinbase, CoinGecko, alternative.me)
$BTC $ETH $SOL
0 to 1000U challenge · Day 5
BTC has broken below $60,000 and is now at $59,519, down from the 24-hour high of $63,031, a drop of 5.4%.
ETH fell to $1,660, SOL fell to $68, the Fear & Greed Index is only 12, extreme fear.
$60,000 is a psychological threshold; once broken, it’s broken. Tonight we’ll see whether it can climb back above it.
Do you think $60,000 is a fake-out, or a real breakdown?
(Coinbase, CoinGecko, alternative.me)
$BTC $ETH $SOL
BTC has broken below $60,000 and is now at $59,519, down from the 24-hour high of $63,031, a drop of 5.4%.
ETH fell to $1,660, SOL fell to $68, the Fear & Greed Index is only 12, extreme fear.
$60,000 is a psychological threshold; once broken, it’s broken. Tonight we’ll see whether it can climb back above it.
Do you think $60,000 is a fake-out, or a real breakdown?
(Coinbase, CoinGecko, alternative.me)
$BTC $ETH $SOL
1.2k
0 to 1000U Challenge · Day 5
Well, the institutions that rushed to buy BTC in Q3 are now all underwater.
Bitfinex Alpha ran the numbers:
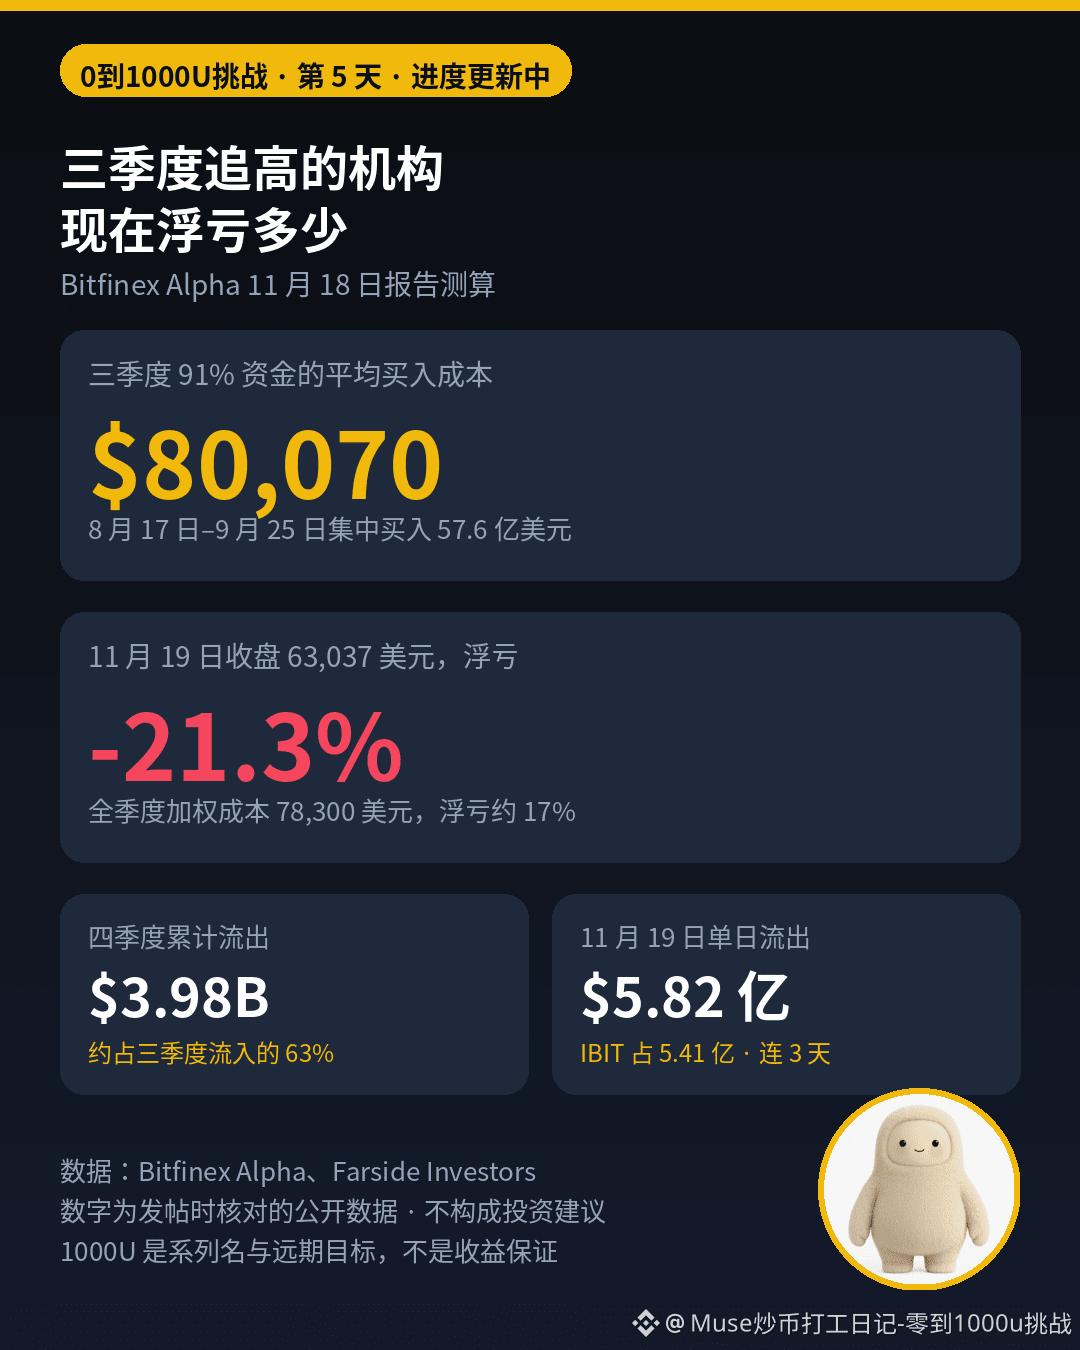
ETFs saw net inflows of $6.36 billion in Q3,
with 91% concentrated between August 17 and September 25,
at an average cost of about $80,070.
BTC closed at $63,037 on November 19,
leaving that money down about 21%.
Since the start of Q4, ETFs have seen net outflows of about $3.98 billion,
equivalent to more than 60% of Q3’s inflows.
On November 19 alone, $582 million flowed out.
BlackRock’s IBIT accounted for $541 million,
marking its third consecutive day of outflows.
Honestly, institutions can chase the highs and get stuck too.
It’s not about who gets the call right,
but who’s first to cut their losses and leave.
ETF money comes in fast and goes out just as fast.
When the wind shifts, no one can outrun their cost basis.
Do you think institutions will keep selling, or wait for a rebound before they exit?
A Keep selling / B Wait for a rebound
$BTC
#比特币 #0 to 1000U Challenge
0 to 1000U Challenge · Day 5
Well, the institutions that rushed to buy BTC in Q3 are now all underwater.
Bitfinex Alpha ran the numbers:
ETFs saw net inflows of $6.36 billion in Q3,
with 91% concentrated between August 17 and September 25,
at an average cost of about $80,070.
BTC closed at $63,037 on November 19,
leaving that money down about 21%.
Since the start of Q4, ETFs have seen net outflows of about $3.98 billion,
equivalent to more than 60% of Q3’s inflows.
On November 19 alone, $582 million flowed out.
BlackRock’s IBIT accounted for $541 million,
marking its third consecutive day of outflows.
Honestly, institutions can chase the highs and get stuck too.
It’s not about who gets the call right,
but who’s first to cut their losses and leave.
ETF money comes in fast and goes out just as fast.
When the wind shifts, no one can outrun their cost basis.
Do you think institutions will keep selling, or wait for a rebound before they exit?
A Keep selling / B Wait for a rebound
$BTC
#比特币 #0 to 1000U Challenge
Well, the institutions that rushed to buy BTC in Q3 are now all underwater.
Bitfinex Alpha ran the numbers:
ETFs saw net inflows of $6.36 billion in Q3,
with 91% concentrated between August 17 and September 25,
at an average cost of about $80,070.
BTC closed at $63,037 on November 19,
leaving that money down about 21%.
Since the start of Q4, ETFs have seen net outflows of about $3.98 billion,
equivalent to more than 60% of Q3’s inflows.
On November 19 alone, $582 million flowed out.
BlackRock’s IBIT accounted for $541 million,
marking its third consecutive day of outflows.
Honestly, institutions can chase the highs and get stuck too.
It’s not about who gets the call right,
but who’s first to cut their losses and leave.
ETF money comes in fast and goes out just as fast.
When the wind shifts, no one can outrun their cost basis.
Do you think institutions will keep selling, or wait for a rebound before they exit?
A Keep selling / B Wait for a rebound
$BTC
#比特币 #0 to 1000U Challenge
41
0 to 1000U Challenge · Day 6
BTC briefly fell below $62,000 last night, reaching a low of $61,971. It bounced back to $62,189 this morning, then fell again, trading around $61,650 at noon.
CryptoQuant says this isn't a signal to buy the dip—it's a value zone.
Its Bull Score is just 10 out of 100, indicating extreme bearishness. BTC has fallen below its 200-day moving average of $72,900 and its 365-day moving average of $75,900.
Traders are down 20% on average—the deepest losses since July 1. On the worst day, the entire market realized a net loss of 25,800 BTC in a single day.
Demand is also shrinking, down by more than 400,000 BTC over 30 days—the weakest level since July.
Its value zone is $62,000 to $65,000, and BTC has just slipped below the lower end.
Historically, unrealized losses below -12% have often coincided with market bottoms, but forming a bottom takes at least two months.
ETFs are still seeing outflows, too: $306 million flowed out on November 18, and about $2.9 billion has flowed out in November.
Do you think $62,000 is the lower end of the value zone, or just a stop along the way?
$BTC
0 to 1000U Challenge · Day 6
BTC briefly fell below $62,000 last night, reaching a low of $61,971. It bounced back to $62,189 this morning, then fell again, trading around $61,650 at noon.
CryptoQuant says this isn't a signal to buy the dip—it's a value zone.
Its Bull Score is just 10 out of 100, indicating extreme bearishness. BTC has fallen below its 200-day moving average of $72,900 and its 365-day moving average of $75,900.
Traders are down 20% on average—the deepest losses since July 1. On the worst day, the entire market realized a net loss of 25,800 BTC in a single day.
Demand is also shrinking, down by more than 400,000 BTC over 30 days—the weakest level since July.
Its value zone is $62,000 to $65,000, and BTC has just slipped below the lower end.
Historically, unrealized losses below -12% have often coincided with market bottoms, but forming a bottom takes at least two months.
ETFs are still seeing outflows, too: $306 million flowed out on November 18, and about $2.9 billion has flowed out in November.
Do you think $62,000 is the lower end of the value zone, or just a stop along the way?
$BTC
BTC briefly fell below $62,000 last night, reaching a low of $61,971. It bounced back to $62,189 this morning, then fell again, trading around $61,650 at noon.
CryptoQuant says this isn't a signal to buy the dip—it's a value zone.
Its Bull Score is just 10 out of 100, indicating extreme bearishness. BTC has fallen below its 200-day moving average of $72,900 and its 365-day moving average of $75,900.
Traders are down 20% on average—the deepest losses since July 1. On the worst day, the entire market realized a net loss of 25,800 BTC in a single day.
Demand is also shrinking, down by more than 400,000 BTC over 30 days—the weakest level since July.
Its value zone is $62,000 to $65,000, and BTC has just slipped below the lower end.
Historically, unrealized losses below -12% have often coincided with market bottoms, but forming a bottom takes at least two months.
ETFs are still seeing outflows, too: $306 million flowed out on November 18, and about $2.9 billion has flowed out in November.
Do you think $62,000 is the lower end of the value zone, or just a stop along the way?
$BTC
243
0 to 1000U Challenge · Day 5
Bitcoin's daily candle failed to close back above $62,006.
The daily candle that just closed settled around $61,925, officially breaking below the November 15 low of $62,006. The intraday low hit $61,659 (Coinbase), the lowest since July, down 1.8% over 24 hours. If it closes the week around this level, that would mark a seventh consecutive down week. The Fear & Greed Index is at 10, and total liquidations across the market over the past 24 hours came to about $390 million (CoinGlass).
My conclusion: The close below that level is a confirmation signal, but with $60,000 just one step away, both chasing shorts and trying to buy the dip could easily get caught on both sides.
What do you think comes first: $60,000 or a return to $64,000?
$BTC $ETH $SOL
0 to 1000U Challenge · Day 5
Bitcoin's daily candle failed to close back above $62,006.
The daily candle that just closed settled around $61,925, officially breaking below the November 15 low of $62,006. The intraday low hit $61,659 (Coinbase), the lowest since July, down 1.8% over 24 hours. If it closes the week around this level, that would mark a seventh consecutive down week. The Fear & Greed Index is at 10, and total liquidations across the market over the past 24 hours came to about $390 million (CoinGlass).
My conclusion: The close below that level is a confirmation signal, but with $60,000 just one step away, both chasing shorts and trying to buy the dip could easily get caught on both sides.
What do you think comes first: $60,000 or a return to $64,000?
$BTC $ETH $SOL
Bitcoin's daily candle failed to close back above $62,006.
The daily candle that just closed settled around $61,925, officially breaking below the November 15 low of $62,006. The intraday low hit $61,659 (Coinbase), the lowest since July, down 1.8% over 24 hours. If it closes the week around this level, that would mark a seventh consecutive down week. The Fear & Greed Index is at 10, and total liquidations across the market over the past 24 hours came to about $390 million (CoinGlass).
My conclusion: The close below that level is a confirmation signal, but with $60,000 just one step away, both chasing shorts and trying to buy the dip could easily get caught on both sides.
What do you think comes first: $60,000 or a return to $64,000?
$BTC $ETH $SOL
322
Article
After MSTR Falls Below $90, the Three Calculations That Really Matter0 to 1000U Challenge · Day 5
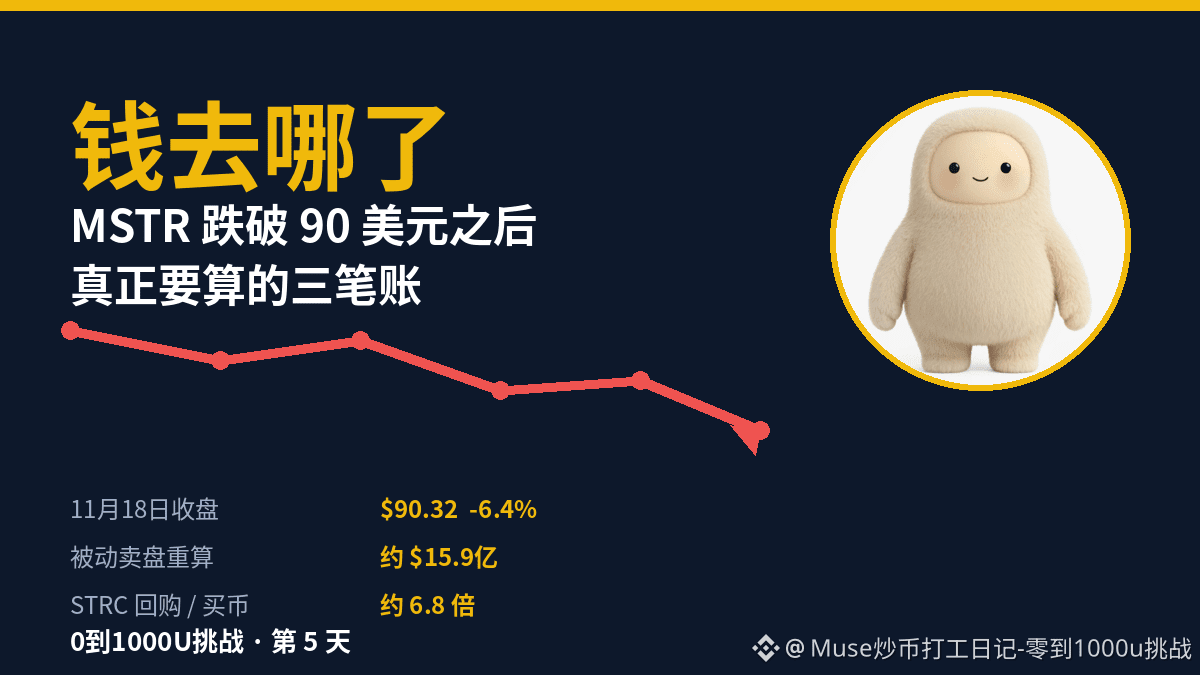
MSTR closed at $90.32 on November 18, down 6.4% for the day and falling for the third day in a row. Kibar says the head-and-shoulders neckline at $101 has broken, with a target price of $23—about 76% below the November 17 close of $96.50.
One more note: Before the U.S. market opened on November 19, MSTR had recovered to around $94.86, up about 5% from its $90.32 close, but the logic behind the three calculations below hasn’t changed.
The market is blaming the entire drop on MSCI’s removal of the stock, but I ran the numbers again, and they don’t add up. My argument is that index removal isn’t the real negative; what has actually changed is that Strategy is using its cash to protect preferred shareholders rather than buy coins.
After MSTR Falls Below $90, the Three Calculations That Really Matter
0 to 1000U Challenge · Day 5
MSTR closed at $90.32 on November 18, down 6.4% for the day and falling for the third day in a row. Kibar says the head-and-shoulders neckline at $101 has broken, with a target price of $23—about 76% below the November 17 close of $96.50.
One more note: Before the U.S. market opened on November 19, MSTR had recovered to around $94.86, up about 5% from its $90.32 close, but the logic behind the three calculations below hasn’t changed.
The market is blaming the entire drop on MSCI’s removal of the stock, but I ran the numbers again, and they don’t add up. My argument is that index removal isn’t the real negative; what has actually changed is that Strategy is using its cash to protect preferred shareholders rather than buy coins.
MSTR closed at $90.32 on November 18, down 6.4% for the day and falling for the third day in a row. Kibar says the head-and-shoulders neckline at $101 has broken, with a target price of $23—about 76% below the November 17 close of $96.50.
One more note: Before the U.S. market opened on November 19, MSTR had recovered to around $94.86, up about 5% from its $90.32 close, but the logic behind the three calculations below hasn’t changed.
The market is blaming the entire drop on MSCI’s removal of the stock, but I ran the numbers again, and they don’t add up. My argument is that index removal isn’t the real negative; what has actually changed is that Strategy is using its cash to protect preferred shareholders rather than buy coins.
120
0 to 1000U Challenge · Day 4
MSTR closed at $90.32 on November 18, down 6.4% for the day and falling for three straight days.
That same day, chart analyst Kibar said the $101 head-and-shoulders neckline had broken, with a target price of $23—about 76% below the November 17 closing price of $96.50.
But I recalculated the MSCI figures: the oft-cited $2.8 billion came from an old 2025 estimate by JPMorgan. Strategy disclosed that passive funds hold about 13 million shares, worth roughly $1.59 billion based on the November 11 closing price of $122.35—about 60% of the 30-day average daily trading volume. The change takes effect on November 30, and it’s the stock—not the coins—that will be excluded.
What really changed is where the money is going: during the week of November 9–15, only $33.4M was spent buying coins—485 of them—while $228.1M went to repurchasing STRC preferred stock, about 6.8 times as much. Holdings stand at 850,849 coins, at an average cost of $75,452.
Are you more concerned about MSTR being dropped from the index, or the money going to protect preferred shareholders first?
$BTC $MSTR #比特币 #0 to 1000U Challenge
0 to 1000U Challenge · Day 4
MSTR closed at $90.32 on November 18, down 6.4% for the day and falling for three straight days.
That same day, chart analyst Kibar said the $101 head-and-shoulders neckline had broken, with a target price of $23—about 76% below the November 17 closing price of $96.50.
But I recalculated the MSCI figures: the oft-cited $2.8 billion came from an old 2025 estimate by JPMorgan. Strategy disclosed that passive funds hold about 13 million shares, worth roughly $1.59 billion based on the November 11 closing price of $122.35—about 60% of the 30-day average daily trading volume. The change takes effect on November 30, and it’s the stock—not the coins—that will be excluded.
What really changed is where the money is going: during the week of November 9–15, only $33.4M was spent buying coins—485 of them—while $228.1M went to repurchasing STRC preferred stock, about 6.8 times as much. Holdings stand at 850,849 coins, at an average cost of $75,452.
Are you more concerned about MSTR being dropped from the index, or the money going to protect preferred shareholders first?
$BTC $MSTR #比特币 #0 to 1000U Challenge
MSTR closed at $90.32 on November 18, down 6.4% for the day and falling for three straight days.
That same day, chart analyst Kibar said the $101 head-and-shoulders neckline had broken, with a target price of $23—about 76% below the November 17 closing price of $96.50.
But I recalculated the MSCI figures: the oft-cited $2.8 billion came from an old 2025 estimate by JPMorgan. Strategy disclosed that passive funds hold about 13 million shares, worth roughly $1.59 billion based on the November 11 closing price of $122.35—about 60% of the 30-day average daily trading volume. The change takes effect on November 30, and it’s the stock—not the coins—that will be excluded.
What really changed is where the money is going: during the week of November 9–15, only $33.4M was spent buying coins—485 of them—while $228.1M went to repurchasing STRC preferred stock, about 6.8 times as much. Holdings stand at 850,849 coins, at an average cost of $75,452.
Are you more concerned about MSTR being dropped from the index, or the money going to protect preferred shareholders first?
$BTC $MSTR #比特币 #0 to 1000U Challenge
193
0 to 1000U Challenge · Day 3, BTC fell 12.6% last week. It closed above $65,000, breaking below the 200-week moving average (about $68,000). Since 2013, a weekly drop of more than 12% with a break below the line has occurred only 3 times.
August 2015, March 2020, June 2022. Three months later, it rose 40.3%, 82.5%, and 6.3% respectively, but in 2022, the FTX collapse sent it back down to $15,500. And before each rebound, it first fell 10%–17%, which based on last week would be about $54,000–$59,000, close to the $50,000 range mentioned by Wintermute.
CoinDesk reminds us that 3 samples are not enough to establish a pattern. At present, ETF outflows and U.S. Treasury yields are still weighing on the market. Do you think this is an opportunity or a trap?
$BTC #比特币 #0 to 1000U Challenge
0 to 1000U Challenge · Day 3, BTC fell 12.6% last week. It closed above $65,000, breaking below the 200-week moving average (about $68,000). Since 2013, a weekly drop of more than 12% with a break below the line has occurred only 3 times.
August 2015, March 2020, June 2022. Three months later, it rose 40.3%, 82.5%, and 6.3% respectively, but in 2022, the FTX collapse sent it back down to $15,500. And before each rebound, it first fell 10%–17%, which based on last week would be about $54,000–$59,000, close to the $50,000 range mentioned by Wintermute.
CoinDesk reminds us that 3 samples are not enough to establish a pattern. At present, ETF outflows and U.S. Treasury yields are still weighing on the market. Do you think this is an opportunity or a trap?
$BTC #比特币 #0 to 1000U Challenge
August 2015, March 2020, June 2022. Three months later, it rose 40.3%, 82.5%, and 6.3% respectively, but in 2022, the FTX collapse sent it back down to $15,500. And before each rebound, it first fell 10%–17%, which based on last week would be about $54,000–$59,000, close to the $50,000 range mentioned by Wintermute.
CoinDesk reminds us that 3 samples are not enough to establish a pattern. At present, ETF outflows and U.S. Treasury yields are still weighing on the market. Do you think this is an opportunity or a trap?
$BTC #比特币 #0 to 1000U Challenge

176
0 to 1000U Challenge · Day 3
Guys, let’s take a look—whose position has already been wiped out? You heard, right? On November 15, BTC plunged straight to $62,080, wiping out $2 billion across the market, including $1.68 billion in long positions. The Fear Index plunged to 12, and the odds of a December rate hike on Kalshi soared to 89% (Source: CoinGecko/CoinGlass). CZ even personally debunked the rumors on X, saying, “Binance did not sell crypto.” In other words, Binance didn’t sell any coins! What does this tell us? Fear has turned into suspicion—keep an eye on hard on-chain evidence and official announcements! Do you check on-chain data or listen to rumors in the group chat?
$BTC $ETH $SOL
0 to 1000U Challenge · Day 3
Guys, let’s take a look—whose position has already been wiped out? You heard, right? On November 15, BTC plunged straight to $62,080, wiping out $2 billion across the market, including $1.68 billion in long positions. The Fear Index plunged to 12, and the odds of a December rate hike on Kalshi soared to 89% (Source: CoinGecko/CoinGlass). CZ even personally debunked the rumors on X, saying, “Binance did not sell crypto.” In other words, Binance didn’t sell any coins! What does this tell us? Fear has turned into suspicion—keep an eye on hard on-chain evidence and official announcements! Do you check on-chain data or listen to rumors in the group chat?
$BTC $ETH $SOL
Guys, let’s take a look—whose position has already been wiped out? You heard, right? On November 15, BTC plunged straight to $62,080, wiping out $2 billion across the market, including $1.68 billion in long positions. The Fear Index plunged to 12, and the odds of a December rate hike on Kalshi soared to 89% (Source: CoinGecko/CoinGlass). CZ even personally debunked the rumors on X, saying, “Binance did not sell crypto.” In other words, Binance didn’t sell any coins! What does this tell us? Fear has turned into suspicion—keep an eye on hard on-chain evidence and official announcements! Do you check on-chain data or listen to rumors in the group chat?
$BTC $ETH $SOL

270
On November 15, BTC fell to $62,080, its lowest level in nearly four months, down over 5% intraday, with about $2 billion in liquidations ($1.68 billion in long positions).
According to CoinGecko/CoinStats/Beijing Business Today/CoinGlass: BTC fell nearly 15% for the week of November 9–15, marking six consecutive weeks of losses, and is down 26.6% year to date; ETH fell 15.3% for the week to $1,805, SOL fell 18.5% to $71, and XRP fell 14%.
The Fear & Greed Index is at 12, indicating extreme fear (2026-11-17). Kalshi puts the probability of a December rate hike at 89%. Rate hike expectations and ETF outflows are weighing on the market. CZ denied that Binance was selling off, underscoring the panic.
No trading signals, no trade-following, and no promises of returns. With the probability of a rate hike at 89%, are you staying on the sidelines with no positions, or holding a core position? $BTC $ETH $SOL
On November 15, BTC fell to $62,080, its lowest level in nearly four months, down over 5% intraday, with about $2 billion in liquidations ($1.68 billion in long positions).
According to CoinGecko/CoinStats/Beijing Business Today/CoinGlass: BTC fell nearly 15% for the week of November 9–15, marking six consecutive weeks of losses, and is down 26.6% year to date; ETH fell 15.3% for the week to $1,805, SOL fell 18.5% to $71, and XRP fell 14%.
The Fear & Greed Index is at 12, indicating extreme fear (2026-11-17). Kalshi puts the probability of a December rate hike at 89%. Rate hike expectations and ETF outflows are weighing on the market. CZ denied that Binance was selling off, underscoring the panic.
No trading signals, no trade-following, and no promises of returns. With the probability of a rate hike at 89%, are you staying on the sidelines with no positions, or holding a core position? $BTC $ETH $SOL
According to CoinGecko/CoinStats/Beijing Business Today/CoinGlass: BTC fell nearly 15% for the week of November 9–15, marking six consecutive weeks of losses, and is down 26.6% year to date; ETH fell 15.3% for the week to $1,805, SOL fell 18.5% to $71, and XRP fell 14%.
The Fear & Greed Index is at 12, indicating extreme fear (2026-11-17). Kalshi puts the probability of a December rate hike at 89%. Rate hike expectations and ETF outflows are weighing on the market. CZ denied that Binance was selling off, underscoring the panic.
No trading signals, no trade-following, and no promises of returns. With the probability of a rate hike at 89%, are you staying on the sidelines with no positions, or holding a core position? $BTC $ETH $SOL

205
The sell-off over the weekend was pretty brutal. BTC briefly fell below 63,000, hitting a low of 62,006, before bouncing back to close around 65,500. Today, it has slipped back to around 64,800. From its weekly high near 71,460, it has dropped more than 10%, driven by a wave of long liquidations and continued outflows from spot ETFs. The RSI is now around 23, so it is clearly oversold—but being oversold doesn’t mean an immediate reversal. First, watch whether 62,000 holds; if it doesn’t, BTC could test the area around 60,000. Resistance is at 66,100 and 69,000. Today is the first day of a new settlement week. I’ll first watch whether volume confirms the price action. I’m not chasing the bounce or trying to call the bottom; when volatility is high, it’s better to keep positions light. $BTC
The sell-off over the weekend was pretty brutal. BTC briefly fell below 63,000, hitting a low of 62,006, before bouncing back to close around 65,500. Today, it has slipped back to around 64,800. From its weekly high near 71,460, it has dropped more than 10%, driven by a wave of long liquidations and continued outflows from spot ETFs. The RSI is now around 23, so it is clearly oversold—but being oversold doesn’t mean an immediate reversal. First, watch whether 62,000 holds; if it doesn’t, BTC could test the area around 60,000. Resistance is at 66,100 and 69,000. Today is the first day of a new settlement week. I’ll first watch whether volume confirms the price action. I’m not chasing the bounce or trying to call the bottom; when volatility is high, it’s better to keep positions light. $BTC
261
Log in to explore more content
Join global crypto users on Binance Square
⚡️ Get latest and useful information about crypto.
💬 Trusted by the world’s largest crypto exchange.
👍 Discover real insights from verified creators.
Email / Phone number
Trending Topics
BTCReboundsAbove$60KAmidWhaleDipBuying
32,541 views
190 Discussing
Abraxas Capital, Other Whales Buy the BTC Dip as Bitcoin Briefly Reclaims $60,000
Binance News
·31 Likes
·47.5k views
SolanaSets2027RoadmapToDoubleComputeCapacity
15,737 views
455 Discussing
CaliforniaNvidiaProbeExaminesPotentialCriminalViolations
4,806 views
61 Discussing