MEM973

دارس علوم التحليل/ تحليل زمني ورقمي ـ موجي ـ SMC_ SK system _ ICT ـكلاسيكي ـ برايس أكشن ـ علم الايشيموكو
12.4K+ Following
5.0K+ Followers
2.3K+ Liked
Posts
PINNED
·
--
Where is Bitcoin's bottom / Bitcoin analysis using time and numerical analysis BTCBitcoin Analysis #BTC using time and numerical analysis. Bitcoin's rise ends at 126150 and when it drops and forms a trading box at a price of 109865, it then rebounded from this price reaching 116373, forming the octagonal shape. The angle means at 109868 and the midpoint of the angle 116373, from here the targets of the octagonal shape are 3 price and time descent cycles of 1080 candles for 8 hours, which means a year.

Where is Bitcoin's bottom / Bitcoin analysis using time and numerical analysis BTC

Bitcoin Analysis #BTC using time and numerical analysis.
Bitcoin's rise ends at 126150 and when it drops and forms a trading box at a price of 109865, it then rebounded from this price reaching 116373, forming the octagonal shape.
The angle means at 109868 and the midpoint of the angle 116373, from here the targets of the octagonal shape are 3 price and time descent cycles of 1080 candles for 8 hours, which means a year.
·
--
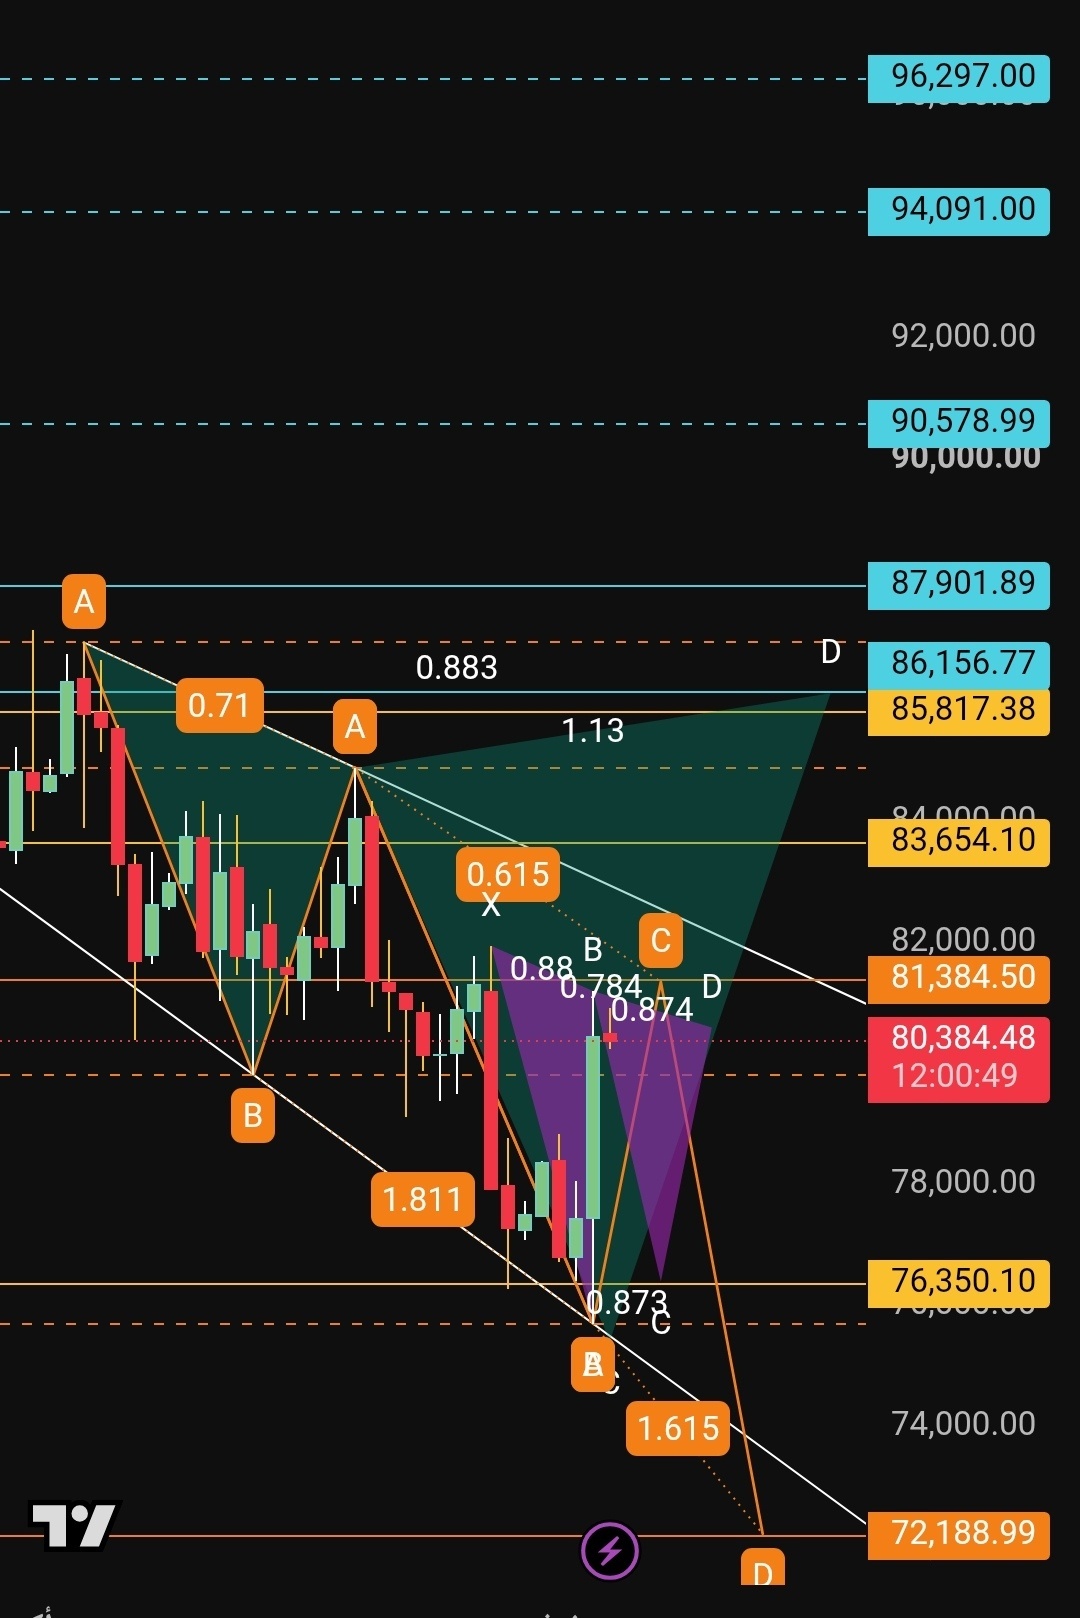
Bitcoin update #BTC $BTC I think Bitcoin has finished falling at the 75,500 level, which was a strong price action point. To maintain the bullish trend, the 81,200 level must be broken, with a daily close above it. Currently, there is a bullish Shark pattern, with a first main target of 86,179 and a second main target of 87,900. There are also secondary targets between 94,000 and 96,000. This means the secondary targets for this pattern align with the larger Shark pattern on the daily timeframe, whose main target was 93,000. There is also a bearish outlook: a 1-2-3 Drive pattern with a target of around 72,500. This would happen if price is rejected from the 82,000 level and breaks below 79,000 again. I favor the bullish outlook, but an update will be needed once Bitcoin reaches 86,000.
Bitcoin update #BTC $BTC
I think Bitcoin has finished falling at the 75,500 level, which was a strong price action point.
To maintain the bullish trend, the 81,200 level must be broken, with a daily close above it.
Currently, there is a bullish Shark pattern, with a first main target of 86,179
and a second main target of 87,900.
There are also secondary targets between 94,000 and 96,000.
This means the secondary targets for this pattern align with the larger Shark pattern on the daily timeframe, whose main target was 93,000.
There is also a bearish outlook: a 1-2-3 Drive pattern with a target of around 72,500. This would happen if price is rejected from the 82,000 level and breaks below 79,000 again.
I favor the bullish outlook, but an update will be needed once Bitcoin reaches 86,000.
·
--
If you're interested in continuous, fast updates on Bitcoin and currencies, or want to know where oil and its derivatives are headed, with quick news, or if you'd like to discuss the market or a currency, or have a question, [إنضمام](https://app.binance.com/uni-qr/DZtBhX7K)
If you're interested in continuous, fast updates on Bitcoin and currencies,
or want to know where oil and its derivatives are headed, with quick news,
or if you'd like to discuss the market or a currency, or have a question,
إنضمام
·
--
Article
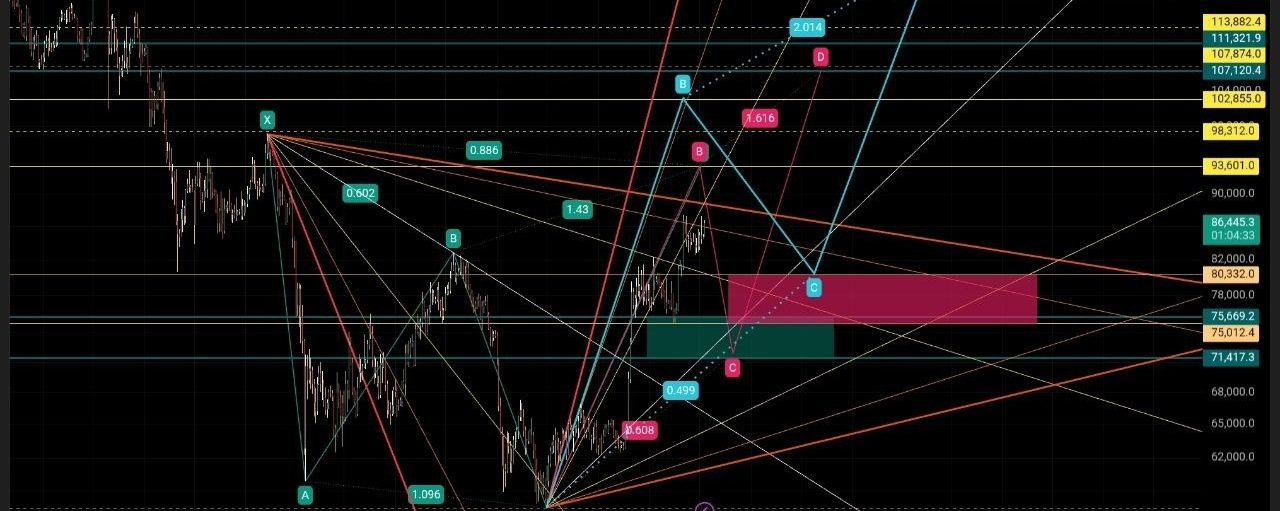
Update on Bitcoin status#BTC #btcusdt $BTC Okay, continuing from the last update: I had only put the lower scenario before, and I explained the longer-term outlook. But as for Bitcoin in the current movement, I think the shared model is on the rise and Bitcoin will reach level 103, then there will be a sharp correction in a zone between 80k and 75k. From there, we monitor the movement, because in a forward-looking scenario it could rise with an AB=CD model, with the end of the leg at 125k. And along with that, there will be a time outlook for a bullish season.

Update on Bitcoin status

#BTC #btcusdt $BTC
Okay, continuing from the last update: I had only put the lower scenario before, and I explained the longer-term outlook.
But as for Bitcoin in the current movement,
I think the shared model is on the rise and Bitcoin will reach level 103, then there will be a sharp correction in a zone between 80k and 75k. From there, we monitor the movement, because in a forward-looking scenario it could rise with an AB=CD model, with the end of the leg at 125k. And along with that, there will be a time outlook for a bullish season.
·
--
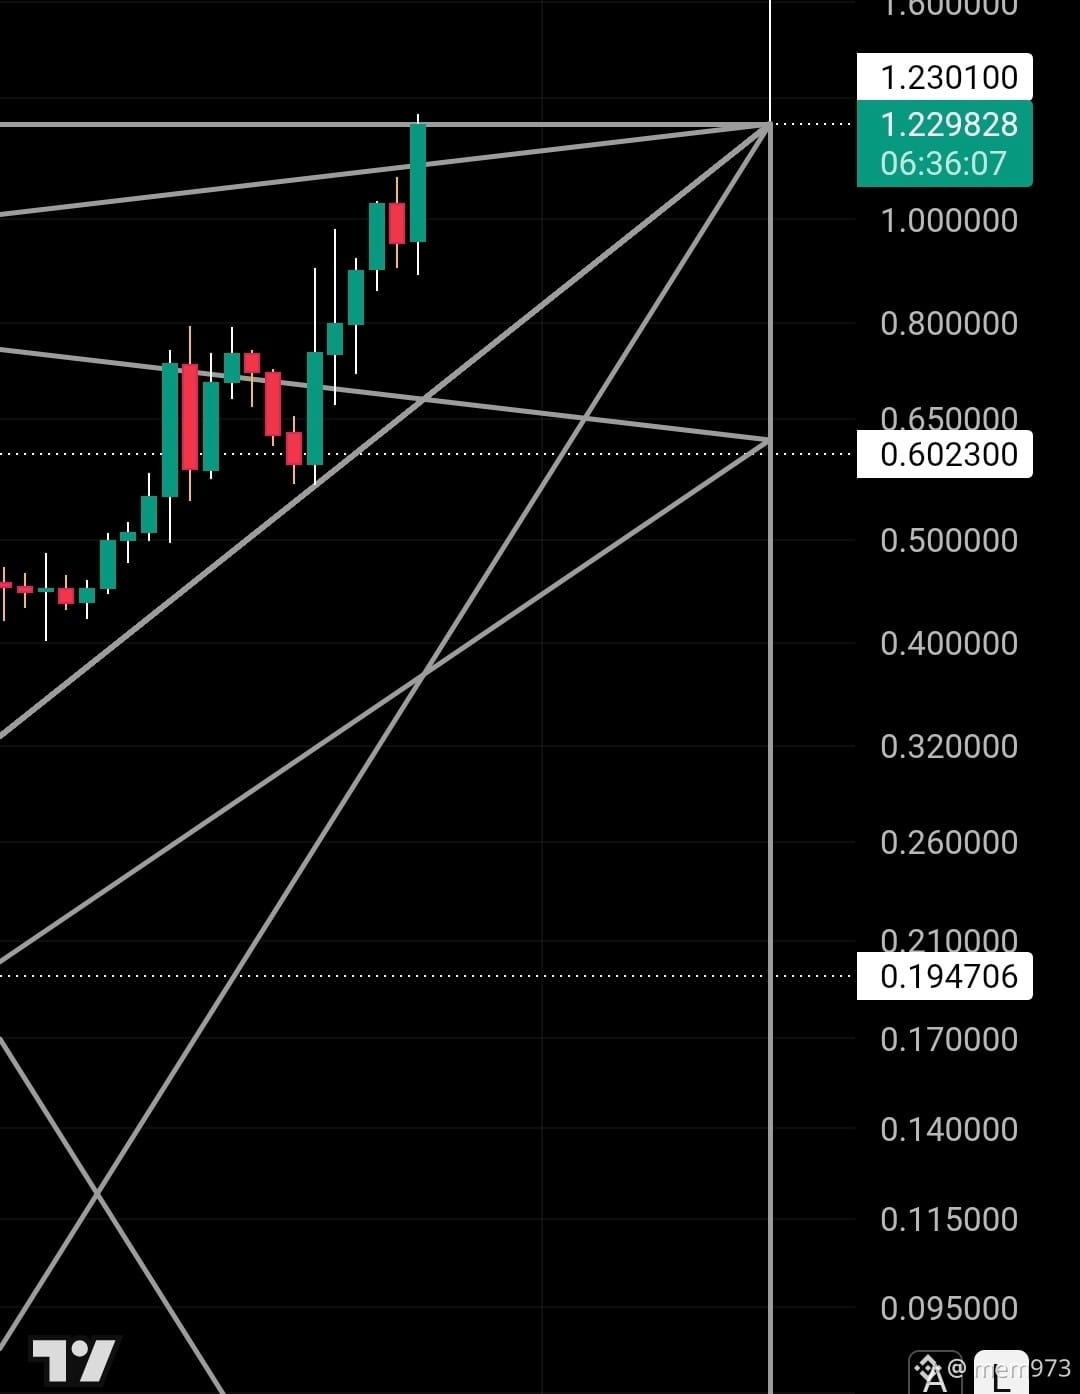
And indeed the coin $BTW #BTWUSDT⚡️ achieved the last time target just like I told you 1.23. And I analyzed it and it was 0.34, and I said there is still a correction until 0.29—meaning it did more than 3×. I didn’t enter the coin, but I made it clear from the beginning that I was analyzing it because there were many people who were losing on the coin because of futures streams. Good luck
And indeed the coin $BTW #BTWUSDT⚡️ achieved the last time target just like I told you 1.23. And I analyzed it and it was 0.34, and I said there is still a correction until 0.29—meaning it did more than 3×.
I didn’t enter the coin, but I made it clear from the beginning that I was analyzing it because there were many people who were losing on the coin because of futures streams.
Good luck
MEM973
·
--
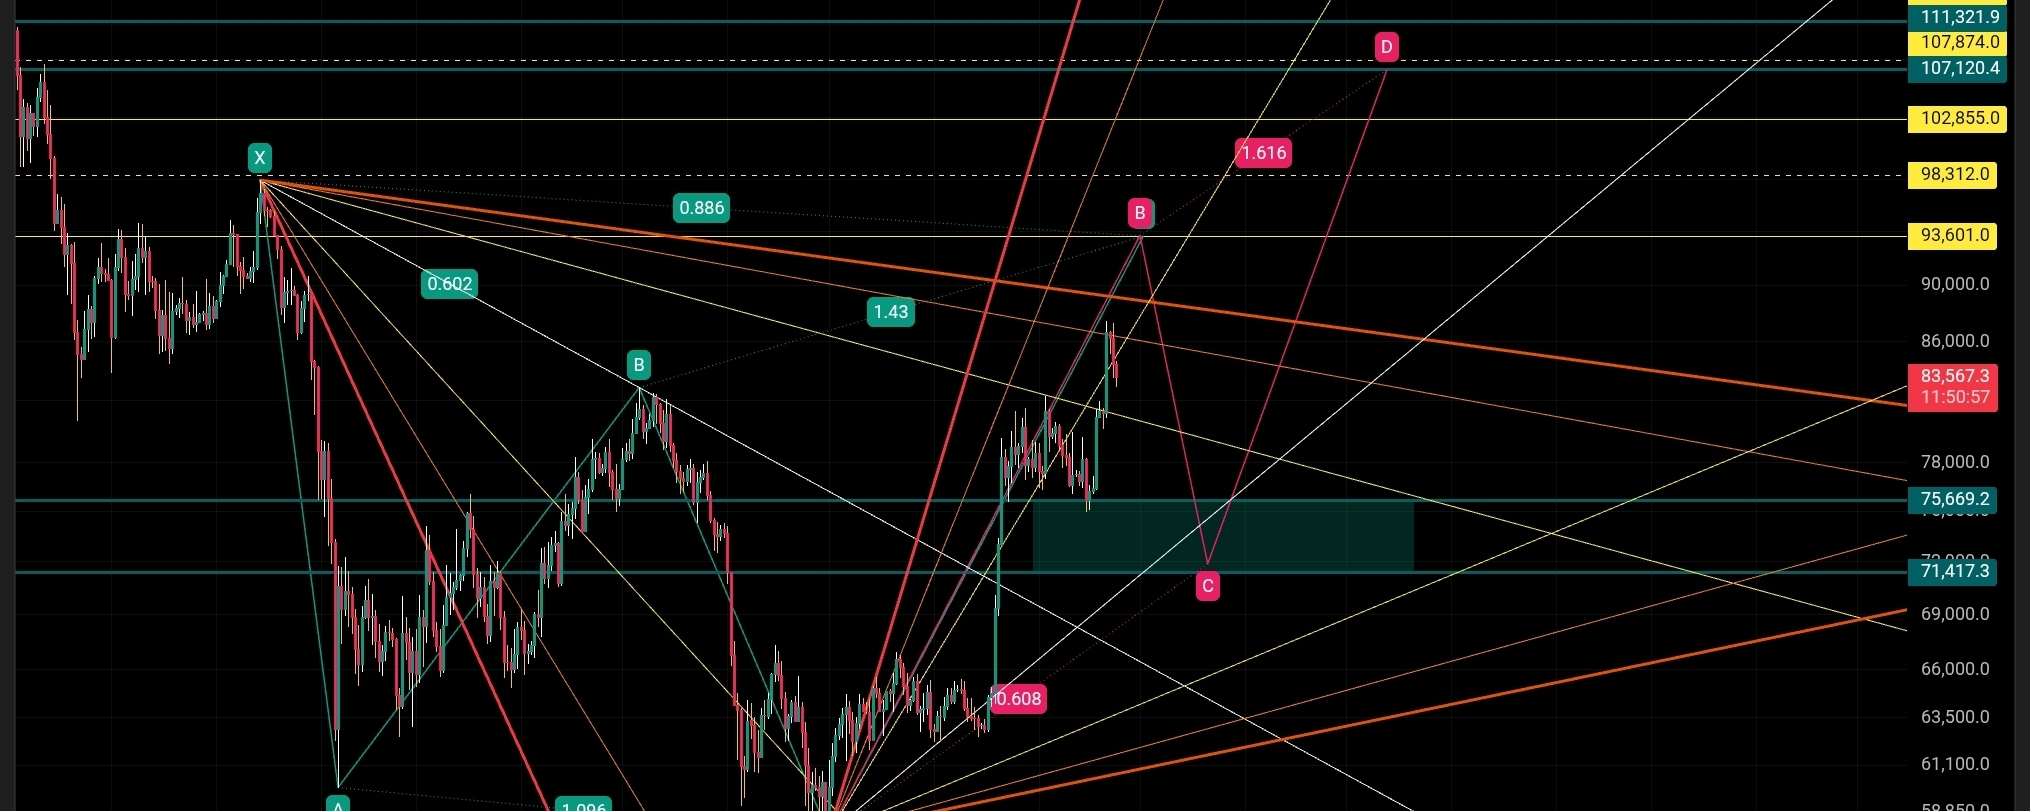
Analysis of trade $BTW #btwusdt using time analysis
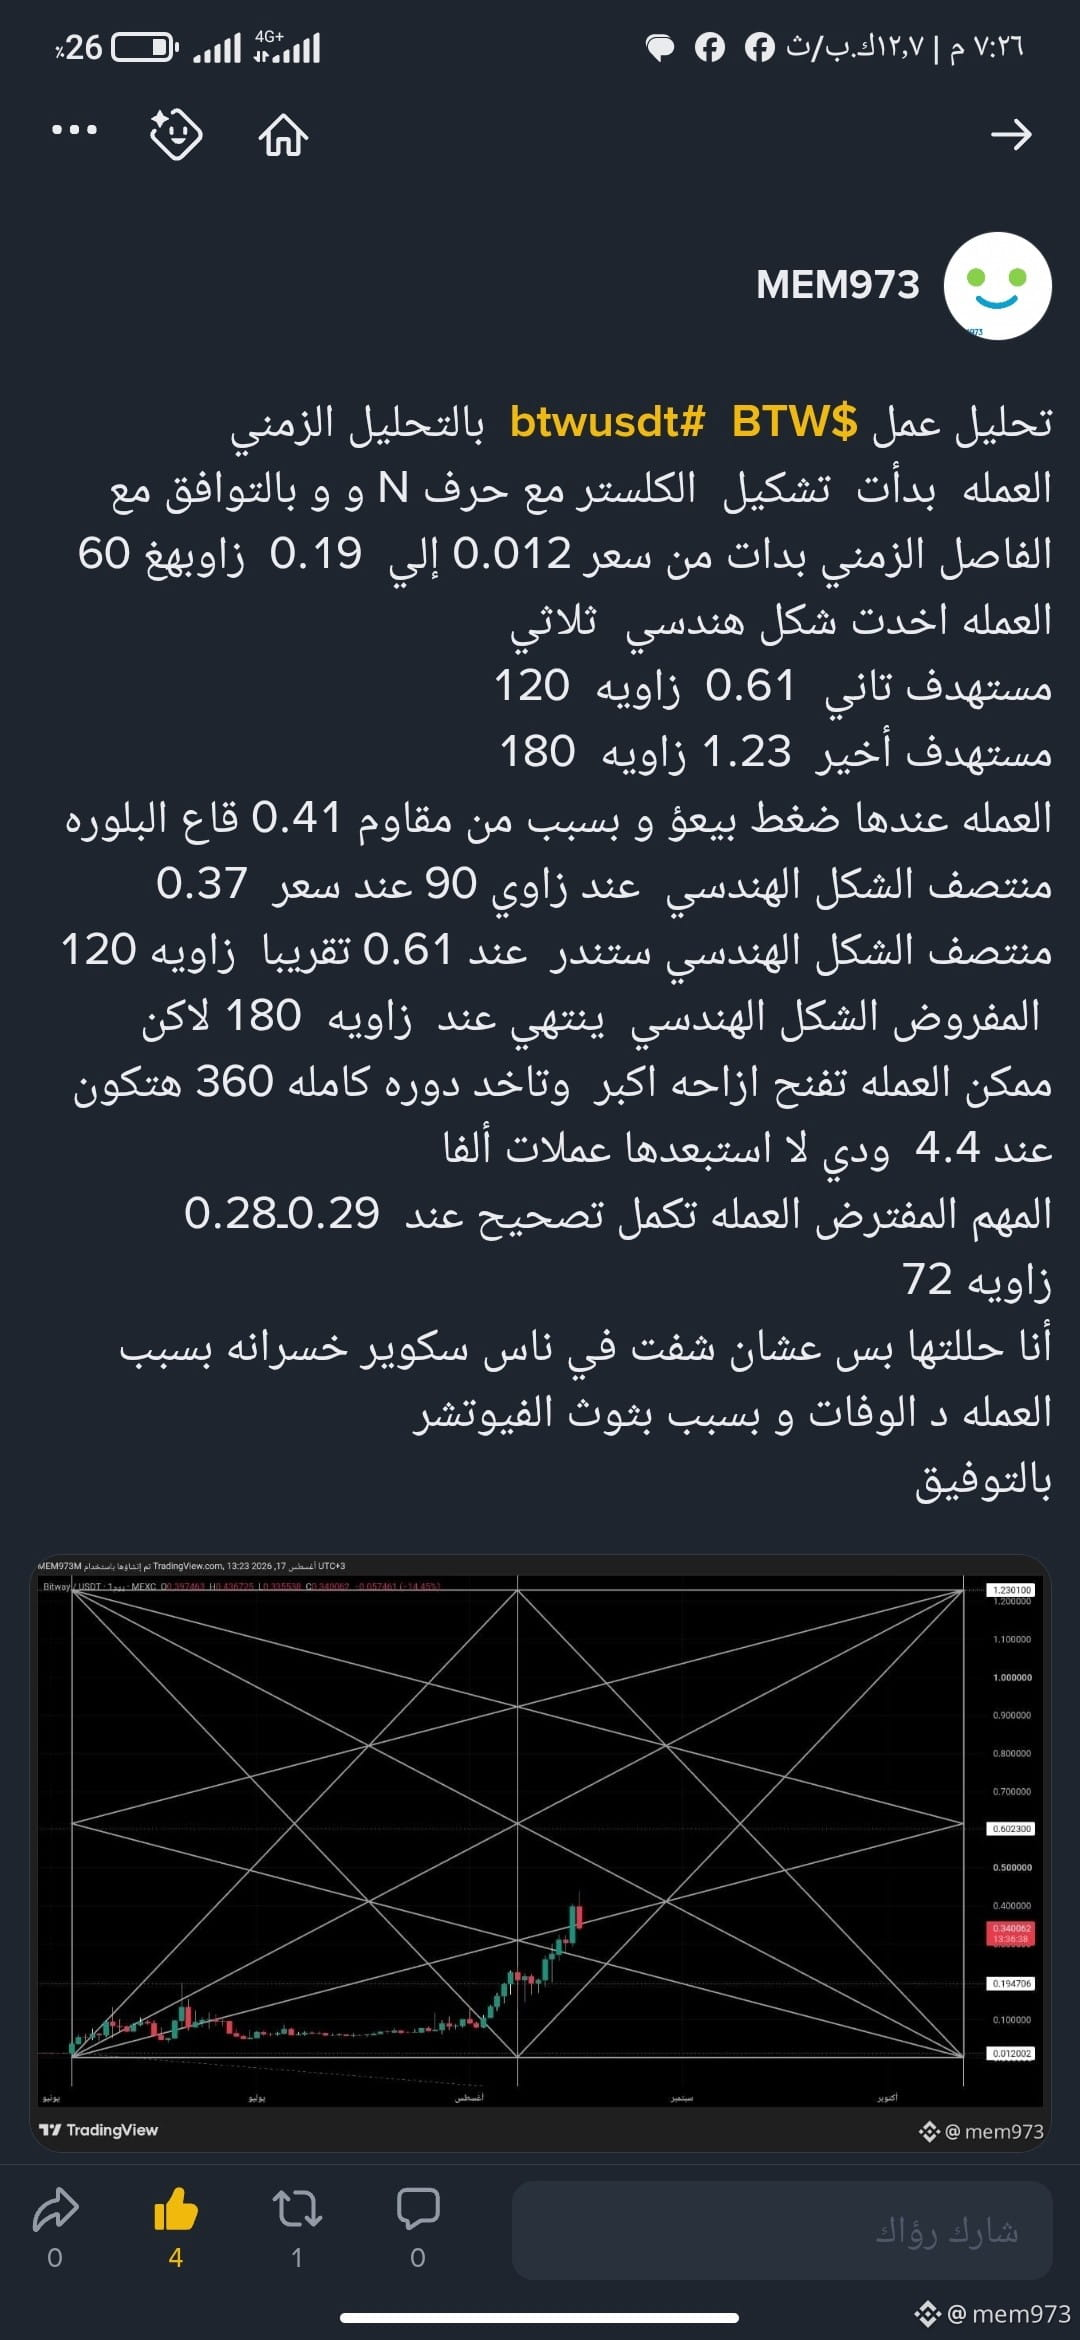
The deal began forming the cluster with the letter N, and in line with the time interval it started from a price of 0.012 up to 0.19 at an angle of 60
The coin/asset took on a three-dimensional geometric shape
Second target 0.61 at an angle of 120
Final target 1.23 at an angle of 180
The asset has selling pressure, due to resistance 0.41 at the bottom of the crystal
Midpoint of the geometric shape: at an angle of 90 at a price of 0.37
Midpoint of the geometric shape roughly standardizes at 0.61 at an angle of 120
The geometric shape is supposed to end at an angle of 180, but it’s possible the asset breaks/extends with a larger displacement and completes a full cycle of 360, which would be at 4.4—and I don’t rule out it being an Alpha wave/coin
The important part is that the asset should complete its correction at 0.29–0.28
Angle 72
I analyzed it only because I saw that some people were getting a bad result due to the coin’s death/death move and because of the risky nature of the futures
Good luck
·
--
Article
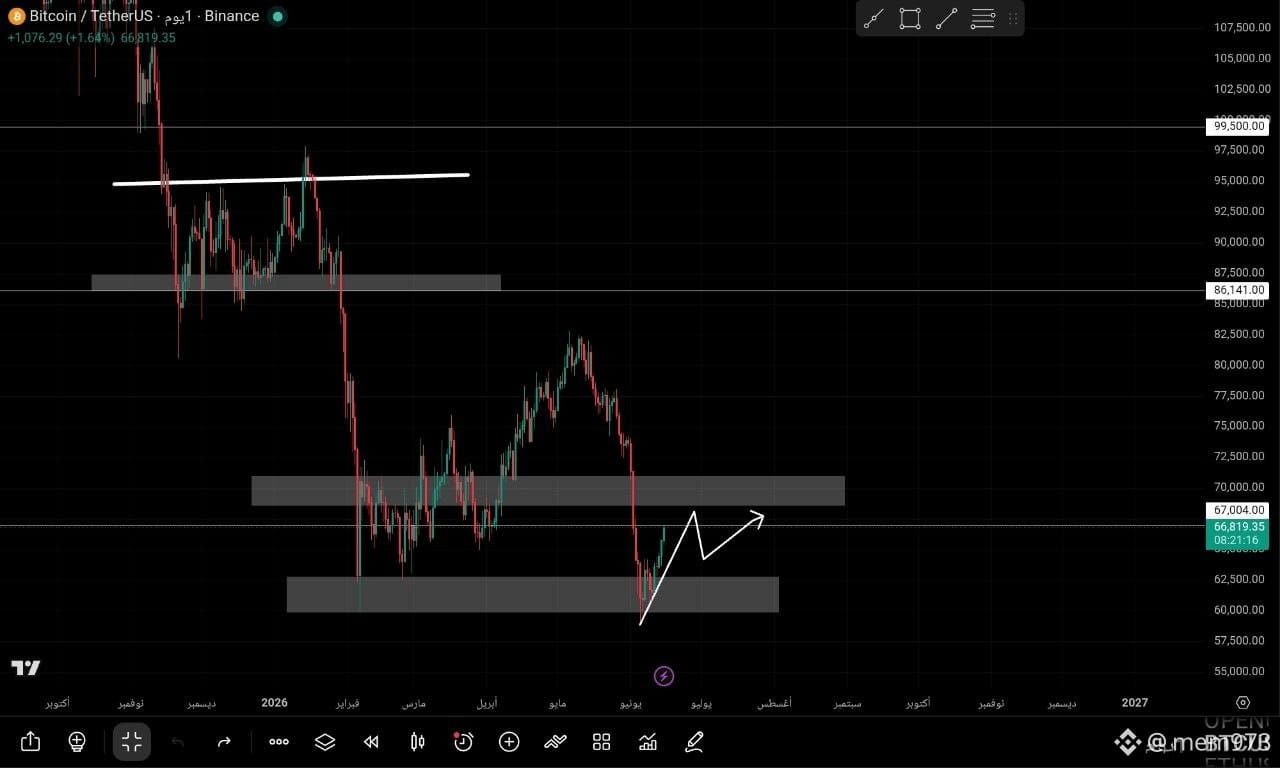
Bitcoin Situation UpdateUpdate on Bitcoin's situation / Is it positive or just a rebound? I had posted an update a while back in which I explained two scenarios. The negative one was that Bitcoin would break 57,000 assuming the level breaks, and Kuwait’s models were negative for a drop to 43,000. The positive scenario was that it would break the 68,000 zone, then break the resistance at 71,500. My outlook was more negative, and all indicators confirmed the downside.

Bitcoin Situation Update

Update on Bitcoin's situation
/ Is it positive or just a rebound?
I had posted an update a while back in which I explained two scenarios. The negative one was that Bitcoin would break 57,000 assuming the level breaks, and Kuwait’s models were negative for a drop to 43,000.
The positive scenario was that it would break the 68,000 zone, then break the resistance at 71,500. My outlook was more negative, and all indicators confirmed the downside.
·
--
And indeed you did it $BTW #BTWUSDT⚡️ . You corrected at the 0.39 level and did not break 0.35, and it quickly stabilized above the 0.45 level and formed the letter W like I explained. The best now for the coin to break through 0.61 in order to achieve the final target at 1.23
And indeed you did it $BTW #BTWUSDT⚡️ . You corrected at the 0.39 level and did not break 0.35, and it quickly stabilized above the 0.45 level and formed the letter W like I explained.
The best now for the coin to break through 0.61 in order to achieve the final target at 1.23
MEM973
·
--
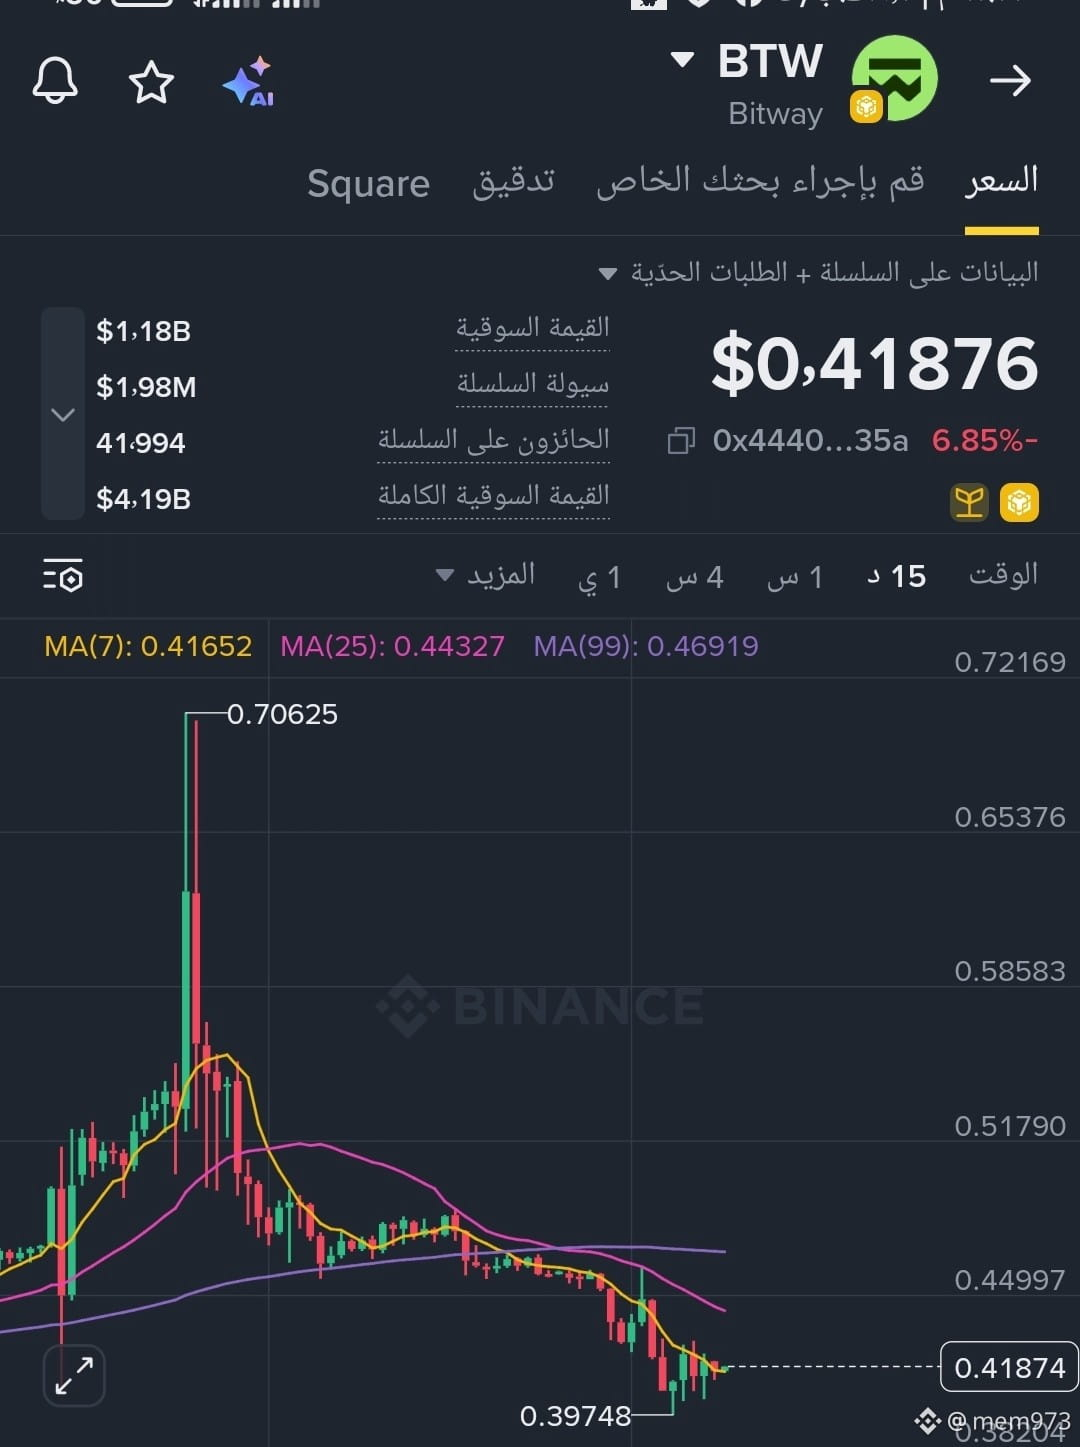
Sure, $BTW 0.39 has arrived. I think the work will move in a sideways course and it will require not breaking the 0.35 level
·
--
Bearish
What do you expect for Bitcoin BTC $BTC
صعود وإختراق 82850
65%
تصحيح إلي 72 ألف
35%
26 votes • Voting closed
·
--
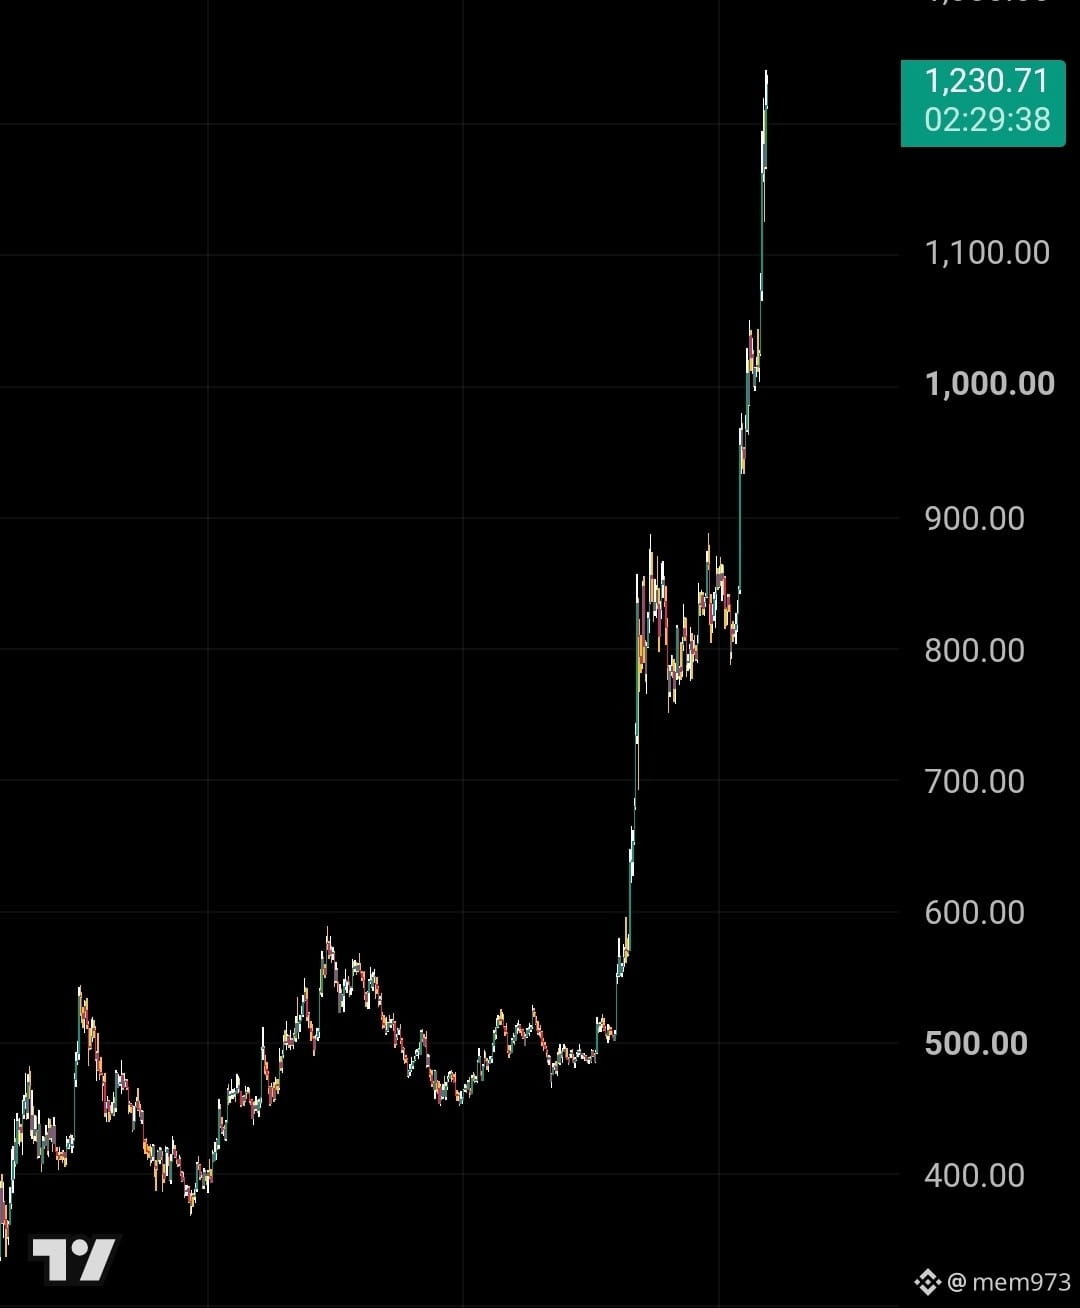
About 7 months ago, I mentioned that $ZEC #ZECUSDT would rise and that I would make a new all-time high. I also mentioned that one of its targets was $911, and in another place I said it would reach $1,000. Indeed, the currency made an all-time high, just as I mentioned 7 months ago, and I was doing time-based analysis on it.
MEM973
·
--
Will the ZEC currency create a new historical peak?
First thing, the currency #zec $ZEC started forming a square of operations on the 1, 2, 3, and 4 hour frames, all of them formed the same square of operations starting from 184.59 and the breakout at 254.6. From here, an octagonal geometric shape was formed.
However, it's generally known that larger geometric shapes like this rarely materialize in smaller currencies.
The currency is moving slowly between 1:2 and 1:3. The currency needs to increase its speed to at least move 1:1, but if it achieves that speed, we will pump it.
·
--
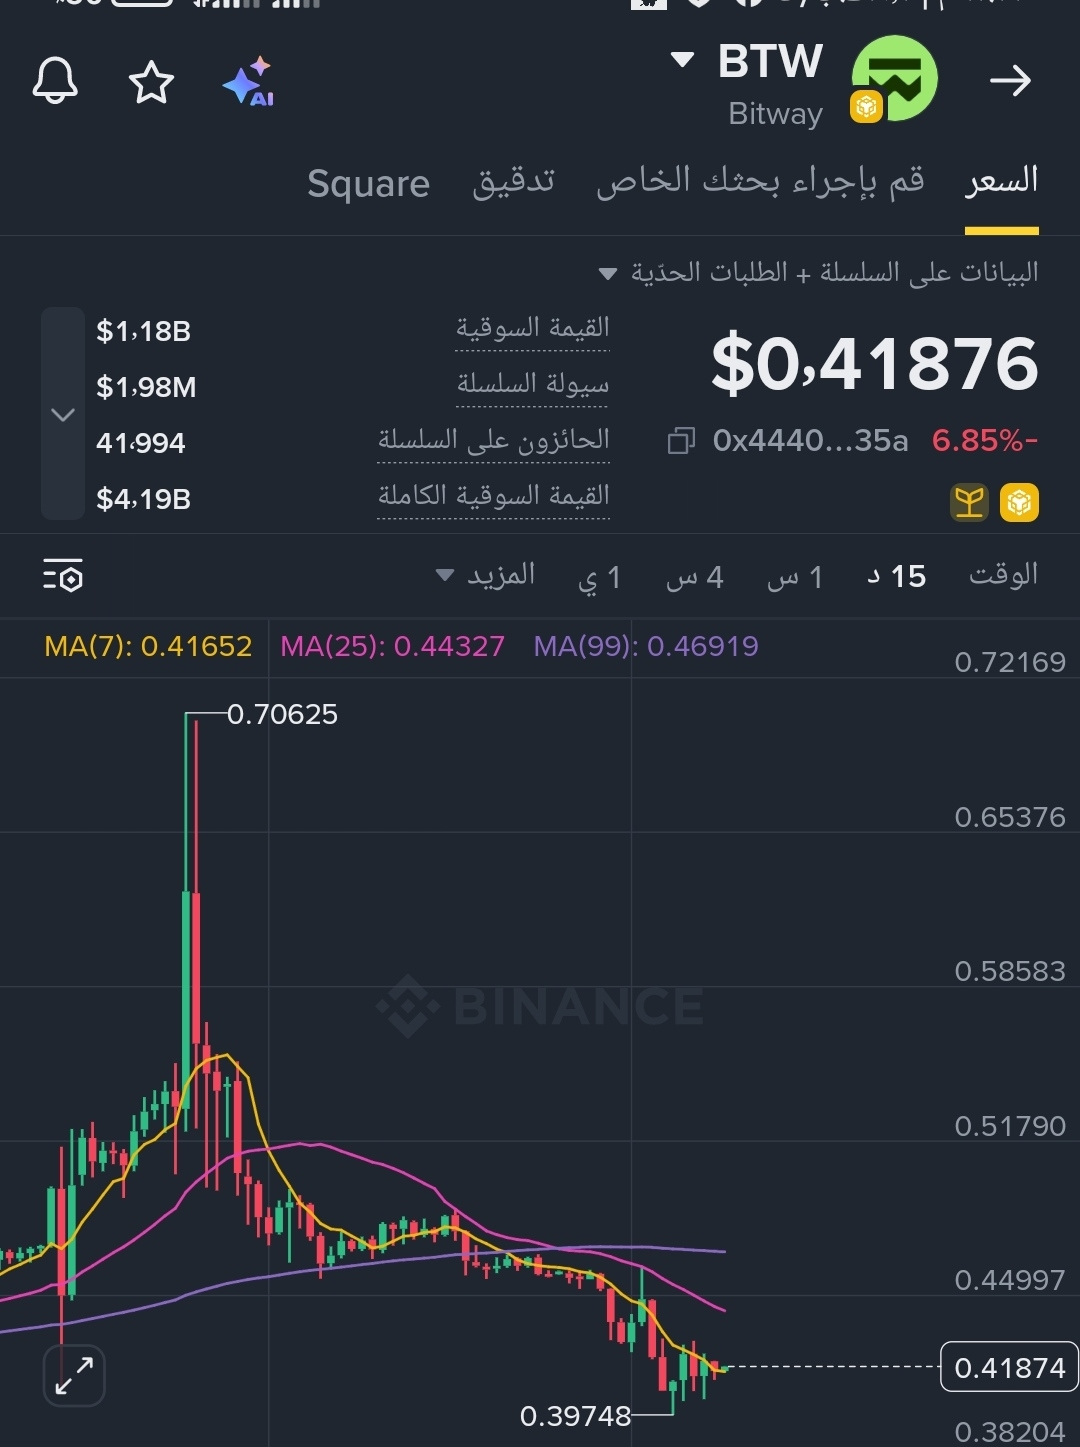
Sure, $BTW 0.39 has arrived. I think the work will move in a sideways course and it will require not breaking the 0.35 level
MEM973
·
--
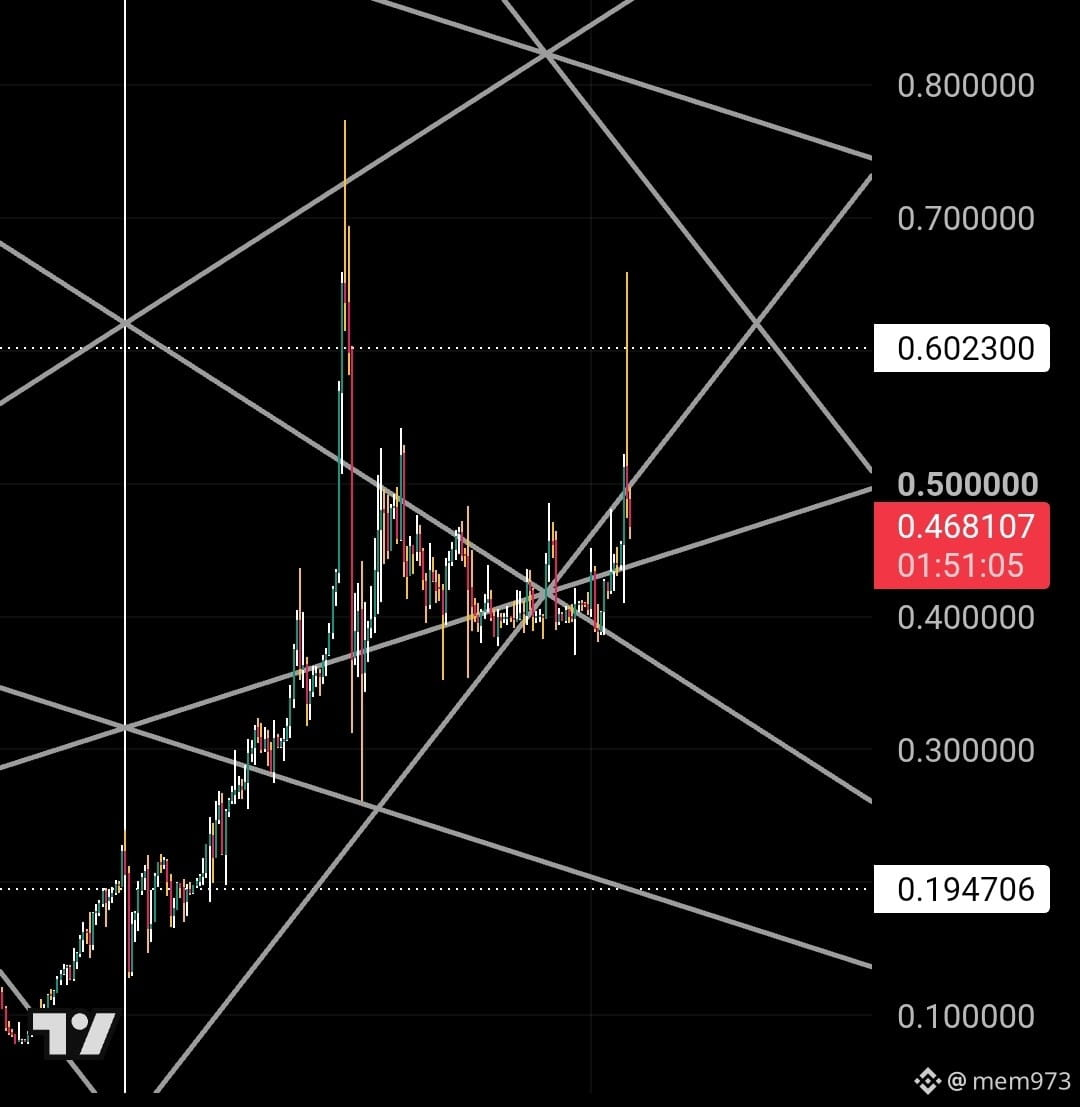
And indeed $BTW #BTWUSDT worked for the studio that I had posted, 0.6 and 0.75, and it was not hacked. 0.77, I think it is a strong and locked angle zone. That’s why I made an effective double top with a corrective move again up to 0.45, broke it, and the drop went to 0.39, then it made a double bottom, and then the studio with the letter W
·
--
And indeed $BTW #BTWUSDT worked for the studio that I had posted, 0.6 and 0.75, and it was not hacked. 0.77, I think it is a strong and locked angle zone. That’s why I made an effective double top with a corrective move again up to 0.45, broke it, and the drop went to 0.39, then it made a double bottom, and then the studio with the letter W
MEM973
·
--
$BTW #BTWUSDT I think that the next rise will reach the level 0.6, and if it breaks through 0.77, then we will continue the rise to complete its uptrend cycle
·
--
$BTW #BTWUSDT I think that the next rise will reach the level 0.6, and if it breaks through 0.77, then we will continue the rise to complete its uptrend cycle
MEM973
·
--
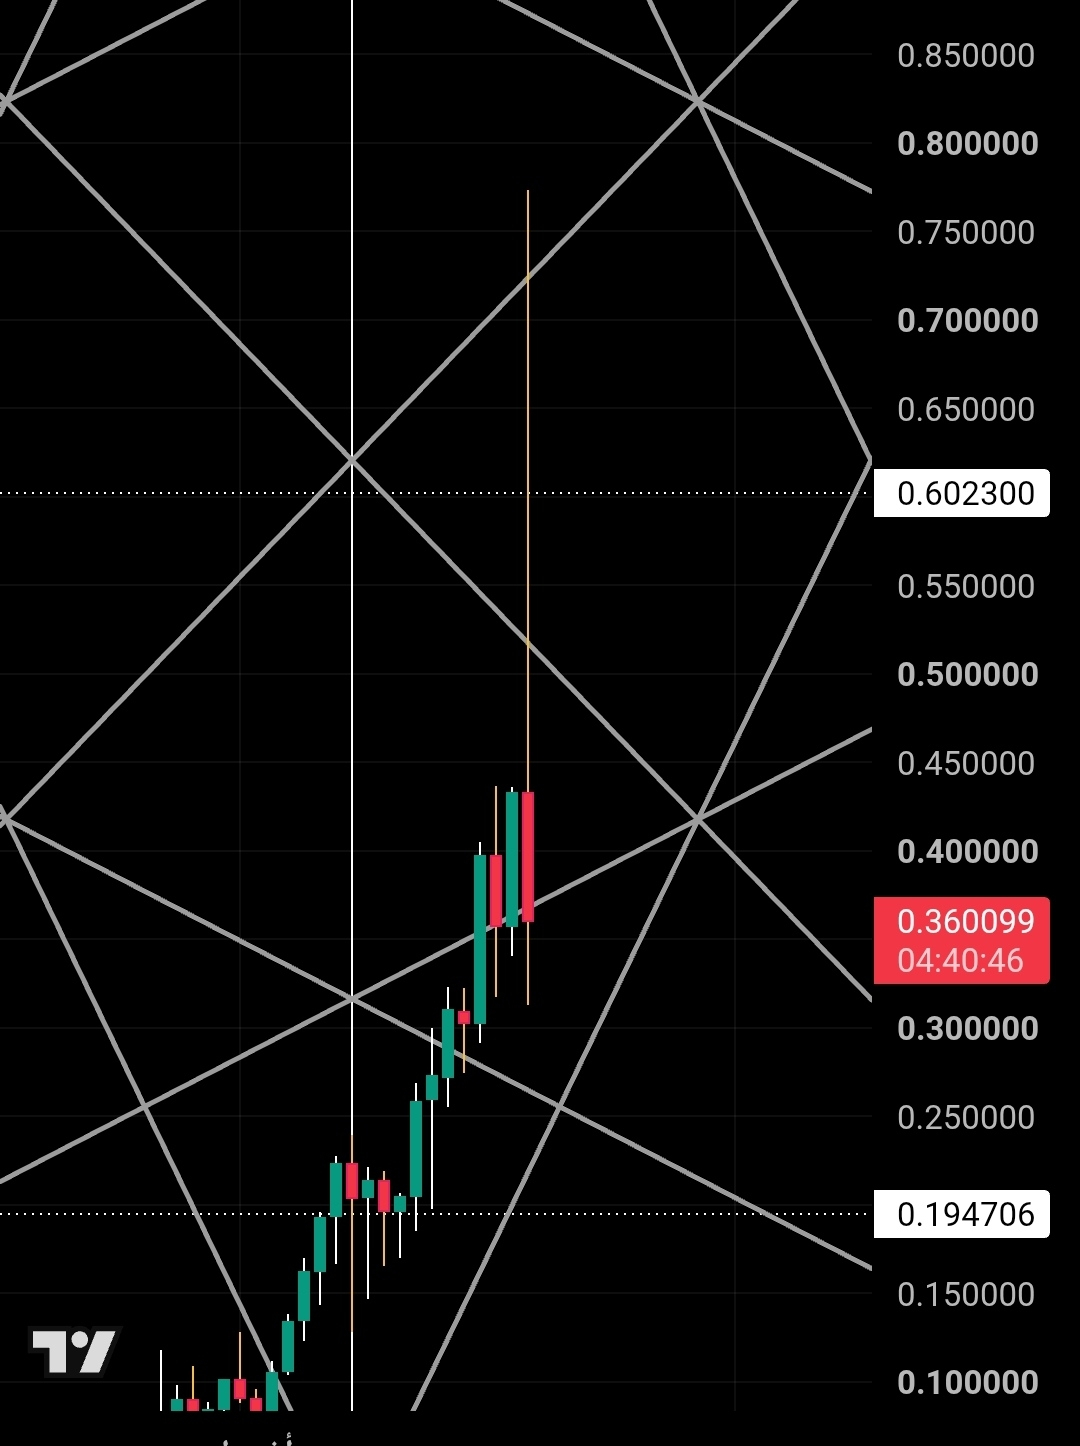
And indeed it worked, $BTW corrected with a strong correction.
I expect the coin to move within a sideways upward range, based on the current trend.
The absolute negativity is breaking the trend and closing a daily candle below the trend
·
--
And indeed it worked, $BTW corrected with a strong correction. I expect the coin to move within a sideways upward range, based on the current trend. The absolute negativity is breaking the trend and closing a daily candle below the trend
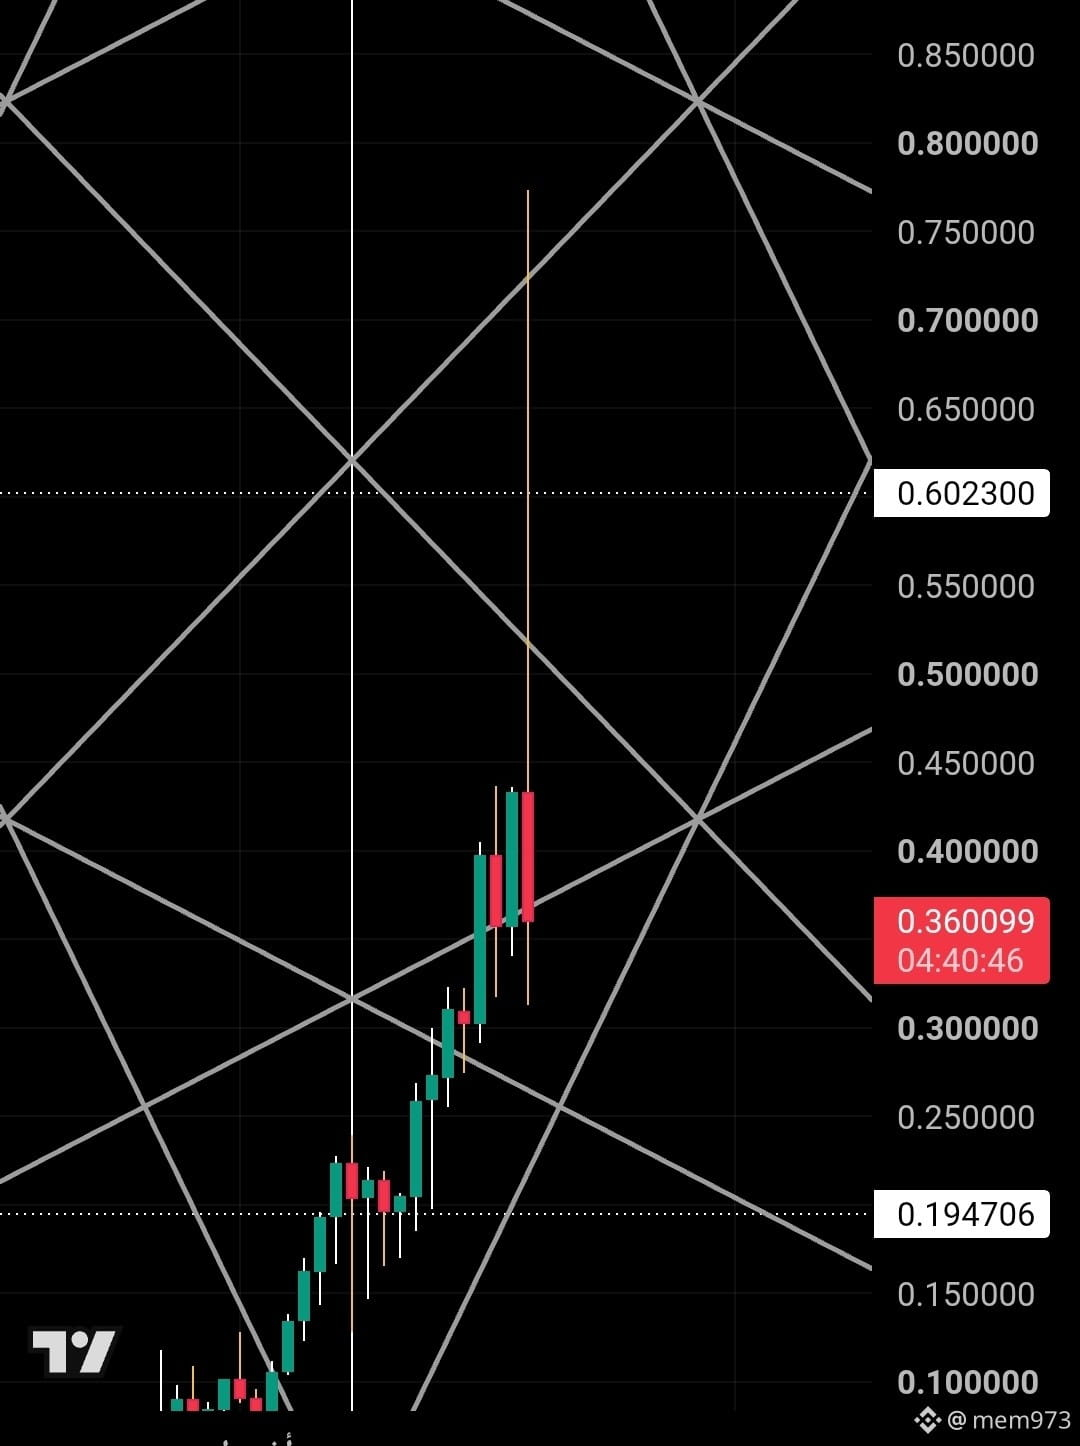
And indeed it worked, $BTW corrected with a strong correction.
I expect the coin to move within a sideways upward range, based on the current trend.
The absolute negativity is breaking the trend and closing a daily candle below the trend
MEM973
·
--
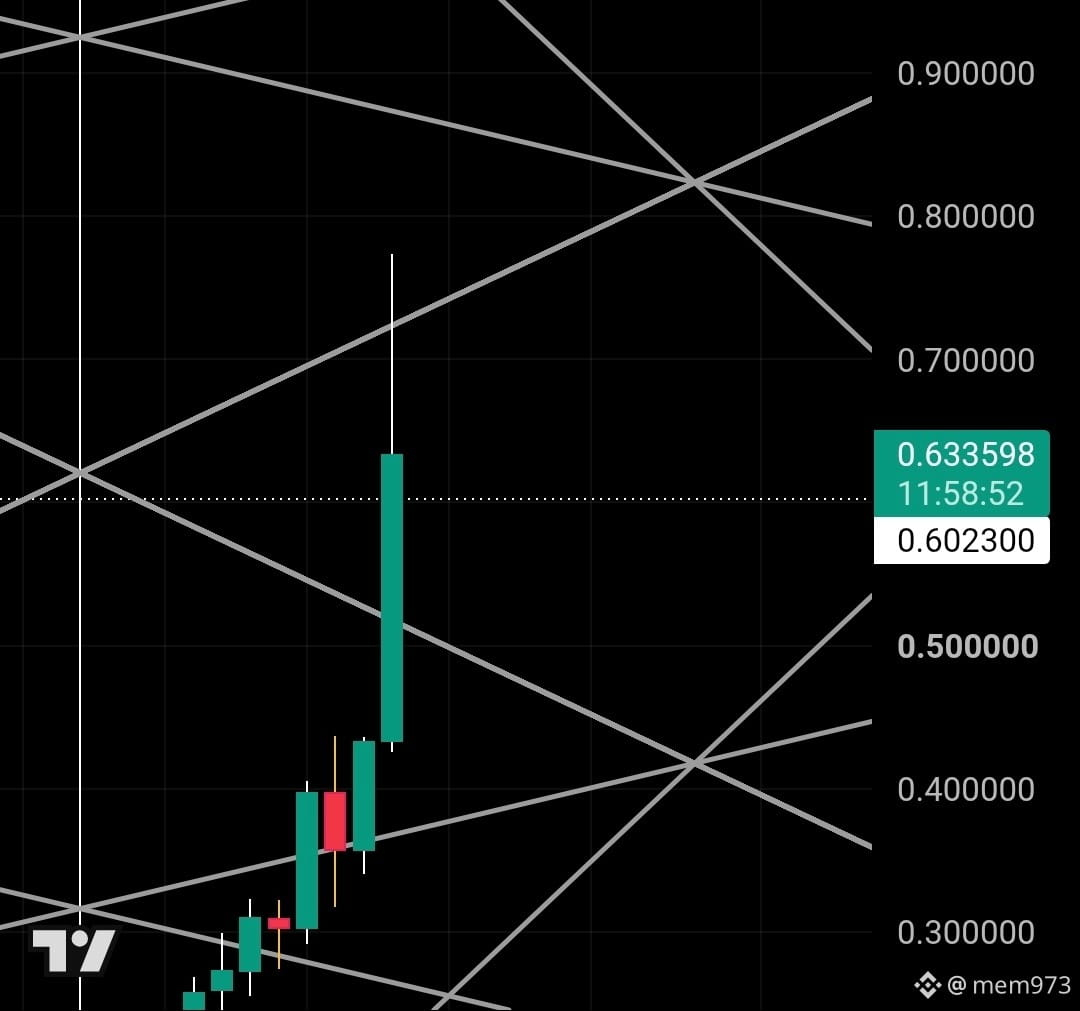
And indeed its performance $BTW #BTWUSDT⚡️ brought the target, the second one at 0.61 angle 120, and I was explaining that the coin would correct at price 0.29 to 0.28, but the coin stopped at correcting at 0.315.
And it rebounded from the second target with a strong candle, and this is the middle of the geometric shape.
I expect the deep correction from the red triangle zone going down to 0.49,
or the rise and rebound from the upper 1:2 trend to calm the speed and break 0=61,
or the rise until it hits 157 degrees at the end of the polygon at a price of 0.96, and the deep correction from there.
All of this will be determined by the close of a candle for 3 days or a week above or below the level 0.61.
Good luck,
·
--
The coin $BTW started a correction from trend 1:1, and it had strong resistance. I expected in the previous post that it would bounce from trend 1:2, and the scenario is still in place: the bounce from trend 1:2 would be at a price of 0.86.
The coin $BTW started a correction from trend 1:1, and it had strong resistance.
I expected in the previous post that it would bounce from trend 1:2, and the scenario is still in place: the bounce from trend 1:2 would be at a price of 0.86.
MEM973
·
--
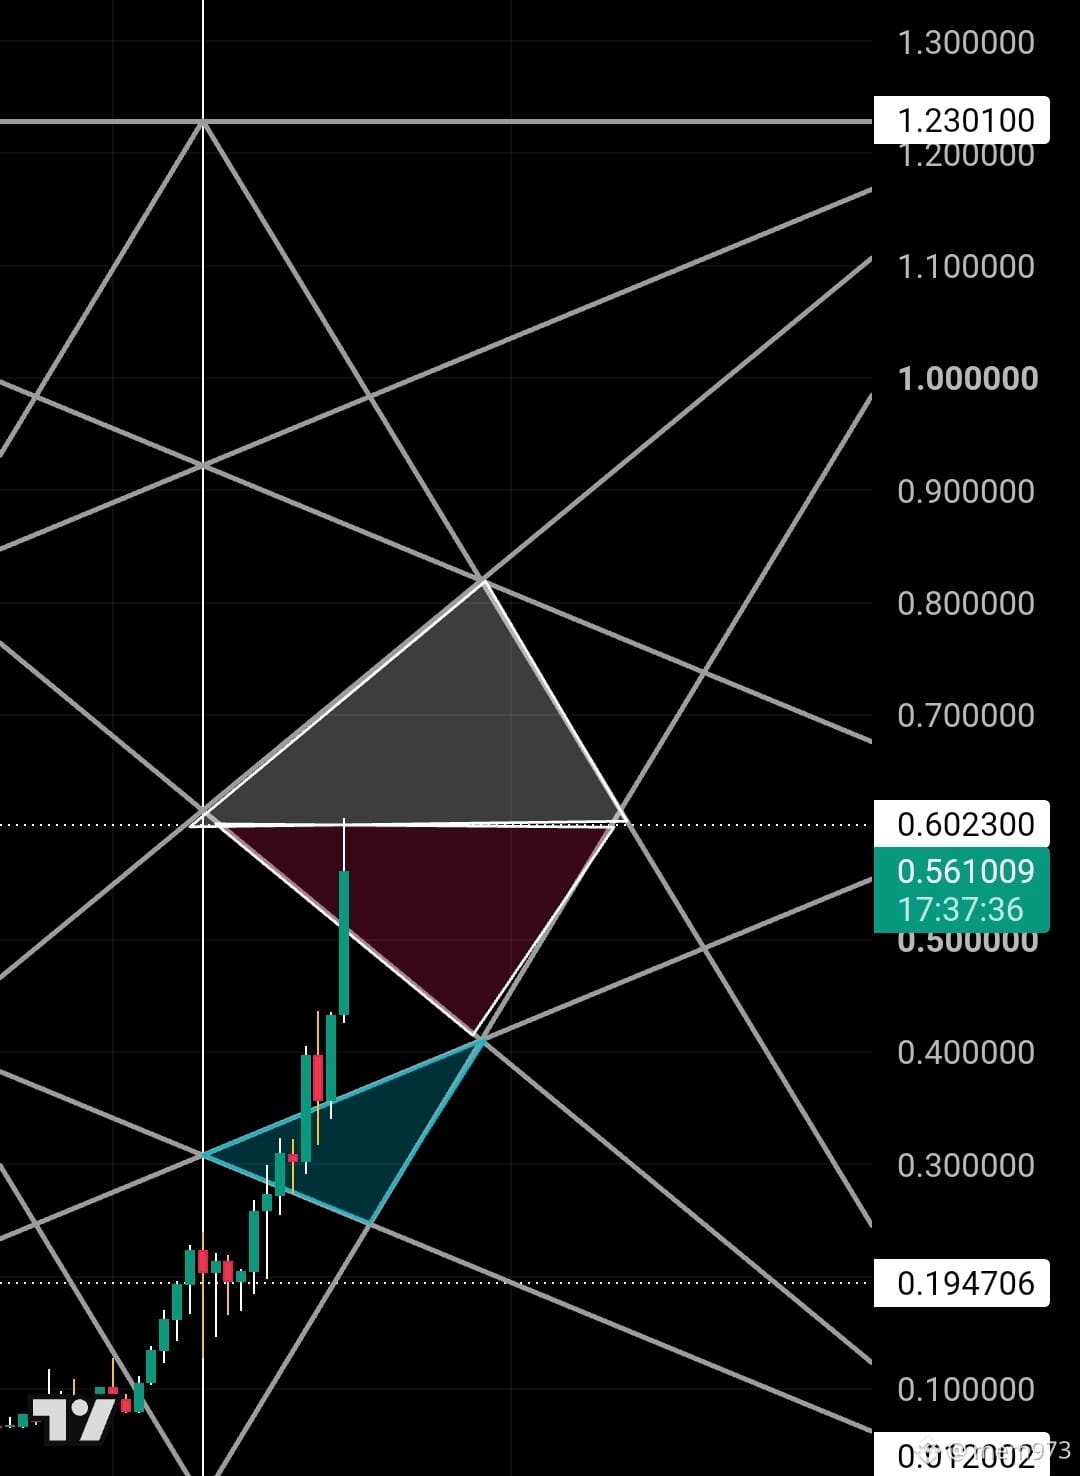
And indeed its performance $BTW #BTWUSDT⚡️ brought the target, the second one at 0.61 angle 120, and I was explaining that the coin would correct at price 0.29 to 0.28, but the coin stopped at correcting at 0.315.
And it rebounded from the second target with a strong candle, and this is the middle of the geometric shape.
I expect the deep correction from the red triangle zone going down to 0.49,
or the rise and rebound from the upper 1:2 trend to calm the speed and break 0=61,
or the rise until it hits 157 degrees at the end of the polygon at a price of 0.96, and the deep correction from there.
All of this will be determined by the close of a candle for 3 days or a week above or below the level 0.61.
Good luck,
·
--
And indeed its performance $BTW #BTWUSDT⚡️ brought the target, the second one at 0.61 angle 120, and I was explaining that the coin would correct at price 0.29 to 0.28, but the coin stopped at correcting at 0.315. And it rebounded from the second target with a strong candle, and this is the middle of the geometric shape. I expect the deep correction from the red triangle zone going down to 0.49, or the rise and rebound from the upper 1:2 trend to calm the speed and break 0=61, or the rise until it hits 157 degrees at the end of the polygon at a price of 0.96, and the deep correction from there. All of this will be determined by the close of a candle for 3 days or a week above or below the level 0.61. Good luck,
And indeed its performance $BTW #BTWUSDT⚡️ brought the target, the second one at 0.61 angle 120, and I was explaining that the coin would correct at price 0.29 to 0.28, but the coin stopped at correcting at 0.315.
And it rebounded from the second target with a strong candle, and this is the middle of the geometric shape.
I expect the deep correction from the red triangle zone going down to 0.49,
or the rise and rebound from the upper 1:2 trend to calm the speed and break 0=61,
or the rise until it hits 157 degrees at the end of the polygon at a price of 0.96, and the deep correction from there.
All of this will be determined by the close of a candle for 3 days or a week above or below the level 0.61.
Good luck,
MEM973
·
--
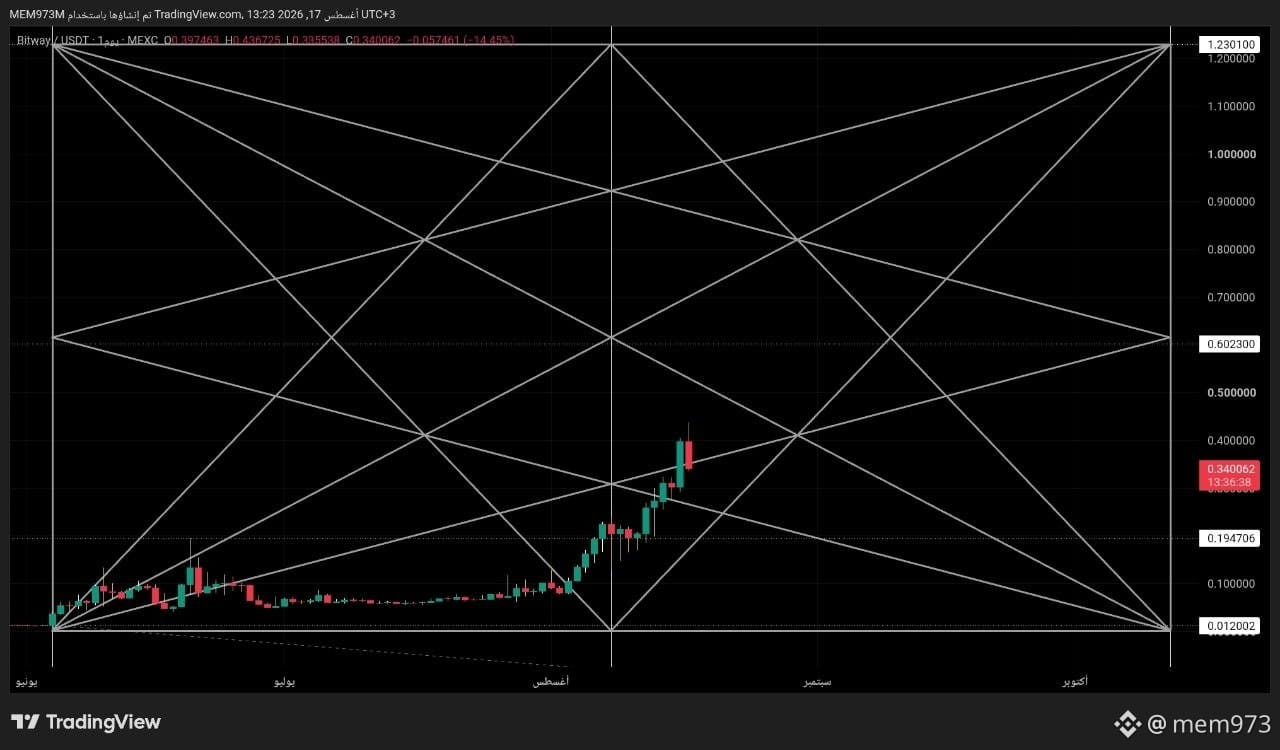
Analysis of trade $BTW #btwusdt using time analysis
The deal began forming the cluster with the letter N, and in line with the time interval it started from a price of 0.012 up to 0.19 at an angle of 60
The coin/asset took on a three-dimensional geometric shape
Second target 0.61 at an angle of 120
Final target 1.23 at an angle of 180
The asset has selling pressure, due to resistance 0.41 at the bottom of the crystal
Midpoint of the geometric shape: at an angle of 90 at a price of 0.37
Midpoint of the geometric shape roughly standardizes at 0.61 at an angle of 120
The geometric shape is supposed to end at an angle of 180, but it’s possible the asset breaks/extends with a larger displacement and completes a full cycle of 360, which would be at 4.4—and I don’t rule out it being an Alpha wave/coin
The important part is that the asset should complete its correction at 0.29–0.28
Angle 72
I analyzed it only because I saw that some people were getting a bad result due to the coin’s death/death move and because of the risky nature of the futures
Good luck
·
--
Analysis of trade $BTW #btwusdt using time analysis The deal began forming the cluster with the letter N, and in line with the time interval it started from a price of 0.012 up to 0.19 at an angle of 60 The coin/asset took on a three-dimensional geometric shape Second target 0.61 at an angle of 120 Final target 1.23 at an angle of 180 The asset has selling pressure, due to resistance 0.41 at the bottom of the crystal Midpoint of the geometric shape: at an angle of 90 at a price of 0.37 Midpoint of the geometric shape roughly standardizes at 0.61 at an angle of 120 The geometric shape is supposed to end at an angle of 180, but it’s possible the asset breaks/extends with a larger displacement and completes a full cycle of 360, which would be at 4.4—and I don’t rule out it being an Alpha wave/coin The important part is that the asset should complete its correction at 0.29–0.28 Angle 72 I analyzed it only because I saw that some people were getting a bad result due to the coin’s death/death move and because of the risky nature of the futures Good luck
Analysis of trade $BTW #btwusdt using time analysis
The deal began forming the cluster with the letter N, and in line with the time interval it started from a price of 0.012 up to 0.19 at an angle of 60
The coin/asset took on a three-dimensional geometric shape
Second target 0.61 at an angle of 120
Final target 1.23 at an angle of 180
The asset has selling pressure, due to resistance 0.41 at the bottom of the crystal
Midpoint of the geometric shape: at an angle of 90 at a price of 0.37
Midpoint of the geometric shape roughly standardizes at 0.61 at an angle of 120
The geometric shape is supposed to end at an angle of 180, but it’s possible the asset breaks/extends with a larger displacement and completes a full cycle of 360, which would be at 4.4—and I don’t rule out it being an Alpha wave/coin
The important part is that the asset should complete its correction at 0.29–0.28
Angle 72
I analyzed it only because I saw that some people were getting a bad result due to the coin’s death/death move and because of the risky nature of the futures
Good luck

·
--
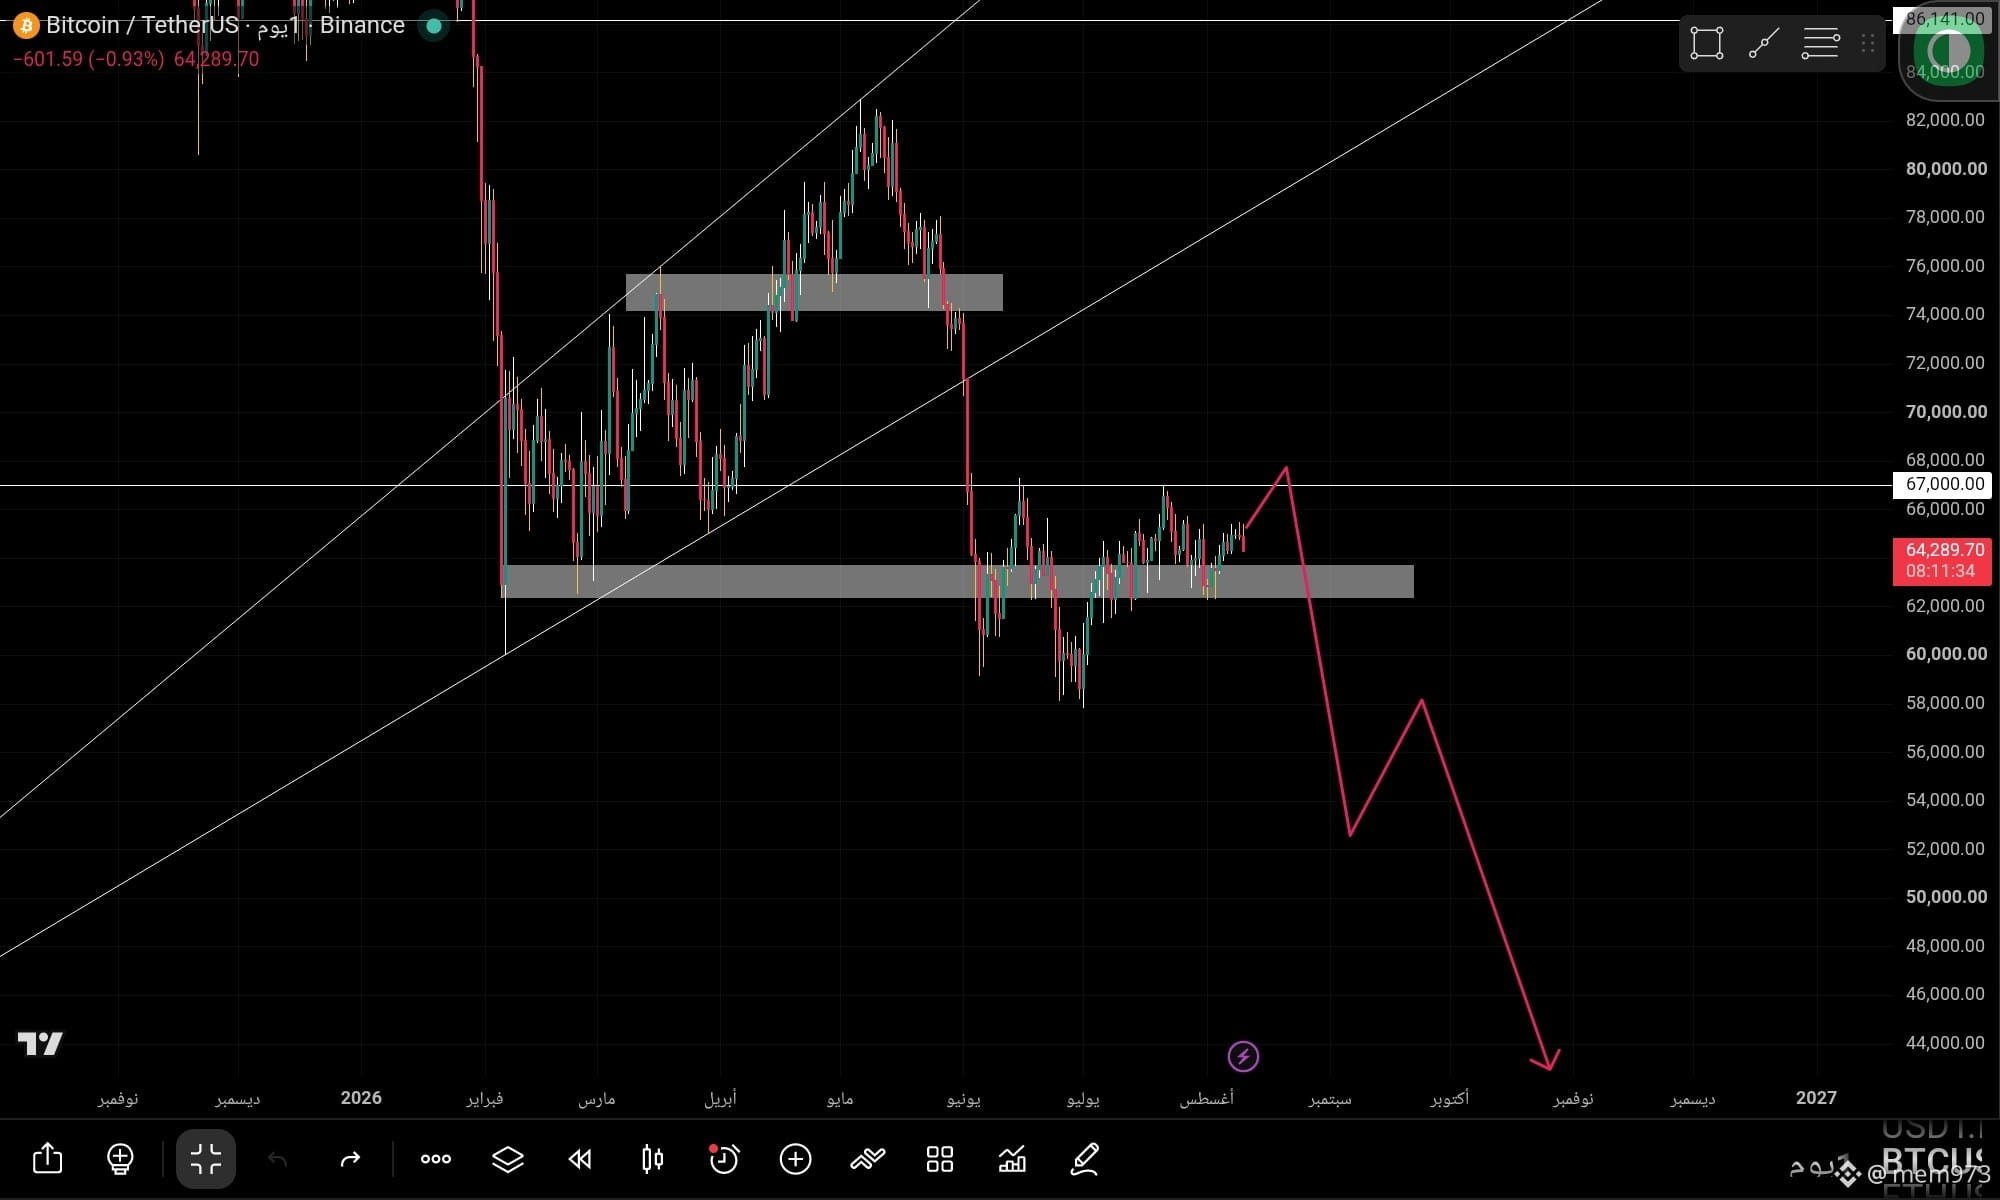
Update of Bitcoin #btc / The rise illusion is a trap you’ll fall into I believe that Bitcoin $BTC #BTCUSDT in order to determine its fate must rise Whether the scenario is positive or negative For the positive scenario, it must break the 68k level, then break 71,500, and I believe this scenario is weak For the negative scenario, it must rise to the 67,500–68,000 level To fool traders by rising then returning to fall And activate the maximum selling pressure by breaking 57k so its targets become 50k and 43k And I believe the negative scenario will succeed with a large probability Don’t forget to follow and hit like
Update of Bitcoin #btc / The rise illusion is a trap you’ll fall into
I believe that Bitcoin $BTC #BTCUSDT in order to determine its fate must rise
Whether the scenario is positive or negative
For the positive scenario, it must break the 68k level, then break 71,500, and I believe this scenario is weak
For the negative scenario, it must rise to the 67,500–68,000 level
To fool traders by rising then returning to fall
And activate the maximum selling pressure by breaking 57k so its targets become 50k and 43k
And I believe the negative scenario will succeed with a large probability
Don’t forget to follow and hit like
·
--
Bitcoin BTC Update / Bitcoin is preparing for a major crash and expected strategic selling and Binance’s collapse soonBitcoin As I explained in the previous update, it won’t return to positivity. I also explained that it forms a bearish pattern on smaller timeframes, so the 68k level will not be broken and then return to bearishness. And this is what happened already. The new current movement is very negative such that every time it confirms the collapse, and it does collapse, its rebound movement comes from the support area at 60k. It also did a retest to confirm the drop. And this is the same movement as October 10th, when the collapse from 97k occurred from January 14th to February 6th, and in late May.

Bitcoin BTC Update / Bitcoin is preparing for a major crash and expected strategic selling and Binance’s collapse soon

Bitcoin
As I explained in the previous update, it won’t return to positivity. I also explained that it forms a bearish pattern on smaller timeframes, so the 68k level will not be broken and then return to bearishness. And this is what happened already.
The new current movement is very negative such that every time it confirms the collapse, and it does collapse, its rebound movement comes from the support area at 60k. It also did a retest to confirm the drop. And this is the same movement as October 10th, when the collapse from 97k occurred from January 14th to February 6th, and in late May.
BTC-3.90%
MSTRUS-0.66%
·
--
Bitcoin Status Update #BTC I believe Bitcoin isn't going to change the overall bearish trend, and that the climb will continue to the $68k level. If we break through $68k with strong momentum, the rise will continue towards resistance at $71,500. However, I'm ruling out that scenario since I anticipate a correction from the $68k level, followed by a retest to attempt breaking $68k again, and then forming a bearish pattern to continue the downtrend #BTC
Bitcoin Status Update #BTC
I believe Bitcoin isn't going to change the overall bearish trend, and that the climb will continue to the $68k level. If we break through $68k with strong momentum, the rise will continue towards resistance at $71,500. However, I'm ruling out that scenario since I anticipate a correction from the $68k level, followed by a retest to attempt breaking $68k again, and then forming a bearish pattern to continue the downtrend #BTC
Log in to explore more content
Join global crypto users on Binance Square
⚡️ Get latest and useful information about crypto.
💬 Trusted by the world’s largest crypto exchange.
👍 Discover real insights from verified creators.
Email / Phone number
Sitemap
Cookie Preferences
Platform T&Cs