

Mek
994 Posts

Mek
Report
Block User
Trader Institutional, Entrepreneuer & Analyst since 2018 · Binance KOL & BNBChain Martian. Building at Web3 and Sovereign Infrastructure. X/Twitter: @mektrader_
High-Frequency Trader
5.4 Years
45 Following
2.9K+ Followers
1.8K+ Liked
Posts
All
Quotes
Videos
Live
·
--
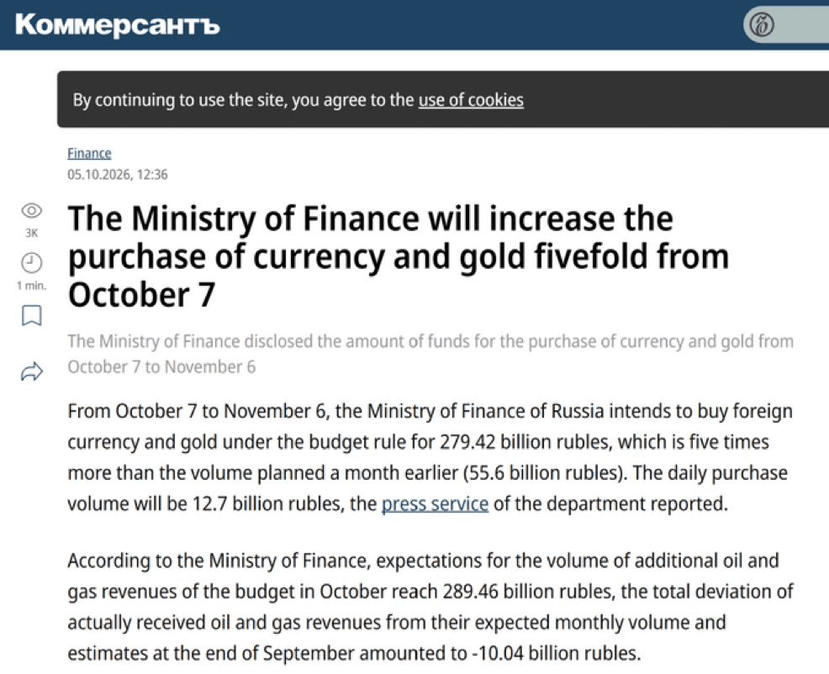
Russia will increase its purchases of foreign currency and gold fivefold starting today. 🇷🇺
That’s 279.42 billion rubles in a month, compared with 55.6 billion last month. About 12.7 billion a day.
A country with falling commodity revenues turning to gold is the oldest sign there is of distrust in its own currency.
Another central bank seeking protection?
Seems like it’s only a matter of time before they move to the digital version.
Russia will increase its purchases of foreign currency and gold fivefold starting today. 🇷🇺
That’s 279.42 billion rubles in a month, compared with 55.6 billion last month. About 12.7 billion a day.
A country with falling commodity revenues turning to gold is the oldest sign there is of distrust in its own currency.
Another central bank seeking protection?
Seems like it’s only a matter of time before they move to the digital version.
That’s 279.42 billion rubles in a month, compared with 55.6 billion last month. About 12.7 billion a day.
A country with falling commodity revenues turning to gold is the oldest sign there is of distrust in its own currency.
Another central bank seeking protection?
Seems like it’s only a matter of time before they move to the digital version.
215
·
--
🎙️ Institutional Live Trading - Crypto, Stocks, and Macroeconomics! (PT/BR)

End
01 h 31 m 21 s
83
APTUSDT
Perp
Market/Long
1
0
·
--
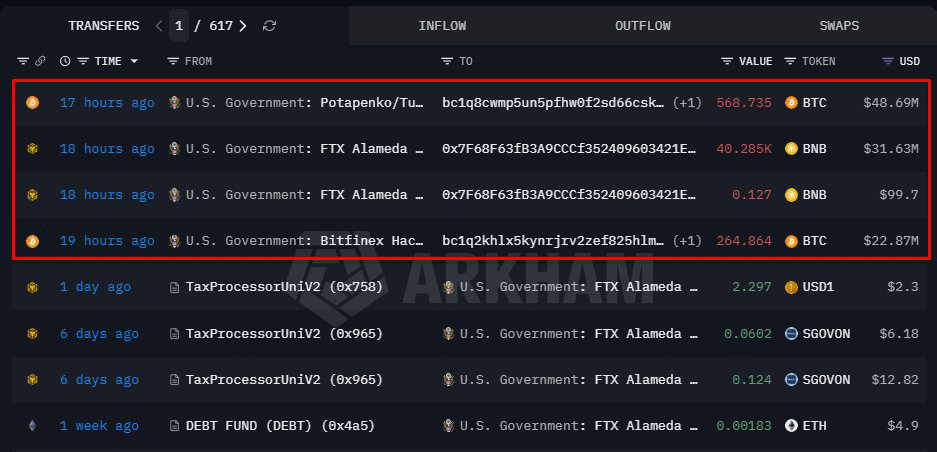
U.S. government SELLING Bitcoin? 👀
The U.S. government moved another 834 BTC today, worth around US$ 71,56 million, to Coinbase Prime.
Alongside that, 40,285 BNB were moved, worth another US$ 31,63 million.
The funds in these wallets come from seizures linked to FTX, Alameda, and Bitfinex.
U.S. government SELLING Bitcoin? 👀
The U.S. government moved another 834 BTC today, worth around US$ 71,56 million, to Coinbase Prime.
Alongside that, 40,285 BNB were moved, worth another US$ 31,63 million.
The funds in these wallets come from seizures linked to FTX, Alameda, and Bitfinex.
The U.S. government moved another 834 BTC today, worth around US$ 71,56 million, to Coinbase Prime.
Alongside that, 40,285 BNB were moved, worth another US$ 31,63 million.
The funds in these wallets come from seizures linked to FTX, Alameda, and Bitfinex.
1
594
·
--
Bullish
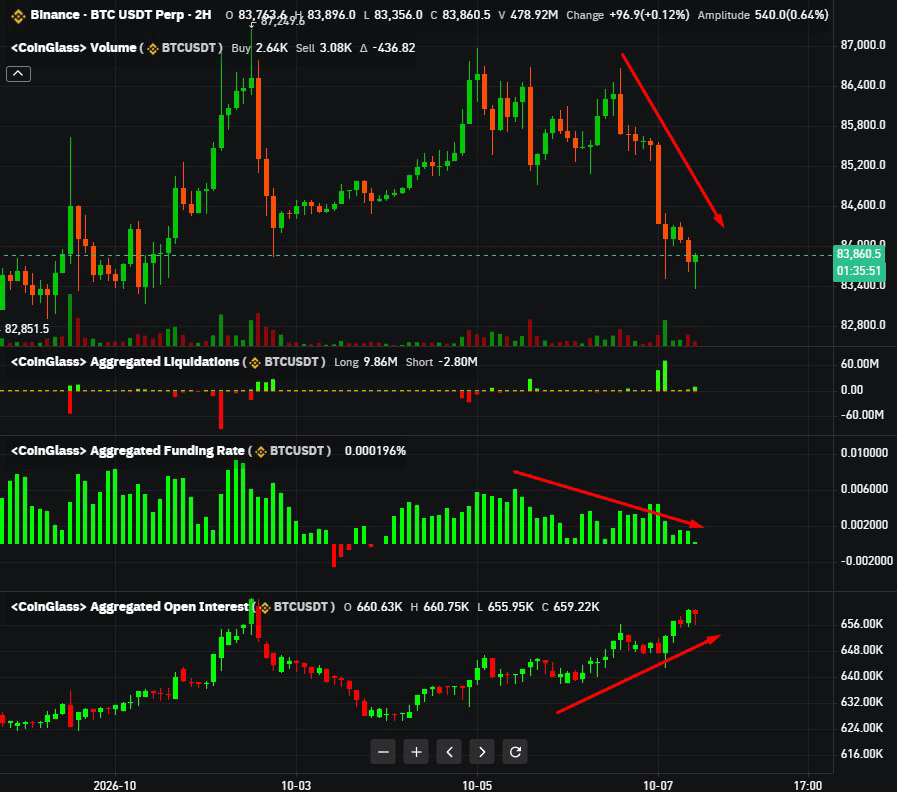
SELLERS ARE PILING INTO BITCOIN 🚨
The recent correction in BTC has brought more short positions into the futures market, with an increase in leveraged orders reflected in rising OI.
These positions could lead to short dominance if the funding rate for perpetual contracts turns negative.
A typical pattern of directional leverage built during the decline (urgency), not beforehand.
This move generally creates pockets of liquidation liquidity above the current price, leading to high volatility as these traders are caught out.
It looks like we could see another flush of leveraged positions and a short squeeze soon.
{future}(BTCUSDT)
SELLERS ARE PILING INTO BITCOIN 🚨
The recent correction in BTC has brought more short positions into the futures market, with an increase in leveraged orders reflected in rising OI.
These positions could lead to short dominance if the funding rate for perpetual contracts turns negative.
A typical pattern of directional leverage built during the decline (urgency), not beforehand.
This move generally creates pockets of liquidation liquidity above the current price, leading to high volatility as these traders are caught out.
It looks like we could see another flush of leveraged positions and a short squeeze soon.
The recent correction in BTC has brought more short positions into the futures market, with an increase in leveraged orders reflected in rising OI.
These positions could lead to short dominance if the funding rate for perpetual contracts turns negative.
A typical pattern of directional leverage built during the decline (urgency), not beforehand.
This move generally creates pockets of liquidation liquidity above the current price, leading to high volatility as these traders are caught out.
It looks like we could see another flush of leveraged positions and a short squeeze soon.
1
115
·
--
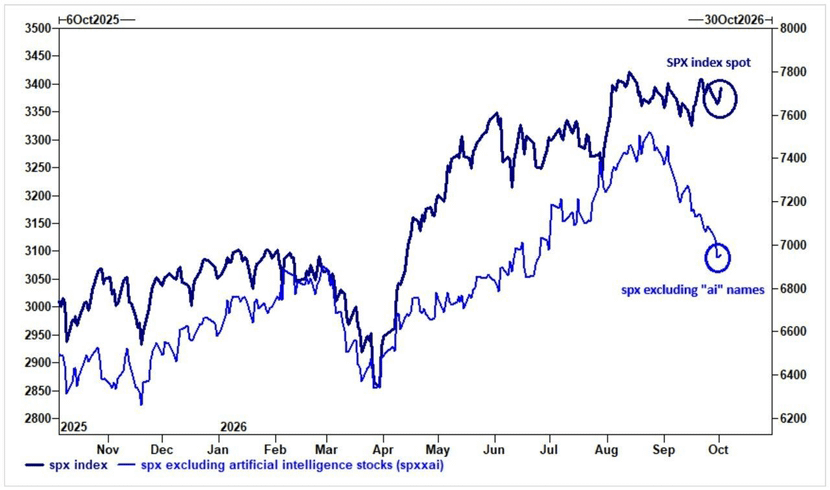
AI is what’s driving the S&P 500 higher.
The index is hovering near its all-time high, but the version without AI companies has fallen about 7% since its late-August peak.
It’s the same stock market, with two different realities.
What could go wrong? 👀
AI is what’s driving the S&P 500 higher.
The index is hovering near its all-time high, but the version without AI companies has fallen about 7% since its late-August peak.
It’s the same stock market, with two different realities.
What could go wrong? 👀
The index is hovering near its all-time high, but the version without AI companies has fallen about 7% since its late-August peak.
It’s the same stock market, with two different realities.
What could go wrong? 👀
1
110
·
--
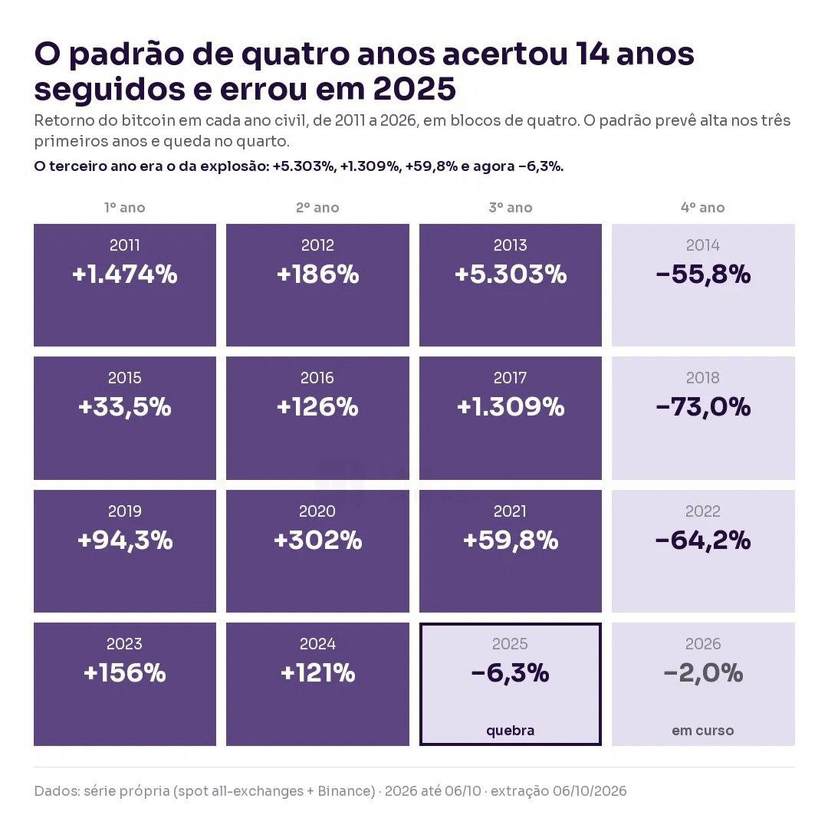
Bitcoin's four-year cycle was right for 14 years straight and seems to have broken in 2025. 🤯
The third year was always the explosive one: +5,303% in 2013, +1,309% in 2017, +59.8% in 2021.
In 2025, that year ended at -6.3%.
And 2026, which by the pattern should be a down year, is at -2.0%, with prices rising over the past three months.
How long until people admit the cycle has “changed”?
Bitcoin's four-year cycle was right for 14 years straight and seems to have broken in 2025. 🤯
The third year was always the explosive one: +5,303% in 2013, +1,309% in 2017, +59.8% in 2021.
In 2025, that year ended at -6.3%.
And 2026, which by the pattern should be a down year, is at -2.0%, with prices rising over the past three months.
How long until people admit the cycle has “changed”?
The third year was always the explosive one: +5,303% in 2013, +1,309% in 2017, +59.8% in 2021.
In 2025, that year ended at -6.3%.
And 2026, which by the pattern should be a down year, is at -2.0%, with prices rising over the past three months.
How long until people admit the cycle has “changed”?
5
2
2.9k
·
--
🎙️ Institutional Trading - Crypto, Stocks and Macroeconomics (PT/BR)

End
01 h 16 m 11 s
76
1
0
·
--
Verified
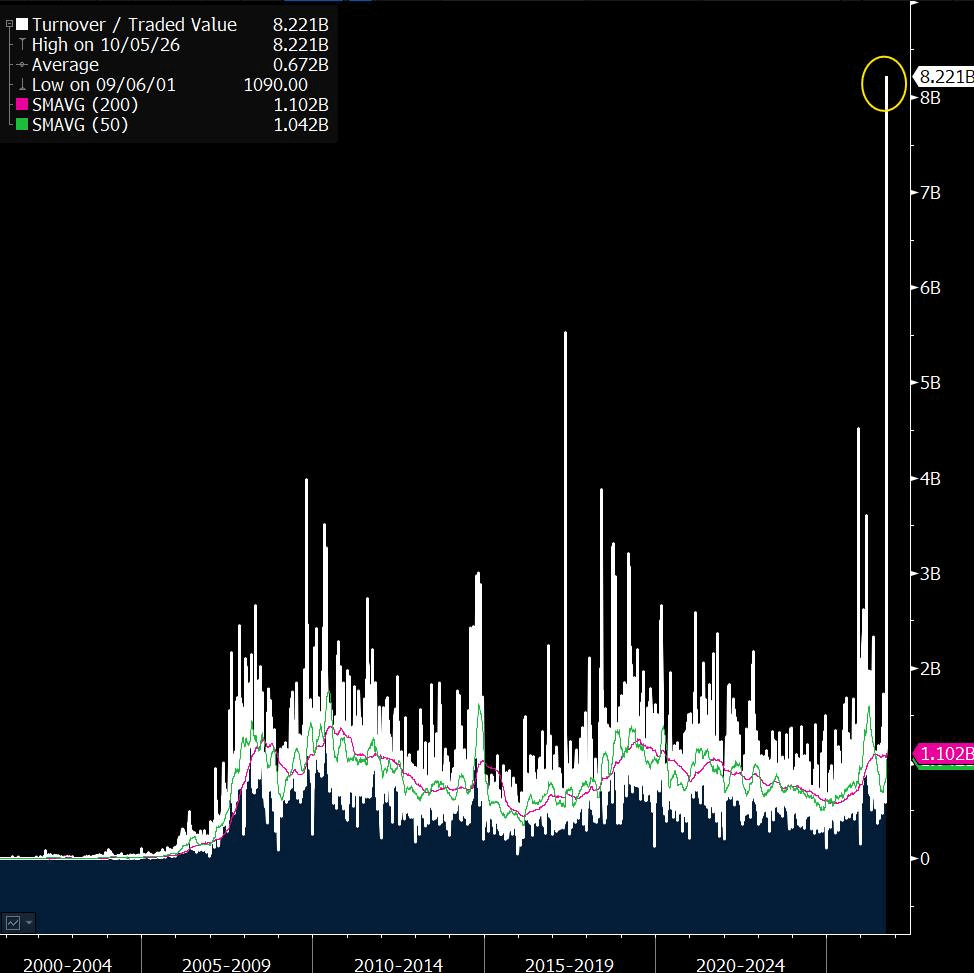
Brazil received +US$ 700 million in a single day in the largest Brazilian equity fund traded abroad.
It was the largest single-day inflow in the 25-year history of $EWZ.
Trading volume that day was US$ 8.2 billion, an all-time record since its launch.
It ranked third among all U.S. ETFs that day, behind only those tracking the S&P 500 and the Nasdaq.
An emerging-market country fund trading more than almost anything else in the U.S. market.
What are foreign investors seeing that’s making them interested in buying Brazil?
Brazil received +US$ 700 million in a single day in the largest Brazilian equity fund traded abroad.
It was the largest single-day inflow in the 25-year history of $EWZ.
Trading volume that day was US$ 8.2 billion, an all-time record since its launch.
It ranked third among all U.S. ETFs that day, behind only those tracking the S&P 500 and the Nasdaq.
An emerging-market country fund trading more than almost anything else in the U.S. market.
What are foreign investors seeing that’s making them interested in buying Brazil?
It was the largest single-day inflow in the 25-year history of $EWZ.
Trading volume that day was US$ 8.2 billion, an all-time record since its launch.
It ranked third among all U.S. ETFs that day, behind only those tracking the S&P 500 and the Nasdaq.
An emerging-market country fund trading more than almost anything else in the U.S. market.
What are foreign investors seeing that’s making them interested in buying Brazil?
2
1.1k
·
--
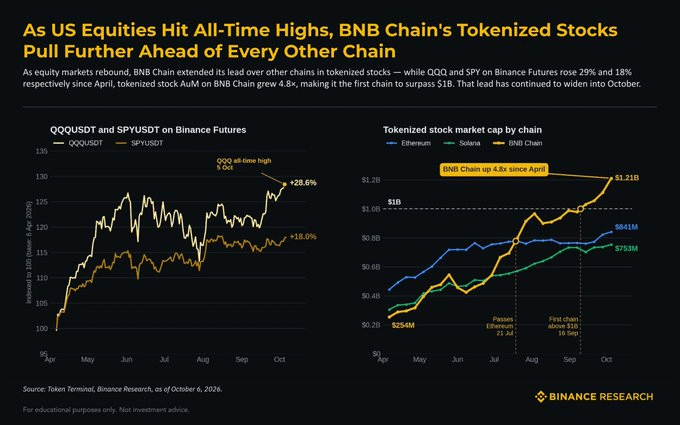
U.S. stocks just hit a record. Tokenized stocks on BNB Chain hit an even bigger one.
Since April, QQQ has risen 29%. The market cap of tokenized stocks on BNB Chain has risen 4.8x to US$$ 1.21 billion, making it the first chain to surpass US$$ 1 billion, and its lead is still growing.
Source: Binance Research
{spot}(BNBUSDT)
U.S. stocks just hit a record. Tokenized stocks on BNB Chain hit an even bigger one.
Since April, QQQ has risen 29%. The market cap of tokenized stocks on BNB Chain has risen 4.8x to US$$ 1.21 billion, making it the first chain to surpass US$$ 1 billion, and its lead is still growing.
Source: Binance Research
Since April, QQQ has risen 29%. The market cap of tokenized stocks on BNB Chain has risen 4.8x to US$$ 1.21 billion, making it the first chain to surpass US$$ 1 billion, and its lead is still growing.
Source: Binance Research
1
113
·
--
Partly True
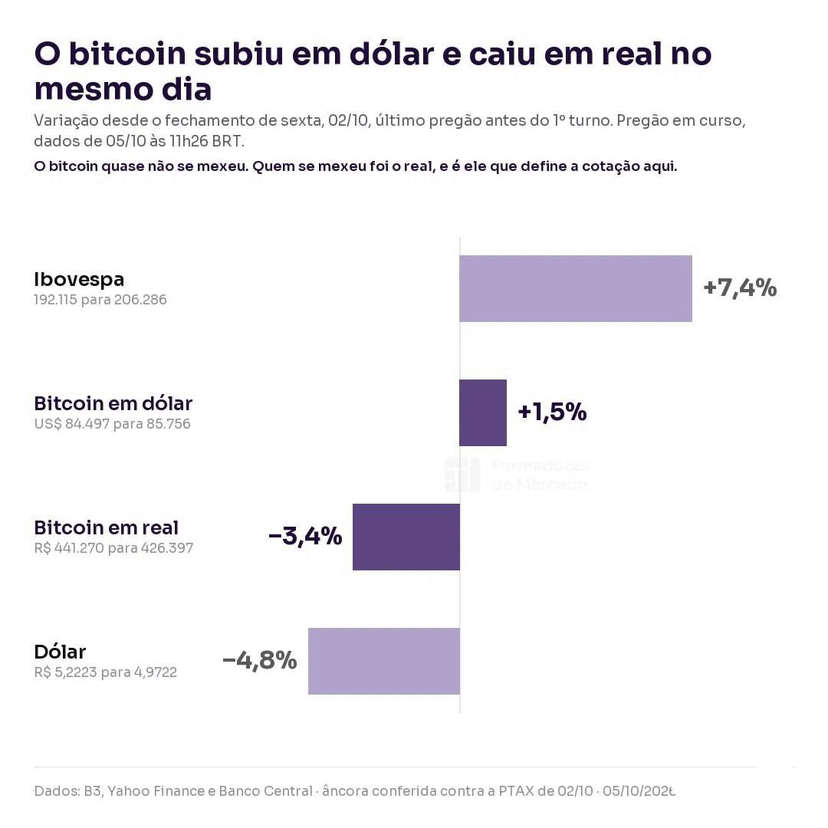
Bitcoin rose 1.5% and fell 3.4% on the same day. It depends on which currency you use to look at it.🤯
In dollars, it went from US$ 84.497 to US$ 85.756. In reais, it fell from R$ 441.270 to R$ 426.397.
Bitcoin barely moved. The real did, with the dollar falling 4.8%, from R$ 5,2223 to R$ 4,9722.
And the Ibovespa rose 7.4%.
Now think about what really changed between Friday and Monday.
Brazil's gross debt is the same. The primary deficit is the same. The government's interest bill, which is R$ 50 billion away from becoming the country's largest expense, is exactly the same.
Not a single figure in the real economy changed.
What changed was expectations about who will manage these numbers starting in January.
Are you trading real data or just expectations?
Does your wealth depend on "hope"?
Bitcoin rose 1.5% and fell 3.4% on the same day. It depends on which currency you use to look at it.🤯
In dollars, it went from US$ 84.497 to US$ 85.756. In reais, it fell from R$ 441.270 to R$ 426.397.
Bitcoin barely moved. The real did, with the dollar falling 4.8%, from R$ 5,2223 to R$ 4,9722.
And the Ibovespa rose 7.4%.
Now think about what really changed between Friday and Monday.
Brazil's gross debt is the same. The primary deficit is the same. The government's interest bill, which is R$ 50 billion away from becoming the country's largest expense, is exactly the same.
Not a single figure in the real economy changed.
What changed was expectations about who will manage these numbers starting in January.
Are you trading real data or just expectations?
Does your wealth depend on "hope"?
In dollars, it went from US$ 84.497 to US$ 85.756. In reais, it fell from R$ 441.270 to R$ 426.397.
Bitcoin barely moved. The real did, with the dollar falling 4.8%, from R$ 5,2223 to R$ 4,9722.
And the Ibovespa rose 7.4%.
Now think about what really changed between Friday and Monday.
Brazil's gross debt is the same. The primary deficit is the same. The government's interest bill, which is R$ 50 billion away from becoming the country's largest expense, is exactly the same.
Not a single figure in the real economy changed.
What changed was expectations about who will manage these numbers starting in January.
Are you trading real data or just expectations?
Does your wealth depend on "hope"?
1
1.1k
·
--
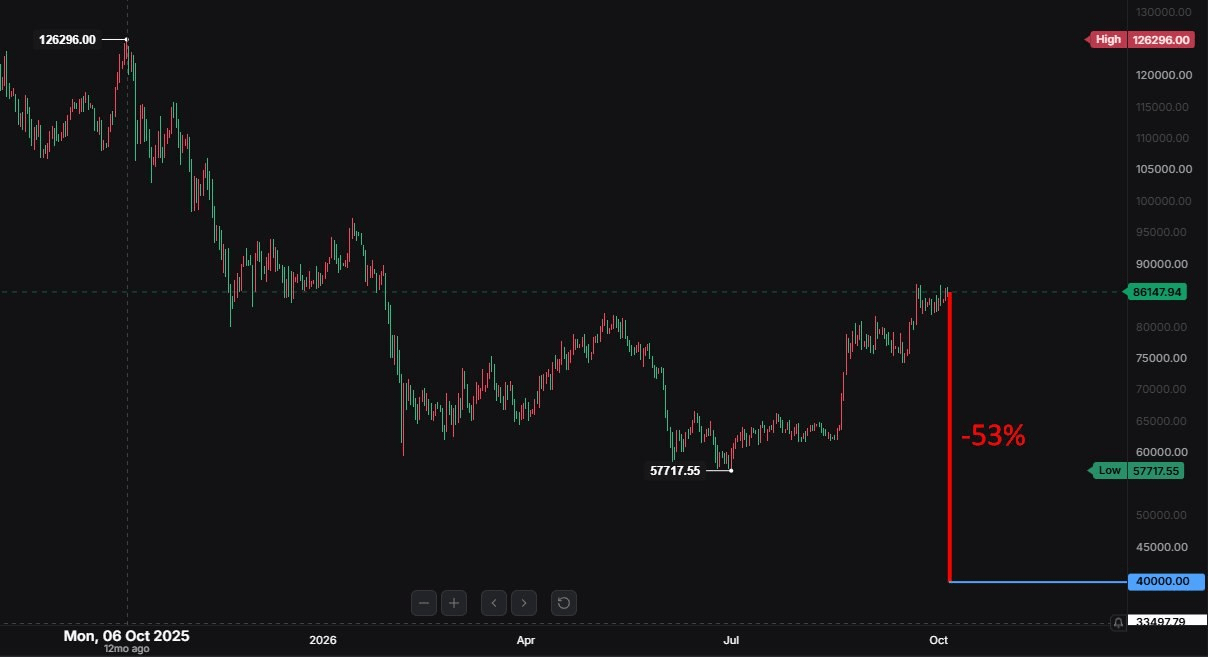
Tomorrow marks 365 days since Bitcoin’s market top.
The good news is you can wait for a -53% DOWN candle to buy the bear market bottom at $40k.
In fact, -54% was the TOTAL drop over 365 days, so now you just need to hope it repeats all of that in 24 hours.
The bad news is you’ll probably be hallucinating. 🤪
Tomorrow marks 365 days since Bitcoin’s market top.
The good news is you can wait for a -53% DOWN candle to buy the bear market bottom at $40k.
In fact, -54% was the TOTAL drop over 365 days, so now you just need to hope it repeats all of that in 24 hours.
The bad news is you’ll probably be hallucinating. 🤪
The good news is you can wait for a -53% DOWN candle to buy the bear market bottom at $40k.
In fact, -54% was the TOTAL drop over 365 days, so now you just need to hope it repeats all of that in 24 hours.
The bad news is you’ll probably be hallucinating. 🤪
1
9
5.2k
·
--
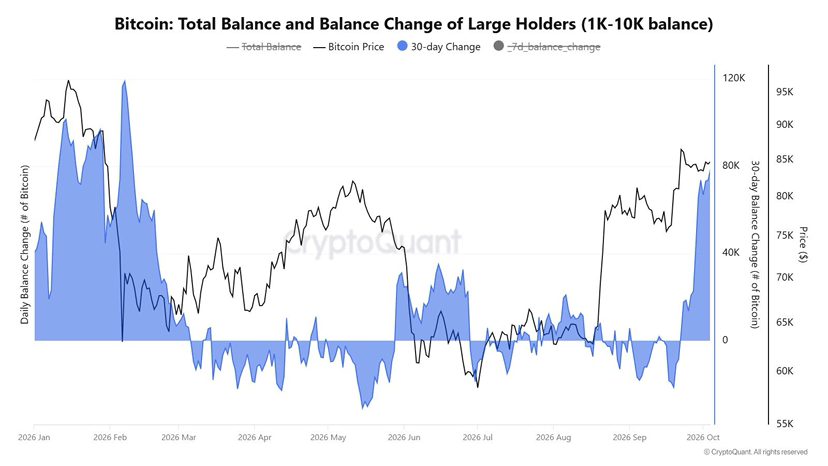
Bitcoin whales accumulated 78,000 BTC in 30 days. 🔥
That’s nearly $7 billion flowing into these reserves.
It’s the biggest accumulation since February, when these players bought the entire dip down to $60k.
Retail panics, whales accumulate.
But it’s probably nothing.
Bitcoin whales accumulated 78,000 BTC in 30 days. 🔥
That’s nearly $7 billion flowing into these reserves.
It’s the biggest accumulation since February, when these players bought the entire dip down to $60k.
Retail panics, whales accumulate.
But it’s probably nothing.
That’s nearly $7 billion flowing into these reserves.
It’s the biggest accumulation since February, when these players bought the entire dip down to $60k.
Retail panics, whales accumulate.
But it’s probably nothing.
1
805
·
--
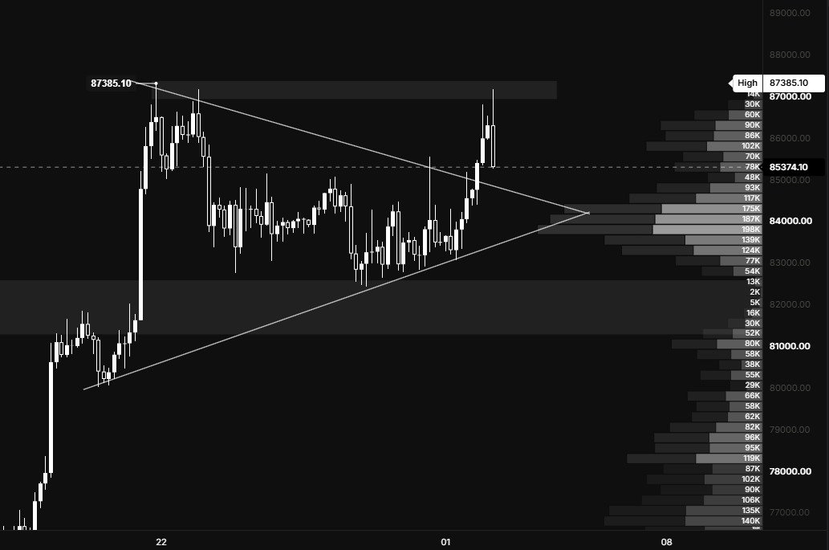
Now things start to get more interesting.
Especially with the entry of long positions seeking a "clear breakout".
And this is a type of pattern that appears at the beginning of volatility expansion phases in bitcoin.
Would low order book depth on the weekends be the ground for such a push?
Now things start to get more interesting.
Especially with the entry of long positions seeking a "clear breakout".
And this is a type of pattern that appears at the beginning of volatility expansion phases in bitcoin.
Would low order book depth on the weekends be the ground for such a push?
Especially with the entry of long positions seeking a "clear breakout".
And this is a type of pattern that appears at the beginning of volatility expansion phases in bitcoin.
Would low order book depth on the weekends be the ground for such a push?
4
620
·
--
🎙️ Live Trading Institucional - Payroll, Crypto, Stocks

End
01 h 17 m 39 s
129
2ZUSDT
Perp
Market/Long
1
0
·
--
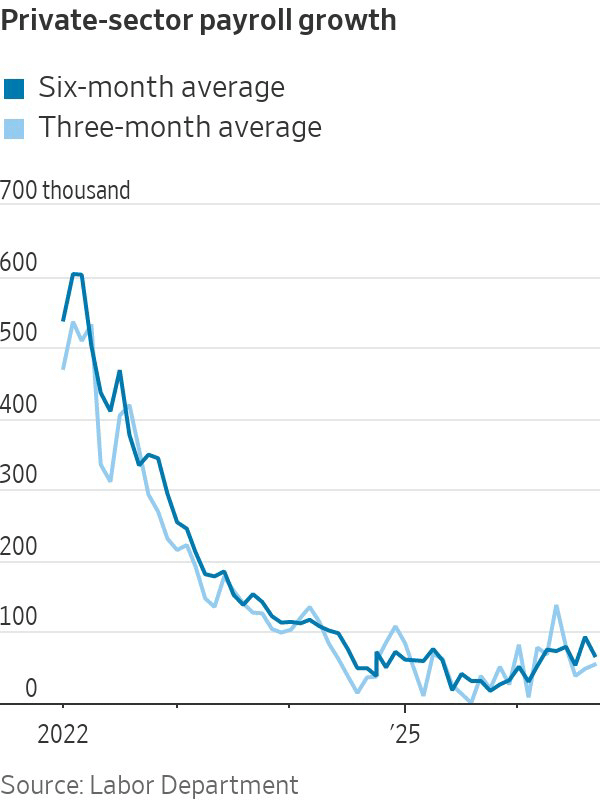
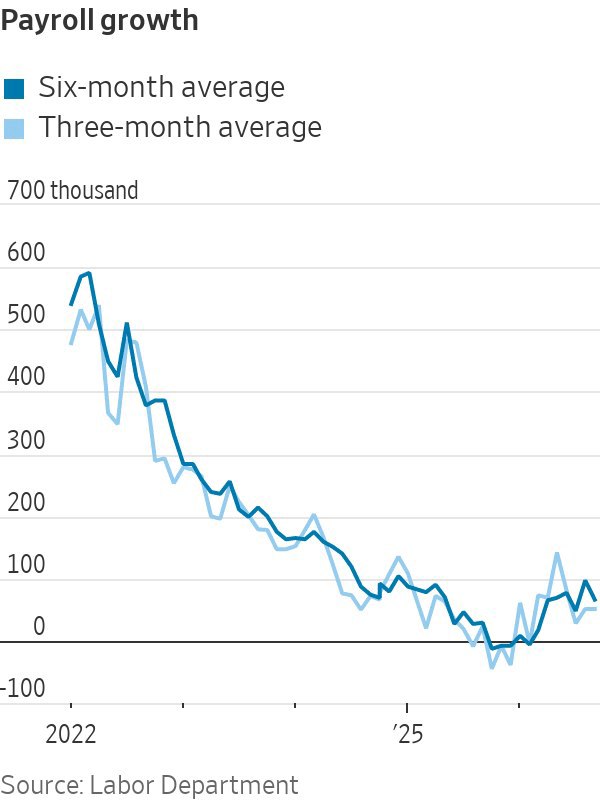
The U.S. payroll for September came in at 29K, versus 84K expected. 🚨
Unemployment rose to 4.2%.
And the revisions are worse than today’s number.
August fell from 162K to 133K. July was revised to -10K.
The three-month average, which was showing 71K, is now at 51K.
The private sector added 46K and the government cut 17K.
Wages also slowed: 0.13% month-over-month and 3.02% over twelve months.
Together with Wednesday’s PCE, which came in below expectations at both ends, the Fed tightened in September based on a labor market that was already weaker than the data suggested at the time.
The chance of holding interest rates STEPS UP TO 82%.
No surprises for anyone following along here, but there are still a lot of people disregarding data and ending up "not knowing what’s going on."
The U.S. payroll for September came in at 29K, versus 84K expected. 🚨
Unemployment rose to 4.2%.
And the revisions are worse than today’s number.
August fell from 162K to 133K. July was revised to -10K.
The three-month average, which was showing 71K, is now at 51K.
The private sector added 46K and the government cut 17K.
Wages also slowed: 0.13% month-over-month and 3.02% over twelve months.
Together with Wednesday’s PCE, which came in below expectations at both ends, the Fed tightened in September based on a labor market that was already weaker than the data suggested at the time.
The chance of holding interest rates STEPS UP TO 82%.
No surprises for anyone following along here, but there are still a lot of people disregarding data and ending up "not knowing what’s going on."
Unemployment rose to 4.2%.
And the revisions are worse than today’s number.
August fell from 162K to 133K. July was revised to -10K.
The three-month average, which was showing 71K, is now at 51K.
The private sector added 46K and the government cut 17K.
Wages also slowed: 0.13% month-over-month and 3.02% over twelve months.
Together with Wednesday’s PCE, which came in below expectations at both ends, the Fed tightened in September based on a labor market that was already weaker than the data suggested at the time.
The chance of holding interest rates STEPS UP TO 82%.
No surprises for anyone following along here, but there are still a lot of people disregarding data and ending up "not knowing what’s going on."
1
255
·
--
So basically the US Central Bank is publishing optimistic papers with Stablecoins 🔥
And you still wonder if this is here to stay?
The Fed in San Francisco published a study showing that stablecoin issuers have become relevant buyers of US debt.
The positions in Treasuries held by these issuers have grown by more than US$ 200 billion over five years.
And the study is explicit about the function: this helped offset the decline in demand from foreign governments.
With even more emphasis on China’s reduction since the end of the 2000s.
The projection is to reach close to US$ 400 billion by the end of 2030.
Five years ago the message was that stablecoins threatened the dollar.
Now it’s a tool that sustains demand for debt while a sovereign buyer steps out.
It’s just a matter of time until the papers about bitcoin arrive too!
So basically the US Central Bank is publishing optimistic papers with Stablecoins 🔥
And you still wonder if this is here to stay?
The Fed in San Francisco published a study showing that stablecoin issuers have become relevant buyers of US debt.
The positions in Treasuries held by these issuers have grown by more than US$ 200 billion over five years.
And the study is explicit about the function: this helped offset the decline in demand from foreign governments.
With even more emphasis on China’s reduction since the end of the 2000s.
The projection is to reach close to US$ 400 billion by the end of 2030.
Five years ago the message was that stablecoins threatened the dollar.
Now it’s a tool that sustains demand for debt while a sovereign buyer steps out.
It’s just a matter of time until the papers about bitcoin arrive too!
And you still wonder if this is here to stay?
The Fed in San Francisco published a study showing that stablecoin issuers have become relevant buyers of US debt.
The positions in Treasuries held by these issuers have grown by more than US$ 200 billion over five years.
And the study is explicit about the function: this helped offset the decline in demand from foreign governments.
With even more emphasis on China’s reduction since the end of the 2000s.
The projection is to reach close to US$ 400 billion by the end of 2030.
Five years ago the message was that stablecoins threatened the dollar.
Now it’s a tool that sustains demand for debt while a sovereign buyer steps out.
It’s just a matter of time until the papers about bitcoin arrive too!

2
336
·
--
BITCOIN MAX LEVELS WITH LEVERAGE COMING IN 🚨
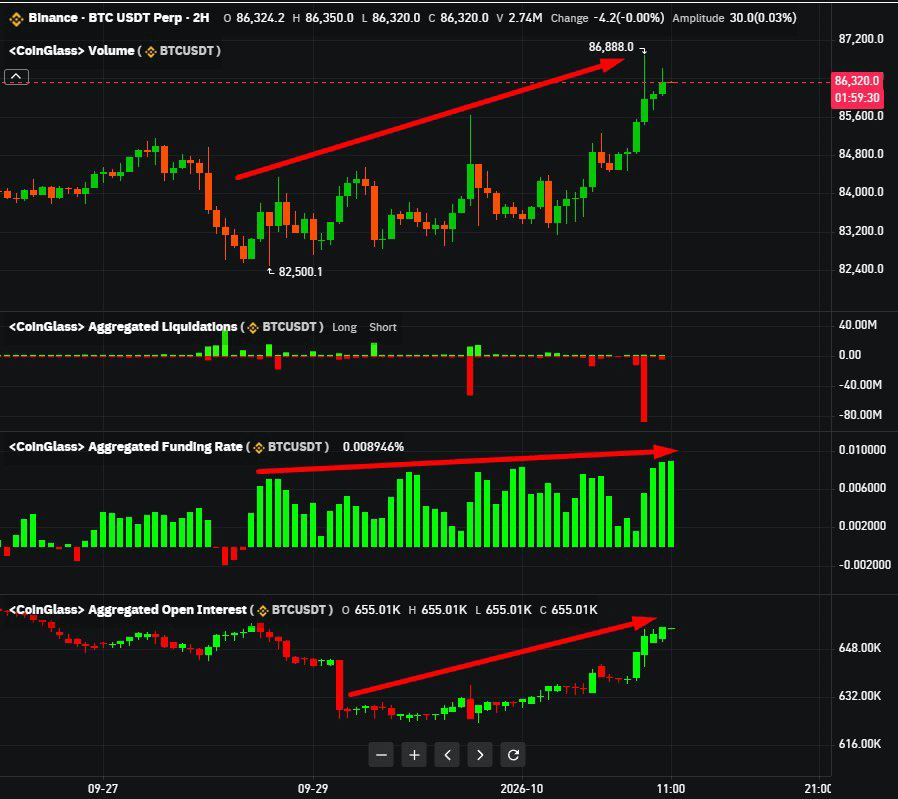
After a hiatus of leveraged positions, the price uptrend we’ve been seeing in the last few hours as we look for September’s highs is starting to show signs of speculative positioning reentry.
Open positions have risen more than 5% in just the last 24 hours while funding has increased.
This indicates the return of long speculative positions on this price rally and could be another catalyst for volatility.
If these positions keep growing, they’ll provide enough liquidity for us to resume tracking liquidation zones here.
In fact, that was the reason you hadn’t seen more of this kind of analysis here. The spot market was leading.
But we may be seeing the return of futures dominance.
And possibly, the liquidity grabs will return too.
BITCOIN MAX LEVELS WITH LEVERAGE COMING IN 🚨
After a hiatus of leveraged positions, the price uptrend we’ve been seeing in the last few hours as we look for September’s highs is starting to show signs of speculative positioning reentry.
Open positions have risen more than 5% in just the last 24 hours while funding has increased.
This indicates the return of long speculative positions on this price rally and could be another catalyst for volatility.
If these positions keep growing, they’ll provide enough liquidity for us to resume tracking liquidation zones here.
In fact, that was the reason you hadn’t seen more of this kind of analysis here. The spot market was leading.
But we may be seeing the return of futures dominance.
And possibly, the liquidity grabs will return too.
After a hiatus of leveraged positions, the price uptrend we’ve been seeing in the last few hours as we look for September’s highs is starting to show signs of speculative positioning reentry.
Open positions have risen more than 5% in just the last 24 hours while funding has increased.
This indicates the return of long speculative positions on this price rally and could be another catalyst for volatility.
If these positions keep growing, they’ll provide enough liquidity for us to resume tracking liquidation zones here.
In fact, that was the reason you hadn’t seen more of this kind of analysis here. The spot market was leading.
But we may be seeing the return of futures dominance.
And possibly, the liquidity grabs will return too.
1
129
·
--
🎙️ Live Trading Institucional - Crypto, Stocks & Macroeconomia

End
01 h 10 m 49 s
119
2
0
·
--
MOVE is shouting VOLATILITY. 🔴
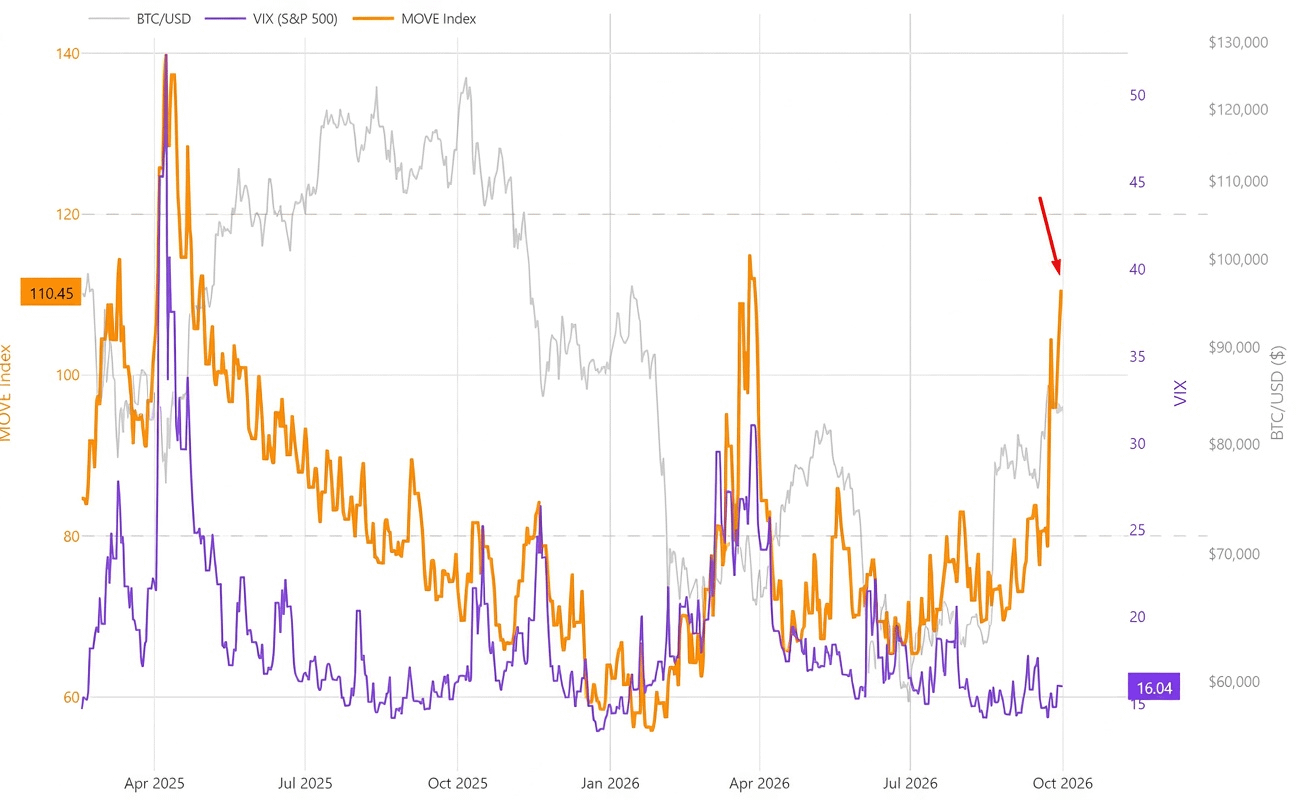
Highest level since April 2026 and already close to the range that the index’s creator treats as a loss of control in the bond market.
The VIX held steady at 16.04.
The divergence I pointed out last week didn’t correct. It increased.
And now it adds up with the widening credit spread and the SPX skew hitting the year’s low.
Something is cooking...
MOVE is shouting VOLATILITY. 🔴
Highest level since April 2026 and already close to the range that the index’s creator treats as a loss of control in the bond market.
The VIX held steady at 16.04.
The divergence I pointed out last week didn’t correct. It increased.
And now it adds up with the widening credit spread and the SPX skew hitting the year’s low.
Something is cooking...
Highest level since April 2026 and already close to the range that the index’s creator treats as a loss of control in the bond market.
The VIX held steady at 16.04.
The divergence I pointed out last week didn’t correct. It increased.
And now it adds up with the widening credit spread and the SPX skew hitting the year’s low.
Something is cooking...
1
351
·
--
One of the calmest “resets” in leverage on $BTC that I’ve seen.
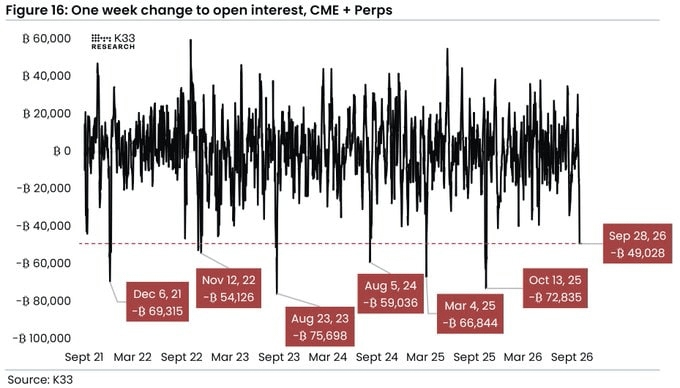
Bitcoin open interest dropped by 49k BTC in seven days, the biggest decline since October 2025.
And this time, nobody got liquidated.
Leverage is leaving the system in an orderly way, without breaking anything along the way.
One of the calmest “resets” in leverage on $BTC that I’ve seen.
Bitcoin open interest dropped by 49k BTC in seven days, the biggest decline since October 2025.
And this time, nobody got liquidated.
Leverage is leaving the system in an orderly way, without breaking anything along the way.
Bitcoin open interest dropped by 49k BTC in seven days, the biggest decline since October 2025.
And this time, nobody got liquidated.
Leverage is leaving the system in an orderly way, without breaking anything along the way.
1
337
Log in to explore more content
Join global crypto users on Binance Square
⚡️ Get latest and useful information about crypto.
💬 Trusted by the world’s largest crypto exchange.
👍 Discover real insights from verified creators.
Email / Phone number
Trending Topics
FedMinutesFocusOnOctoberPause
130,404 views
1,167 Discussing
🚨 HIGH ALERT ‼️ PLEASE DON’T TRADE BLINDLY FOR THE NEXT HOUR 🚨
Guys, we have FOMC Minutes coming in less than 1 hour.
And after the kind of volatility we already saw today, I really don’t want anyone opening random high-leverage positions just before this release.
The biggest reaction I’m watching will be in Gold (XAU), Silver (XAG), BTC and ETH. Then coins like SOL and other highly leveraged mid/low-cap alts can exaggerate whatever move BTC makes.
Gold and Silver are especially sensitive tonight because the market is already reacting to the US dollar + Treasury yields, and both metals have been under heavy pressure ahead of the Fed minutes.
Briefly speaking
📉Hawkish Fed Minutes → Dollar/yields can push higher → pressure on BTC, crypto, Gold & silver
📈Dovish Fed Minutes → Dollar/yields can cool → BTC, Gold, Silver and risk assets can bounce hard.
And please remember the first candle can be a trap. We can get a pump, immediate dump, liquidations on both sides, and then the real direction.
So for now, protect your positions, reduce unnecessary leverage and don’t FOMO into the first move.
Tonight I’m watching $XAU , $XAG and $BTC first. These will tell us very quickly how the market is reading the Fed.
I will Update you guys on time
Follow @Panda Traders and Turn on Your notifications right now
#FedMinutesFocusOnOctoberPause
Panda Traders
·18 Likes
·3.5k views
BinanceLaunchesBinanceIntelligence
1.1M views
6,379 Discussing
EvernorthDelaysNasdaqDebutToOct12
9,365 views
248 Discussing