

交易员黄霖
742 Posts

交易员黄霖
Report
Block User
✅币安聊天室 (主页置顶贴子) 擅长捕捉市场情绪与资金流向,洞察行情背后的真实逻辑。多年实战沉淀,专注高确定性交易,策略盈亏比稳定在1:2以上,长期胜率保持高水准。拒绝情绪化操作,不赌行情,只用结果证明实力。
0 Following
298 Followers
196 Liked
Posts
All
Quotes
PINNED
·
--
If you want to learn strategy trading and copy-trading thinking,
you can press and hold the QR code below to save the image, then use Binance Scan to add it.
After adding, we can exchange market logic, trading ideas, and hands-on execution rhythm together—helping you understand more deeply the opportunities in the blockchain market.
If you want to learn strategy trading and copy-trading thinking,
you can press and hold the QR code below to save the image, then use Binance Scan to add it.
After adding, we can exchange market logic, trading ideas, and hands-on execution rhythm together—helping you understand more deeply the opportunities in the blockchain market.
you can press and hold the QR code below to save the image, then use Binance Scan to add it.
After adding, we can exchange market logic, trading ideas, and hands-on execution rhythm together—helping you understand more deeply the opportunities in the blockchain market.

2
3
73
·
--
$BTC This chart is kind of eerie
#比特币突破8.7万美元创八个月新高
US stocks surge hard while BTC and ETH sprint ahead—so strong it makes your heart feel uneasy
At the current price, it’s an extreme high-level range consolidation—like holding your breath before a storm, waiting for the breakout
Overall it’s still trending upward in consolidation, but the rhythm is so sudden that chasing longs and shorting can get you hit on both sides
Always remember: the market will never only go up without going down
The bullish trend is still there, but if it can’t break through 87,500, the need for a pullback will keep coming
Technically, keep a close watch on the 87,500 resistance. If it fails to hold effectively and cannot stand above it, a quick needle-like drop can happen at any time
For support below: first look at 85,500. If it breaks, it will test the 84,500 low
Intraday, the move from 85,500 down to 84,500 is a key technical “fill-the-gap” zone
Once volume expands and it holds steady above 87,500, the target points directly to 88,200–90,000
Watch ETH in sync—keep a tight eye on the 2,680 support. Don’t get carried away and go alone
For intraday short setups, the idea is to lightly test in the 87,500 to 88,300 area
Be strict about setting stop-losses—never hold stubbornly. Slow is none; steady is better
Yesterday’s ETH long setup went smoothly and got small profits. Today, continue waiting to lay in positions at the right spot
#AI股持续上涨还有哪些投资机会 $ETH
{future}(ETHUSDT)
$BTC This chart is kind of eerie
#比特币突破8.7万美元创八个月新高
US stocks surge hard while BTC and ETH sprint ahead—so strong it makes your heart feel uneasy
At the current price, it’s an extreme high-level range consolidation—like holding your breath before a storm, waiting for the breakout
Overall it’s still trending upward in consolidation, but the rhythm is so sudden that chasing longs and shorting can get you hit on both sides
Always remember: the market will never only go up without going down
The bullish trend is still there, but if it can’t break through 87,500, the need for a pullback will keep coming
Technically, keep a close watch on the 87,500 resistance. If it fails to hold effectively and cannot stand above it, a quick needle-like drop can happen at any time
For support below: first look at 85,500. If it breaks, it will test the 84,500 low
Intraday, the move from 85,500 down to 84,500 is a key technical “fill-the-gap” zone
Once volume expands and it holds steady above 87,500, the target points directly to 88,200–90,000
Watch ETH in sync—keep a tight eye on the 2,680 support. Don’t get carried away and go alone
For intraday short setups, the idea is to lightly test in the 87,500 to 88,300 area
Be strict about setting stop-losses—never hold stubbornly. Slow is none; steady is better
Yesterday’s ETH long setup went smoothly and got small profits. Today, continue waiting to lay in positions at the right spot
#AI股持续上涨还有哪些投资机会 $ETH
#比特币突破8.7万美元创八个月新高
US stocks surge hard while BTC and ETH sprint ahead—so strong it makes your heart feel uneasy
At the current price, it’s an extreme high-level range consolidation—like holding your breath before a storm, waiting for the breakout
Overall it’s still trending upward in consolidation, but the rhythm is so sudden that chasing longs and shorting can get you hit on both sides
Always remember: the market will never only go up without going down
The bullish trend is still there, but if it can’t break through 87,500, the need for a pullback will keep coming
Technically, keep a close watch on the 87,500 resistance. If it fails to hold effectively and cannot stand above it, a quick needle-like drop can happen at any time
For support below: first look at 85,500. If it breaks, it will test the 84,500 low
Intraday, the move from 85,500 down to 84,500 is a key technical “fill-the-gap” zone
Once volume expands and it holds steady above 87,500, the target points directly to 88,200–90,000
Watch ETH in sync—keep a tight eye on the 2,680 support. Don’t get carried away and go alone
For intraday short setups, the idea is to lightly test in the 87,500 to 88,300 area
Be strict about setting stop-losses—never hold stubbornly. Slow is none; steady is better
Yesterday’s ETH long setup went smoothly and got small profits. Today, continue waiting to lay in positions at the right spot
#AI股持续上涨还有哪些投资机会 $ETH

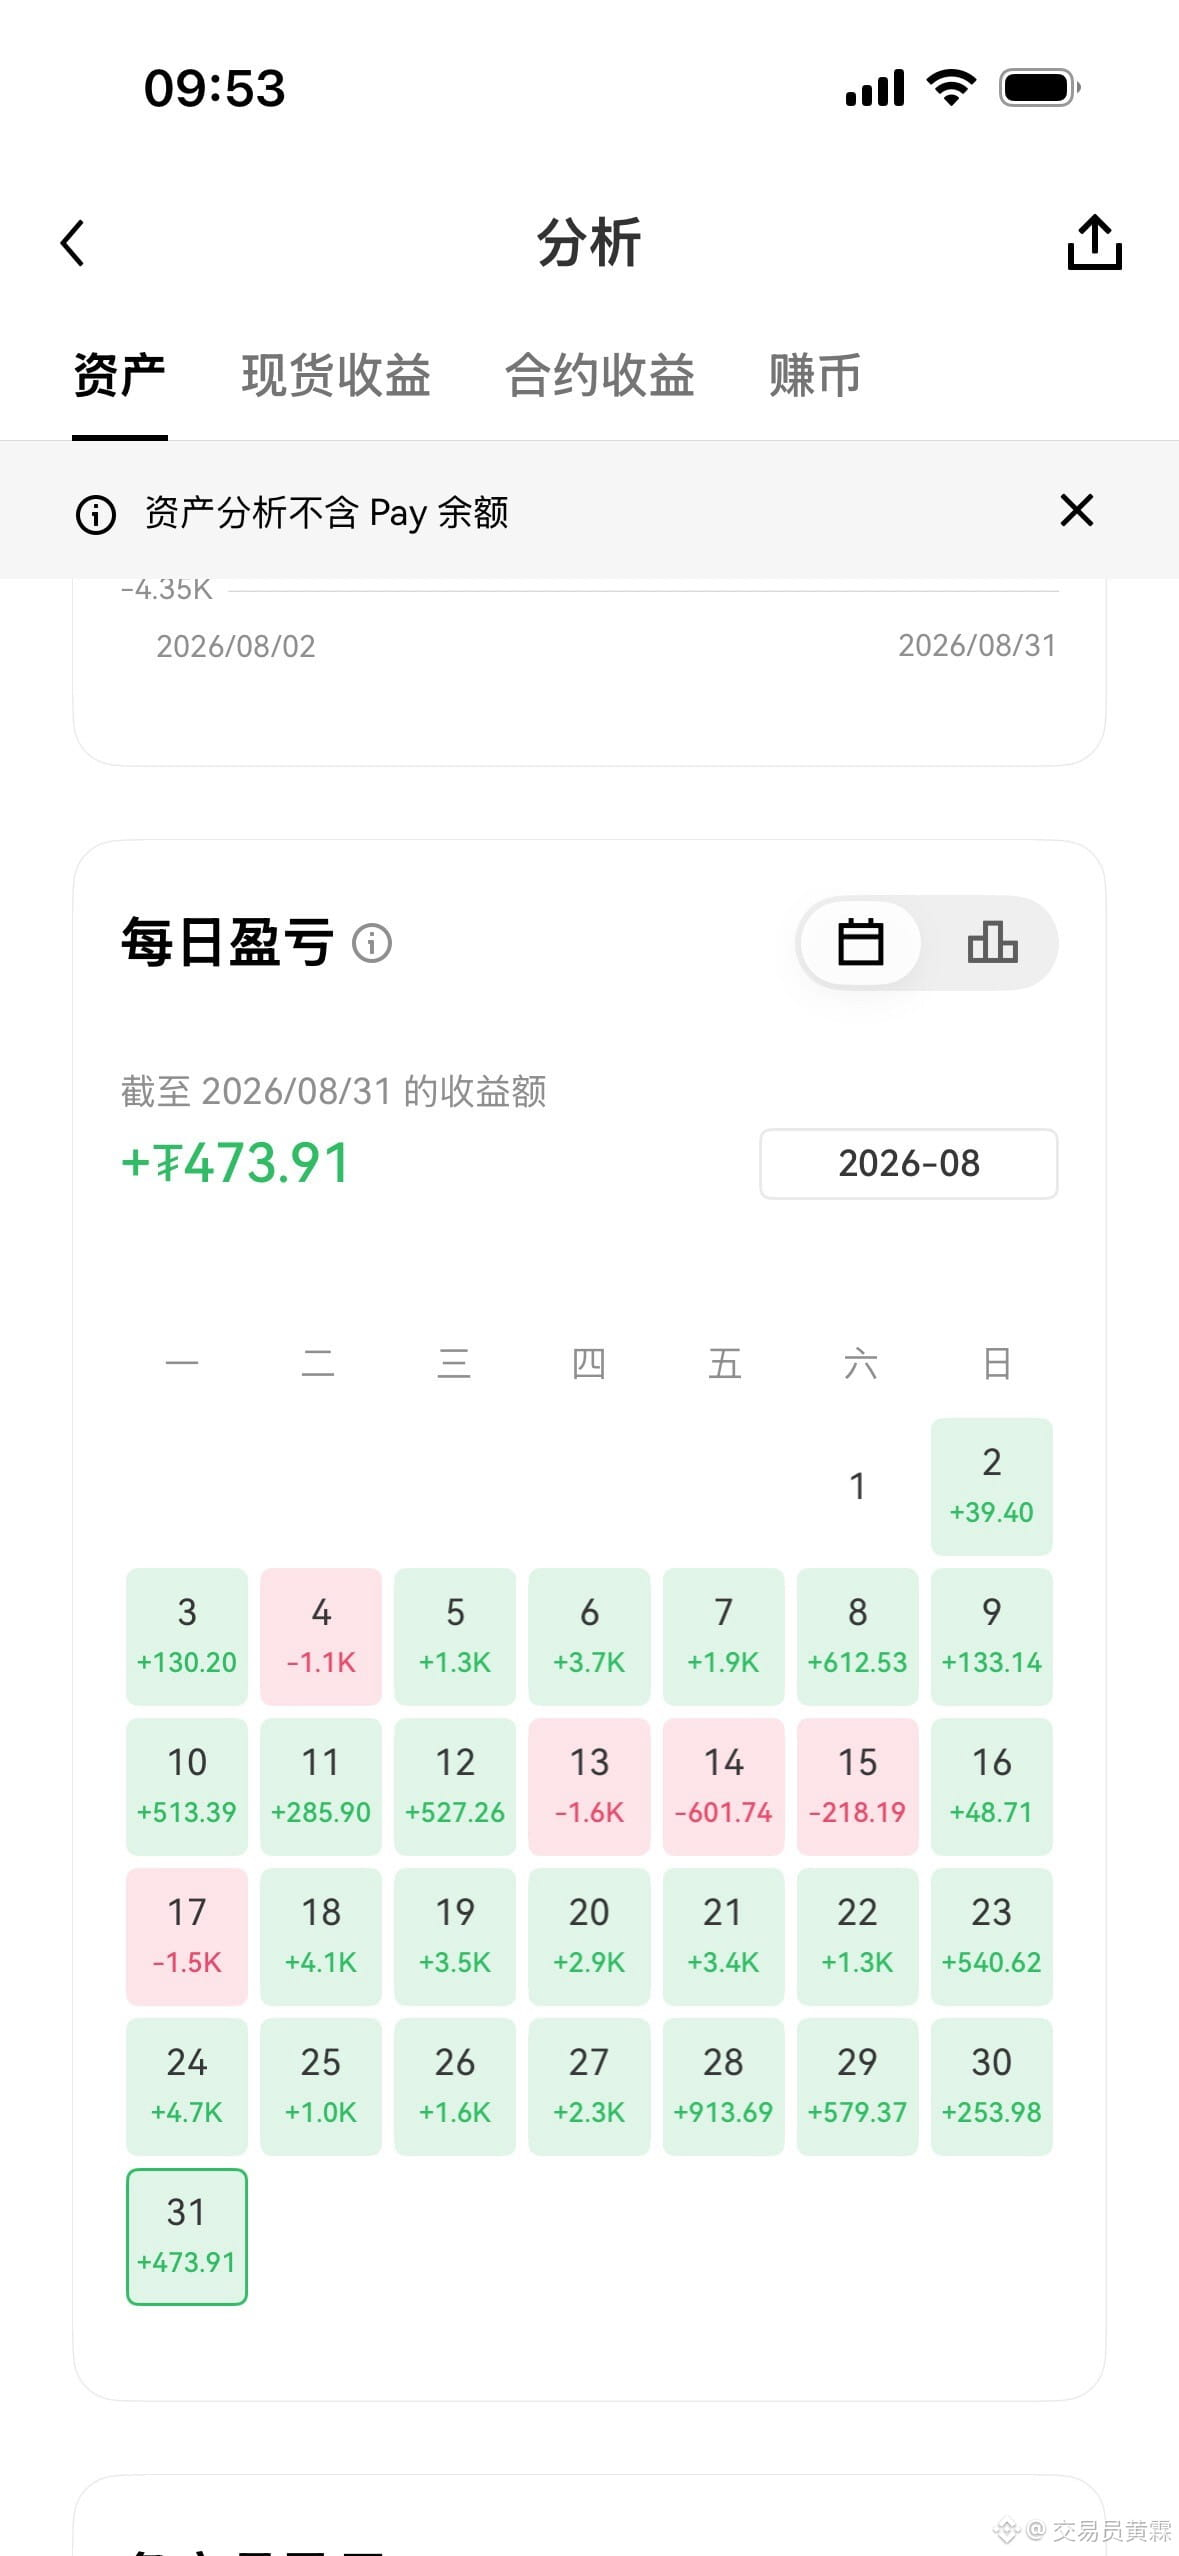
6
100
·
--
$SNDK Opens straight up from the ground!!!
#AI股持续上涨还有哪些投资机会
The moment you step onto the trend line, it lifts off right where it is
In one hour, it surges in a straight line by nearly 100 points
The highest candle—a single big bullish candle—directly pierces through 1861
The shorts are pulled so hard they have no strength to resist
The current price is around 1859, violently churning at high levels
Never chase blindly when it’s such a vertical surge
Looking up, the short-term strong resistance is right at the 1861 needle tip
After the breakout, a higher-level resistance to watch is the 1880 level
Looking down, the first intraday support to watch is 1800
The real major defense starts from the point where it rises at 1760
During the session, the gap-fill area from 1820 down to 1780 is like a vacuum
Only a pullback to fill the gap and stabilize is a comfortable entry point
Trade with the trend—don’t, after a blowout rally, blindly try to top-tick
#狗狗币上涨15% $MU $DRAM
{future}(DRAMUSDT)
{future}(MUUSDT)
$SNDK Opens straight up from the ground!!!
#AI股持续上涨还有哪些投资机会
The moment you step onto the trend line, it lifts off right where it is
In one hour, it surges in a straight line by nearly 100 points
The highest candle—a single big bullish candle—directly pierces through 1861
The shorts are pulled so hard they have no strength to resist
The current price is around 1859, violently churning at high levels
Never chase blindly when it’s such a vertical surge
Looking up, the short-term strong resistance is right at the 1861 needle tip
After the breakout, a higher-level resistance to watch is the 1880 level
Looking down, the first intraday support to watch is 1800
The real major defense starts from the point where it rises at 1760
During the session, the gap-fill area from 1820 down to 1780 is like a vacuum
Only a pullback to fill the gap and stabilize is a comfortable entry point
Trade with the trend—don’t, after a blowout rally, blindly try to top-tick
#狗狗币上涨15% $MU $DRAM
#AI股持续上涨还有哪些投资机会
The moment you step onto the trend line, it lifts off right where it is
In one hour, it surges in a straight line by nearly 100 points
The highest candle—a single big bullish candle—directly pierces through 1861
The shorts are pulled so hard they have no strength to resist
The current price is around 1859, violently churning at high levels
Never chase blindly when it’s such a vertical surge
Looking up, the short-term strong resistance is right at the 1861 needle tip
After the breakout, a higher-level resistance to watch is the 1880 level
Looking down, the first intraday support to watch is 1800
The real major defense starts from the point where it rises at 1760
During the session, the gap-fill area from 1820 down to 1780 is like a vacuum
Only a pullback to fill the gap and stabilize is a comfortable entry point
Trade with the trend—don’t, after a blowout rally, blindly try to top-tick
#狗狗币上涨15% $MU $DRAM

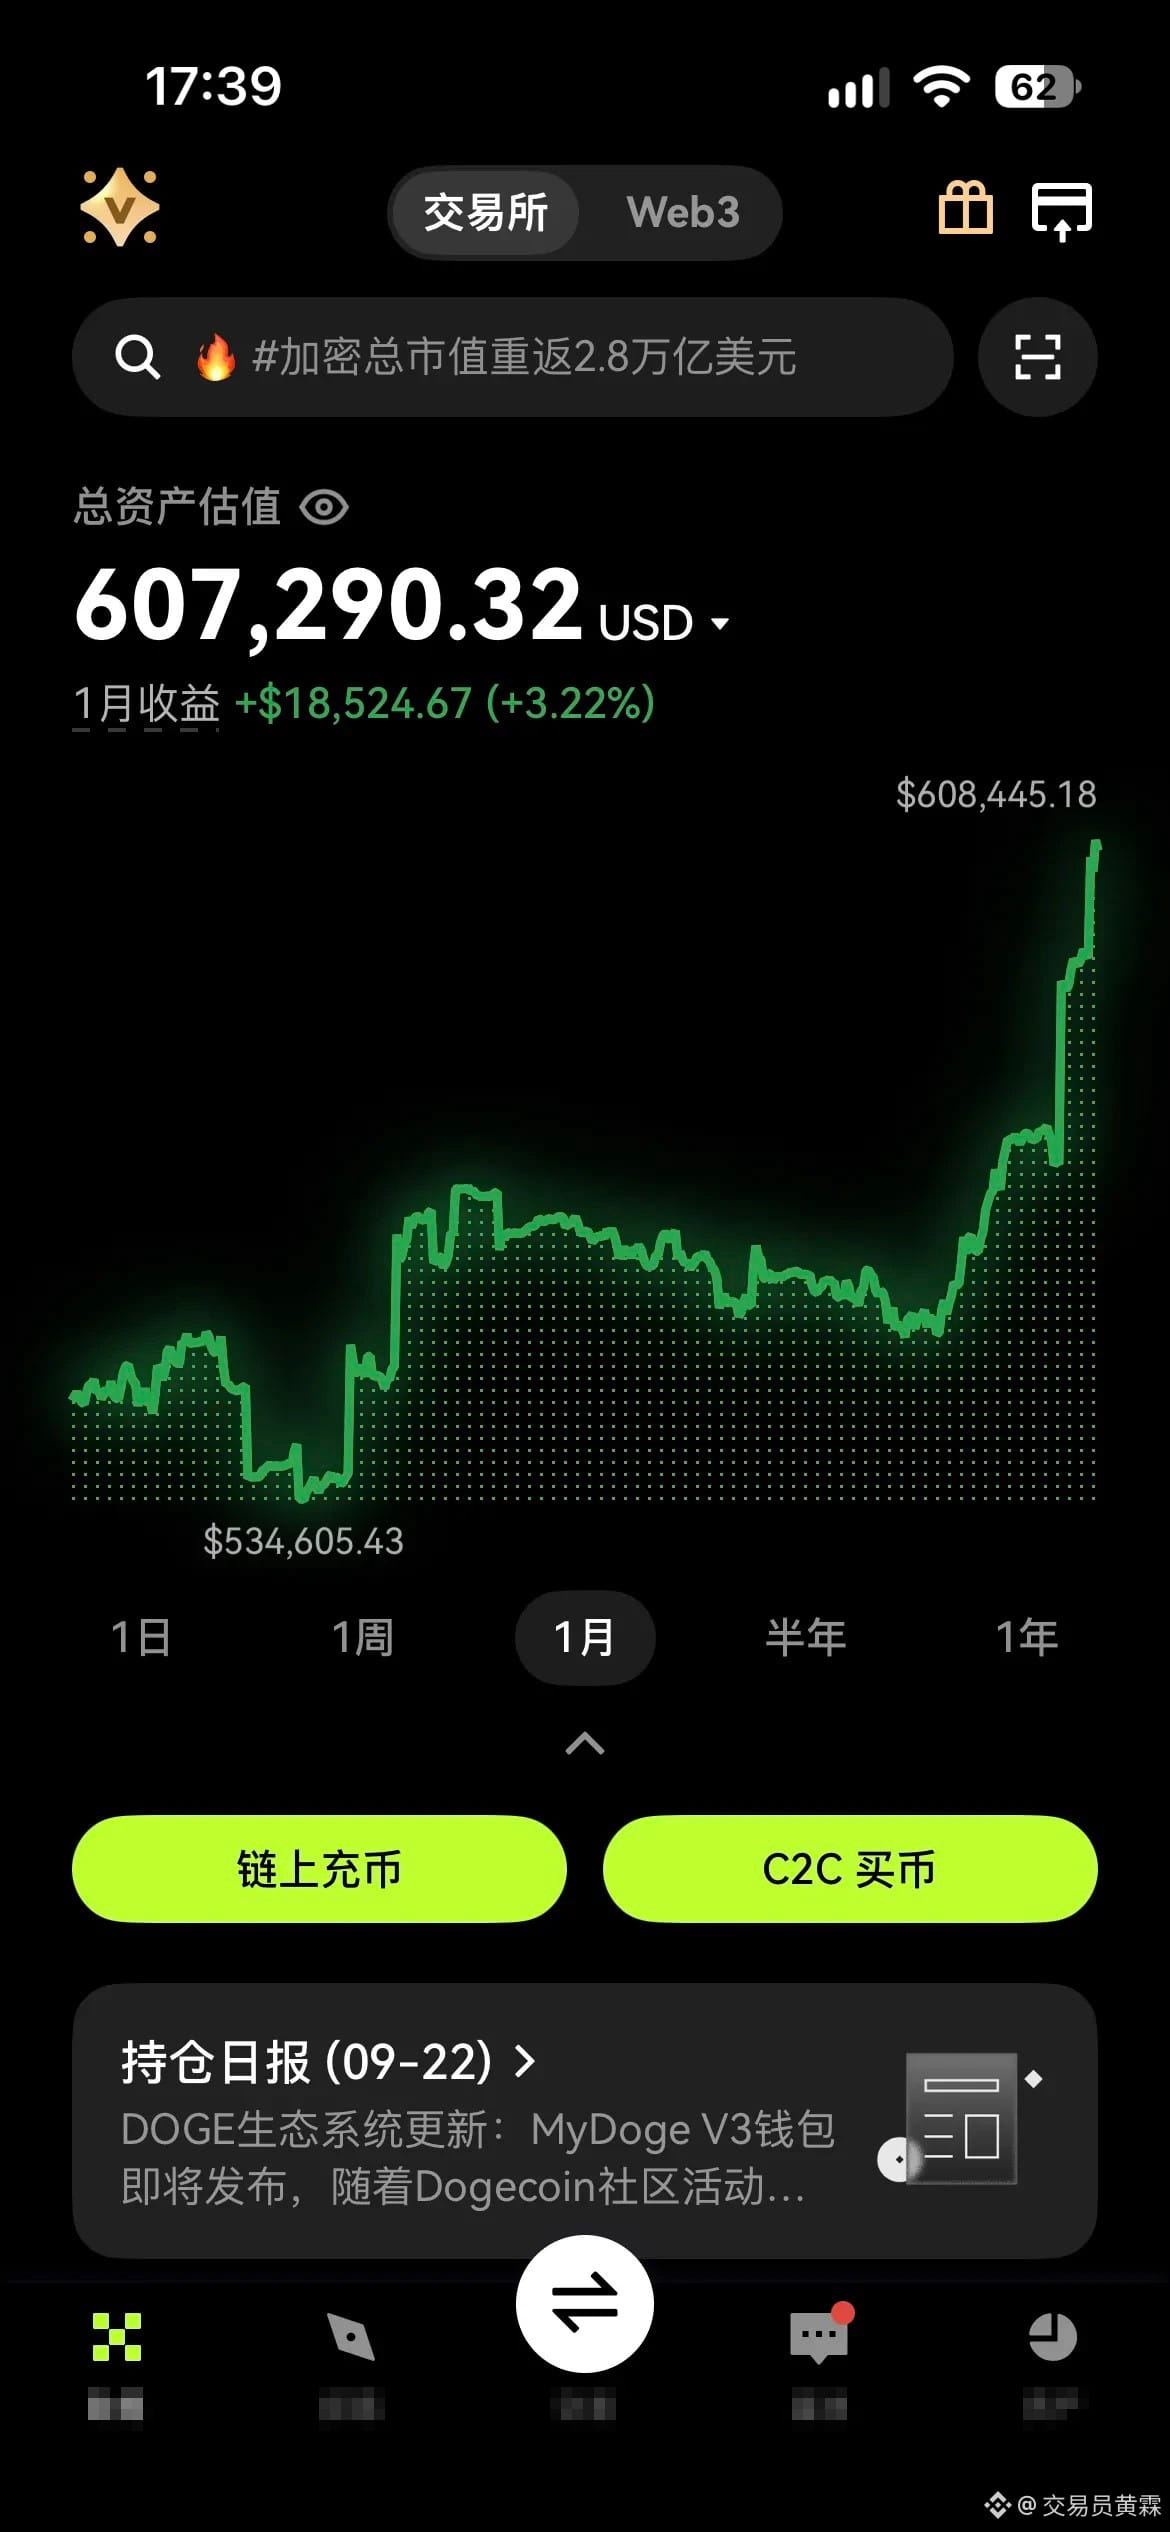
1
776
·
--
$ETH 2800This needle is brutal.
#AI股持续上涨还有哪些投资机会
In one go, it directly pierced through the 2806 high.
Just after blowing up the shorts, it turned around and dropped sharply.
The current price is being ground around the 2745 area.
Those chasing at the mountaintop are starting to feel uneasy again.
At the high, it precisely reveals a nine-turn stagnation-and-rebound signal.
Short-term indicators are overbought—must consolidate and repair.
For the upside, first resistance to watch is 2780.
Strong resistance is firmly capped at the 2806 prior high pin area.
For the downside, watch the first intraday support at 2720.
If it breaks, it directly tests the 2700 midline lifeline.
Intraday, 2720 to 2680 is a benign fill-recovery zone.
Wait for the pullback to stabilize before acting—don’t rush to catch a falling knife at the mountaintop.
$ZEC $BTC
{future}(BTCUSDT)
{future}(ZECUSDT)
$ETH 2800This needle is brutal.
#AI股持续上涨还有哪些投资机会
In one go, it directly pierced through the 2806 high.
Just after blowing up the shorts, it turned around and dropped sharply.
The current price is being ground around the 2745 area.
Those chasing at the mountaintop are starting to feel uneasy again.
At the high, it precisely reveals a nine-turn stagnation-and-rebound signal.
Short-term indicators are overbought—must consolidate and repair.
For the upside, first resistance to watch is 2780.
Strong resistance is firmly capped at the 2806 prior high pin area.
For the downside, watch the first intraday support at 2720.
If it breaks, it directly tests the 2700 midline lifeline.
Intraday, 2720 to 2680 is a benign fill-recovery zone.
Wait for the pullback to stabilize before acting—don’t rush to catch a falling knife at the mountaintop.
$ZEC $BTC
#AI股持续上涨还有哪些投资机会
In one go, it directly pierced through the 2806 high.
Just after blowing up the shorts, it turned around and dropped sharply.
The current price is being ground around the 2745 area.
Those chasing at the mountaintop are starting to feel uneasy again.
At the high, it precisely reveals a nine-turn stagnation-and-rebound signal.
Short-term indicators are overbought—must consolidate and repair.
For the upside, first resistance to watch is 2780.
Strong resistance is firmly capped at the 2806 prior high pin area.
For the downside, watch the first intraday support at 2720.
If it breaks, it directly tests the 2700 midline lifeline.
Intraday, 2720 to 2680 is a benign fill-recovery zone.
Wait for the pullback to stabilize before acting—don’t rush to catch a falling knife at the mountaintop.
$ZEC $BTC

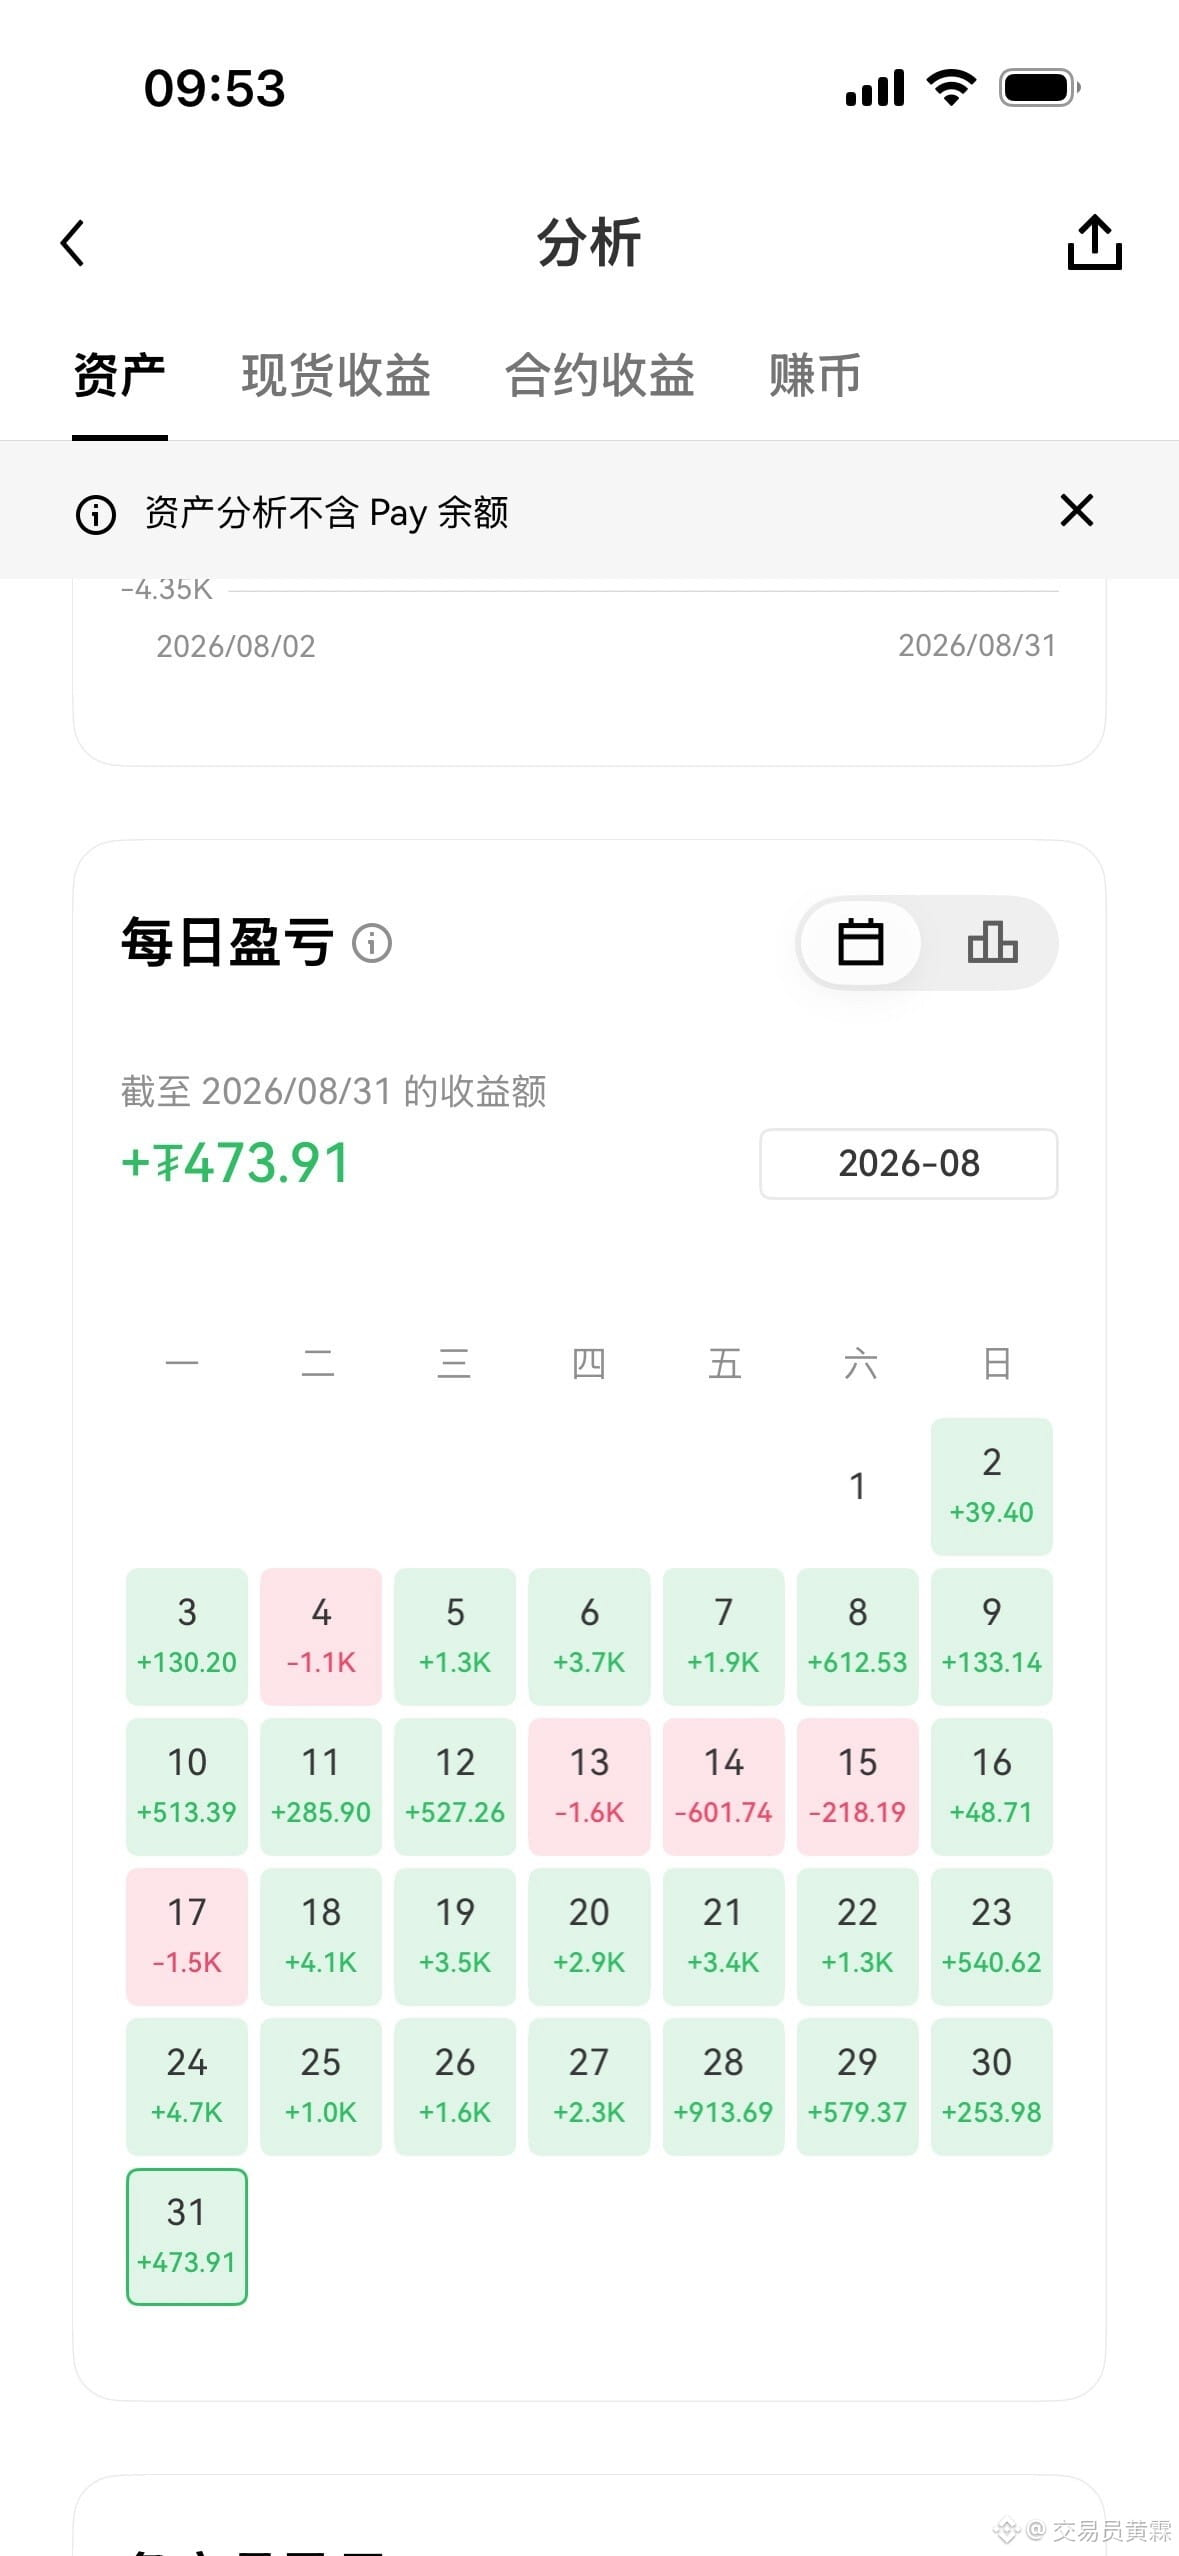
5
438
·
--
$ETH 2745 range-bound consolidation at the high end—has the strong trend really not changed???
The market ran from around 2400 and kept going without looking back.
It broke through multiple resistance levels, topping out at about 2806.
After the spike higher, it didn’t complete a clean profit-taking move followed by a big drop.
At the moment, the coin price is moving in a trading range around 2745, with turnover as it consolidates.
This kind of sideways movement in lieu of a decline is characteristic of the main players controlling the market.
In trading, focus especially on the suppression above 2780.
A breakout above the 2806 high should send it straight toward the 2850 level.
On the downside, the key short-term support to watch is around 2720.
For extreme downside protection, the “life line” is the 2700 mid-band.
The area from 2720 down to 2680 is the core replenishment zone.
As long as the rebound replenishment holds and does not break support, the upward channel remains intact.
Follow the broader trend when placing trades—don’t blindly guess tops or chase after pumps.
Timing matters; only by getting the rhythm right can you hold onto profits through the swing.
#AI股持续上涨还有哪些投资机会 $BTC
{future}(BTCUSDT)
$ETH 2745 range-bound consolidation at the high end—has the strong trend really not changed???
The market ran from around 2400 and kept going without looking back.
It broke through multiple resistance levels, topping out at about 2806.
After the spike higher, it didn’t complete a clean profit-taking move followed by a big drop.
At the moment, the coin price is moving in a trading range around 2745, with turnover as it consolidates.
This kind of sideways movement in lieu of a decline is characteristic of the main players controlling the market.
In trading, focus especially on the suppression above 2780.
A breakout above the 2806 high should send it straight toward the 2850 level.
On the downside, the key short-term support to watch is around 2720.
For extreme downside protection, the “life line” is the 2700 mid-band.
The area from 2720 down to 2680 is the core replenishment zone.
As long as the rebound replenishment holds and does not break support, the upward channel remains intact.
Follow the broader trend when placing trades—don’t blindly guess tops or chase after pumps.
Timing matters; only by getting the rhythm right can you hold onto profits through the swing.
#AI股持续上涨还有哪些投资机会 $BTC
The market ran from around 2400 and kept going without looking back.
It broke through multiple resistance levels, topping out at about 2806.
After the spike higher, it didn’t complete a clean profit-taking move followed by a big drop.
At the moment, the coin price is moving in a trading range around 2745, with turnover as it consolidates.
This kind of sideways movement in lieu of a decline is characteristic of the main players controlling the market.
In trading, focus especially on the suppression above 2780.
A breakout above the 2806 high should send it straight toward the 2850 level.
On the downside, the key short-term support to watch is around 2720.
For extreme downside protection, the “life line” is the 2700 mid-band.
The area from 2720 down to 2680 is the core replenishment zone.
As long as the rebound replenishment holds and does not break support, the upward channel remains intact.
Follow the broader trend when placing trades—don’t blindly guess tops or chase after pumps.
Timing matters; only by getting the rhythm right can you hold onto profits through the swing.
#AI股持续上涨还有哪些投资机会 $BTC

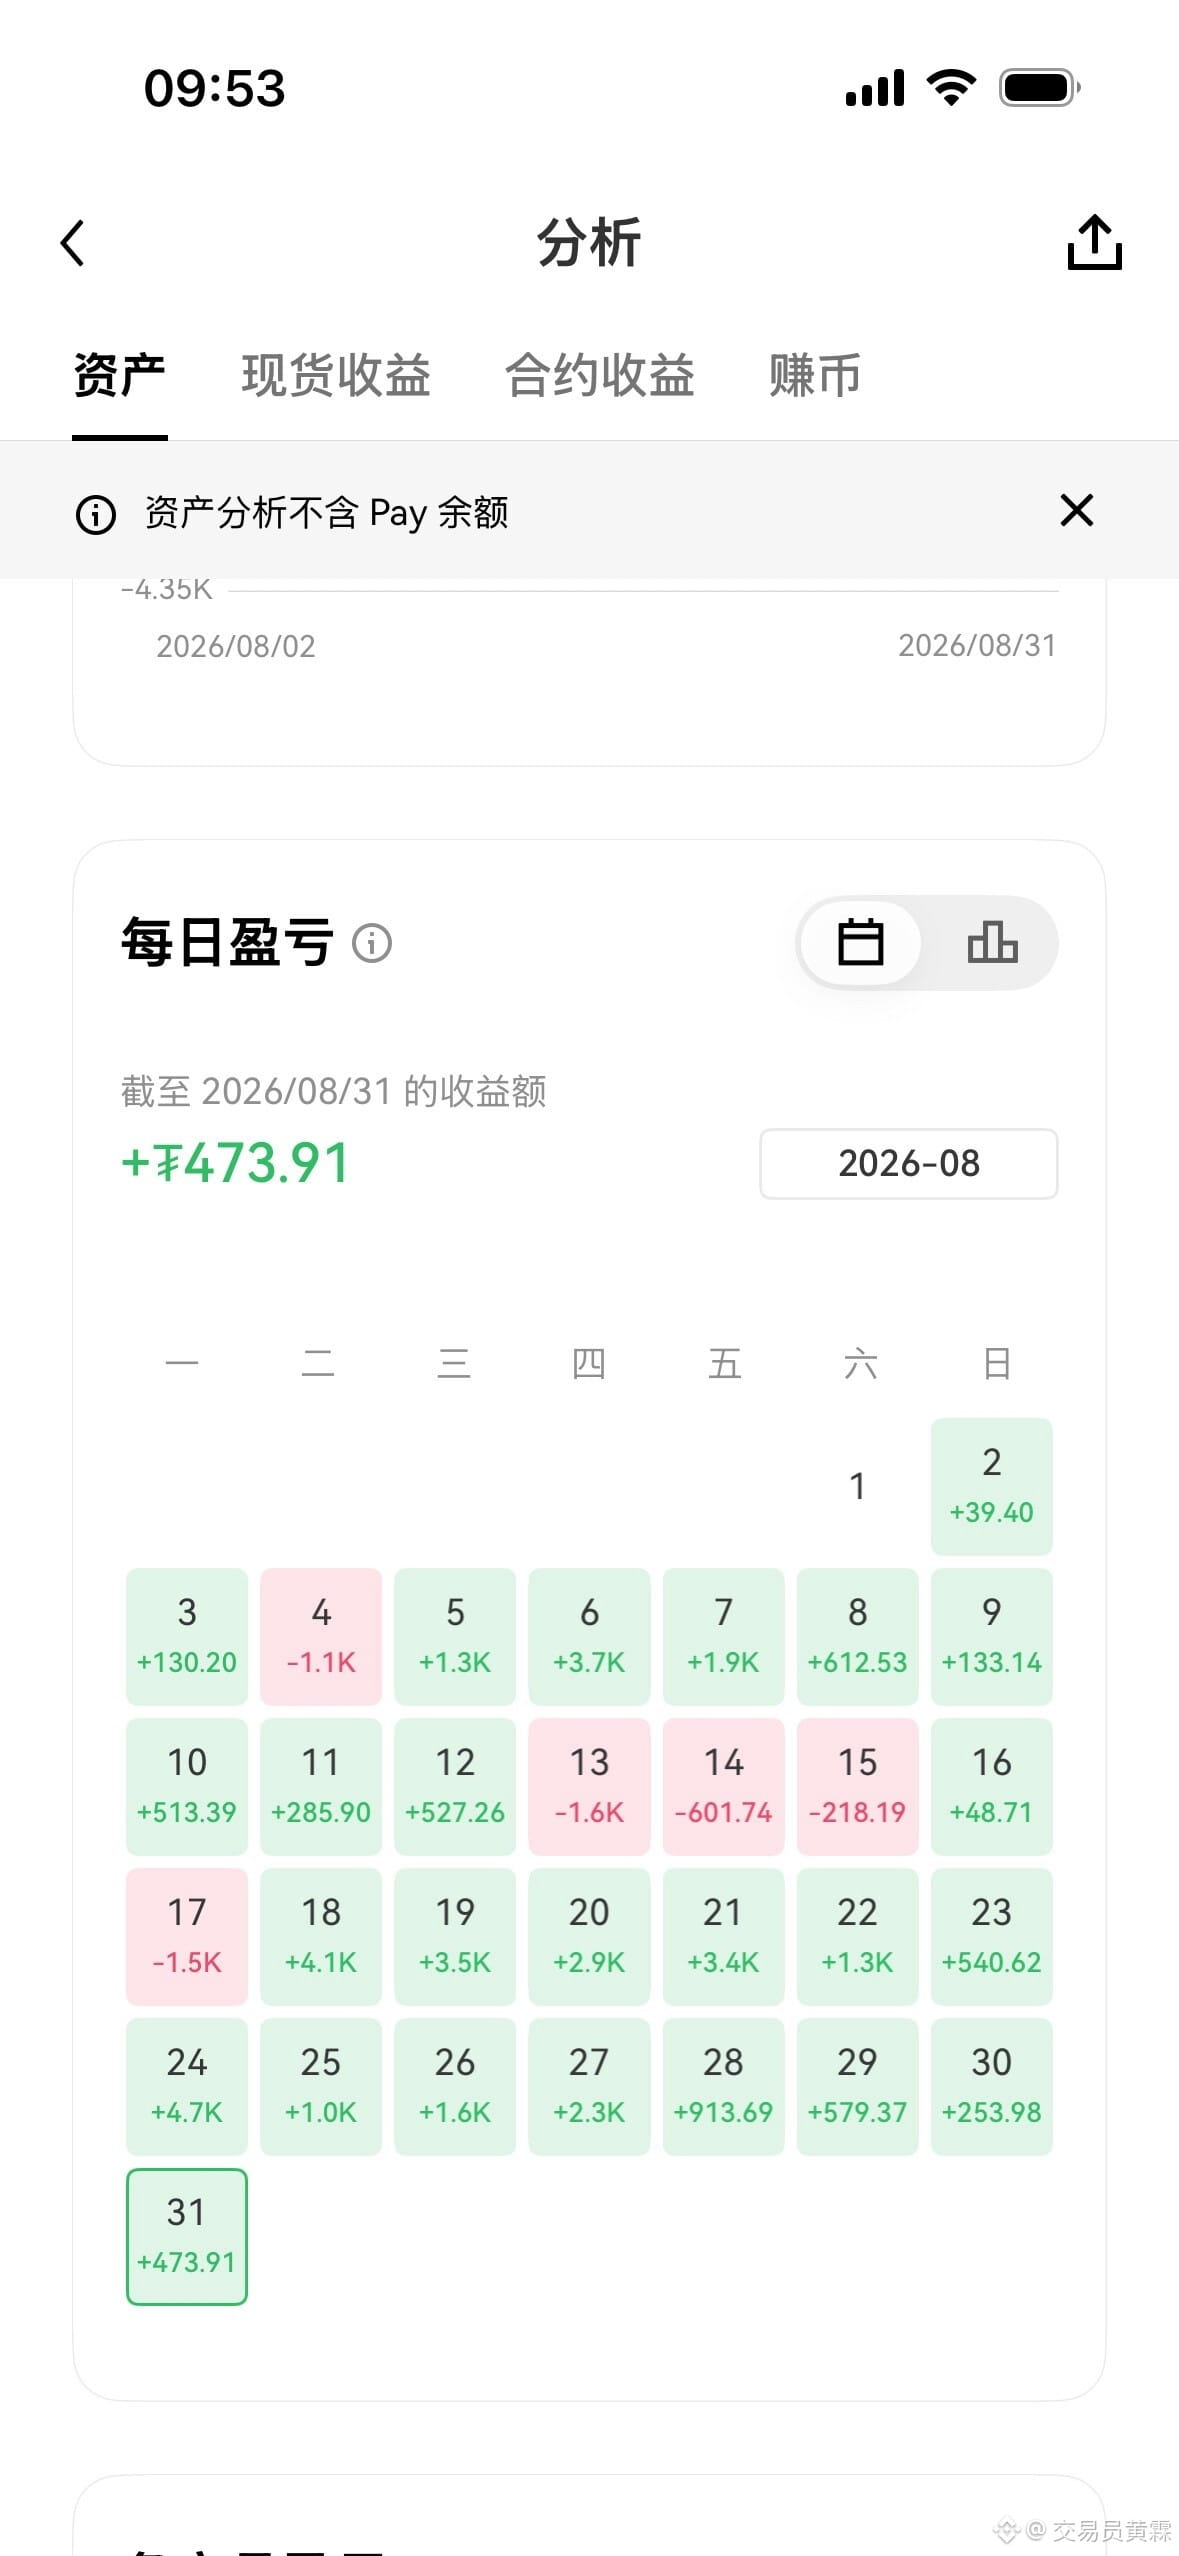
42
·
--
$ETH 2745 high-level consolidation, strength unchanged
#AI股持续上涨还有哪些投资机会
The market started at 2400 and kept going without looking back
Broke through multiple resistances, hitting a highest point of 2806
After the spike, it did not break out—then fell sharply into profit-taking
Currently, the coin price is ranging around 2745, switching hands within the trading platform
This sideways-as-a-decline behavior is a characteristic of main force controlling the market
In trading, focus on the suppression above 2780
A breakout above the 2806 high will send price straight toward the 2850 level
For downside short-term support,重点关注 2720
For extreme risk control, the lifeline is the 2700 midline
The area from 2720 to 2680 is the core replenishment zone
As long as the replenishment holds and does not break support, the upward channel remains intact
Follow the broader trend when trading—don’t blindly guess tops or chase highs
Getting the timing right is what allows you to hold onto profits through the swing
#XRP上涨8% $ETH
{future}(ETHUSDT)
$ETH 2745 high-level consolidation, strength unchanged
#AI股持续上涨还有哪些投资机会
The market started at 2400 and kept going without looking back
Broke through multiple resistances, hitting a highest point of 2806
After the spike, it did not break out—then fell sharply into profit-taking
Currently, the coin price is ranging around 2745, switching hands within the trading platform
This sideways-as-a-decline behavior is a characteristic of main force controlling the market
In trading, focus on the suppression above 2780
A breakout above the 2806 high will send price straight toward the 2850 level
For downside short-term support,重点关注 2720
For extreme risk control, the lifeline is the 2700 midline
The area from 2720 to 2680 is the core replenishment zone
As long as the replenishment holds and does not break support, the upward channel remains intact
Follow the broader trend when trading—don’t blindly guess tops or chase highs
Getting the timing right is what allows you to hold onto profits through the swing
#XRP上涨8% $ETH
#AI股持续上涨还有哪些投资机会
The market started at 2400 and kept going without looking back
Broke through multiple resistances, hitting a highest point of 2806
After the spike, it did not break out—then fell sharply into profit-taking
Currently, the coin price is ranging around 2745, switching hands within the trading platform
This sideways-as-a-decline behavior is a characteristic of main force controlling the market
In trading, focus on the suppression above 2780
A breakout above the 2806 high will send price straight toward the 2850 level
For downside short-term support,重点关注 2720
For extreme risk control, the lifeline is the 2700 midline
The area from 2720 to 2680 is the core replenishment zone
As long as the replenishment holds and does not break support, the upward channel remains intact
Follow the broader trend when trading—don’t blindly guess tops or chase highs
Getting the timing right is what allows you to hold onto profits through the swing
#XRP上涨8% $ETH

6
327
·
--
$BTC isn’t that right?!
#比特币现货ETF净流入9.99亿美元
A single super high-rising candlestick directly pushed the big coin up to 87300, slapping the bears hard enough to turn their faces green.
This big one-way move has been basically a nonstop long the whole way—every brother who followed the pace made a fortune.
Right now the price surged to a high then pulled back nearly 2,000 points, ranging around 85400, and many people are starting to panic again.
When it broke 85,000 yesterday, I repeatedly reminded everyone—don’t rush to touch the top and short. If you listened, you understand.
The core intraday trading idea is crystal clear: still maintain buying on dips decisively, and don’t go against the trend to chase shorts.
For BTC, the first key defense levels below to watch are 84500 and then the two core supports at 82800.
Intraday, the range from 84500 to 82800 is the crucial fill-back area after this leg of the main surge.
For the rebound, resistance: first look at the 87000 prior high. If it breaks and then increases volume, it could step up to 88500 as the next strong overhead pressure.
For ETH, keep it in sync with BTC. Intraday, focus on the two key life-support levels: 2680 and 2620.
For upside, the rebound target resistance is mainly at 2760. A break above it could open the way to 2850—an important threshold.
Daily K shows a big bullish candle with indicators and volume expanding, but the hourly timeframe still needs technical repair. Aggressively chasing longs isn’t a good idea.
This ETH long position was perfect, taking it all for today. Going forward, continue to stay patient and wait for the rebound-to-fill area to stabilize before laying in your position.
#苹果谷歌招募稳定币与代币化存款人才 $ETH
{future}(ETHUSDT)
$BTC isn’t that right?!
#比特币现货ETF净流入9.99亿美元
A single super high-rising candlestick directly pushed the big coin up to 87300, slapping the bears hard enough to turn their faces green.
This big one-way move has been basically a nonstop long the whole way—every brother who followed the pace made a fortune.
Right now the price surged to a high then pulled back nearly 2,000 points, ranging around 85400, and many people are starting to panic again.
When it broke 85,000 yesterday, I repeatedly reminded everyone—don’t rush to touch the top and short. If you listened, you understand.
The core intraday trading idea is crystal clear: still maintain buying on dips decisively, and don’t go against the trend to chase shorts.
For BTC, the first key defense levels below to watch are 84500 and then the two core supports at 82800.
Intraday, the range from 84500 to 82800 is the crucial fill-back area after this leg of the main surge.
For the rebound, resistance: first look at the 87000 prior high. If it breaks and then increases volume, it could step up to 88500 as the next strong overhead pressure.
For ETH, keep it in sync with BTC. Intraday, focus on the two key life-support levels: 2680 and 2620.
For upside, the rebound target resistance is mainly at 2760. A break above it could open the way to 2850—an important threshold.
Daily K shows a big bullish candle with indicators and volume expanding, but the hourly timeframe still needs technical repair. Aggressively chasing longs isn’t a good idea.
This ETH long position was perfect, taking it all for today. Going forward, continue to stay patient and wait for the rebound-to-fill area to stabilize before laying in your position.
#苹果谷歌招募稳定币与代币化存款人才 $ETH
#比特币现货ETF净流入9.99亿美元
A single super high-rising candlestick directly pushed the big coin up to 87300, slapping the bears hard enough to turn their faces green.
This big one-way move has been basically a nonstop long the whole way—every brother who followed the pace made a fortune.
Right now the price surged to a high then pulled back nearly 2,000 points, ranging around 85400, and many people are starting to panic again.
When it broke 85,000 yesterday, I repeatedly reminded everyone—don’t rush to touch the top and short. If you listened, you understand.
The core intraday trading idea is crystal clear: still maintain buying on dips decisively, and don’t go against the trend to chase shorts.
For BTC, the first key defense levels below to watch are 84500 and then the two core supports at 82800.
Intraday, the range from 84500 to 82800 is the crucial fill-back area after this leg of the main surge.
For the rebound, resistance: first look at the 87000 prior high. If it breaks and then increases volume, it could step up to 88500 as the next strong overhead pressure.
For ETH, keep it in sync with BTC. Intraday, focus on the two key life-support levels: 2680 and 2620.
For upside, the rebound target resistance is mainly at 2760. A break above it could open the way to 2850—an important threshold.
Daily K shows a big bullish candle with indicators and volume expanding, but the hourly timeframe still needs technical repair. Aggressively chasing longs isn’t a good idea.
This ETH long position was perfect, taking it all for today. Going forward, continue to stay patient and wait for the rebound-to-fill area to stabilize before laying in your position.
#苹果谷歌招募稳定币与代币化存款人才 $ETH

88
·
--
$BTC I rely on it, we directly take off!!!
#比特币突破8.5万美元
People are still waiting for that dip to come back before buying—this round the main force pulled a single sky-reaching needle and completely caught everyone off guard.
From the 81500 level, the coin price shot up from flat ground in a straight line, continuously pumping nearly 4,000 points—hitting a high around the 85449 area.
In the order book, the CVD (buy/sell imbalance) literally surged to 74%—and the heavy-volume long buys really don’t follow any logic.
After spiking higher, Big Cake didn’t break down into a waterfall dump. Instead, it held extremely firmly in a tight range above 85160.
In a strong-market setup, holding the ceiling and moving sideways instead of dropping is the main force continuing to force a squeeze—the most lethal kind of action.
Looking upward, the first short-term resistance is the needle tip at 85500 that was just driven, and the 86000 heavy-supply zone.
As long as the longs, with volume, break through and conquer the 86000 resistance, the space above will be fully opened and it will head straight for the 90,000 level.
Looking downward, the first ultra-short intraday defense support is the platform low between 84000 and 83500.
During the session, the range from 83500 down to 82000 is the gap/empty zone left by the violent rally—areas where trapped orders need to be refilled.
The extreme strong support overlaps at the 81400 mid-band—so long as it doesn’t break below that level, the main rally structure remains completely intact.
The trend has already fully formed. Absolutely don’t try to pick tops or bottoms against the trend—keep existing long positions and protect them with stop-losses.
For those who are outside missing the move, beware of blindly chasing at the 85,000+ high—be patient and wait for signals that the pullback/re-fill area has stabilized.
#欧洲央行启动区块链欧元结算 $ETH
{future}(ETHUSDT)
$BTC I rely on it, we directly take off!!!
#比特币突破8.5万美元
People are still waiting for that dip to come back before buying—this round the main force pulled a single sky-reaching needle and completely caught everyone off guard.
From the 81500 level, the coin price shot up from flat ground in a straight line, continuously pumping nearly 4,000 points—hitting a high around the 85449 area.
In the order book, the CVD (buy/sell imbalance) literally surged to 74%—and the heavy-volume long buys really don’t follow any logic.
After spiking higher, Big Cake didn’t break down into a waterfall dump. Instead, it held extremely firmly in a tight range above 85160.
In a strong-market setup, holding the ceiling and moving sideways instead of dropping is the main force continuing to force a squeeze—the most lethal kind of action.
Looking upward, the first short-term resistance is the needle tip at 85500 that was just driven, and the 86000 heavy-supply zone.
As long as the longs, with volume, break through and conquer the 86000 resistance, the space above will be fully opened and it will head straight for the 90,000 level.
Looking downward, the first ultra-short intraday defense support is the platform low between 84000 and 83500.
During the session, the range from 83500 down to 82000 is the gap/empty zone left by the violent rally—areas where trapped orders need to be refilled.
The extreme strong support overlaps at the 81400 mid-band—so long as it doesn’t break below that level, the main rally structure remains completely intact.
The trend has already fully formed. Absolutely don’t try to pick tops or bottoms against the trend—keep existing long positions and protect them with stop-losses.
For those who are outside missing the move, beware of blindly chasing at the 85,000+ high—be patient and wait for signals that the pullback/re-fill area has stabilized.
#欧洲央行启动区块链欧元结算 $ETH
#比特币突破8.5万美元
People are still waiting for that dip to come back before buying—this round the main force pulled a single sky-reaching needle and completely caught everyone off guard.
From the 81500 level, the coin price shot up from flat ground in a straight line, continuously pumping nearly 4,000 points—hitting a high around the 85449 area.
In the order book, the CVD (buy/sell imbalance) literally surged to 74%—and the heavy-volume long buys really don’t follow any logic.
After spiking higher, Big Cake didn’t break down into a waterfall dump. Instead, it held extremely firmly in a tight range above 85160.
In a strong-market setup, holding the ceiling and moving sideways instead of dropping is the main force continuing to force a squeeze—the most lethal kind of action.
Looking upward, the first short-term resistance is the needle tip at 85500 that was just driven, and the 86000 heavy-supply zone.
As long as the longs, with volume, break through and conquer the 86000 resistance, the space above will be fully opened and it will head straight for the 90,000 level.
Looking downward, the first ultra-short intraday defense support is the platform low between 84000 and 83500.
During the session, the range from 83500 down to 82000 is the gap/empty zone left by the violent rally—areas where trapped orders need to be refilled.
The extreme strong support overlaps at the 81400 mid-band—so long as it doesn’t break below that level, the main rally structure remains completely intact.
The trend has already fully formed. Absolutely don’t try to pick tops or bottoms against the trend—keep existing long positions and protect them with stop-losses.
For those who are outside missing the move, beware of blindly chasing at the 85,000+ high—be patient and wait for signals that the pullback/re-fill area has stabilized.
#欧洲央行启动区块链欧元结算 $ETH

5
109
·
--
$BTC something huge happened, brothers!!!
#比特币突破8.5万美元
This week’s BTC market… the more I look, the more something feels off
This main-player game, maybe even bigger than we think
If you take the wrong direction, it’s easy to get chopped up back and forth afterward
I said it last week
Below 76000 is a vacuum zone—sooner or later it will be filled
What happened? It got smashed straight down to 74900
And this fill has basically been executed very precisely
Now the daily chart gets even more interesting
The liquidity above 82828 has already been directly swept away
But remember one thing
As long as it’s not a big bullish candle that immediately pierces through with heavy volume
After a push higher, you need to watch for a pullback
For the short term, watch support below first: 81500 to 80600
On the daily chart, the bullish OB is also around here
If it really pulls back to this area, I’d actually be more willing to wait for the opportunity
So don’t chase price now
Wait for the pullback, buy in batches, and keep some bullets in your pocket
Only when you reach the right position will there be a chance
But the prerequisite is to protect your position sizing and risk control
Today’s ETH long also captured a decent amount of room
Next wave, keep waiting for the levels—don’t rush to chase
#欧洲央行启动区块链欧元结算 $ETH
{future}(ETHUSDT)
$BTC something huge happened, brothers!!!
#比特币突破8.5万美元
This week’s BTC market… the more I look, the more something feels off
This main-player game, maybe even bigger than we think
If you take the wrong direction, it’s easy to get chopped up back and forth afterward
I said it last week
Below 76000 is a vacuum zone—sooner or later it will be filled
What happened? It got smashed straight down to 74900
And this fill has basically been executed very precisely
Now the daily chart gets even more interesting
The liquidity above 82828 has already been directly swept away
But remember one thing
As long as it’s not a big bullish candle that immediately pierces through with heavy volume
After a push higher, you need to watch for a pullback
For the short term, watch support below first: 81500 to 80600
On the daily chart, the bullish OB is also around here
If it really pulls back to this area, I’d actually be more willing to wait for the opportunity
So don’t chase price now
Wait for the pullback, buy in batches, and keep some bullets in your pocket
Only when you reach the right position will there be a chance
But the prerequisite is to protect your position sizing and risk control
Today’s ETH long also captured a decent amount of room
Next wave, keep waiting for the levels—don’t rush to chase
#欧洲央行启动区块链欧元结算 $ETH
#比特币突破8.5万美元
This week’s BTC market… the more I look, the more something feels off
This main-player game, maybe even bigger than we think
If you take the wrong direction, it’s easy to get chopped up back and forth afterward
I said it last week
Below 76000 is a vacuum zone—sooner or later it will be filled
What happened? It got smashed straight down to 74900
And this fill has basically been executed very precisely
Now the daily chart gets even more interesting
The liquidity above 82828 has already been directly swept away
But remember one thing
As long as it’s not a big bullish candle that immediately pierces through with heavy volume
After a push higher, you need to watch for a pullback
For the short term, watch support below first: 81500 to 80600
On the daily chart, the bullish OB is also around here
If it really pulls back to this area, I’d actually be more willing to wait for the opportunity
So don’t chase price now
Wait for the pullback, buy in batches, and keep some bullets in your pocket
Only when you reach the right position will there be a chance
But the prerequisite is to protect your position sizing and risk control
Today’s ETH long also captured a decent amount of room
Next wave, keep waiting for the levels—don’t rush to chase
#欧洲央行启动区块链欧元结算 $ETH

6
89
·
--
$ZEC 1480 Bull/Bear turning point—hold steady, still expect a rise above 1 line #ZEC走势分析
#以太坊突破2700美元
After accurately forecasting the target zone from 1530 to 1600 from the start, the market trend has fully matched trading logic
After surging to 1595, it followed with a pullback to retest and form a base at 1440; the current coin price is now stable around 1487
On the hourly level, the moving averages are converging and flattening, indicating the short-term direction is about to choose an explosive breakout
As long as price can steadily hold above the 1480 midline, the bulls still retain relative initiative
In trading, focus mainly on whether the supply and resistance in the 1530 to 1550 range—i.e., the overhead order/position pressure and absorption—can be dealt with
After a high-volume breakout above 1550, the next target is still looking at the strong resistance platform above at 1595 to 1600
For the downside, the first defensive support for short-term longs should focus on the moving-average area from 1480 to 1470
From 1480 down to around 1450 on the chart is the safest low-long accumulation and replenishment zone for bulls
As long as the pullback does not break through the strong support at 1440, there is no need to panic about the broader upward structure on the short term
The truly big-degree defensive line is firmly set at the 1400 level—this is the bulls’ absolute bottom line that must not be lost
According to the predetermined strategy, keep leverage around three times; look for long-entry opportunities in key replenishment zones
Follow the trend and strictly execute stop-loss discipline; don’t blindly chase rising prices, so you can compound consistently over a swing trading cycle
#华夏基金完成港元稳定币投资用例 $ETH
{future}(ETHUSDT)
$ZEC 1480 Bull/Bear turning point—hold steady, still expect a rise above 1 line #ZEC走势分析
#以太坊突破2700美元
After accurately forecasting the target zone from 1530 to 1600 from the start, the market trend has fully matched trading logic
After surging to 1595, it followed with a pullback to retest and form a base at 1440; the current coin price is now stable around 1487
On the hourly level, the moving averages are converging and flattening, indicating the short-term direction is about to choose an explosive breakout
As long as price can steadily hold above the 1480 midline, the bulls still retain relative initiative
In trading, focus mainly on whether the supply and resistance in the 1530 to 1550 range—i.e., the overhead order/position pressure and absorption—can be dealt with
After a high-volume breakout above 1550, the next target is still looking at the strong resistance platform above at 1595 to 1600
For the downside, the first defensive support for short-term longs should focus on the moving-average area from 1480 to 1470
From 1480 down to around 1450 on the chart is the safest low-long accumulation and replenishment zone for bulls
As long as the pullback does not break through the strong support at 1440, there is no need to panic about the broader upward structure on the short term
The truly big-degree defensive line is firmly set at the 1400 level—this is the bulls’ absolute bottom line that must not be lost
According to the predetermined strategy, keep leverage around three times; look for long-entry opportunities in key replenishment zones
Follow the trend and strictly execute stop-loss discipline; don’t blindly chase rising prices, so you can compound consistently over a swing trading cycle
#华夏基金完成港元稳定币投资用例 $ETH
#以太坊突破2700美元
After accurately forecasting the target zone from 1530 to 1600 from the start, the market trend has fully matched trading logic
After surging to 1595, it followed with a pullback to retest and form a base at 1440; the current coin price is now stable around 1487
On the hourly level, the moving averages are converging and flattening, indicating the short-term direction is about to choose an explosive breakout
As long as price can steadily hold above the 1480 midline, the bulls still retain relative initiative
In trading, focus mainly on whether the supply and resistance in the 1530 to 1550 range—i.e., the overhead order/position pressure and absorption—can be dealt with
After a high-volume breakout above 1550, the next target is still looking at the strong resistance platform above at 1595 to 1600
For the downside, the first defensive support for short-term longs should focus on the moving-average area from 1480 to 1470
From 1480 down to around 1450 on the chart is the safest low-long accumulation and replenishment zone for bulls
As long as the pullback does not break through the strong support at 1440, there is no need to panic about the broader upward structure on the short term
The truly big-degree defensive line is firmly set at the 1400 level—this is the bulls’ absolute bottom line that must not be lost
According to the predetermined strategy, keep leverage around three times; look for long-entry opportunities in key replenishment zones
Follow the trend and strictly execute stop-loss discipline; don’t blindly chase rising prices, so you can compound consistently over a swing trading cycle
#华夏基金完成港元稳定币投资用例 $ETH

6
93
·
--
$BTC BTC This one line!!
#以太坊突破2700美元
This price action really feels like it’s about to cause something
The weekly chart again throws out a big bullish marubozu
It directly recaptures last week’s bearish candle
A weekly-level bullish engulfing— the signals are getting clearer and clearer
The bottoming attempt around 75,000 is getting stronger
The bottom structure has also started to gradually lift
It keeps testing the 82,000 area again and again
Right now it looks more like it’s continuously testing the overhead liquidity
At the same time, it’s slowly grinding down the floating supply and the shorts
After the 4H MACD bottom divergence, signs of a golden cross have begun to show
The daily hammer candle also provides solid support for the bulls
The weekly engulfing is also releasing a relatively strong signal
So next, either of these two ideas can be considered:
Pull back to find opportunities, then follow through after a breakout
For those who want to set a long on the left side (early)
You can focus on around 80200 to 79600
Light position, low leverage—don’t max out your position size
This ETH long has also already captured a decent amount of room
No need to chase right now—keep waiting for a better position to show up before setting up your entry
#巴菲特卸任伯克希尔董事长 $ETH
{future}(ETHUSDT)
$BTC BTC This one line!!
#以太坊突破2700美元
This price action really feels like it’s about to cause something
The weekly chart again throws out a big bullish marubozu
It directly recaptures last week’s bearish candle
A weekly-level bullish engulfing— the signals are getting clearer and clearer
The bottoming attempt around 75,000 is getting stronger
The bottom structure has also started to gradually lift
It keeps testing the 82,000 area again and again
Right now it looks more like it’s continuously testing the overhead liquidity
At the same time, it’s slowly grinding down the floating supply and the shorts
After the 4H MACD bottom divergence, signs of a golden cross have begun to show
The daily hammer candle also provides solid support for the bulls
The weekly engulfing is also releasing a relatively strong signal
So next, either of these two ideas can be considered:
Pull back to find opportunities, then follow through after a breakout
For those who want to set a long on the left side (early)
You can focus on around 80200 to 79600
Light position, low leverage—don’t max out your position size
This ETH long has also already captured a decent amount of room
No need to chase right now—keep waiting for a better position to show up before setting up your entry
#巴菲特卸任伯克希尔董事长 $ETH
#以太坊突破2700美元
This price action really feels like it’s about to cause something
The weekly chart again throws out a big bullish marubozu
It directly recaptures last week’s bearish candle
A weekly-level bullish engulfing— the signals are getting clearer and clearer
The bottoming attempt around 75,000 is getting stronger
The bottom structure has also started to gradually lift
It keeps testing the 82,000 area again and again
Right now it looks more like it’s continuously testing the overhead liquidity
At the same time, it’s slowly grinding down the floating supply and the shorts
After the 4H MACD bottom divergence, signs of a golden cross have begun to show
The daily hammer candle also provides solid support for the bulls
The weekly engulfing is also releasing a relatively strong signal
So next, either of these two ideas can be considered:
Pull back to find opportunities, then follow through after a breakout
For those who want to set a long on the left side (early)
You can focus on around 80200 to 79600
Light position, low leverage—don’t max out your position size
This ETH long has also already captured a decent amount of room
No need to chase right now—keep waiting for a better position to show up before setting up your entry
#巴菲特卸任伯克希尔董事长 $ETH

6
100
·
--
$BTC Big moves are coming!!!
#以太坊突破2700美元
This market is really starting to make things happen
On Monday, the weekly close was taken, and the bulls were like they’d been injected with adrenaline, pushing upward like a bulldozer
Last week I went long from 75600 all the way up to 80000
Over the weekend I also called for a buy-the-dip entry on the pullback to 80500 in advance, and went long ETH around 2470
Those who followed should have made a nice profit
If you didn’t, are you kicking yourself again now
But don’t get carried away yet
The 82000 level is not something that can be broken through casually
The rapid pullback after the morning push to 82000 was a clear pressure test
But the key is that the pullback did not break below the weekend low
That means support below is still holding
With a lot of short positions stacked above, it may instead leave room for a continued short squeeze later
For BTC, aggressive support is first at 80500 to 80000
More conservatively, look at 79600
For ETH, focus on 2620 and 2570
So a pullback is not necessarily a bad thing
Without a pullback, where would the low-long opportunity come from
Going forward, the main approach is still to buy low
But don’t chase after a sharp rally, and definitely don’t forget risk control
#Canary二次修订质押SEI现货ETF申请 $ETH
{future}(ETHUSDT)
$BTC Big moves are coming!!!
#以太坊突破2700美元
This market is really starting to make things happen
On Monday, the weekly close was taken, and the bulls were like they’d been injected with adrenaline, pushing upward like a bulldozer
Last week I went long from 75600 all the way up to 80000
Over the weekend I also called for a buy-the-dip entry on the pullback to 80500 in advance, and went long ETH around 2470
Those who followed should have made a nice profit
If you didn’t, are you kicking yourself again now
But don’t get carried away yet
The 82000 level is not something that can be broken through casually
The rapid pullback after the morning push to 82000 was a clear pressure test
But the key is that the pullback did not break below the weekend low
That means support below is still holding
With a lot of short positions stacked above, it may instead leave room for a continued short squeeze later
For BTC, aggressive support is first at 80500 to 80000
More conservatively, look at 79600
For ETH, focus on 2620 and 2570
So a pullback is not necessarily a bad thing
Without a pullback, where would the low-long opportunity come from
Going forward, the main approach is still to buy low
But don’t chase after a sharp rally, and definitely don’t forget risk control
#Canary二次修订质押SEI现货ETF申请 $ETH
#以太坊突破2700美元
This market is really starting to make things happen
On Monday, the weekly close was taken, and the bulls were like they’d been injected with adrenaline, pushing upward like a bulldozer
Last week I went long from 75600 all the way up to 80000
Over the weekend I also called for a buy-the-dip entry on the pullback to 80500 in advance, and went long ETH around 2470
Those who followed should have made a nice profit
If you didn’t, are you kicking yourself again now
But don’t get carried away yet
The 82000 level is not something that can be broken through casually
The rapid pullback after the morning push to 82000 was a clear pressure test
But the key is that the pullback did not break below the weekend low
That means support below is still holding
With a lot of short positions stacked above, it may instead leave room for a continued short squeeze later
For BTC, aggressive support is first at 80500 to 80000
More conservatively, look at 79600
For ETH, focus on 2620 and 2570
So a pullback is not necessarily a bad thing
Without a pullback, where would the low-long opportunity come from
Going forward, the main approach is still to buy low
But don’t chase after a sharp rally, and definitely don’t forget risk control
#Canary二次修订质押SEI现货ETF申请 $ETH

110
·
--
$BTC Don't be fooled by this one bearish candle!!!
#比特币市值超越特斯拉
This sharp drop looks scary
But we’re not at a real trend reversal yet
After a sharp drop, another small rebound is still possible
So if you want to short, don’t rush to chase
It’s more suitable to wait for a rebound to confirm resistance before deciding
For now, it looks more like a pullback after a smaller-scale push higher
As long as BTC holds 78500
And ETH doesn’t break below 2530
The daily bullish structure has not been damaged yet
For BTC, the key range is 79500 to 78300
As long as the previous low is not effectively broken
This pullback still counts as a structural correction
For ETH, keep an eye on 2530 to 2500 and then 2475
If these levels can hold
The bulls still have room to recover further
What’s most worrying now is not a pullback
But a key support level being truly broken through
So don’t let one or two candles throw off your rhythm
Before the key level is broken, don’t rush to change the script
If it really breaks, then reassess the direction
#MichaelSaylor暗示增持BTC $BTC
{future}(BTCUSDT)
$BTC Don't be fooled by this one bearish candle!!!
#比特币市值超越特斯拉
This sharp drop looks scary
But we’re not at a real trend reversal yet
After a sharp drop, another small rebound is still possible
So if you want to short, don’t rush to chase
It’s more suitable to wait for a rebound to confirm resistance before deciding
For now, it looks more like a pullback after a smaller-scale push higher
As long as BTC holds 78500
And ETH doesn’t break below 2530
The daily bullish structure has not been damaged yet
For BTC, the key range is 79500 to 78300
As long as the previous low is not effectively broken
This pullback still counts as a structural correction
For ETH, keep an eye on 2530 to 2500 and then 2475
If these levels can hold
The bulls still have room to recover further
What’s most worrying now is not a pullback
But a key support level being truly broken through
So don’t let one or two candles throw off your rhythm
Before the key level is broken, don’t rush to change the script
If it really breaks, then reassess the direction
#MichaelSaylor暗示增持BTC $BTC
#比特币市值超越特斯拉
This sharp drop looks scary
But we’re not at a real trend reversal yet
After a sharp drop, another small rebound is still possible
So if you want to short, don’t rush to chase
It’s more suitable to wait for a rebound to confirm resistance before deciding
For now, it looks more like a pullback after a smaller-scale push higher
As long as BTC holds 78500
And ETH doesn’t break below 2530
The daily bullish structure has not been damaged yet
For BTC, the key range is 79500 to 78300
As long as the previous low is not effectively broken
This pullback still counts as a structural correction
For ETH, keep an eye on 2530 to 2500 and then 2475
If these levels can hold
The bulls still have room to recover further
What’s most worrying now is not a pullback
But a key support level being truly broken through
So don’t let one or two candles throw off your rhythm
Before the key level is broken, don’t rush to change the script
If it really breaks, then reassess the direction
#MichaelSaylor暗示增持BTC $BTC

5
1k
·
--
$ETH With this one, they wash out another batch of those chasing at the top!
#日本央行加息至31年高位
Don’t be scared by this little callback.
What you really need to focus on now isn’t a single bearish candle.
It’s the defensive zone from 2540 to 2500.
If the main force really wants to shake the market out,
what they most like to do is first stab it downward.
Shake out the late buyers and the unsteady positions.
Then quickly pull it back up.
So pay close attention to the 2540–2500 area.
If the pullback doesn’t break it, the structure hasn’t been damaged yet.
Next, see whether 2600 can be reclaimed and hold firm.
If 2600 can’t hold steadily for a long time,
then continue with the sideways consolidation to digest positions.
If you don’t have a position, don’t rush to chase.
If you do have a position, don’t let a few candlesticks throw off your rhythm.
Hold the 2540–2500 zone.
The bulls still have room to move higher.
But if this defensive zone is effectively broken to the downside,
don’t stubbornly hold on—then the later plan needs to be reassessed.
#比特币突破8万美元大关 $BTC
{future}(BTCUSDT)
$ETH With this one, they wash out another batch of those chasing at the top!
#日本央行加息至31年高位
Don’t be scared by this little callback.
What you really need to focus on now isn’t a single bearish candle.
It’s the defensive zone from 2540 to 2500.
If the main force really wants to shake the market out,
what they most like to do is first stab it downward.
Shake out the late buyers and the unsteady positions.
Then quickly pull it back up.
So pay close attention to the 2540–2500 area.
If the pullback doesn’t break it, the structure hasn’t been damaged yet.
Next, see whether 2600 can be reclaimed and hold firm.
If 2600 can’t hold steadily for a long time,
then continue with the sideways consolidation to digest positions.
If you don’t have a position, don’t rush to chase.
If you do have a position, don’t let a few candlesticks throw off your rhythm.
Hold the 2540–2500 zone.
The bulls still have room to move higher.
But if this defensive zone is effectively broken to the downside,
don’t stubbornly hold on—then the later plan needs to be reassessed.
#比特币突破8万美元大关 $BTC
#日本央行加息至31年高位
Don’t be scared by this little callback.
What you really need to focus on now isn’t a single bearish candle.
It’s the defensive zone from 2540 to 2500.
If the main force really wants to shake the market out,
what they most like to do is first stab it downward.
Shake out the late buyers and the unsteady positions.
Then quickly pull it back up.
So pay close attention to the 2540–2500 area.
If the pullback doesn’t break it, the structure hasn’t been damaged yet.
Next, see whether 2600 can be reclaimed and hold firm.
If 2600 can’t hold steadily for a long time,
then continue with the sideways consolidation to digest positions.
If you don’t have a position, don’t rush to chase.
If you do have a position, don’t let a few candlesticks throw off your rhythm.
Hold the 2540–2500 zone.
The bulls still have room to move higher.
But if this defensive zone is effectively broken to the downside,
don’t stubbornly hold on—then the later plan needs to be reassessed.
#比特币突破8万美元大关 $BTC

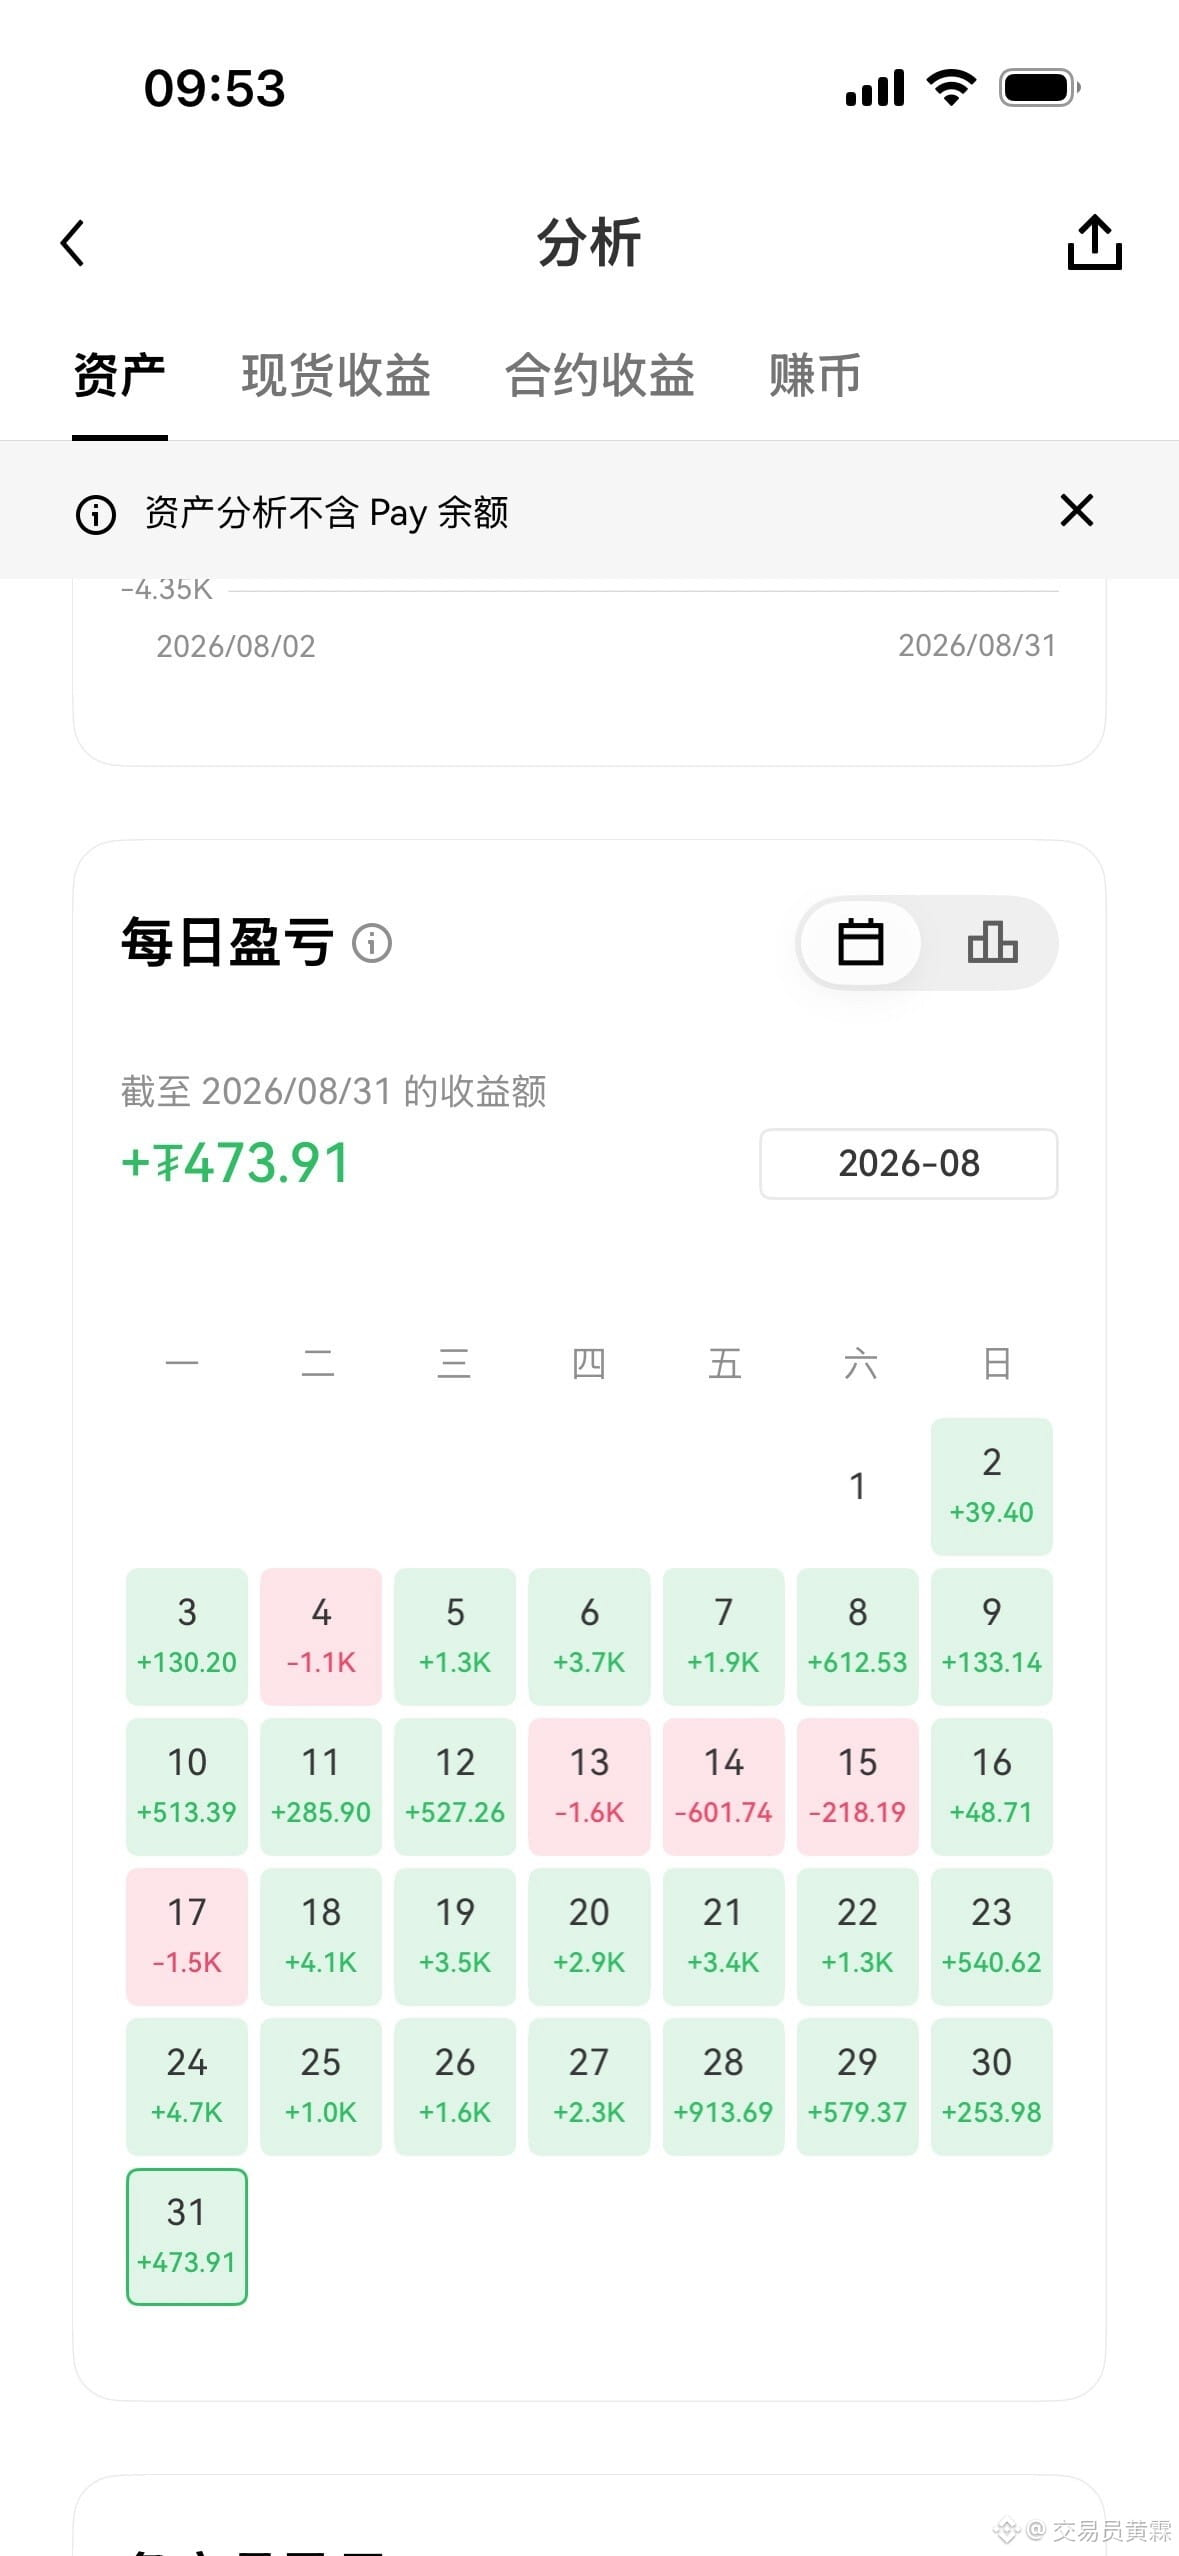
1.1k
·
--
$BTC Something big is coming!!!
#日本央行加息至31年高位
This huge bullish candle isn’t simply fed by good news. It’s because the shorts couldn’t hold on any longer.
I said before: as long as BTC holds 75,000, it will eventually touch 80,000.
Now the high has already surged to around 81,600. The direction has played out—and the speed is even faster than I expected.
Why is it so strong this time?
Most of the bearish factors ahead have basically already played out: the rate-hike expectations, the hawkish dot plot, and regulatory hurdles.
Yet BTC has consistently held the 75,000 to 76,000 zone.
When bad news can’t shake it, the shorts naturally panic first.
On top of that, ETF flows have shifted from outflows to continuous net inflows. Once spot buying comes back, price first breaks above 80,000, and then triggers another round of short covering and stop-losses.
Technicals are also clearly strengthening: on the 4H timeframe, the MA30, 120, and 200 have all been reclaimed; MACD is also expanding with volume. Bulls have regained control.
But I need to pour some cold water here.
81,600 to 82,300 is strong near-term resistance. RSI and KDJ are already in overbought territory.
Chasing higher right now isn’t actually a great risk-reward setup.
Next, focus on three key levels:
Hold above 80,000—then keep looking at 84,000 to 85,000.
If it breaks below 79,000, a structural breakout needs to be reconfirmed. First, we’ll look at 78,000.
If 77,500 is lost again, then this strong structure needs to be reassessed.
So this September move can be viewed as bullish, but the real test is still above 82,000.
Bad news that can’t break it suggests the market’s supply is getting harder to shake.
However, only a volume-supported hold above 82,300 can confirm that the upper upside space is truly opened.
Don’t rush to chase now—wait for the market to show its hand.
#XRP交易所储备创七年新低 $ETH
{future}(ETHUSDT)
$BTC Something big is coming!!!
#日本央行加息至31年高位
This huge bullish candle isn’t simply fed by good news. It’s because the shorts couldn’t hold on any longer.
I said before: as long as BTC holds 75,000, it will eventually touch 80,000.
Now the high has already surged to around 81,600. The direction has played out—and the speed is even faster than I expected.
Why is it so strong this time?
Most of the bearish factors ahead have basically already played out: the rate-hike expectations, the hawkish dot plot, and regulatory hurdles.
Yet BTC has consistently held the 75,000 to 76,000 zone.
When bad news can’t shake it, the shorts naturally panic first.
On top of that, ETF flows have shifted from outflows to continuous net inflows. Once spot buying comes back, price first breaks above 80,000, and then triggers another round of short covering and stop-losses.
Technicals are also clearly strengthening: on the 4H timeframe, the MA30, 120, and 200 have all been reclaimed; MACD is also expanding with volume. Bulls have regained control.
But I need to pour some cold water here.
81,600 to 82,300 is strong near-term resistance. RSI and KDJ are already in overbought territory.
Chasing higher right now isn’t actually a great risk-reward setup.
Next, focus on three key levels:
Hold above 80,000—then keep looking at 84,000 to 85,000.
If it breaks below 79,000, a structural breakout needs to be reconfirmed. First, we’ll look at 78,000.
If 77,500 is lost again, then this strong structure needs to be reassessed.
So this September move can be viewed as bullish, but the real test is still above 82,000.
Bad news that can’t break it suggests the market’s supply is getting harder to shake.
However, only a volume-supported hold above 82,300 can confirm that the upper upside space is truly opened.
Don’t rush to chase now—wait for the market to show its hand.
#XRP交易所储备创七年新低 $ETH
#日本央行加息至31年高位
This huge bullish candle isn’t simply fed by good news. It’s because the shorts couldn’t hold on any longer.
I said before: as long as BTC holds 75,000, it will eventually touch 80,000.
Now the high has already surged to around 81,600. The direction has played out—and the speed is even faster than I expected.
Why is it so strong this time?
Most of the bearish factors ahead have basically already played out: the rate-hike expectations, the hawkish dot plot, and regulatory hurdles.
Yet BTC has consistently held the 75,000 to 76,000 zone.
When bad news can’t shake it, the shorts naturally panic first.
On top of that, ETF flows have shifted from outflows to continuous net inflows. Once spot buying comes back, price first breaks above 80,000, and then triggers another round of short covering and stop-losses.
Technicals are also clearly strengthening: on the 4H timeframe, the MA30, 120, and 200 have all been reclaimed; MACD is also expanding with volume. Bulls have regained control.
But I need to pour some cold water here.
81,600 to 82,300 is strong near-term resistance. RSI and KDJ are already in overbought territory.
Chasing higher right now isn’t actually a great risk-reward setup.
Next, focus on three key levels:
Hold above 80,000—then keep looking at 84,000 to 85,000.
If it breaks below 79,000, a structural breakout needs to be reconfirmed. First, we’ll look at 78,000.
If 77,500 is lost again, then this strong structure needs to be reassessed.
So this September move can be viewed as bullish, but the real test is still above 82,000.
Bad news that can’t break it suggests the market’s supply is getting harder to shake.
However, only a volume-supported hold above 82,300 can confirm that the upper upside space is truly opened.
Don’t rush to chase now—wait for the market to show its hand.
#XRP交易所储备创七年新低 $ETH

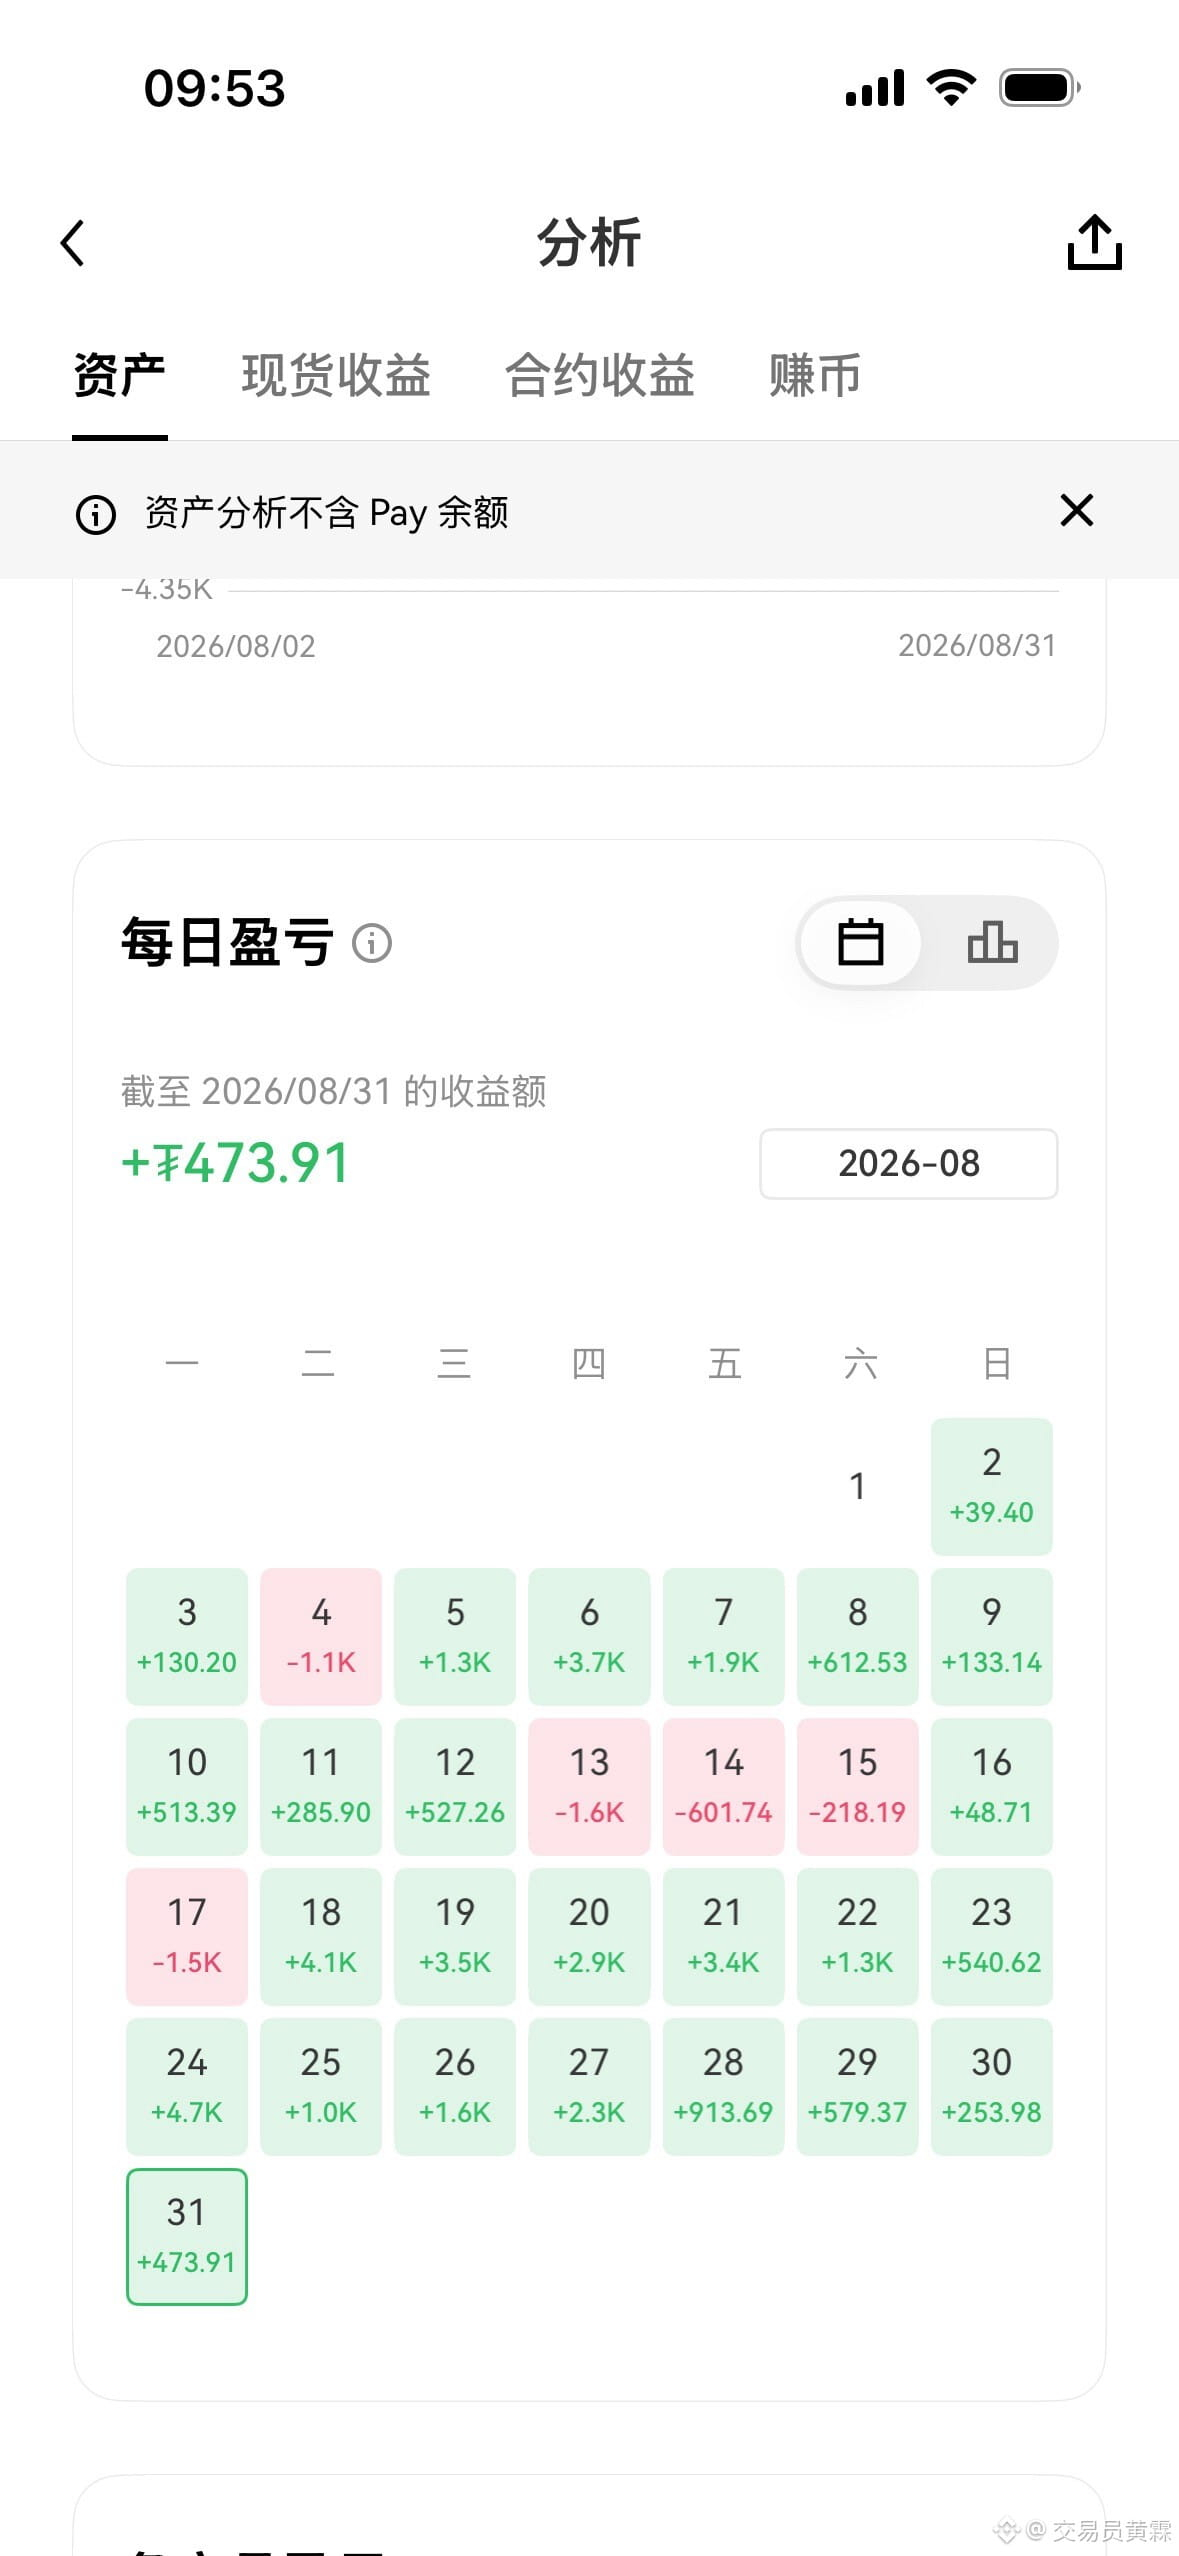
7
124
·
--
$ETH The gap won’t kill you; chasing to the mountaintop is what’s truly deadly #ETH走势分析
Many people always think that earning less feels even worse than losing money—seeing a big bullish candle surge makes them itch to jump in and become a bag-holder.
From 2440, precisely triggered, it shot all the way to 2669—over a couple hundred dollars in profit. That profit should have been realized in stages long ago.
But someone, after the price rose to a high around 2640, asked whether they could still chase—only to immediately receive a brutal pullback.
Trading is a long-distance race. It’s not about who shouts the loudest during the peak; it’s about who can last longer.
At present, the hourly chart has crashed from the high, pulled back, tested around 2577, and formed a nine-turn stop-the-fall pattern.
Looking upward: for the short-term rebound, the first strongest resistance is above 2640; for the ultimate resistance, watch the prior high at 2669.
Looking downward: the most critical intraday support for longs is locked in the range 2570 to 2560—the box.
During the session, the area around 2570 down to 2550 is the healthy technical “re-fill” zone after the earlier main force abruptly surged off-course.
As long as the pullback doesn’t break below 2560, the short-term long upward channel remains intact and unbroken.
Once it breaks that zone, longs will need to retreat to the 2500 whole-number level to rebuild the base.
If you miss the first entry point, be patient and wait for the pullback area to stabilize. Scale in gradually—never place orders based on emotion.
Control your position size strictly, set your stop-loss properly, and follow the trading rules. Only then can uncertain market moves be turned into certain profit $BTC #比特币突破8万美元大关
{future}(BTCUSDT)
$ETH The gap won’t kill you; chasing to the mountaintop is what’s truly deadly #ETH走势分析
Many people always think that earning less feels even worse than losing money—seeing a big bullish candle surge makes them itch to jump in and become a bag-holder.
From 2440, precisely triggered, it shot all the way to 2669—over a couple hundred dollars in profit. That profit should have been realized in stages long ago.
But someone, after the price rose to a high around 2640, asked whether they could still chase—only to immediately receive a brutal pullback.
Trading is a long-distance race. It’s not about who shouts the loudest during the peak; it’s about who can last longer.
At present, the hourly chart has crashed from the high, pulled back, tested around 2577, and formed a nine-turn stop-the-fall pattern.
Looking upward: for the short-term rebound, the first strongest resistance is above 2640; for the ultimate resistance, watch the prior high at 2669.
Looking downward: the most critical intraday support for longs is locked in the range 2570 to 2560—the box.
During the session, the area around 2570 down to 2550 is the healthy technical “re-fill” zone after the earlier main force abruptly surged off-course.
As long as the pullback doesn’t break below 2560, the short-term long upward channel remains intact and unbroken.
Once it breaks that zone, longs will need to retreat to the 2500 whole-number level to rebuild the base.
If you miss the first entry point, be patient and wait for the pullback area to stabilize. Scale in gradually—never place orders based on emotion.
Control your position size strictly, set your stop-loss properly, and follow the trading rules. Only then can uncertain market moves be turned into certain profit $BTC #比特币突破8万美元大关
Many people always think that earning less feels even worse than losing money—seeing a big bullish candle surge makes them itch to jump in and become a bag-holder.
From 2440, precisely triggered, it shot all the way to 2669—over a couple hundred dollars in profit. That profit should have been realized in stages long ago.
But someone, after the price rose to a high around 2640, asked whether they could still chase—only to immediately receive a brutal pullback.
Trading is a long-distance race. It’s not about who shouts the loudest during the peak; it’s about who can last longer.
At present, the hourly chart has crashed from the high, pulled back, tested around 2577, and formed a nine-turn stop-the-fall pattern.
Looking upward: for the short-term rebound, the first strongest resistance is above 2640; for the ultimate resistance, watch the prior high at 2669.
Looking downward: the most critical intraday support for longs is locked in the range 2570 to 2560—the box.
During the session, the area around 2570 down to 2550 is the healthy technical “re-fill” zone after the earlier main force abruptly surged off-course.
As long as the pullback doesn’t break below 2560, the short-term long upward channel remains intact and unbroken.
Once it breaks that zone, longs will need to retreat to the 2500 whole-number level to rebuild the base.
If you miss the first entry point, be patient and wait for the pullback area to stabilize. Scale in gradually—never place orders based on emotion.
Control your position size strictly, set your stop-loss properly, and follow the trading rules. Only then can uncertain market moves be turned into certain profit $BTC #比特币突破8万美元大关

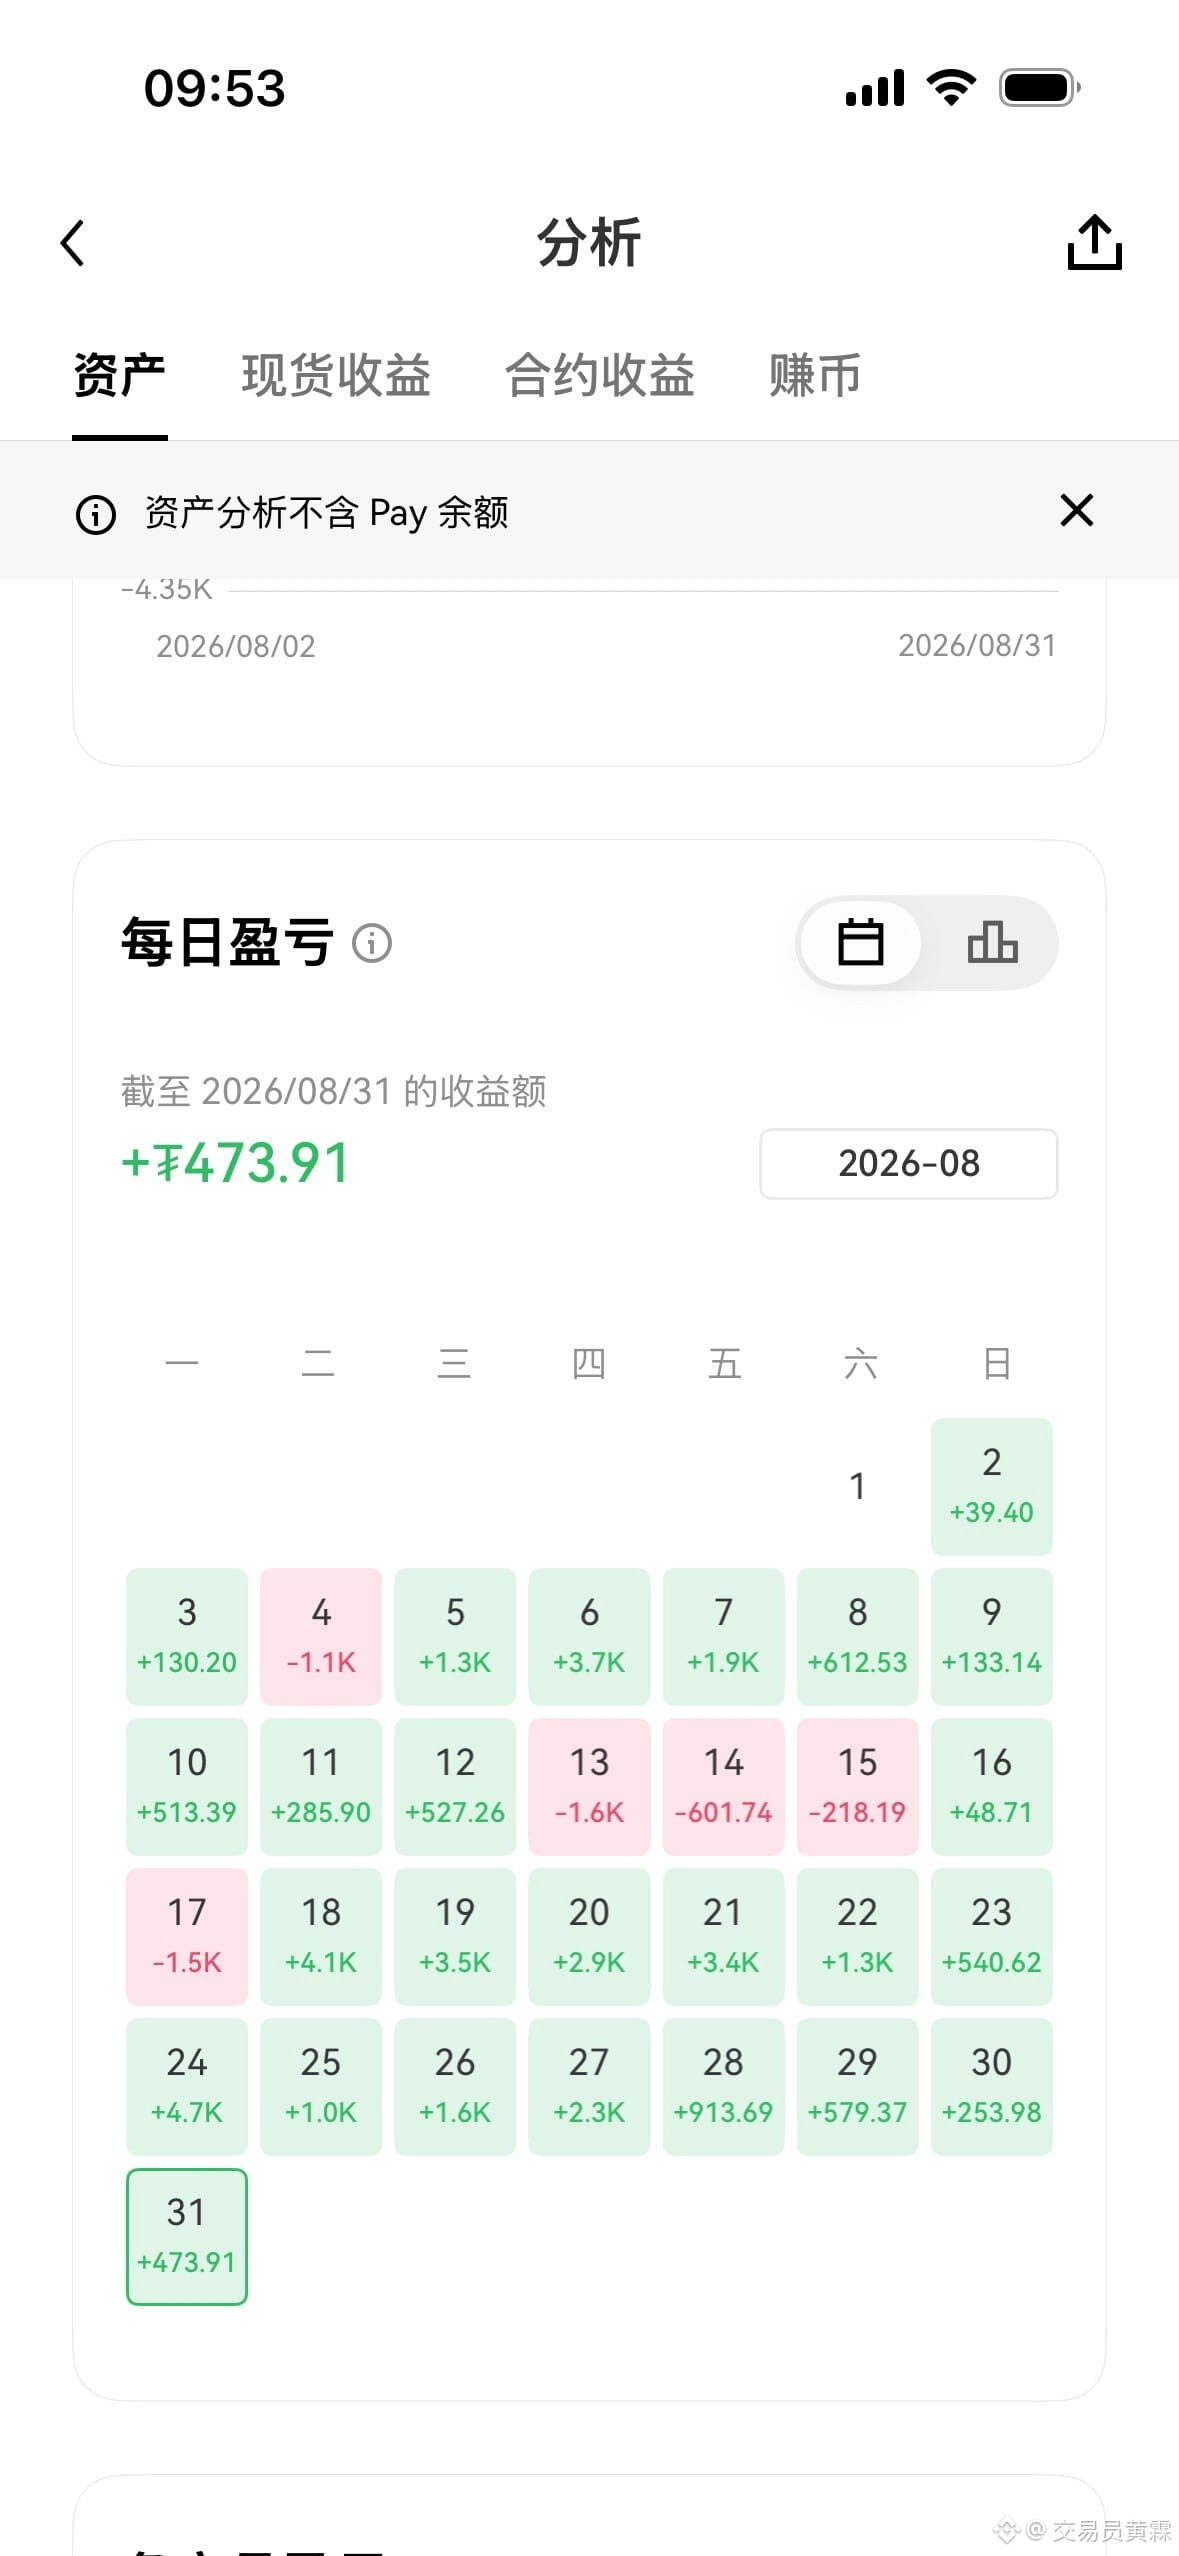
8
915
·
--
$BTC That’s just too intense!!!
#巴菲特卸任伯克希尔董事长
This big pancake’s weekly candle—yes, it’s a bit beyond expectations
It directly swallows the previous consolidation range in one go, and the market sentiment is completely ignited
Now everywhere you hear bullish voices, and even people have started calling for new highs
But at this level, I still have to pour a bucket of cold water
81000 is not a place to chase longs recklessly—it’s a very crucial resistance level right now
From the lows all the way to here, the bulls have already continuously released a huge amount of momentum
If they want to push higher, first they have to truly hold above 81000
If there’s a breakout above 81000 with increased volume, then there’ll be a chance to keep looking at 83000–85000
But if they try several times and still can’t hold, be careful about consolidation at high levels or even a pullback
Especially since it’s still the weekend—market liquidity and new incremental capital may be limited
Under these conditions, achieving consecutive breaks above key resistance naturally becomes harder
So in the short term, I’m more focused on whether 81000 can truly hold
If it holds, then we can continue looking at upside room
If it doesn’t hold, don’t rush to chase—wait for the pullback and confirmation first
Over the weekend, you especially need to guard against the price being whipped around at high levels—don’t let a big bullish candle carry your emotions along
$ETH #比特币突破8万美元大关
$BTC That’s just too intense!!!
#巴菲特卸任伯克希尔董事长
This big pancake’s weekly candle—yes, it’s a bit beyond expectations
It directly swallows the previous consolidation range in one go, and the market sentiment is completely ignited
Now everywhere you hear bullish voices, and even people have started calling for new highs
But at this level, I still have to pour a bucket of cold water
81000 is not a place to chase longs recklessly—it’s a very crucial resistance level right now
From the lows all the way to here, the bulls have already continuously released a huge amount of momentum
If they want to push higher, first they have to truly hold above 81000
If there’s a breakout above 81000 with increased volume, then there’ll be a chance to keep looking at 83000–85000
But if they try several times and still can’t hold, be careful about consolidation at high levels or even a pullback
Especially since it’s still the weekend—market liquidity and new incremental capital may be limited
Under these conditions, achieving consecutive breaks above key resistance naturally becomes harder
So in the short term, I’m more focused on whether 81000 can truly hold
If it holds, then we can continue looking at upside room
If it doesn’t hold, don’t rush to chase—wait for the pullback and confirmation first
Over the weekend, you especially need to guard against the price being whipped around at high levels—don’t let a big bullish candle carry your emotions along
$ETH #比特币突破8万美元大关
#巴菲特卸任伯克希尔董事长
This big pancake’s weekly candle—yes, it’s a bit beyond expectations
It directly swallows the previous consolidation range in one go, and the market sentiment is completely ignited
Now everywhere you hear bullish voices, and even people have started calling for new highs
But at this level, I still have to pour a bucket of cold water
81000 is not a place to chase longs recklessly—it’s a very crucial resistance level right now
From the lows all the way to here, the bulls have already continuously released a huge amount of momentum
If they want to push higher, first they have to truly hold above 81000
If there’s a breakout above 81000 with increased volume, then there’ll be a chance to keep looking at 83000–85000
But if they try several times and still can’t hold, be careful about consolidation at high levels or even a pullback
Especially since it’s still the weekend—market liquidity and new incremental capital may be limited
Under these conditions, achieving consecutive breaks above key resistance naturally becomes harder
So in the short term, I’m more focused on whether 81000 can truly hold
If it holds, then we can continue looking at upside room
If it doesn’t hold, don’t rush to chase—wait for the pullback and confirmation first
Over the weekend, you especially need to guard against the price being whipped around at high levels—don’t let a big bullish candle carry your emotions along
$ETH #比特币突破8万美元大关

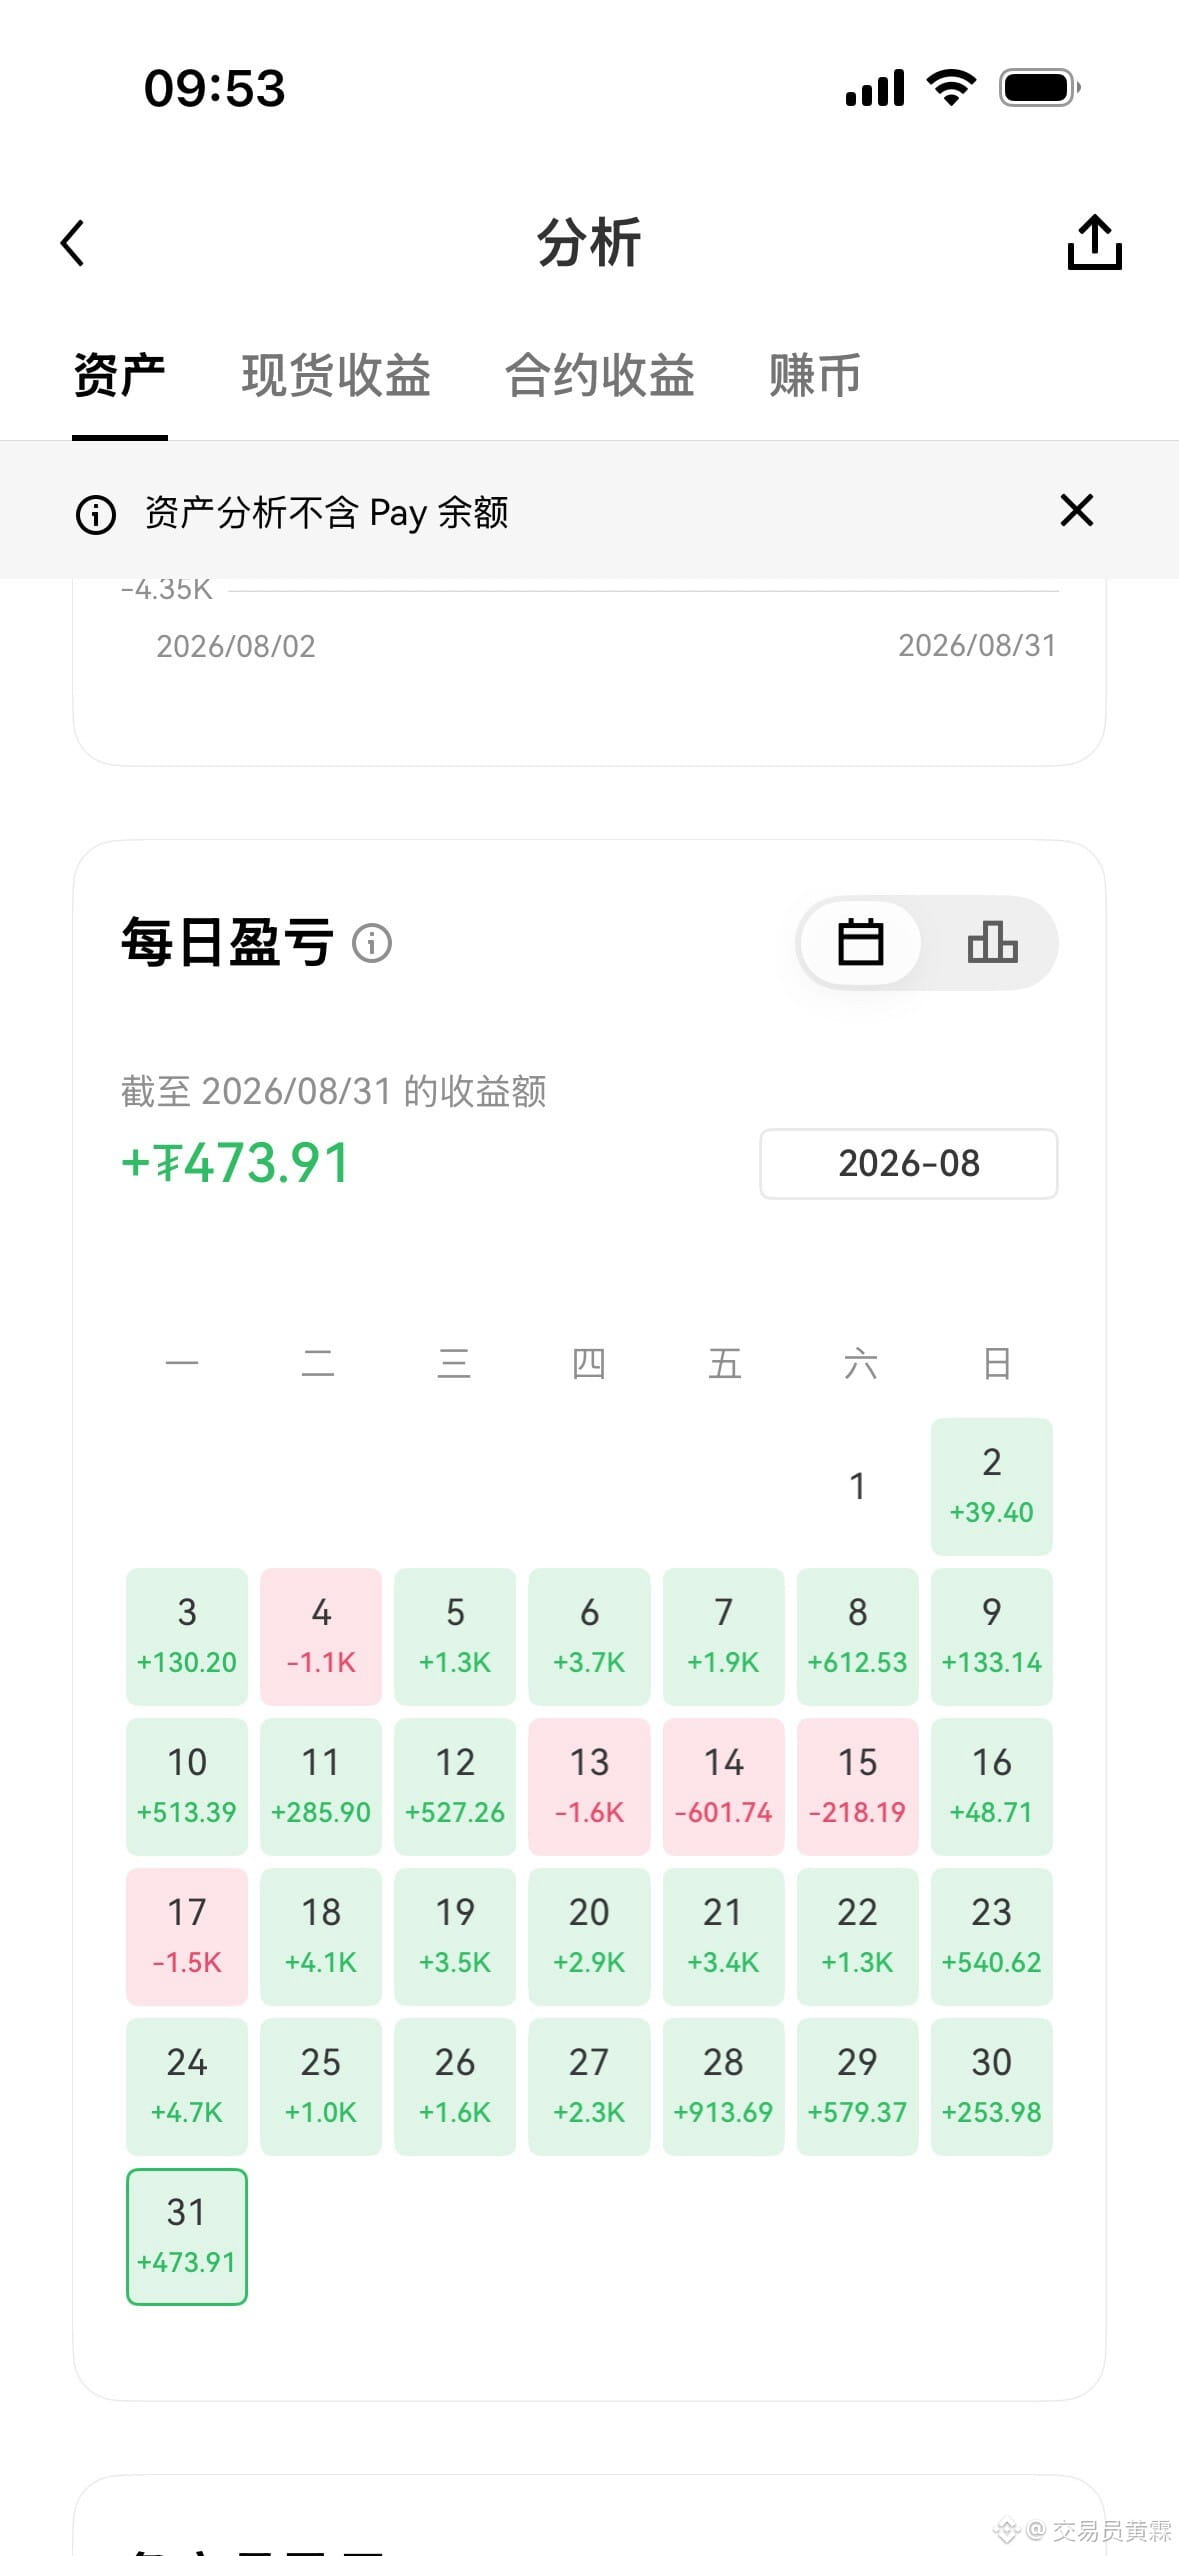
6
737
·
--
The big one of $BTC is coming!!!
Big cake is pushing all the way from around 75,000 to 81,000
With more than 6,000 points of room, how many people just got cut on the floor and, turned around, can only watch it take off
Brothers who piled on long positions this round—are you enjoying the profit now?
But when it’s this fast and explosive, you must not get carried away
On the weekend, first keep an eye on the previous high above; last night it was only a few hundred points away from it
If in the next couple of days it can directly break through, then this area could become a new starting point
When this market goes crazy, it really doesn’t follow any logic
But for the short term, you still need to guard against pullbacks
First look around 80,600
If it can hold here, then keep looking for opportunities to break above
If 80,600 breaks down, then watch for consolidation/acceptance around 79,000–78,000
The logic is actually simple
As long as the key levels don’t break, pullbacks are a chance to go long at the lows
If the key level breaks down, don’t be stubborn
After a big bullish candle, don’t chase at the top; and don’t randomly cut just because you’re scared
The market can be wild, but your trading must stay calm
$ETH #以太坊重回2600美元
The big one of $BTC is coming!!!
Big cake is pushing all the way from around 75,000 to 81,000
With more than 6,000 points of room, how many people just got cut on the floor and, turned around, can only watch it take off
Brothers who piled on long positions this round—are you enjoying the profit now?
But when it’s this fast and explosive, you must not get carried away
On the weekend, first keep an eye on the previous high above; last night it was only a few hundred points away from it
If in the next couple of days it can directly break through, then this area could become a new starting point
When this market goes crazy, it really doesn’t follow any logic
But for the short term, you still need to guard against pullbacks
First look around 80,600
If it can hold here, then keep looking for opportunities to break above
If 80,600 breaks down, then watch for consolidation/acceptance around 79,000–78,000
The logic is actually simple
As long as the key levels don’t break, pullbacks are a chance to go long at the lows
If the key level breaks down, don’t be stubborn
After a big bullish candle, don’t chase at the top; and don’t randomly cut just because you’re scared
The market can be wild, but your trading must stay calm
$ETH #以太坊重回2600美元
Big cake is pushing all the way from around 75,000 to 81,000
With more than 6,000 points of room, how many people just got cut on the floor and, turned around, can only watch it take off
Brothers who piled on long positions this round—are you enjoying the profit now?
But when it’s this fast and explosive, you must not get carried away
On the weekend, first keep an eye on the previous high above; last night it was only a few hundred points away from it
If in the next couple of days it can directly break through, then this area could become a new starting point
When this market goes crazy, it really doesn’t follow any logic
But for the short term, you still need to guard against pullbacks
First look around 80,600
If it can hold here, then keep looking for opportunities to break above
If 80,600 breaks down, then watch for consolidation/acceptance around 79,000–78,000
The logic is actually simple
As long as the key levels don’t break, pullbacks are a chance to go long at the lows
If the key level breaks down, don’t be stubborn
After a big bullish candle, don’t chase at the top; and don’t randomly cut just because you’re scared
The market can be wild, but your trading must stay calm
$ETH #以太坊重回2600美元

5
760
·
--
$BTC Is the big pancake market going crazy this wave?
#比特币突破8万美元大关
One big bullish candle directly swallows up half a month of consolidation
Can’t you see what kind of market this is?
I already said before: if 75,000 doesn’t break down effectively, the long-side structure won’t easily die
That drop to 74,900—how many people got thrown off the train directly
And then it just pulled right back up
Around 75,600, continue low-buy and follow along—doesn’t it feel comfortable now?
ETH isn’t idle either. It pushed from around 2,370 all the way to above 2,600; those who followed already have meat in the bag
But today is the weekend—don’t get overexcited just because it surged hard yesterday
After a consecutive run-up, short-term indicators need to be repaired; a pullback isn’t necessarily a bad thing
It may even be giving people who didn’t get in yet another chance to board
For BTC, focus on these levels below: 78,500, 77,500, 76,500
Wait for the pullback to stabilize, then look for another low-buy opportunity
Above, 80,000, 82,000, and 84,000 are all resistance zones
Until it breaks through, don’t get carried away—and don’t chase just because you see a big bullish candle
For ETH below, focus on 2,520, 2,470, 2,420
A small pullback: watch for support/acceptance; a deeper pullback: watch for opportunity
But whether you’re long or short, control your position size and stop-loss
The market can go crazy, but your position size can’t
$ETH #以太坊重回2600美元
{future}(ETHUSDT)
$BTC Is the big pancake market going crazy this wave?
#比特币突破8万美元大关
One big bullish candle directly swallows up half a month of consolidation
Can’t you see what kind of market this is?
I already said before: if 75,000 doesn’t break down effectively, the long-side structure won’t easily die
That drop to 74,900—how many people got thrown off the train directly
And then it just pulled right back up
Around 75,600, continue low-buy and follow along—doesn’t it feel comfortable now?
ETH isn’t idle either. It pushed from around 2,370 all the way to above 2,600; those who followed already have meat in the bag
But today is the weekend—don’t get overexcited just because it surged hard yesterday
After a consecutive run-up, short-term indicators need to be repaired; a pullback isn’t necessarily a bad thing
It may even be giving people who didn’t get in yet another chance to board
For BTC, focus on these levels below: 78,500, 77,500, 76,500
Wait for the pullback to stabilize, then look for another low-buy opportunity
Above, 80,000, 82,000, and 84,000 are all resistance zones
Until it breaks through, don’t get carried away—and don’t chase just because you see a big bullish candle
For ETH below, focus on 2,520, 2,470, 2,420
A small pullback: watch for support/acceptance; a deeper pullback: watch for opportunity
But whether you’re long or short, control your position size and stop-loss
The market can go crazy, but your position size can’t
$ETH #以太坊重回2600美元
#比特币突破8万美元大关
One big bullish candle directly swallows up half a month of consolidation
Can’t you see what kind of market this is?
I already said before: if 75,000 doesn’t break down effectively, the long-side structure won’t easily die
That drop to 74,900—how many people got thrown off the train directly
And then it just pulled right back up
Around 75,600, continue low-buy and follow along—doesn’t it feel comfortable now?
ETH isn’t idle either. It pushed from around 2,370 all the way to above 2,600; those who followed already have meat in the bag
But today is the weekend—don’t get overexcited just because it surged hard yesterday
After a consecutive run-up, short-term indicators need to be repaired; a pullback isn’t necessarily a bad thing
It may even be giving people who didn’t get in yet another chance to board
For BTC, focus on these levels below: 78,500, 77,500, 76,500
Wait for the pullback to stabilize, then look for another low-buy opportunity
Above, 80,000, 82,000, and 84,000 are all resistance zones
Until it breaks through, don’t get carried away—and don’t chase just because you see a big bullish candle
For ETH below, focus on 2,520, 2,470, 2,420
A small pullback: watch for support/acceptance; a deeper pullback: watch for opportunity
But whether you’re long or short, control your position size and stop-loss
The market can go crazy, but your position size can’t
$ETH #以太坊重回2600美元

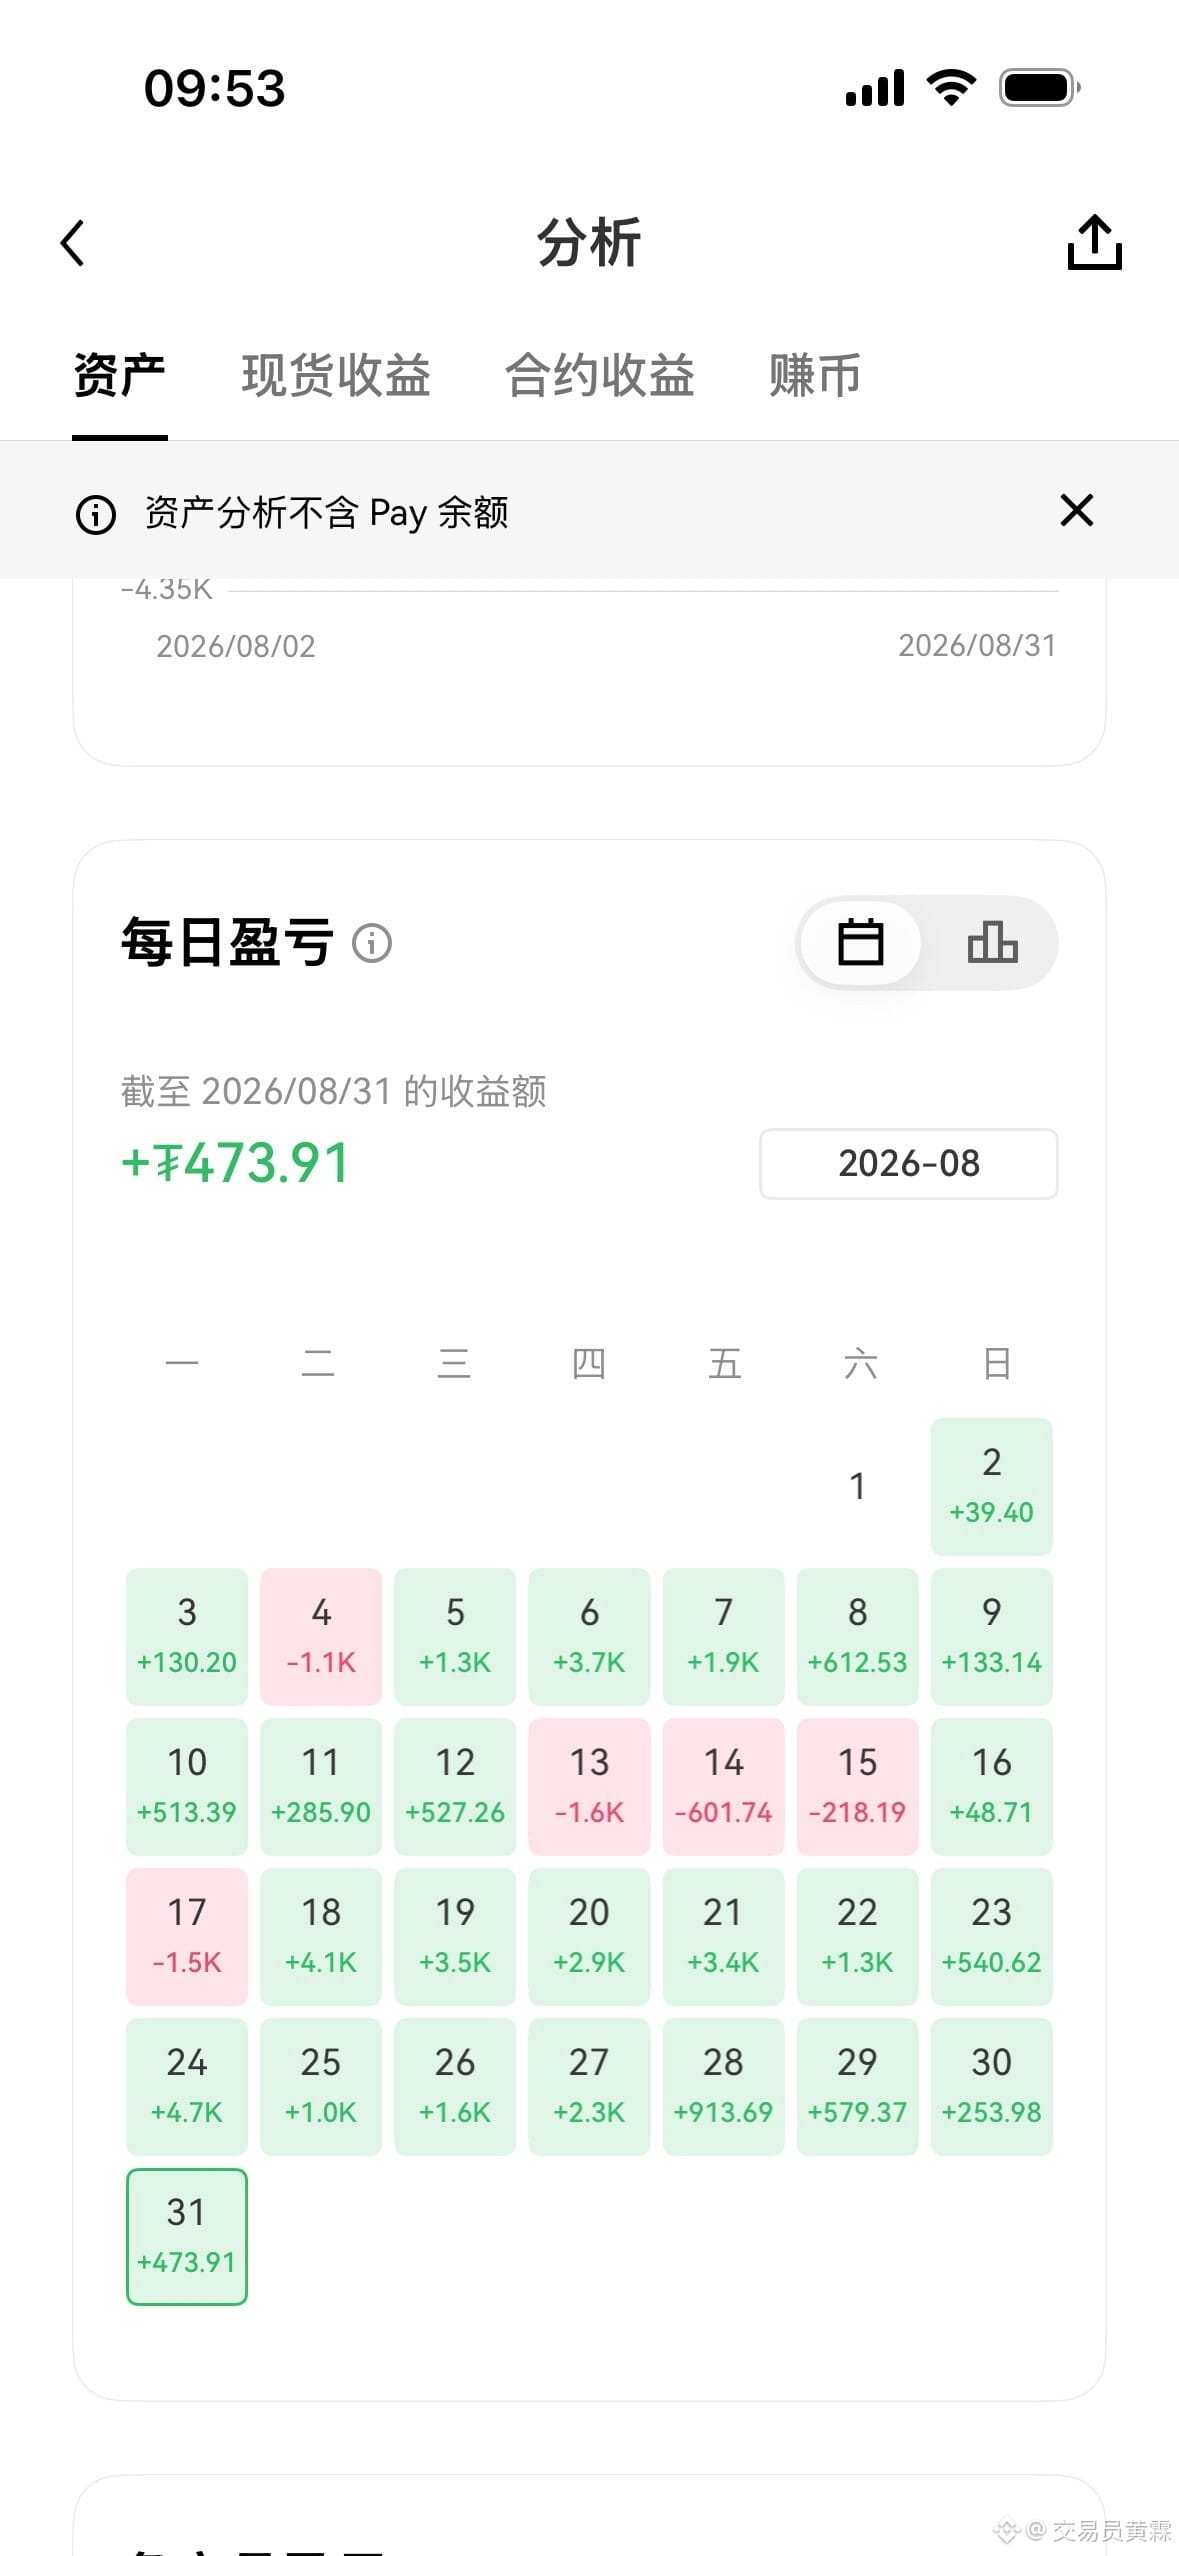
8
14
20.9k
·
--
$SNDK Broke through three resistance levels in one go—still daring to short?!!!
#闪迪将于9月21日纳入标普100
Still waiting for the pullback to buy… This move was directly pulled up by the main force in a straight line, leaving even the scalp tingling with shock.
The coin price started from 1640 and with a single towering candle it pierced through the 1700 channel line, forcing its way into the heavy purple pressure zone.
This surge with high volume and a bullish long candle not only tore apart the short-sellers’ line of defense—it also threw the late “missed the train” crowd far behind.
After topping out and touching the 1815 high, it’s currently consolidating with very strong turnover around the 1780 high zone.
Looking upward: the first short-term resistance is the needle-tip area from 1810 to 1820 where the 9-turn signal was just printed.
As long as the bulls can increase volume and break through 1820, the next big target will be aimed directly at the 1850 box ceiling.
Looking downward: the first intraday defense support is to tightly watch the 1750 line—the lower platform edge of the purple box.
During the session, the range from 1750 to 1720 is the fill/re-entry area after a top-bottom role swap following a breakout above the upper rail of the prior uptrend line.
As long as the pullback does not break below the 1720 “lifeline,” the bull’s main upswing single-direction structure remains as solid as a rock.
For extreme downside support, retreat to the 1650 to 1620 zone, where the moving averages are accelerating upward.
In a strong market, it never gives low-price holders the chance to keep a passive bottom position. Firmly protect stops, and let profits run.
Off-exchange funds: don’t blindly chase at the 1780 high. Wait patiently until the pullback area is confirmed, then enter in batches. $MU $SKHYNIX #比特币市值超越特斯拉
{future}(SKHYNIXUSDT)
{future}(MUUSDT)
$SNDK Broke through three resistance levels in one go—still daring to short?!!!
#闪迪将于9月21日纳入标普100
Still waiting for the pullback to buy… This move was directly pulled up by the main force in a straight line, leaving even the scalp tingling with shock.
The coin price started from 1640 and with a single towering candle it pierced through the 1700 channel line, forcing its way into the heavy purple pressure zone.
This surge with high volume and a bullish long candle not only tore apart the short-sellers’ line of defense—it also threw the late “missed the train” crowd far behind.
After topping out and touching the 1815 high, it’s currently consolidating with very strong turnover around the 1780 high zone.
Looking upward: the first short-term resistance is the needle-tip area from 1810 to 1820 where the 9-turn signal was just printed.
As long as the bulls can increase volume and break through 1820, the next big target will be aimed directly at the 1850 box ceiling.
Looking downward: the first intraday defense support is to tightly watch the 1750 line—the lower platform edge of the purple box.
During the session, the range from 1750 to 1720 is the fill/re-entry area after a top-bottom role swap following a breakout above the upper rail of the prior uptrend line.
As long as the pullback does not break below the 1720 “lifeline,” the bull’s main upswing single-direction structure remains as solid as a rock.
For extreme downside support, retreat to the 1650 to 1620 zone, where the moving averages are accelerating upward.
In a strong market, it never gives low-price holders the chance to keep a passive bottom position. Firmly protect stops, and let profits run.
Off-exchange funds: don’t blindly chase at the 1780 high. Wait patiently until the pullback area is confirmed, then enter in batches. $MU $SKHYNIX #比特币市值超越特斯拉
#闪迪将于9月21日纳入标普100
Still waiting for the pullback to buy… This move was directly pulled up by the main force in a straight line, leaving even the scalp tingling with shock.
The coin price started from 1640 and with a single towering candle it pierced through the 1700 channel line, forcing its way into the heavy purple pressure zone.
This surge with high volume and a bullish long candle not only tore apart the short-sellers’ line of defense—it also threw the late “missed the train” crowd far behind.
After topping out and touching the 1815 high, it’s currently consolidating with very strong turnover around the 1780 high zone.
Looking upward: the first short-term resistance is the needle-tip area from 1810 to 1820 where the 9-turn signal was just printed.
As long as the bulls can increase volume and break through 1820, the next big target will be aimed directly at the 1850 box ceiling.
Looking downward: the first intraday defense support is to tightly watch the 1750 line—the lower platform edge of the purple box.
During the session, the range from 1750 to 1720 is the fill/re-entry area after a top-bottom role swap following a breakout above the upper rail of the prior uptrend line.
As long as the pullback does not break below the 1720 “lifeline,” the bull’s main upswing single-direction structure remains as solid as a rock.
For extreme downside support, retreat to the 1650 to 1620 zone, where the moving averages are accelerating upward.
In a strong market, it never gives low-price holders the chance to keep a passive bottom position. Firmly protect stops, and let profits run.
Off-exchange funds: don’t blindly chase at the 1780 high. Wait patiently until the pullback area is confirmed, then enter in batches. $MU $SKHYNIX #比特币市值超越特斯拉
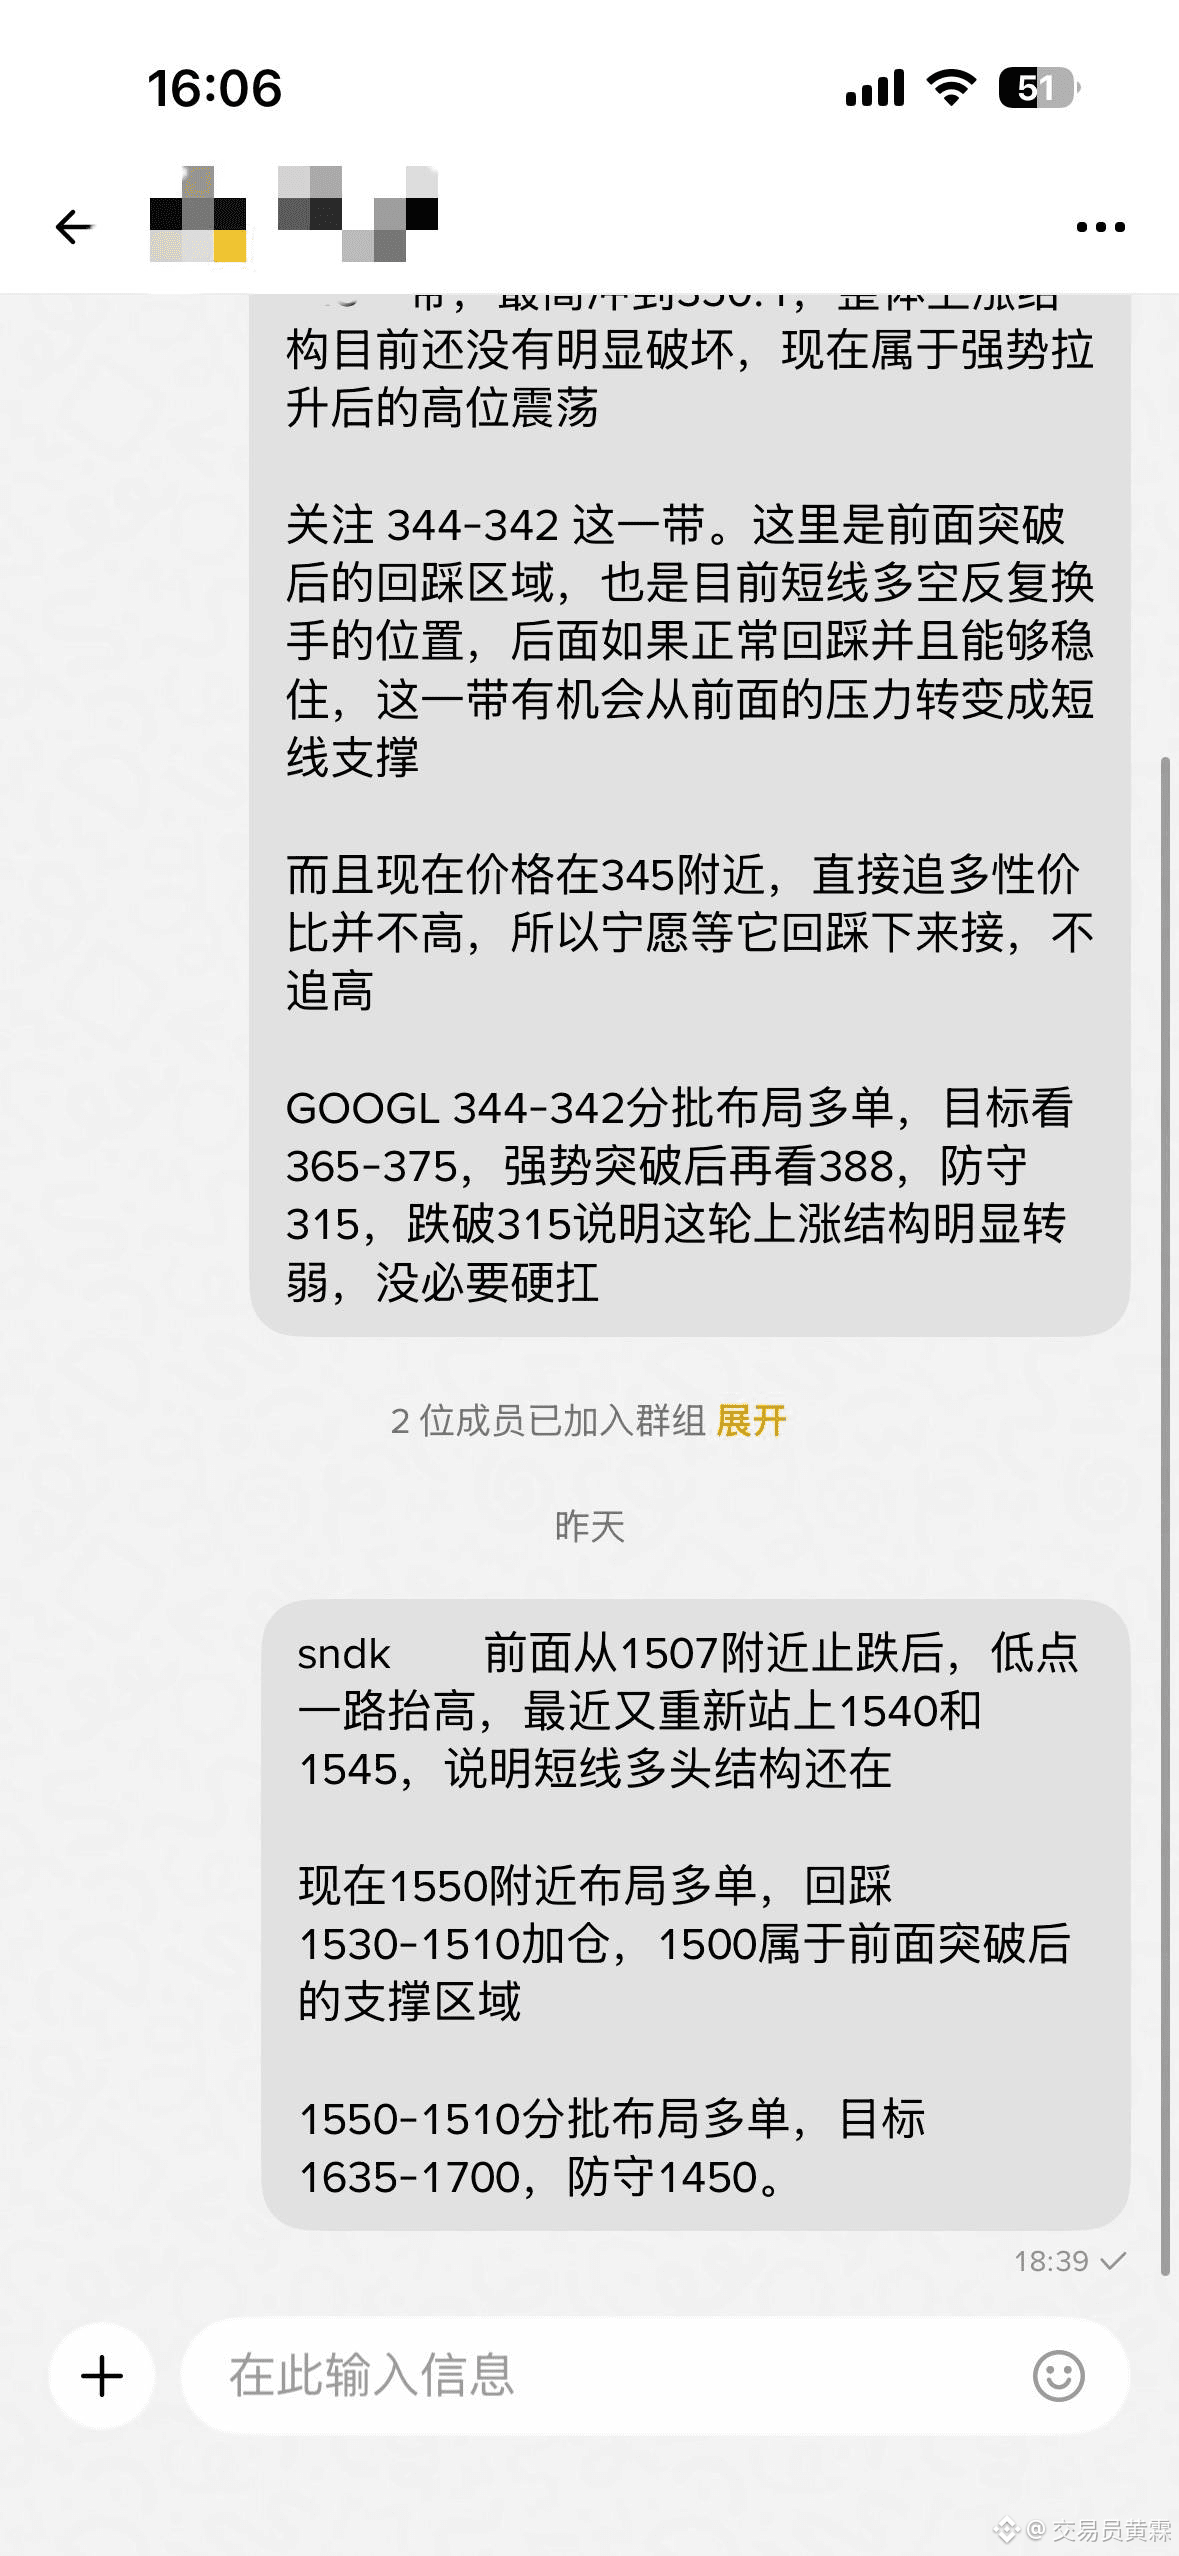
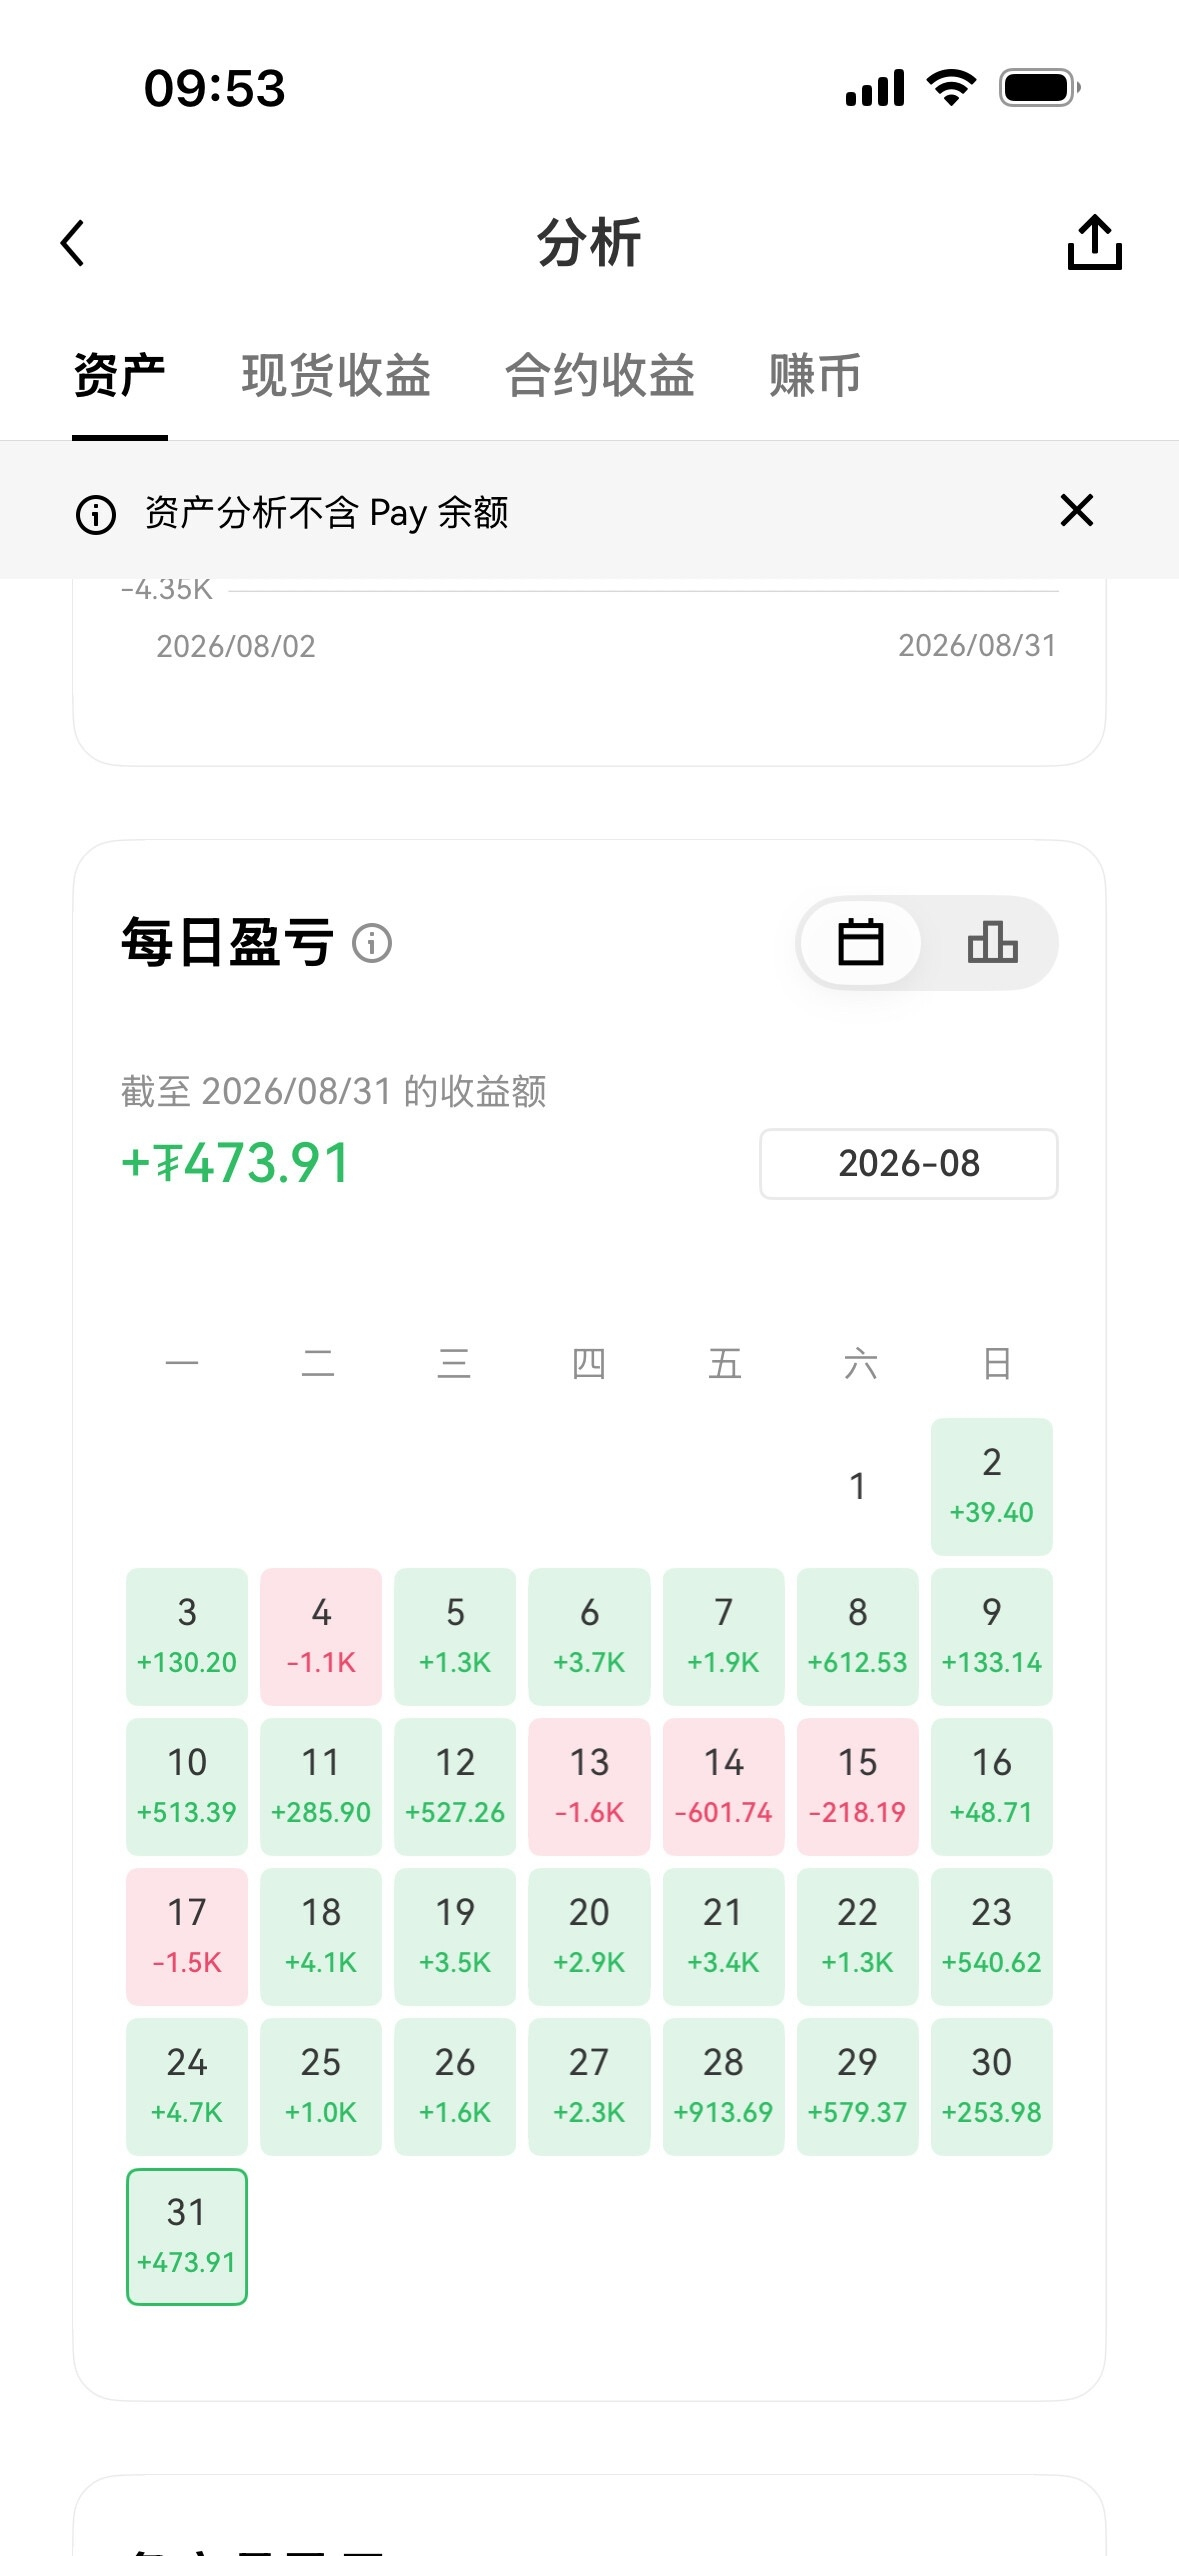
6
2
1.3k
Log in to explore more content
Join global crypto users on Binance Square
⚡️ Get latest and useful information about crypto.
💬 Trusted by the world’s largest crypto exchange.
👍 Discover real insights from verified creators.
Email / Phone number
Trending Topics
CircleMints500MUSDCOnSolana
74,849 views
1,728 Discussing
#circlemints500musdconsolana
🚨 $500M USDC MINTED ON SOLANA! 💵🔥
Circle Treasury just minted 500M USDC on Solana, pushing total global supply to $75.2B! 📈✨
💡 Quick Reality Check:
🔹 Minting = Fresh Inventory Creation (Not instant buying power!🛒
🔹 Real Trigger = Capital Deployment into DeFi, Exchanges & Pools! 🌐🚀
🎯 Coins to Watch:
⚡ $SOL — Network activity is booming, and fresh liquidity continues to drive ecosystem growth!
💎 $RARE — A high-volatility altcoin that reacts fast to fresh market liquidity and sentiment!🪐
💥 Are you accumulating now or waiting for full capital deployment? Drop your thoughts below! 👇✨
#CircleMints500MUSDCOnSolana
#PolymarketBankFailureBetsDrawFDICConcern
#BlackRockBuildsTokenizedPortfoliosForOndo
#BitwiseFilesToListNEARETFOnNYSEArca
Hifza Rubab
·4 Likes
·4.3k views
PolymarketBankFailureBetsDrawFDICConcern
81,217 views
1,624 Discussing
BlackRockBuildsTokenizedPortfoliosForOndo
70,470 views
1,151 Discussing