
李铁锤
198 Posts

李铁锤
专注于现货二级市场与Web3,所有推文不做投资建议。"Web3世界,每一次变革都是一次财富的重新分配。"
Open Trade
Frequent Trader
3 Years
62 Following
3.7K+ Followers
596 Liked
Posts
Portfolio
All
Quotes
PINNED
Quantitative Trading Live Account: @李铁锤AI量化
📈 Live stream of real trading—sharing the genuine quantitative trading process, no stock-picking/ultimatums, no empty promises.
Live stream content: ✅ Live quantitative trading demonstrations
✅ Strategy development ideas and risk-control logic
✅ Sharing experience in automated trading
✅ Strategy writing / customized services / leasing—exchange and discussion
✅ Online Q&A—feel free to connect and learn
💬 If you don’t understand quant trading, that’s totally fine—welcome to learn together and grow together.
🎁 If you need Binance fee rebates of 40%, want cooperation on quant strategies, or are looking for strategy development/customization/leasing, feel free to message me privately.
If you have any of the above needs, you can also message me directly, or join the group chat on my profile—let’s discuss, learn, and share experiences together
📈 Live stream of real trading—sharing the genuine quantitative trading process, no stock-picking/ultimatums, no empty promises.
Live stream content: ✅ Live quantitative trading demonstrations
✅ Strategy development ideas and risk-control logic
✅ Sharing experience in automated trading
✅ Strategy writing / customized services / leasing—exchange and discussion
✅ Online Q&A—feel free to connect and learn
💬 If you don’t understand quant trading, that’s totally fine—welcome to learn together and grow together.
🎁 If you need Binance fee rebates of 40%, want cooperation on quant strategies, or are looking for strategy development/customization/leasing, feel free to message me privately.
If you have any of the above needs, you can also message me directly, or join the group chat on my profile—let’s discuss, learn, and share experiences together

大吉大利!
From 李铁锤
[Top 10 Crypto Traders’ Daily Watchlist | BTC September 6]
[Morning BTC]
Daan Crypto Trades (@DaanCrypto, 2026-09-05) said BTC funding rates have turned negative, and price is attempting to break through a key higher-timeframe level; Trader XO (@Trader_XO, 2026-09-04) saw BTC facing resistance after a push higher, around the 365-day rolling VWAP and prior high supply zone; Ted Pillows (@TedPillows, 2026-09-05) believes BTC must first reclaim the 50W MA and print a higher high around 83000 before it has a chance to continue toward 85000.
My editorial scenario: BTC is currently around 79768. The main path is still to reclaim 80000 first, then watch 83000; if 83000 holds, there is room for further extension toward 85000. If it breaks below 79000 and loses 78000, this scenario becomes invalid. A bearish funding rate does not mean price will drop immediately; do not use excessive leverage, and do not treat this scenario as a guarantee. Are you more focused on a reclaim of 80000, or confirmation above 83000? #BTC #ETH #BNB
[Morning BTC]
Daan Crypto Trades (@DaanCrypto, 2026-09-05) said BTC funding rates have turned negative, and price is attempting to break through a key higher-timeframe level; Trader XO (@Trader_XO, 2026-09-04) saw BTC facing resistance after a push higher, around the 365-day rolling VWAP and prior high supply zone; Ted Pillows (@TedPillows, 2026-09-05) believes BTC must first reclaim the 50W MA and print a higher high around 83000 before it has a chance to continue toward 85000.
My editorial scenario: BTC is currently around 79768. The main path is still to reclaim 80000 first, then watch 83000; if 83000 holds, there is room for further extension toward 85000. If it breaks below 79000 and loses 78000, this scenario becomes invalid. A bearish funding rate does not mean price will drop immediately; do not use excessive leverage, and do not treat this scenario as a guarantee. Are you more focused on a reclaim of 80000, or confirmation above 83000? #BTC #ETH #BNB
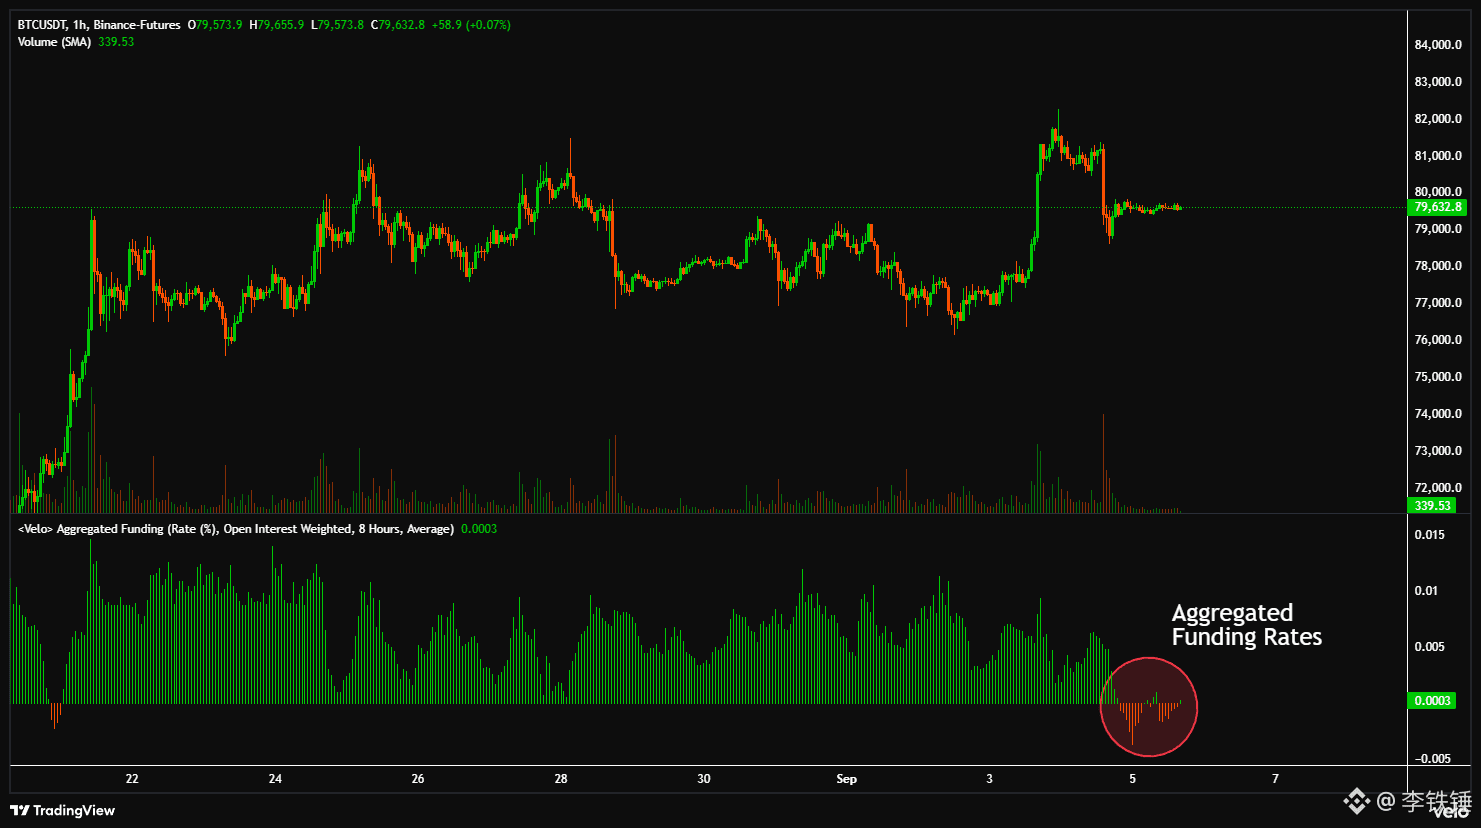
【Top 10 Crypto Traders' Watchlist Today | BTC Sep 5】
Original views:
1) Daan Crypto Trades @DaanCrypto (Sep 4) said BTC is still trading below the May high and a liquidity cluster; a break above could trigger a higher squeeze.
2) Ted Pillows @TedPillows (Sep 5) framed the question into two paths: will Bitcoin hit 85000 first, or 75000 first.
Editorial scenario:
BTC is currently around 79636, down about 1.7% over the past 24 hours. Today we are only watching one main path: first hold the 78660-79000 retest zone, then look toward 85000; if 78660 is lost, it means the rebound has failed, the path is invalidated, and we look back to 75000 first.
Risk reminder:
A retest does not mean it must rise. Do not stubbornly hold leveraged positions. If the invalidation level is hit, admit the mistake.
#BTC #ETH #BNB
Original views:
1) Daan Crypto Trades @DaanCrypto (Sep 4) said BTC is still trading below the May high and a liquidity cluster; a break above could trigger a higher squeeze.
2) Ted Pillows @TedPillows (Sep 5) framed the question into two paths: will Bitcoin hit 85000 first, or 75000 first.
Editorial scenario:
BTC is currently around 79636, down about 1.7% over the past 24 hours. Today we are only watching one main path: first hold the 78660-79000 retest zone, then look toward 85000; if 78660 is lost, it means the rebound has failed, the path is invalidated, and we look back to 75000 first.
Risk reminder:
A retest does not mean it must rise. Do not stubbornly hold leveraged positions. If the invalidation level is hit, admit the mistake.
#BTC #ETH #BNB
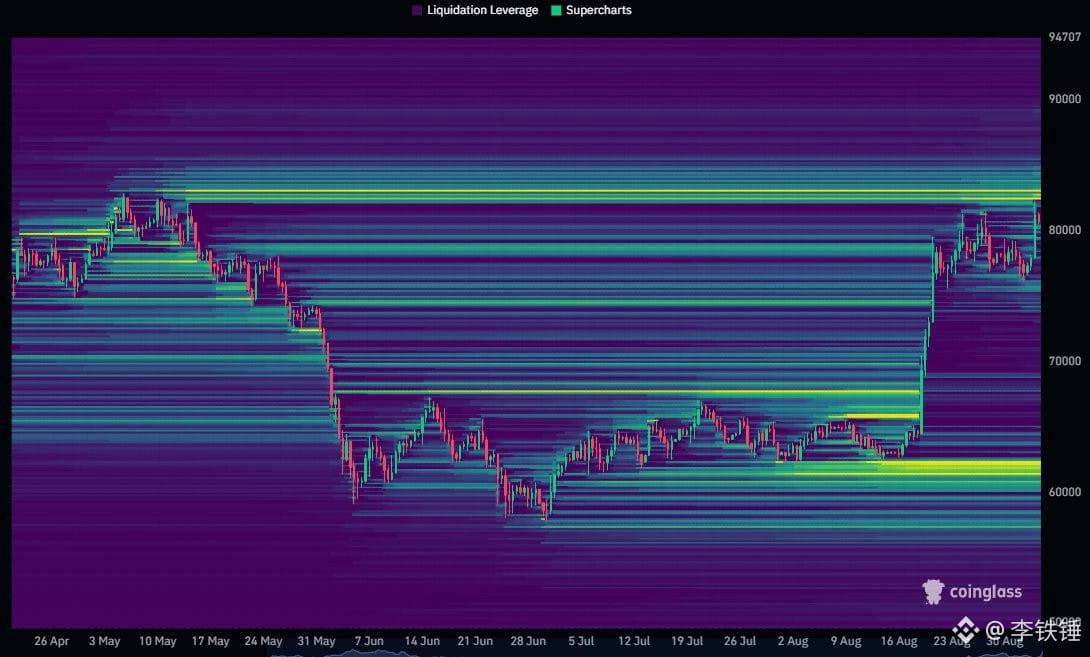
[Top 10 Crypto Traders’ Highlights Today|BTC September 3]
Don’t rush to treat the morning rebound as a new bull market; the key is still 83,000.
Original view:
1. Daan Crypto Trades (@DaanCrypto) says BTC has already broken through multiple weekly levels, but it hasn’t yet formed a new higher weekly high; for an objective confirmation that all timeframes have turned back to bullish, it needs to reclaim the May high—above 83,000. If it later pulls back, 73,000—74,000 is the main support.
2. Cheds (@BigCheds) reminds that BTC’s daily trend is weakening/slumping, meaning short-term momentum hasn’t fully aligned yet—so you can’t just chase highs based on a weekly breakout.
Real-time data: 2026-09-03 07:38 CST, BTCUSDT current price 77,136, 24h high 77,792, low 76,264, 24h change -0.527%, funding rate 0.006561%.
Editor’s scenario: Only one route is provided—if BTC can’t break and hold above 78,000—80,000 with volume, treat the rebound in the morning as being capped by resistance; then focus on whether 74,000—73,000 can attract buyers. If it successfully holds above 83,000, this cautious route is invalidated, and the probability of the weekly trend turning stronger rises.
Risk warning: This is not a trading call, and it doesn’t guarantee direction. Leverage will amplify the risk of spikes and funding-rate risk—think through the invalidation level first before considering an entry.
Do you care more about the confirmation of 83,000, or the pullback to 74,000—73,000?
#BTC #ETH #BNB
Don’t rush to treat the morning rebound as a new bull market; the key is still 83,000.
Original view:
1. Daan Crypto Trades (@DaanCrypto) says BTC has already broken through multiple weekly levels, but it hasn’t yet formed a new higher weekly high; for an objective confirmation that all timeframes have turned back to bullish, it needs to reclaim the May high—above 83,000. If it later pulls back, 73,000—74,000 is the main support.
2. Cheds (@BigCheds) reminds that BTC’s daily trend is weakening/slumping, meaning short-term momentum hasn’t fully aligned yet—so you can’t just chase highs based on a weekly breakout.
Real-time data: 2026-09-03 07:38 CST, BTCUSDT current price 77,136, 24h high 77,792, low 76,264, 24h change -0.527%, funding rate 0.006561%.
Editor’s scenario: Only one route is provided—if BTC can’t break and hold above 78,000—80,000 with volume, treat the rebound in the morning as being capped by resistance; then focus on whether 74,000—73,000 can attract buyers. If it successfully holds above 83,000, this cautious route is invalidated, and the probability of the weekly trend turning stronger rises.
Risk warning: This is not a trading call, and it doesn’t guarantee direction. Leverage will amplify the risk of spikes and funding-rate risk—think through the invalidation level first before considering an entry.
Do you care more about the confirmation of 83,000, or the pullback to 74,000—73,000?
#BTC #ETH #BNB
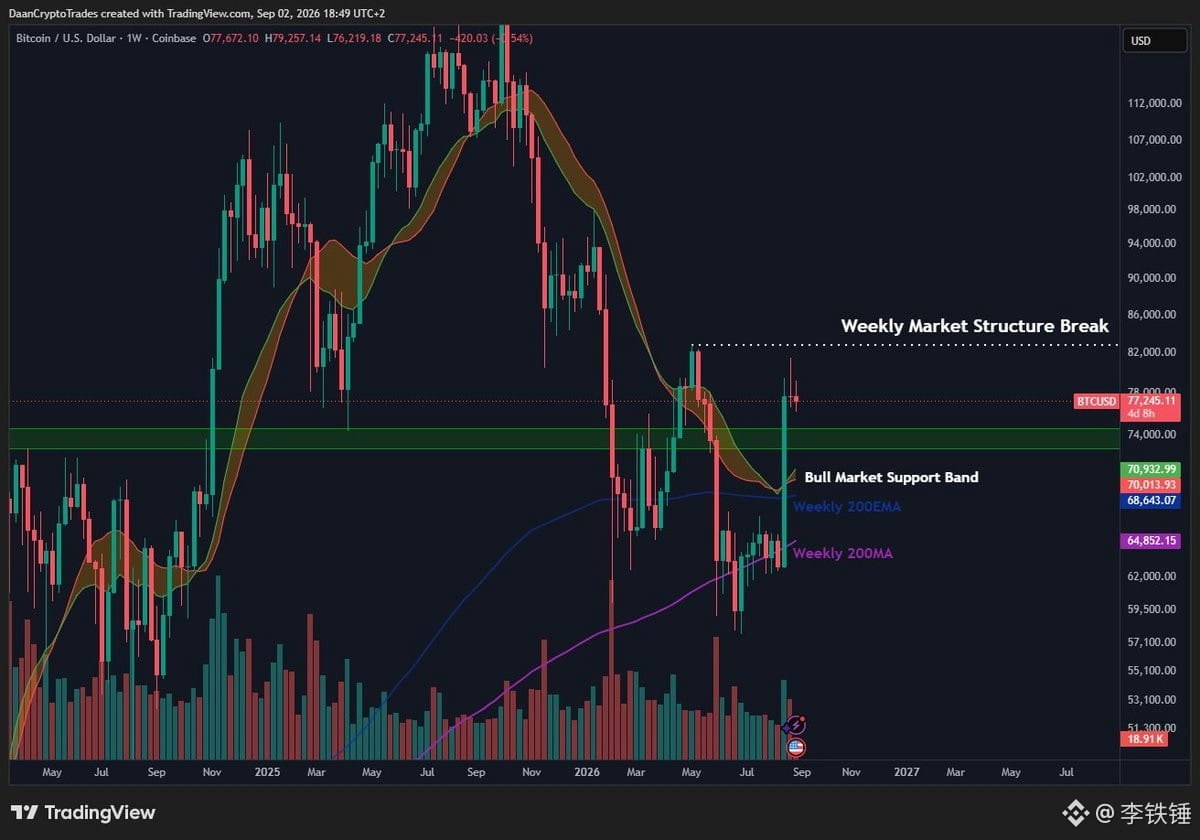
【Top 10 Crypto Traders’ Highlights Today|BTC September 2】
DaanCrypto @DaanCrypto: BTC is still holding the lower end of the range; the pullback looks clean.
DonAlt @DonAlt: It has already closed above resistance; the strong support is just below the current price.
BigCheds @BigCheds: The daily RSI has left the bullish zone, and momentum is starting to cool.
Editor’s scenario: Tonight we only watch one main path—first see whether the 76400-76500 area can hold. If it holds, then look for a rebound and repair in the 77400-77700 range. If the 4H close breaks below 76400, the rebound is invalid and the outlook turns weaker. Current price is about 76613, with a 24H change of -1.67%. This is suitable for people with light positions who can tolerate volatility—don’t chase leverage higher; if it’s a false break, it will be over quickly. Do you think it holds or breaks down? #BTC #ETH #BNB
DaanCrypto @DaanCrypto: BTC is still holding the lower end of the range; the pullback looks clean.
DonAlt @DonAlt: It has already closed above resistance; the strong support is just below the current price.
BigCheds @BigCheds: The daily RSI has left the bullish zone, and momentum is starting to cool.
Editor’s scenario: Tonight we only watch one main path—first see whether the 76400-76500 area can hold. If it holds, then look for a rebound and repair in the 77400-77700 range. If the 4H close breaks below 76400, the rebound is invalid and the outlook turns weaker. Current price is about 76613, with a 24H change of -1.67%. This is suitable for people with light positions who can tolerate volatility—don’t chase leverage higher; if it’s a false break, it will be over quickly. Do you think it holds or breaks down? #BTC #ETH #BNB
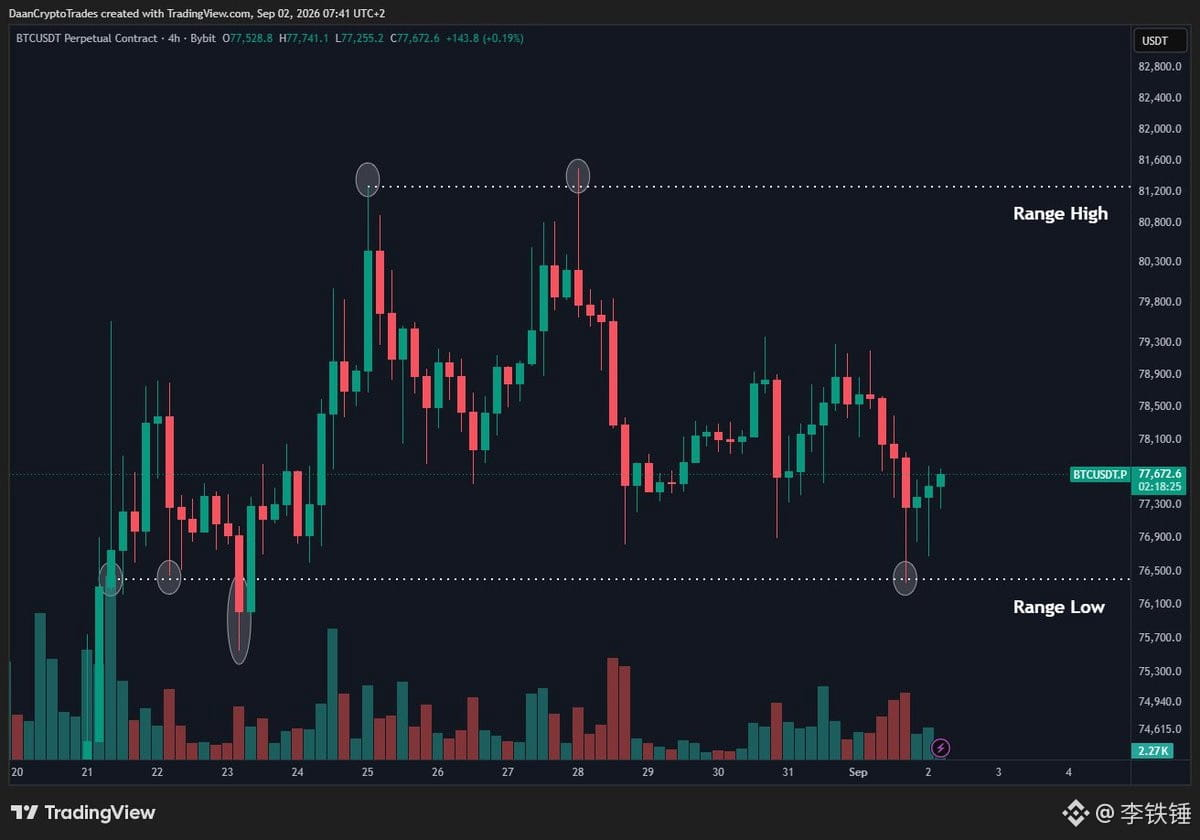
[Top 10 Crypto Traders’ Highlights Today|BTC August 31]
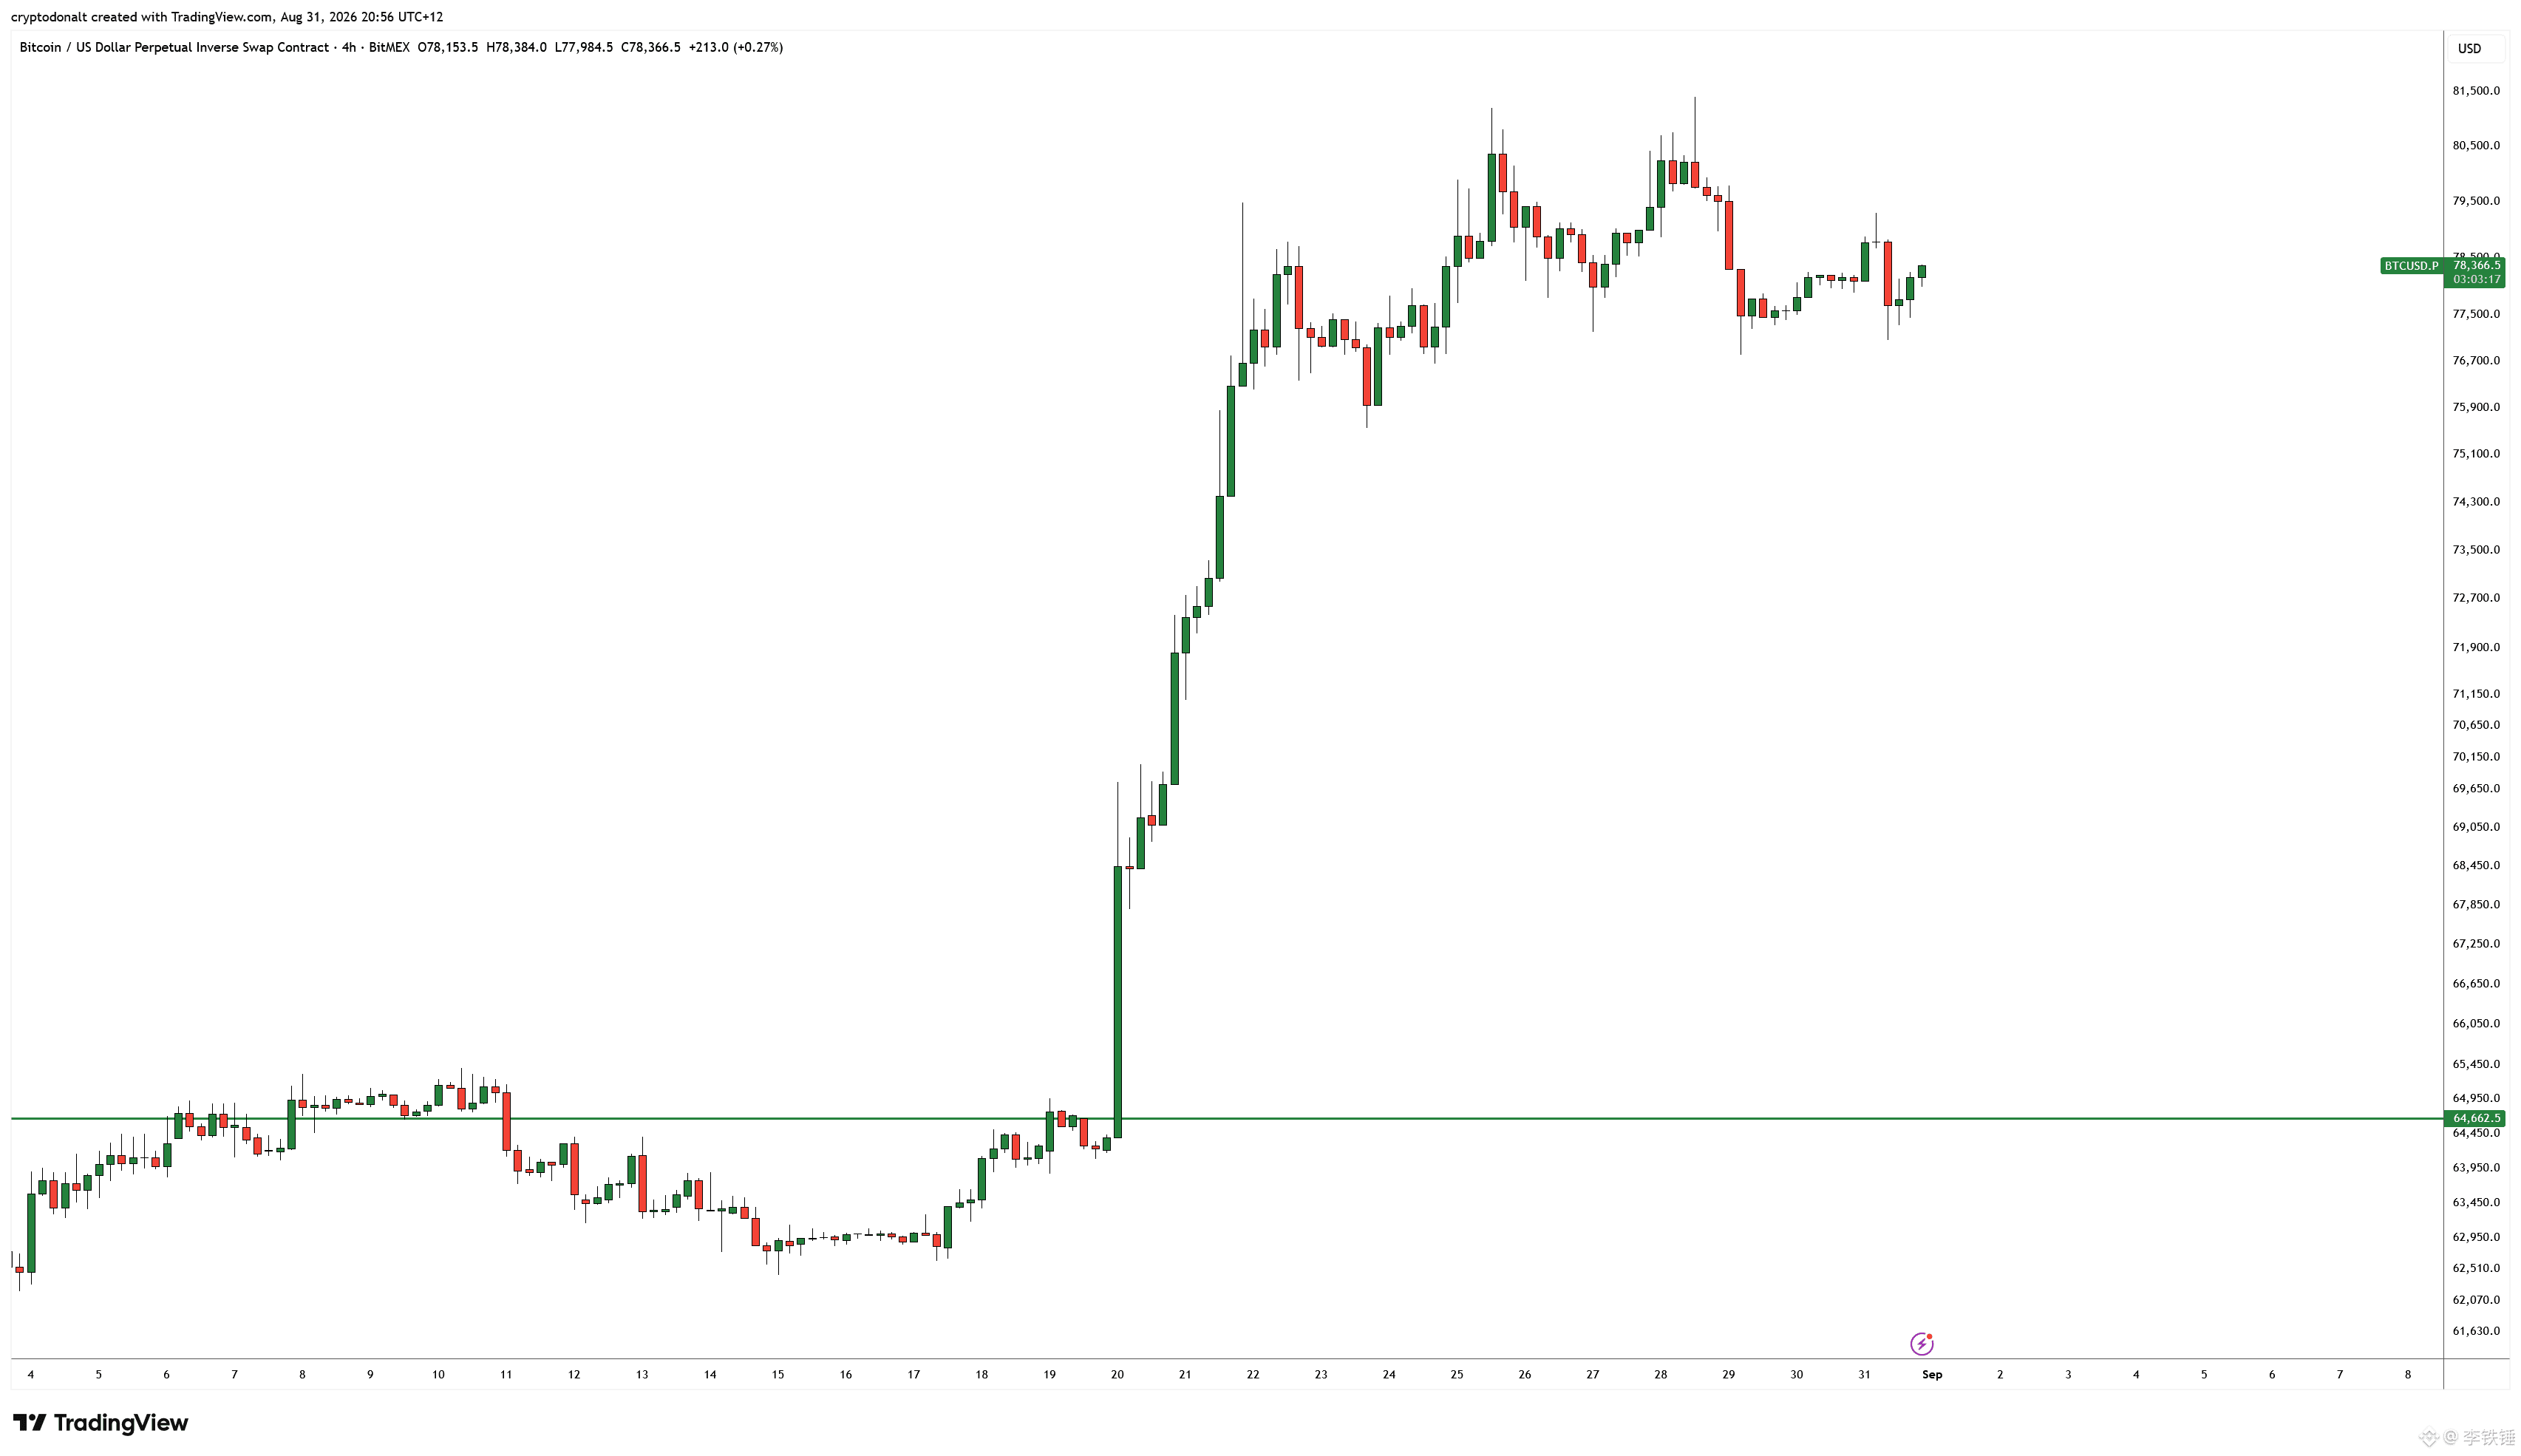
Today, BTC isn’t “rallying to die”; it’s more like building strong consolidation above 77,000.
1)DonAlt @DonAlt:His latest chart is directly captioned “Looks like we’re gonna get another leg up soon.” The 4-hour BTC has been lifted from the lows to above 78,000, and the bullish structure hasn’t broken.
2)DaanCrypto @DaanCrypto:He first mentioned that Saylor may have bought more bitcoin again this week; earlier, his BTC 2-year MA chart also serves as a reminder that the price is still near the value zone.
3)Trader_XO @Trader_XO:He emphasized that for a sustained bull market, you need the price to hold above the 500K curve and form a multi-week/month trend. Until it’s established, it can only be treated as consolidation.
Editor’s scenario: Current price is 78,376. The main plan is to first hold 77,000, then attempt 79,400. If it breaks out and holds with volume, then watch 80,000/81,000. The invalidation condition is a drop below 77,000 and a return to below 76,000—indicating this upswing failed, so control risk first. Would you rather wait for a pullback, or wait for the breakout?
#BTC #ETH #BNB
Today, BTC isn’t “rallying to die”; it’s more like building strong consolidation above 77,000.
1)DonAlt @DonAlt:His latest chart is directly captioned “Looks like we’re gonna get another leg up soon.” The 4-hour BTC has been lifted from the lows to above 78,000, and the bullish structure hasn’t broken.
2)DaanCrypto @DaanCrypto:He first mentioned that Saylor may have bought more bitcoin again this week; earlier, his BTC 2-year MA chart also serves as a reminder that the price is still near the value zone.
3)Trader_XO @Trader_XO:He emphasized that for a sustained bull market, you need the price to hold above the 500K curve and form a multi-week/month trend. Until it’s established, it can only be treated as consolidation.
Editor’s scenario: Current price is 78,376. The main plan is to first hold 77,000, then attempt 79,400. If it breaks out and holds with volume, then watch 80,000/81,000. The invalidation condition is a drop below 77,000 and a return to below 76,000—indicating this upswing failed, so control risk first. Would you rather wait for a pullback, or wait for the breakout?
#BTC #ETH #BNB
【Top 10 Crypto Traders’ Highlights Today|ETH August 31】
For the midday ETH setup, don’t chase—first see whether 2400 can hold and act as the rebound starting point.
Traders’ original take:
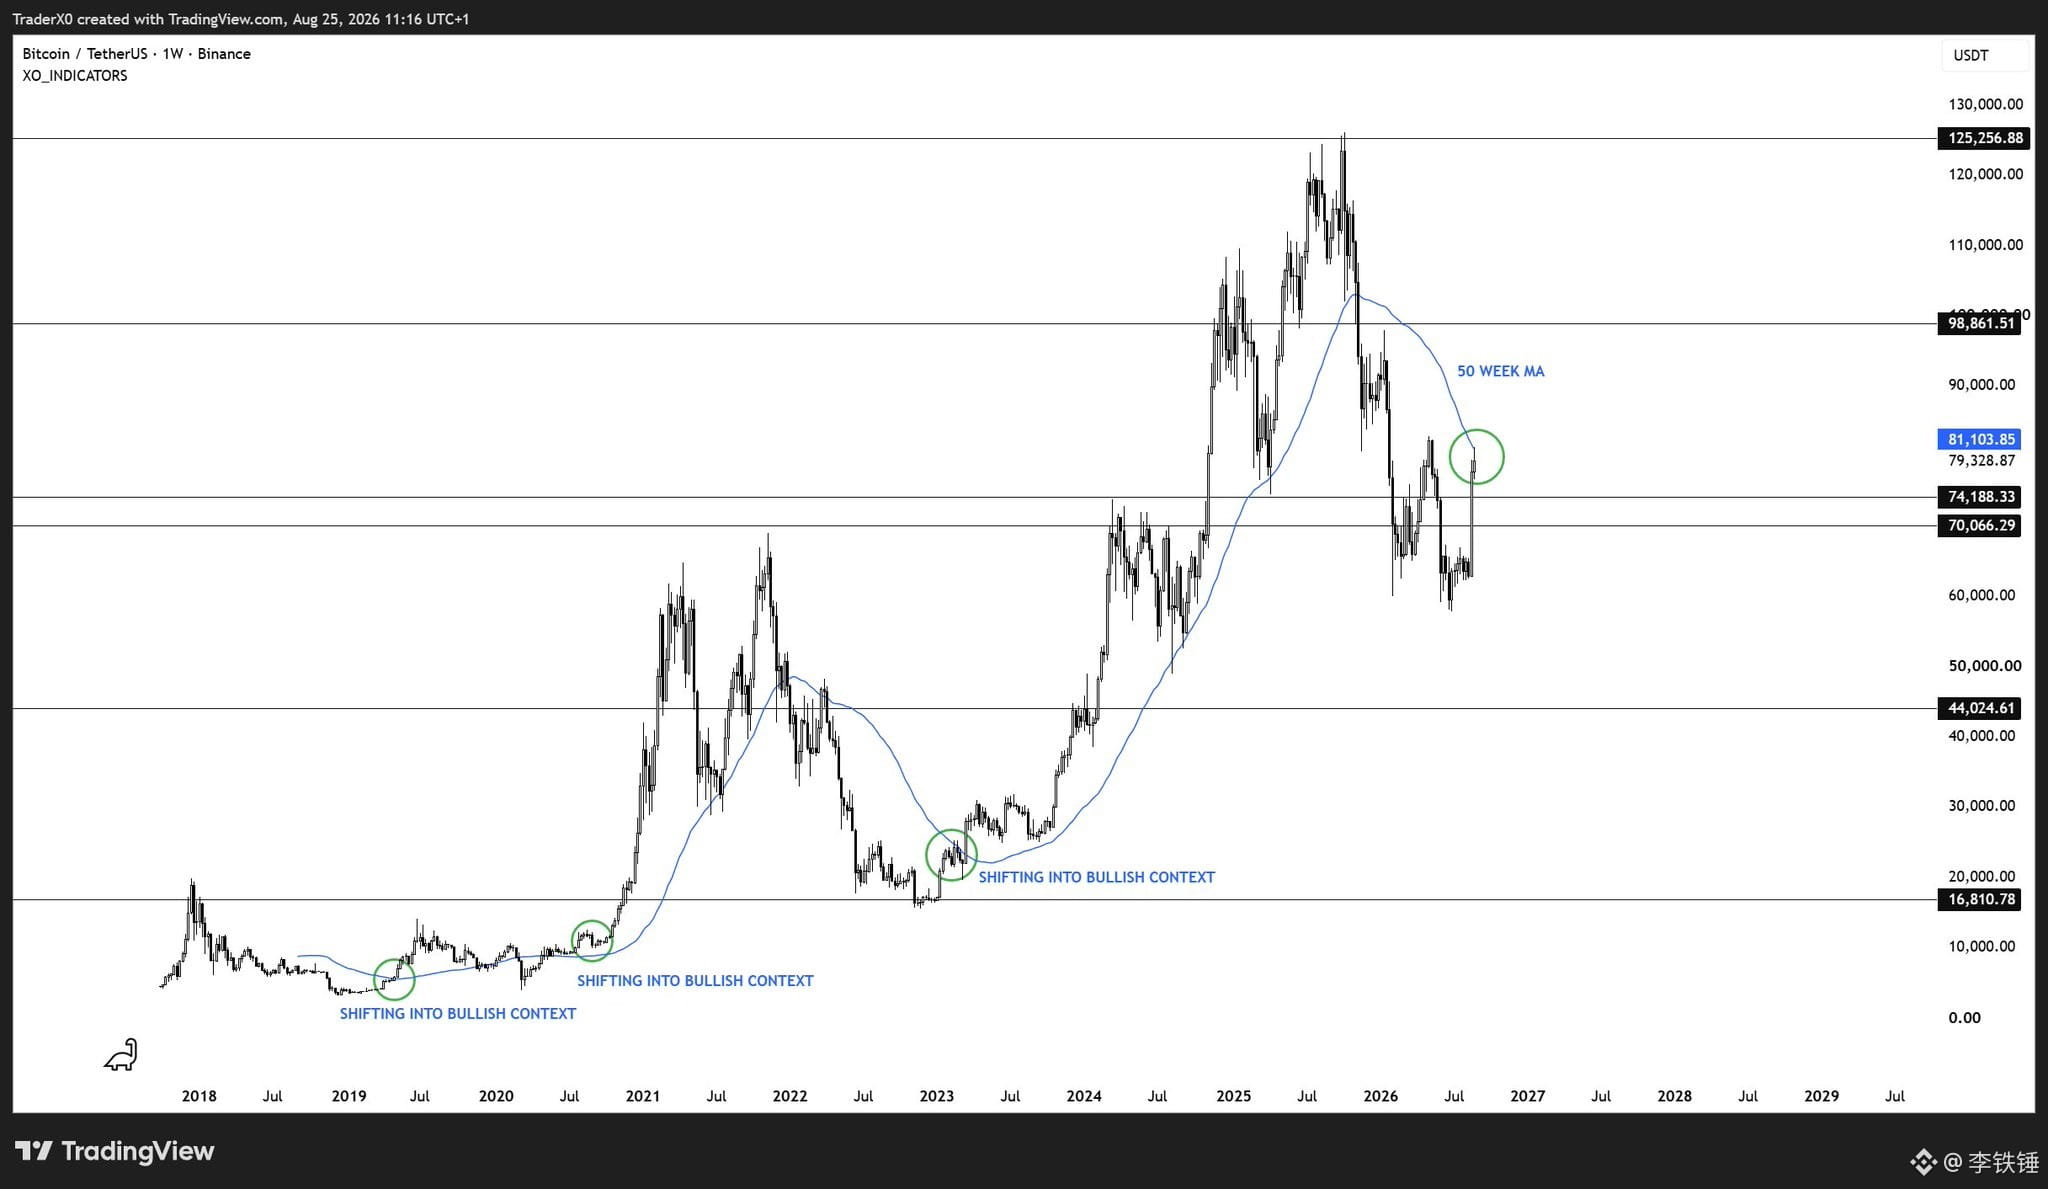
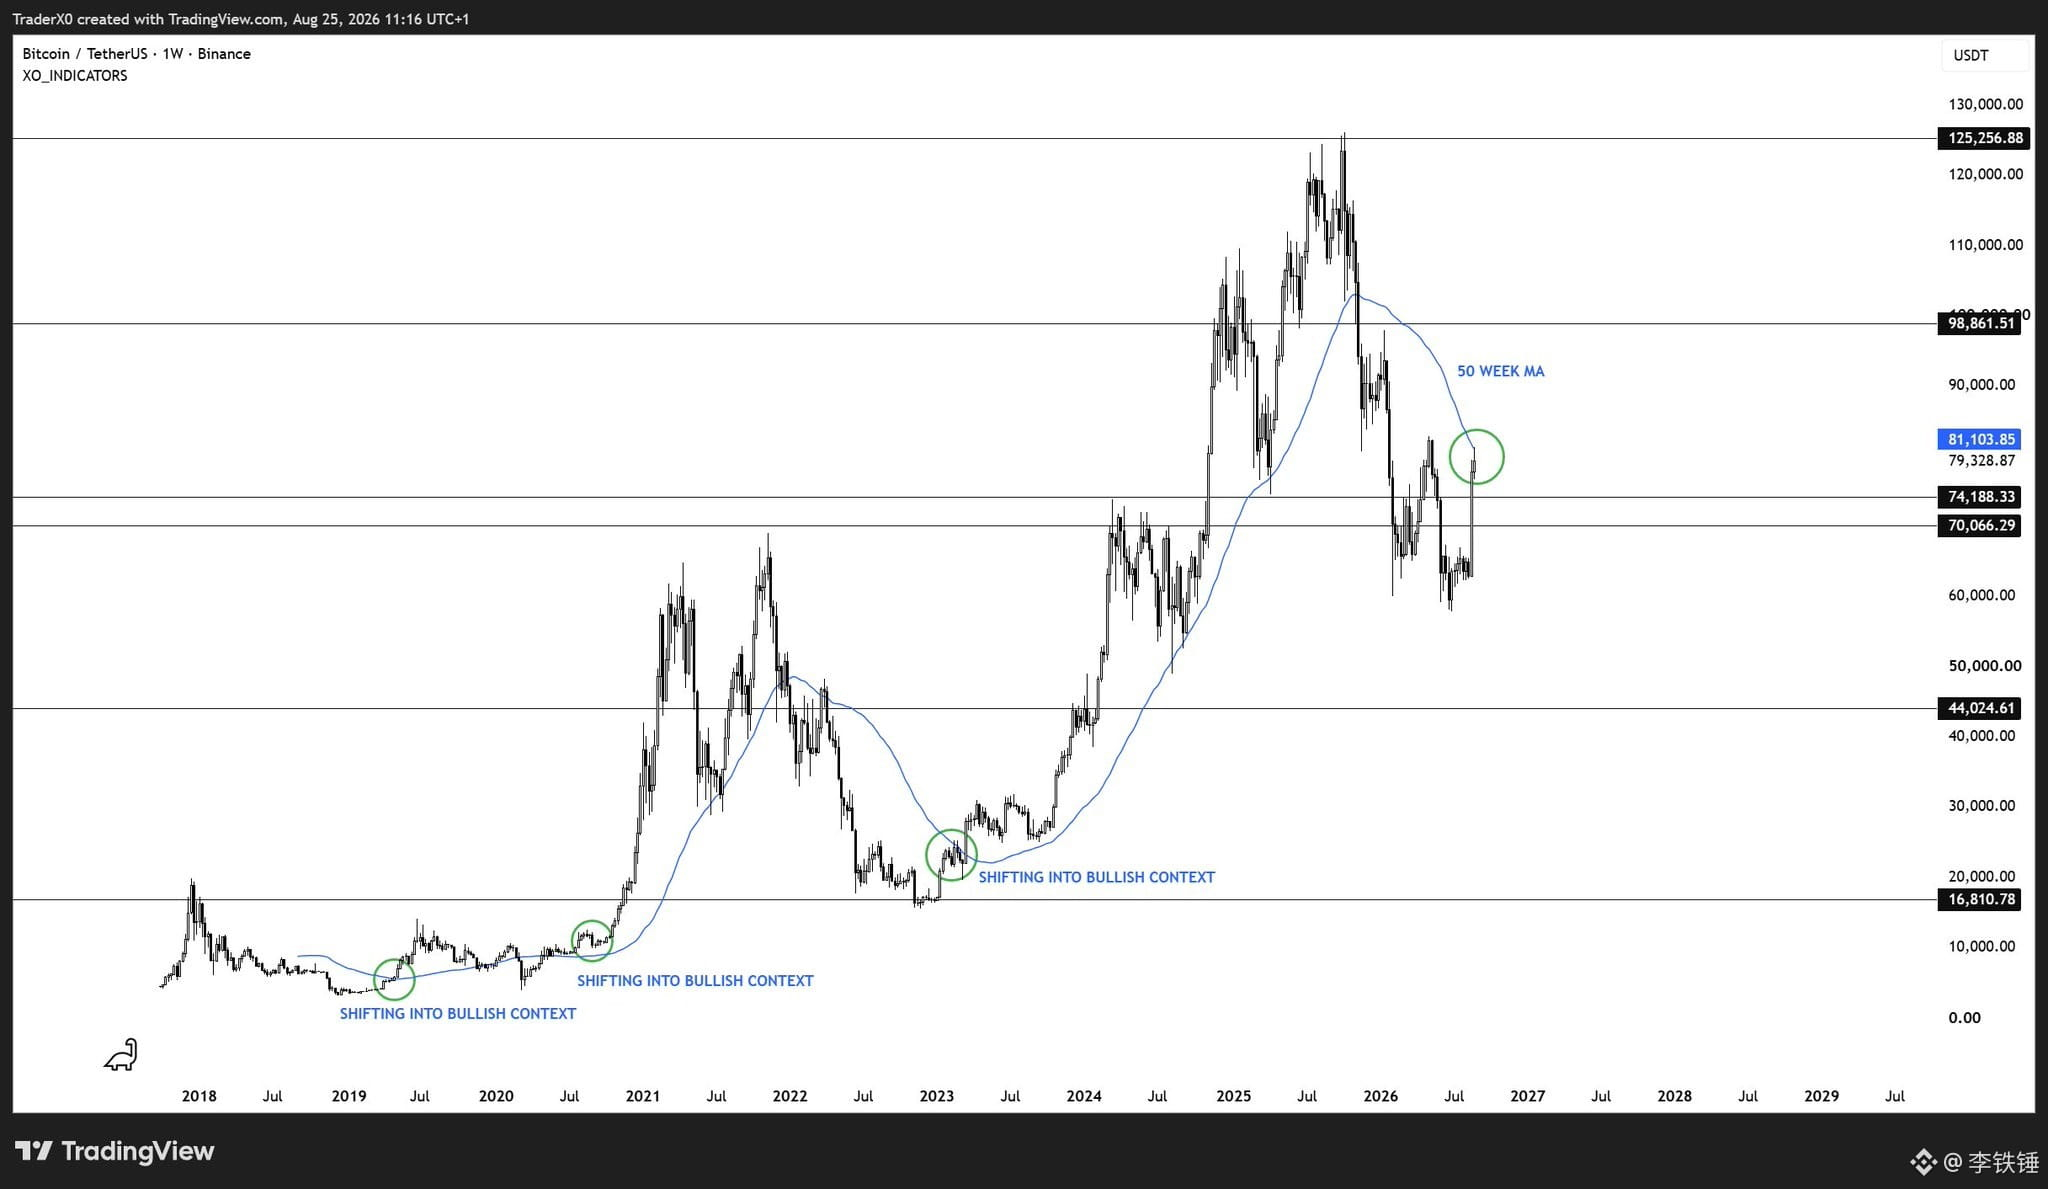
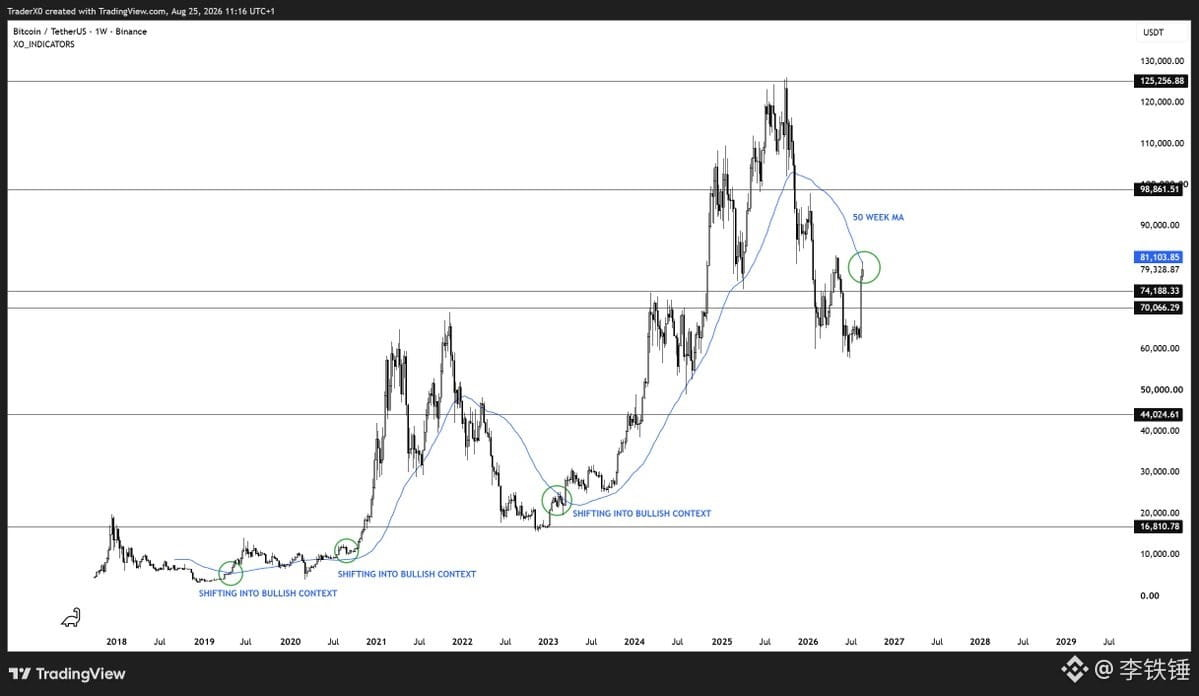
1)Trader XO (X: @Trader_XO, 2026-08-25) believes that for BTC to maintain bull-market conditions, price needs to stay above the 50-week moving average and develop a multi-week to multi-month trend. The accompanying chart is a BTC/USDT weekly candlestick chart, used to validate cross-market risk appetite for ETH—not an ETH chart.
2)Josh Olszewicz (X: @CarpeNoctom, 2026-08-29) mentioned that the COT shorts for BTC and ETH continue to decline, but they are still net short. This suggests selling pressure is easing, but it does not mean risk is resolved.
3)Daan Crypto Trades (X: @DaanCrypto, 2026-08-31) observed that when BTC consolidates around the 80,000 area, it still remains relatively strong; typically, capital returns to BTC first, and then rotates to certain altcoins.
Based on live market data: when data was collected, ETHUSDT was at 2420, with a 24-hour high of 2535 and a low of 2387; BTCUSDT was at 77748, with a high of 79400 and a low of 77000.
Today I’ll give only one main path: as long as ETH can hold near 2400 and does not quickly break down below 2387, look for a move toward 2460 for repair; if BTC can also hold 77000 and then move back toward 79400, ETH can then be watched against the 2535 resistance area. Conversely, if ETH breaks below 2387 and stays under it, this midday repair scenario is invalid.
Risk: This is not a copy-trading signal—leverage will amplify wick/pin risks, slippage, and liquidation risk. Right now, do you care more about ETH’s 2400, or BTC’s 77000?
#BTC #ETH #BNB
For the midday ETH setup, don’t chase—first see whether 2400 can hold and act as the rebound starting point.
Traders’ original take:
1)Trader XO (X: @Trader_XO, 2026-08-25) believes that for BTC to maintain bull-market conditions, price needs to stay above the 50-week moving average and develop a multi-week to multi-month trend. The accompanying chart is a BTC/USDT weekly candlestick chart, used to validate cross-market risk appetite for ETH—not an ETH chart.
2)Josh Olszewicz (X: @CarpeNoctom, 2026-08-29) mentioned that the COT shorts for BTC and ETH continue to decline, but they are still net short. This suggests selling pressure is easing, but it does not mean risk is resolved.
3)Daan Crypto Trades (X: @DaanCrypto, 2026-08-31) observed that when BTC consolidates around the 80,000 area, it still remains relatively strong; typically, capital returns to BTC first, and then rotates to certain altcoins.
Based on live market data: when data was collected, ETHUSDT was at 2420, with a 24-hour high of 2535 and a low of 2387; BTCUSDT was at 77748, with a high of 79400 and a low of 77000.
Today I’ll give only one main path: as long as ETH can hold near 2400 and does not quickly break down below 2387, look for a move toward 2460 for repair; if BTC can also hold 77000 and then move back toward 79400, ETH can then be watched against the 2535 resistance area. Conversely, if ETH breaks below 2387 and stays under it, this midday repair scenario is invalid.
Risk: This is not a copy-trading signal—leverage will amplify wick/pin risks, slippage, and liquidation risk. Right now, do you care more about ETH’s 2400, or BTC’s 77000?
#BTC #ETH #BNB
【Top 10 Crypto Traders’ Highlights Today|BTC August 31】
In the early session, the key for BTC isn’t whether it has already stopped rising—it’s whether it can keep holding near 77962.
Traders’ original viewpoints:
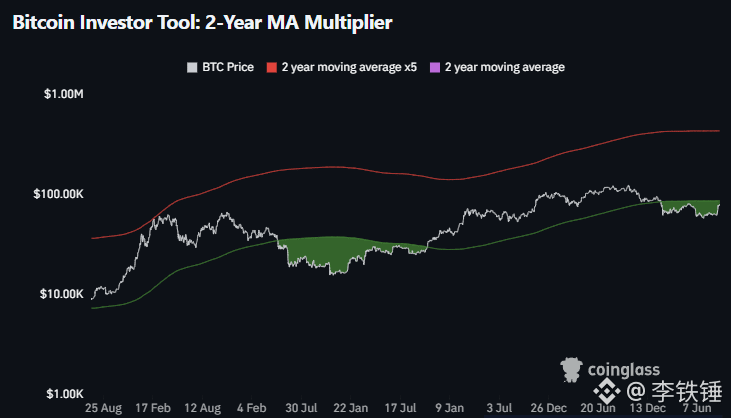
1)Daan Crypto Trades (@DaanCrypto) said the BTC 2-Year MA Multiplier is still barely in the value zone; historically, once BTC reclaims the 2-year moving average, it becomes easier to enter a new bull-market phase.
2)Daan Crypto Trades (@DaanCrypto) also noted that when BTC is consolidating around the 80000 area, it still outperforms many altcoins. Typically, market funds return to BTC first, and then rotate into the stronger altcoins.
3)Pentoshi (@Pentosh1) didn’t provide specific BTC levels, but emphasized two ways to execute: defend in higher-period zones, or follow after a reclaim. The core point is that when you’re wrong, losses should be kept cheap; when you’re right, it should open up room for the trend to develop.
Based on real-time market data: Binance BTCUSDT at 07:03 CST is 78338. The high in the past 24 hours was 79400, the low was 77962, and the price change is +0.117%. Funding rate is 0.00008174, and open interest is 106,664.141 BTC.
Today, focus on one main route: as long as BTC doesn’t effectively break down below the 77962 to 78000 zone, the early session should prioritize range-bound repair—first retesting 79400, then watching whether 80000 is re-accepted. If it can’t hold above 80000, this isn’t a chase-long position; it’s only a range rebound.
Invalidation condition: after BTC breaks below 77962, it fails to reclaim 78000. Risk: this is not a copy-trading signal; the funding rate is positive, and leveraged long positions can have amplified losses during spikes and fake breakouts.
Today, do you care more about the defense of 77962, or the reclaim and re-acceptance of 80000?
#BTC #ETH #BNB
In the early session, the key for BTC isn’t whether it has already stopped rising—it’s whether it can keep holding near 77962.
Traders’ original viewpoints:
1)Daan Crypto Trades (@DaanCrypto) said the BTC 2-Year MA Multiplier is still barely in the value zone; historically, once BTC reclaims the 2-year moving average, it becomes easier to enter a new bull-market phase.
2)Daan Crypto Trades (@DaanCrypto) also noted that when BTC is consolidating around the 80000 area, it still outperforms many altcoins. Typically, market funds return to BTC first, and then rotate into the stronger altcoins.
3)Pentoshi (@Pentosh1) didn’t provide specific BTC levels, but emphasized two ways to execute: defend in higher-period zones, or follow after a reclaim. The core point is that when you’re wrong, losses should be kept cheap; when you’re right, it should open up room for the trend to develop.
Based on real-time market data: Binance BTCUSDT at 07:03 CST is 78338. The high in the past 24 hours was 79400, the low was 77962, and the price change is +0.117%. Funding rate is 0.00008174, and open interest is 106,664.141 BTC.
Today, focus on one main route: as long as BTC doesn’t effectively break down below the 77962 to 78000 zone, the early session should prioritize range-bound repair—first retesting 79400, then watching whether 80000 is re-accepted. If it can’t hold above 80000, this isn’t a chase-long position; it’s only a range rebound.
Invalidation condition: after BTC breaks below 77962, it fails to reclaim 78000. Risk: this is not a copy-trading signal; the funding rate is positive, and leveraged long positions can have amplified losses during spikes and fake breakouts.
Today, do you care more about the defense of 77962, or the reclaim and re-acceptance of 80000?
#BTC #ETH #BNB
【Top 10 Crypto Traders’ Key Takeaways to Watch Today|BTC August 30】
Tonight, BTC looks more like it’s waiting for liquidity above 83,000 rather than having entered a one-way “falling more means more air” situation.
Traders’ original views and my scenario reasoning are considered separately:
1)Daan Crypto Trades (X: @DaanCrypto)
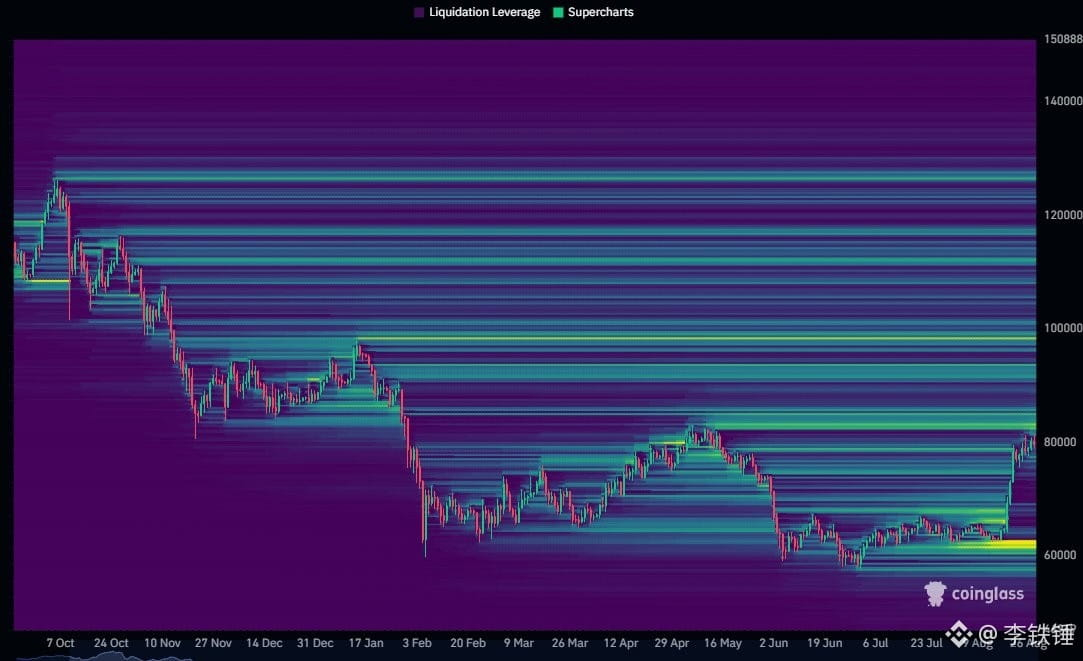
Original view: BTC hasn’t yet absorbed the largest overhead liquidity cluster from the downtrend, around the May high near 83,000; only if it breaks above that can we say it has truly formed a higher high.
Edited scenario: Current BTCUSDT is about 78,009, with a 24-hour high of 78,330. As long as price can reclaim 78,330, 83,000 becomes the clearest upside target for tonight.
2)DonAlt (X: @DonAlt)
Original view: Many people wait to buy at 74,000, but if the market itself is strong, it may not offer a deep enough pullback.
Edited scenario: This means 77,500—76,000 is the pullback zone I’m paying more attention to. As long as it doesn’t break, waiting for a much deeper low could instead get you stuck “under the bus” because the market never reaches your level.
3)Trader XO (X: @Trader_XO)
Original view: The real conditions for a sustained bull market are when price accepts above the 50-week moving average and develops into a multi-week to multi-month trend.
Edited scenario: So tonight isn’t about blindly chasing longs—it’s about whether there’s acceptance above 78,330. Without acceptance, it’s still just a tug-of-war within a rebound.
Additional note: Pentoshi (X: @Pentosh1) emphasizes trading in key high-timeframe zones with “wrong but still cheap, right with more room”; CryptoCred (X: @CryptoCred) reminds that after big volatility, the easiest mistakes to make are chasing price up, shorting out of revenge, and excessive leverage.
My single game plan:
If BTC holds 77,500—76,000, I’d prioritize a retest and breakout of 78,330, then watch liquidity around 83,000 afterward. If it breaks below 76,000 and the snapback can’t reclaim, this plan is invalid.
Risk warning: Funding rate is about 0.0100%; BTCUSDT perpetual open interest is about 108,583 BTC. In the evening, price may sweep one side first and then reverse—don’t treat traders’ viewpoints as guaranteed outcomes, and it’s not suitable for high-leverage chasing orders.
Tonight, are you watching 83,000 more closely, or waiting first to see whether 76,000 is lost?
#BTC #ETH #BNB
Tonight, BTC looks more like it’s waiting for liquidity above 83,000 rather than having entered a one-way “falling more means more air” situation.
Traders’ original views and my scenario reasoning are considered separately:
1)Daan Crypto Trades (X: @DaanCrypto)
Original view: BTC hasn’t yet absorbed the largest overhead liquidity cluster from the downtrend, around the May high near 83,000; only if it breaks above that can we say it has truly formed a higher high.
Edited scenario: Current BTCUSDT is about 78,009, with a 24-hour high of 78,330. As long as price can reclaim 78,330, 83,000 becomes the clearest upside target for tonight.
2)DonAlt (X: @DonAlt)
Original view: Many people wait to buy at 74,000, but if the market itself is strong, it may not offer a deep enough pullback.
Edited scenario: This means 77,500—76,000 is the pullback zone I’m paying more attention to. As long as it doesn’t break, waiting for a much deeper low could instead get you stuck “under the bus” because the market never reaches your level.
3)Trader XO (X: @Trader_XO)
Original view: The real conditions for a sustained bull market are when price accepts above the 50-week moving average and develops into a multi-week to multi-month trend.
Edited scenario: So tonight isn’t about blindly chasing longs—it’s about whether there’s acceptance above 78,330. Without acceptance, it’s still just a tug-of-war within a rebound.
Additional note: Pentoshi (X: @Pentosh1) emphasizes trading in key high-timeframe zones with “wrong but still cheap, right with more room”; CryptoCred (X: @CryptoCred) reminds that after big volatility, the easiest mistakes to make are chasing price up, shorting out of revenge, and excessive leverage.
My single game plan:
If BTC holds 77,500—76,000, I’d prioritize a retest and breakout of 78,330, then watch liquidity around 83,000 afterward. If it breaks below 76,000 and the snapback can’t reclaim, this plan is invalid.
Risk warning: Funding rate is about 0.0100%; BTCUSDT perpetual open interest is about 108,583 BTC. In the evening, price may sweep one side first and then reverse—don’t treat traders’ viewpoints as guaranteed outcomes, and it’s not suitable for high-leverage chasing orders.
Tonight, are you watching 83,000 more closely, or waiting first to see whether 76,000 is lost?
#BTC #ETH #BNB
【Top 10 Crypto Traders’ Highlights Today|BTC August 30】
In the morning, BTC looks more like it’s waiting for confirmation rather than directly chasing long.
Original views:
1)Daan Crypto Trades @DaanCrypto: BTC hasn’t yet reclaimed the largest liquidity cluster within the downtrend. Only above 83,000 near the May highs would count as the first real higher high.
2)Big Cheds @BigCheds: He doesn’t have a strong view on BTC right now—wait for confirmation of the bottom first.
3)Trader XO @Trader_XO: You need to see the 50-week moving average turn up again, the price hold above it, and form a multi-week trend—only then does it count as a sustained bull market.
Editorial scenario:
BTCUSDT current price 78,266, 24h +0.72%, funding rate 0.01%. For the main path, watch just one thing: first reclaim 81,000 to 83,000, then look to 90,000; if it falls back below 77,382, the rebound fails and you should keep waiting. Don’t size positions too large—don’t treat a repair as a trend.#BTC #ETH #BNB
In the morning, BTC looks more like it’s waiting for confirmation rather than directly chasing long.
Original views:
1)Daan Crypto Trades @DaanCrypto: BTC hasn’t yet reclaimed the largest liquidity cluster within the downtrend. Only above 83,000 near the May highs would count as the first real higher high.
2)Big Cheds @BigCheds: He doesn’t have a strong view on BTC right now—wait for confirmation of the bottom first.
3)Trader XO @Trader_XO: You need to see the 50-week moving average turn up again, the price hold above it, and form a multi-week trend—only then does it count as a sustained bull market.
Editorial scenario:
BTCUSDT current price 78,266, 24h +0.72%, funding rate 0.01%. For the main path, watch just one thing: first reclaim 81,000 to 83,000, then look to 90,000; if it falls back below 77,382, the rebound fails and you should keep waiting. Don’t size positions too large—don’t treat a repair as a trend.#BTC #ETH #BNB
【Top 10 Crypto Traders’ Highlights Today|BTC August 29】
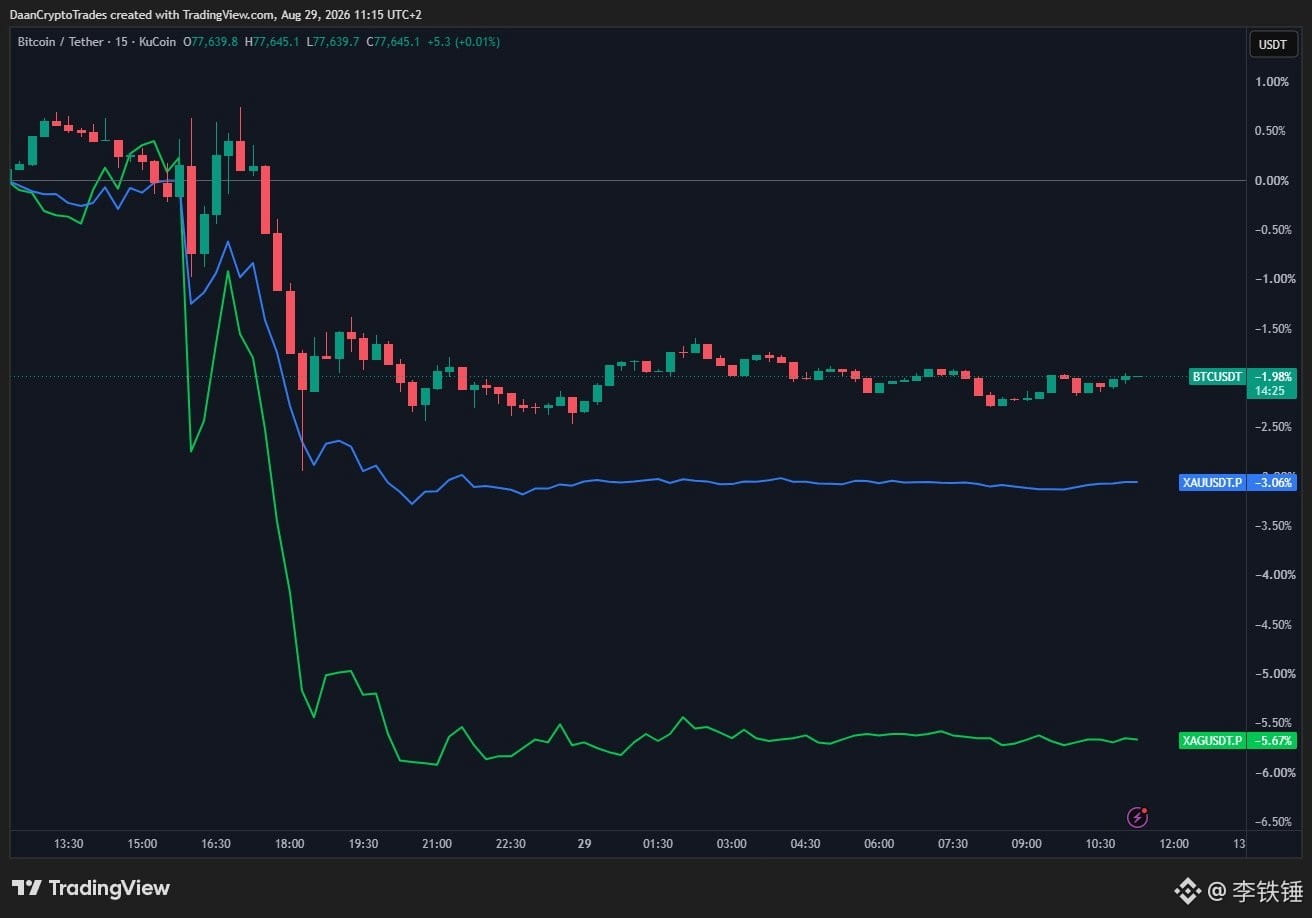
BTC is not a good point to chase shorts right now; it’s more like a range battle between 76,888 and 79,839.
1)DaanCrypto @DaanCrypto: A hawkish Fed stance suppresses “devaluation trades,” but BTC is still holding up relatively well.
2)DaanCrypto @DaanCrypto: First stabilize within the range—whether the bull market returns depends on if price can reclaim the prior high and complete consolidation.
3)BigCheds @BigCheds: 76,000 is reasonable—the market’s reaction at this level carries the most information.
4)Trader_XO @Trader_XO: For a real bull-market continuation, you need to see price regain and hold above the 50-week moving average and form a multi-week trend.
5)DonAlt @DonAlt: Don’t bet too deeply on a massive pullback—wait until market sentiment truly turns before flipping positions; that’s more stable.
My scenario gives only one path: first defend 76,888, then after reclaiming 78,000, reassess at 79,839; if there is a valid breakdown below 76,888, this route fails. Keep position size light and leave room with leverage.
#BTC #ETH #BNB
BTC is not a good point to chase shorts right now; it’s more like a range battle between 76,888 and 79,839.
1)DaanCrypto @DaanCrypto: A hawkish Fed stance suppresses “devaluation trades,” but BTC is still holding up relatively well.
2)DaanCrypto @DaanCrypto: First stabilize within the range—whether the bull market returns depends on if price can reclaim the prior high and complete consolidation.
3)BigCheds @BigCheds: 76,000 is reasonable—the market’s reaction at this level carries the most information.
4)Trader_XO @Trader_XO: For a real bull-market continuation, you need to see price regain and hold above the 50-week moving average and form a multi-week trend.
5)DonAlt @DonAlt: Don’t bet too deeply on a massive pullback—wait until market sentiment truly turns before flipping positions; that’s more stable.
My scenario gives only one path: first defend 76,888, then after reclaiming 78,000, reassess at 79,839; if there is a valid breakdown below 76,888, this route fails. Keep position size light and leave room with leverage.
#BTC #ETH #BNB
【Top 10 Crypto Traders’ Highlights Today|BTC August 28】
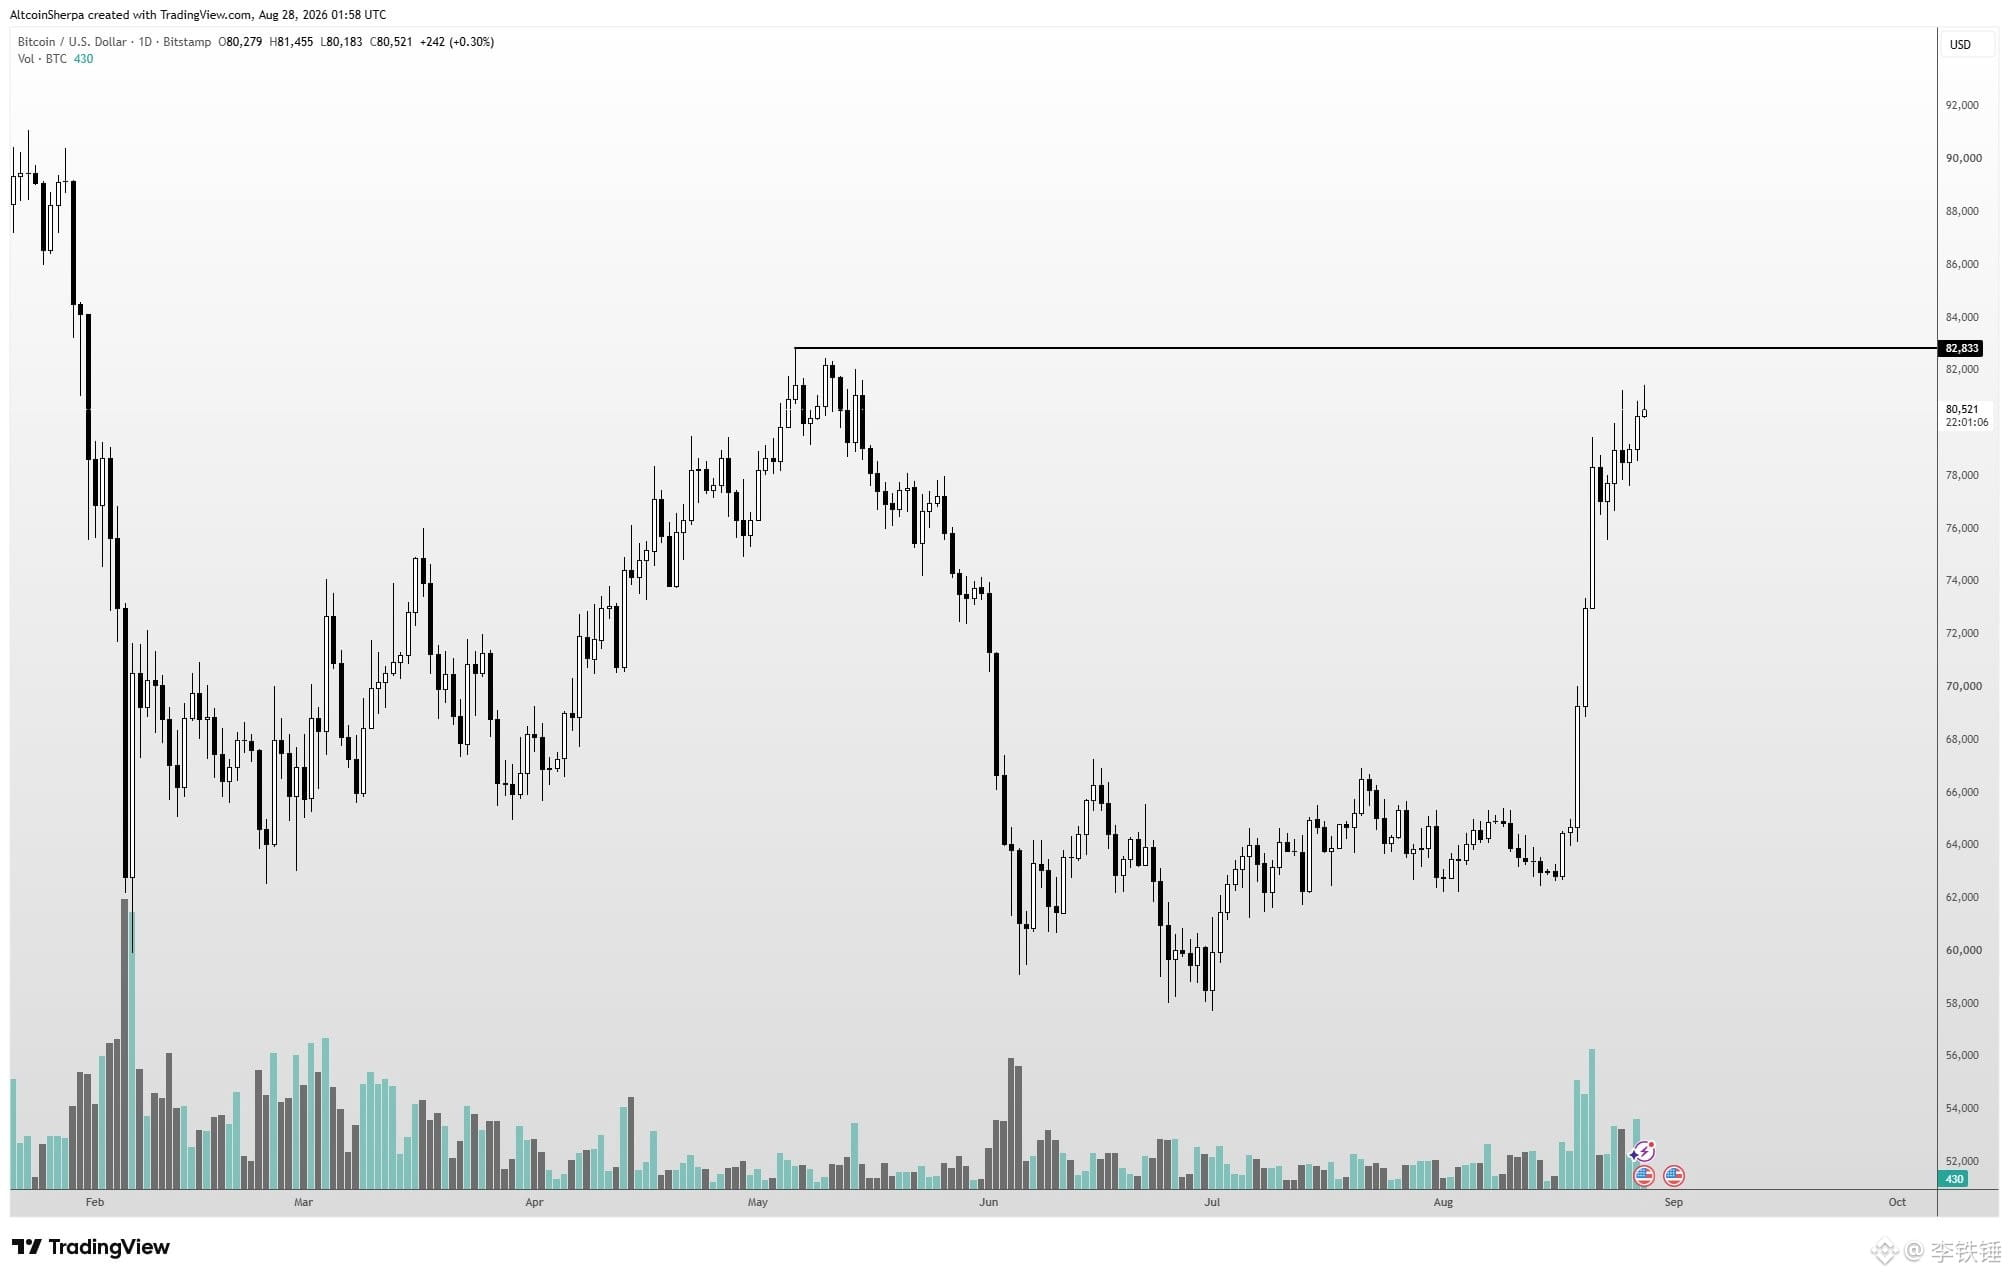
Tonight, BTC isn’t straight up; first we’ll see whether 79,000 / 78,000 can hold, then decide whether to go test 80,300, and only finally 82,833.
Daan Crypto Trades @DaanCrypto: The original view was “$BTC slowly chopping higher… marginally higher highs into higher lows.” This suggests the market is still gradually trending upward.
Altcoin Sherpa @AltcoinSherpa: The original view was “break this 82k region and we’re off to the races.” The 82k level is still tonight’s confirmation zone.
Cheds Trading @BigCheds: The original view was “$BTC continued LTF grind higher.” The lower time frame is still grinding upward, not a violent one-way move.
Peter Brandt @PeterLBrandt: The original view was “Also am long Bitcoin.” Bias is bullish, but it doesn’t mean an immediate breakout.
Editor’s scenario: BTCUSDT current price is 79,284.22, 24h -0.912%, funding rate 0.01%, and OI 108,941.425. As long as 78,000 hasn’t been lost, the main path is still to range higher first, then try 82,833. If it breaks below 78,000, first look at 76,000, then 74,000—this evening’s long thesis is invalid.
The chart used is a recent BTC/USD daily chart. The key resistance is 82,833, which aligns with tonight’s 82k level.
#BTC #ETH #BNB
Tonight, BTC isn’t straight up; first we’ll see whether 79,000 / 78,000 can hold, then decide whether to go test 80,300, and only finally 82,833.
Daan Crypto Trades @DaanCrypto: The original view was “$BTC slowly chopping higher… marginally higher highs into higher lows.” This suggests the market is still gradually trending upward.
Altcoin Sherpa @AltcoinSherpa: The original view was “break this 82k region and we’re off to the races.” The 82k level is still tonight’s confirmation zone.
Cheds Trading @BigCheds: The original view was “$BTC continued LTF grind higher.” The lower time frame is still grinding upward, not a violent one-way move.
Peter Brandt @PeterLBrandt: The original view was “Also am long Bitcoin.” Bias is bullish, but it doesn’t mean an immediate breakout.
Editor’s scenario: BTCUSDT current price is 79,284.22, 24h -0.912%, funding rate 0.01%, and OI 108,941.425. As long as 78,000 hasn’t been lost, the main path is still to range higher first, then try 82,833. If it breaks below 78,000, first look at 76,000, then 74,000—this evening’s long thesis is invalid.
The chart used is a recent BTC/USD daily chart. The key resistance is 82,833, which aligns with tonight’s 82k level.
#BTC #ETH #BNB
【Top 10 Crypto Traders’ Highlights Today|ETH August 28】
Midday ETH: This isn’t the most comfortable spot to chase ETH; the key is first to see whether BTC can hold the risk appetite.
Traders’ original viewpoints:
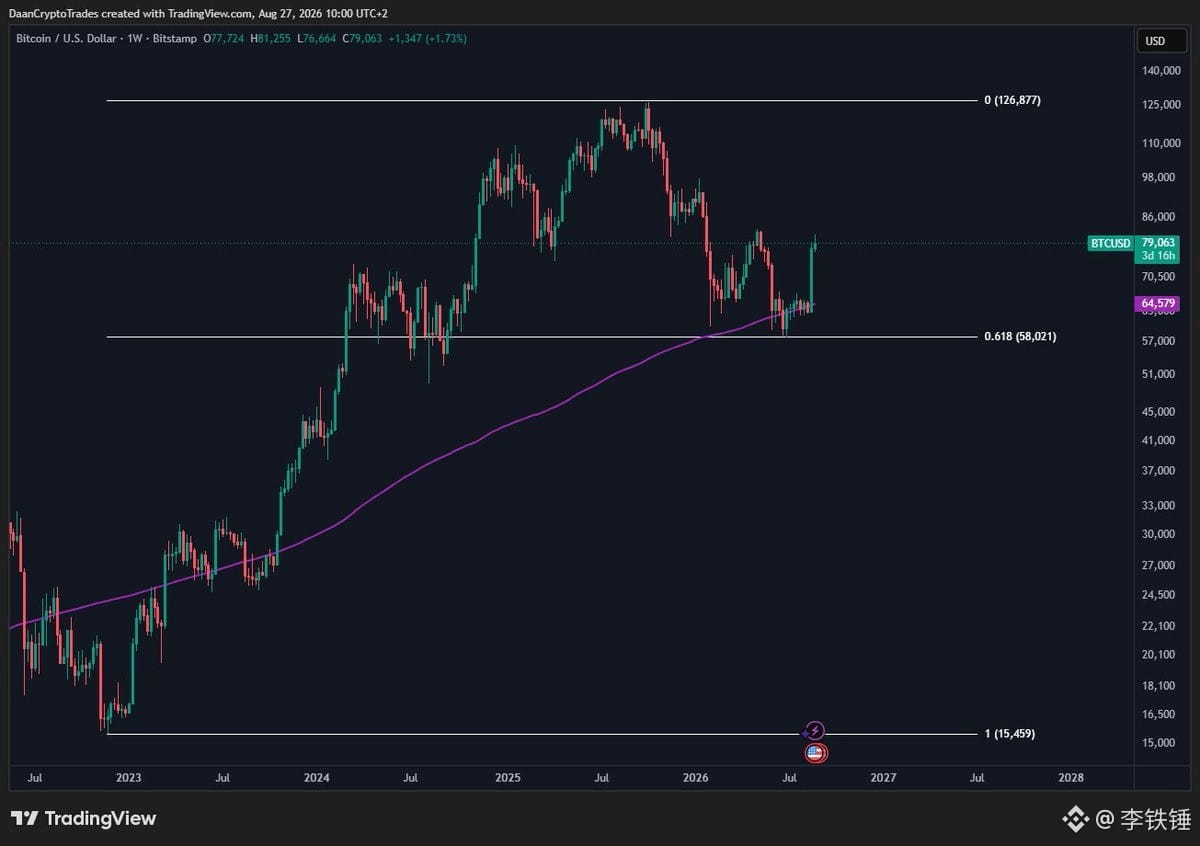
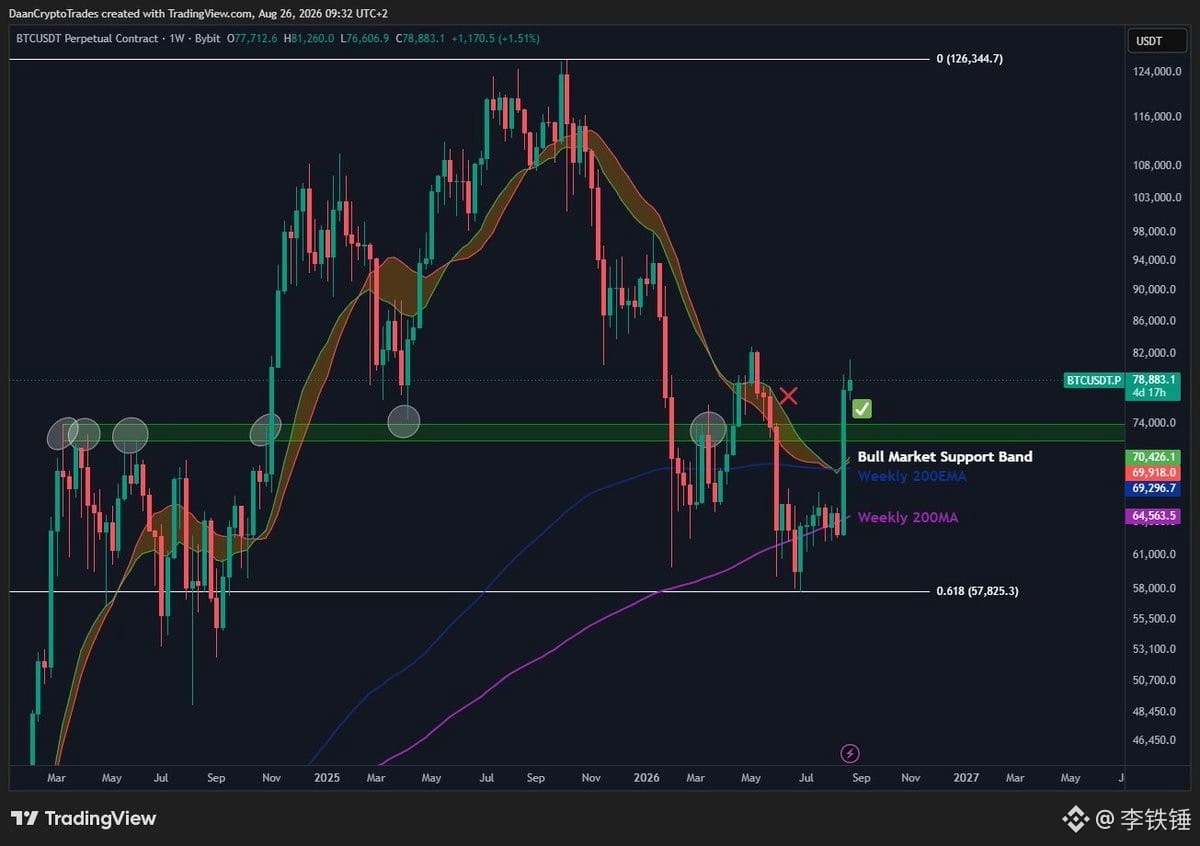
1) Daan Crypto Trades (@DaanCrypto) said on August 27 that BTC reacted well near the Weekly 200MA plus the 0.618 Fibonacci retracement area, but no one can be certain about what comes next—so you can only expect reactions around high-value levels. He also emphasized the same day that true FOMO should wait until BTC breaks out and holds 83,000; the 80,000 area first needs to hold steady.
2) Trader XO (@Trader_XO) said on August 25 that the conditions for a bull market depend on whether price re-accepts above the 50W curve and forms a multi-week/month trend; over the next few months, the more likely setup is two-way volatility opportunities.
Based on the live market snapshot at 11:34 CST: ETH 2492, 24h high 2567, low 2482; BTC 79924. My scenario offers only one path: first see whether ETH can hold 2480. If it reclaims 2520, and BTC stays around 80,000 or above, then ETH can look toward 2567 to 2620. If ETH breaks below 2480, or BTC falls back below 80,000 and fails to reclaim it, then this rebound path is invalid.
The chart is the BTC/USD weekly candlestick posted by Daan. It’s a cross-market risk appetite confirmation chart—not a claim that it is an ETH chart. High leverage at this kind of range is very easy to get swept; this article is a compilation of viewpoints, not copy-trading advice.
Which are you more focused on: ETH reclaiming 2520, or BTC holding 80,000?
#BTC #ETH #BNB
Midday ETH: This isn’t the most comfortable spot to chase ETH; the key is first to see whether BTC can hold the risk appetite.
Traders’ original viewpoints:
1) Daan Crypto Trades (@DaanCrypto) said on August 27 that BTC reacted well near the Weekly 200MA plus the 0.618 Fibonacci retracement area, but no one can be certain about what comes next—so you can only expect reactions around high-value levels. He also emphasized the same day that true FOMO should wait until BTC breaks out and holds 83,000; the 80,000 area first needs to hold steady.
2) Trader XO (@Trader_XO) said on August 25 that the conditions for a bull market depend on whether price re-accepts above the 50W curve and forms a multi-week/month trend; over the next few months, the more likely setup is two-way volatility opportunities.
Based on the live market snapshot at 11:34 CST: ETH 2492, 24h high 2567, low 2482; BTC 79924. My scenario offers only one path: first see whether ETH can hold 2480. If it reclaims 2520, and BTC stays around 80,000 or above, then ETH can look toward 2567 to 2620. If ETH breaks below 2480, or BTC falls back below 80,000 and fails to reclaim it, then this rebound path is invalid.
The chart is the BTC/USD weekly candlestick posted by Daan. It’s a cross-market risk appetite confirmation chart—not a claim that it is an ETH chart. High leverage at this kind of range is very easy to get swept; this article is a compilation of viewpoints, not copy-trading advice.
Which are you more focused on: ETH reclaiming 2520, or BTC holding 80,000?
#BTC #ETH #BNB
[Top 10 Crypto Traders to Watch Today|ETH August 27]
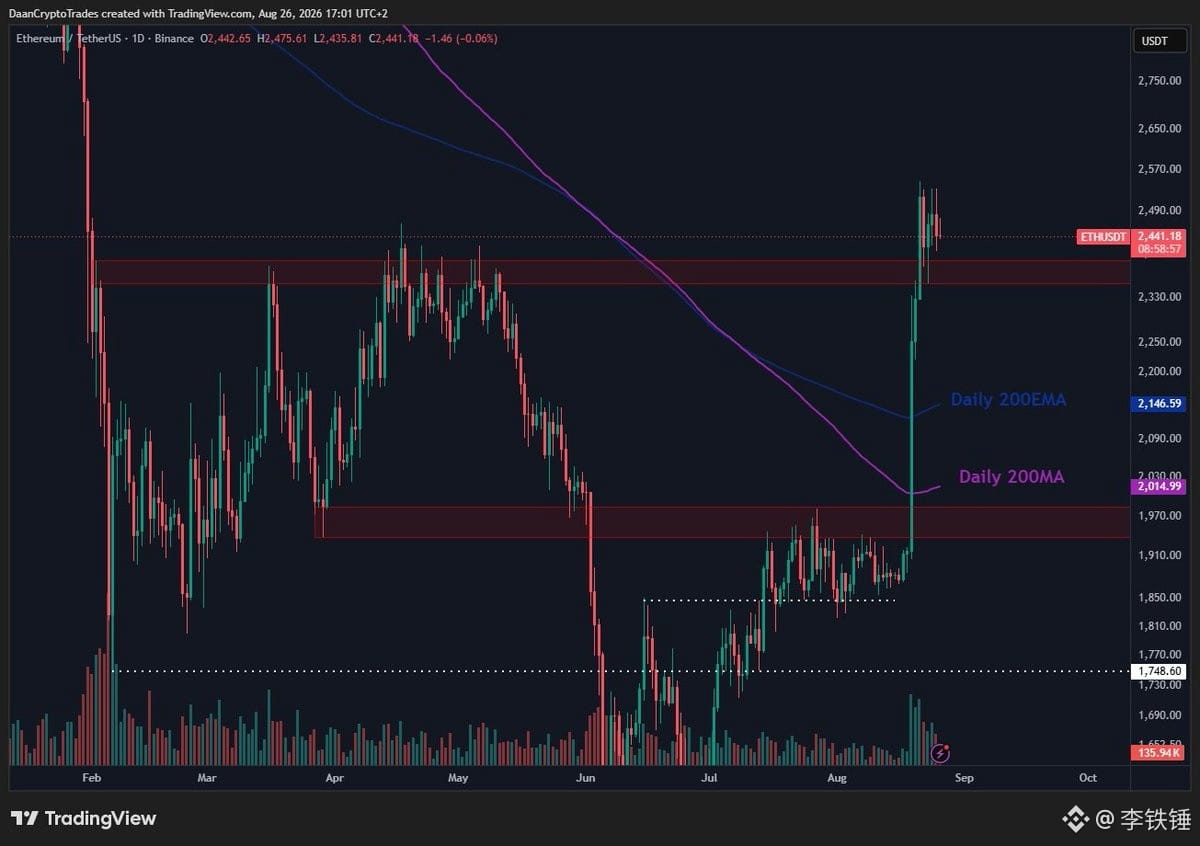
This midday on ETH is not a chase-the-rally situation. The key is: don’t let it fall back below the 2432 area.
Today I’m only looking at one main line: as long as ETH continues to hold above 2432–2440, we treat it as post-breakout consolidation and digestion first. If it breaks back above 2515, the next target is around 2600. Conversely, if it breaks below 2432 and the rebound fails to reclaim 2440, treat it as a false breakout—don’t force a bullish narrative.
Original trader viewpoints:
1)Daan Crypto Trades (X: @DaanCrypto, Aug 26) said ETH is consolidating above the prior resistance. Bulls need to push higher soon; otherwise, if it falls back below resistance, it could turn into a larger liquidity grab, followed by an ugly-looking rejection.
2)Altcoin Sherpa (X: @AltcoinSherpa, Aug 27) said as long as BTC remains stable, the market may keep moving upward. This isn’t an ETH-only entry point, but it suggests ETH’s continuation still relies on BTC not suddenly weakening.
3)Trader XO (X: @Trader_XO, Aug 25) emphasized that in a bull market environment, price needs to be accepted by the market above key higher-timeframe trend lines—not just rely on a single spike.
Editor’s walkthrough: At 11:28 CST sampling time, Binance ETHUSDT spot is around 2498. The 24-hour high is 2515 and the low is 2432, with a funding rate of about 0.009921%. So this isn’t suitable to write as “blindly chasing longs.” It’s more about whether the breakout is accepted: 2432–2440 is the defense zone, and 2515 is the confirmation point.
Invalidation condition: if it breaks below 2432 and the rebound can’t reclaim 2440, look lower short-term to 2380 and 2320.
Risk warning: This is only a整理 (summary) of traders’ public views and a scenario walkthrough—not a copy-trading signal. When high leverage runs into a needle-like wick near key levels, it’s easy to be directionally right but have the position die first.
Do you think ETH will first hold above 2515, or first drop back to 2432 to validate a false breakout?
#BTC #ETH #BNB
This midday on ETH is not a chase-the-rally situation. The key is: don’t let it fall back below the 2432 area.
Today I’m only looking at one main line: as long as ETH continues to hold above 2432–2440, we treat it as post-breakout consolidation and digestion first. If it breaks back above 2515, the next target is around 2600. Conversely, if it breaks below 2432 and the rebound fails to reclaim 2440, treat it as a false breakout—don’t force a bullish narrative.
Original trader viewpoints:
1)Daan Crypto Trades (X: @DaanCrypto, Aug 26) said ETH is consolidating above the prior resistance. Bulls need to push higher soon; otherwise, if it falls back below resistance, it could turn into a larger liquidity grab, followed by an ugly-looking rejection.
2)Altcoin Sherpa (X: @AltcoinSherpa, Aug 27) said as long as BTC remains stable, the market may keep moving upward. This isn’t an ETH-only entry point, but it suggests ETH’s continuation still relies on BTC not suddenly weakening.
3)Trader XO (X: @Trader_XO, Aug 25) emphasized that in a bull market environment, price needs to be accepted by the market above key higher-timeframe trend lines—not just rely on a single spike.
Editor’s walkthrough: At 11:28 CST sampling time, Binance ETHUSDT spot is around 2498. The 24-hour high is 2515 and the low is 2432, with a funding rate of about 0.009921%. So this isn’t suitable to write as “blindly chasing longs.” It’s more about whether the breakout is accepted: 2432–2440 is the defense zone, and 2515 is the confirmation point.
Invalidation condition: if it breaks below 2432 and the rebound can’t reclaim 2440, look lower short-term to 2380 and 2320.
Risk warning: This is only a整理 (summary) of traders’ public views and a scenario walkthrough—not a copy-trading signal. When high leverage runs into a needle-like wick near key levels, it’s easy to be directionally right but have the position die first.
Do you think ETH will first hold above 2515, or first drop back to 2432 to validate a false breakout?
#BTC #ETH #BNB
【Top 10 Crypto Traders’ Highlights to Watch Today|BTC on August 27】
Conclusion first: Today’s BTC isn’t a “one-way breakout already.” It’s more like the confirmation day after reclaiming a key weekly range. There’s only one main line to watch: as long as 77632 in the area is not effectively broken down, handle it as a pullback that holds—then challenge 79252–83000 again.
1. Daan Crypto Trades (X: @DaanCrypto)
Original view: BTC has flipped back over an important weekly level, holding the 60,000 support and standing above the weekly 200MA/EMA, the bull-market support band, and the green horizontal level. The remaining key is to break above 83,000, form a new weekly higher high, and only then will the weekly structure shift to a bullish outlook.
2. Big Cheds (X: @BigCheds)
Original view: IBIT’s daily chart gave a 4-star signal after an exhaustion gap and suggests a possible island top. This isn’t a direct bearish signal for BTC spot, but it does point to overheating and pullback risk on the ETF side.
3. TXMC (X: @TXMCtrades)
Original view: The 38% probability for September rate cuts looks too high. This is more of a macro backdrop—basically signaling that the market shouldn’t price in the easing expectation too fully.
Editor’s scenario:
Near 07:02 CST, Binance BTCUSDT latest price is 78698, with a 24-hour high of 79252 and a low of 77633. The price change is -0.328%. BTCUSDT perpetual open interest is about 105,808 BTC. Price is currently stuck in the short-term range of 77632–79252, and it’s still a distance away from the weekly confirmation level of 83,000 mentioned by Daan.
So today’s main route is: BTC first consolidates above 77632 to work off momentum; if it pulls back without breaking and then reclaims 79252, only then do we look toward 83,000. Only after breaking above 83,000 will the weekly structure be closer to a “bullish reversal confirmation.”
Invalidation conditions: If BTC effectively breaks down below 77632 and the rebound fails to reclaim above 78000, it means the short-term repair failed. Then focus on around 76,000 first—no chasing longs.
Risk warning: This is not a certain upside prediction. Profit-taking on the ETF side, falling rate-cut expectations, and crowded futures positioning could all cause price to wash back into the support area. With high leverage, it’s easy to get stopped out repeatedly inside the narrow range of 77632–79252.
Are you more focused on whether BTC can reclaim 79252 today, or whether that low at 77632 will be broken?
#BTC #ETH #BNB
Conclusion first: Today’s BTC isn’t a “one-way breakout already.” It’s more like the confirmation day after reclaiming a key weekly range. There’s only one main line to watch: as long as 77632 in the area is not effectively broken down, handle it as a pullback that holds—then challenge 79252–83000 again.
1. Daan Crypto Trades (X: @DaanCrypto)
Original view: BTC has flipped back over an important weekly level, holding the 60,000 support and standing above the weekly 200MA/EMA, the bull-market support band, and the green horizontal level. The remaining key is to break above 83,000, form a new weekly higher high, and only then will the weekly structure shift to a bullish outlook.
2. Big Cheds (X: @BigCheds)
Original view: IBIT’s daily chart gave a 4-star signal after an exhaustion gap and suggests a possible island top. This isn’t a direct bearish signal for BTC spot, but it does point to overheating and pullback risk on the ETF side.
3. TXMC (X: @TXMCtrades)
Original view: The 38% probability for September rate cuts looks too high. This is more of a macro backdrop—basically signaling that the market shouldn’t price in the easing expectation too fully.
Editor’s scenario:
Near 07:02 CST, Binance BTCUSDT latest price is 78698, with a 24-hour high of 79252 and a low of 77633. The price change is -0.328%. BTCUSDT perpetual open interest is about 105,808 BTC. Price is currently stuck in the short-term range of 77632–79252, and it’s still a distance away from the weekly confirmation level of 83,000 mentioned by Daan.
So today’s main route is: BTC first consolidates above 77632 to work off momentum; if it pulls back without breaking and then reclaims 79252, only then do we look toward 83,000. Only after breaking above 83,000 will the weekly structure be closer to a “bullish reversal confirmation.”
Invalidation conditions: If BTC effectively breaks down below 77632 and the rebound fails to reclaim above 78000, it means the short-term repair failed. Then focus on around 76,000 first—no chasing longs.
Risk warning: This is not a certain upside prediction. Profit-taking on the ETF side, falling rate-cut expectations, and crowded futures positioning could all cause price to wash back into the support area. With high leverage, it’s easy to get stopped out repeatedly inside the narrow range of 77632–79252.
Are you more focused on whether BTC can reclaim 79252 today, or whether that low at 77632 will be broken?
#BTC #ETH #BNB
【Top 10 Crypto Traders’ Highlights for Today|BTC August 26】
Tonight, BTC is not a blind bullish call—the key is which side gets confirmed first between 77,500 and 80,000.
Traders’ original take:
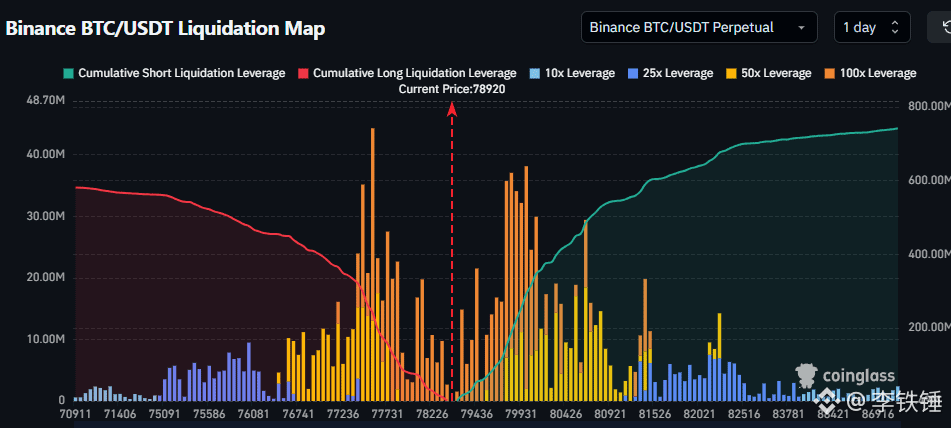
1. Daan Crypto Trades|@DaanCrypto: After a quick surge, BTC consolidates; liquidity is concentrated around 77,500 and 80,000.
2. Skew|@52kskew: On the lower end of the range on the lower time frames, there is still spot sell pressure; bulls need to regain control.
3. TraderSZ|@trader1sz: Now the question is whether this is consolidation near resistance or a shift into a trend mode.
4. CryptoCred|@CryptoCred: Don’t chase after a big move; wait for trend confirmation before deploying tactical capital.
Editor’s scenario: BTC’s current price is about 78,429, with a 24-hour range of 77,851—79,564. There’s only one main path: hold 77,500 and reclaim 79,000—then there’s a chance to test 80,000; if BTC breaks below 77,500 and cannot reclaim it on the retest, switch to defense in the evening and don’t go long.
Risk: The funding rate is still 0.00922%, bullish sentiment hasn’t fully faded, but liquidity is thick on both sides—high leverage can easily get swept. The failure conditions are a break below 77,500 or a breakout above 80,000 followed by a rapid drop back into the range.
Tonight, will you wait for defense at 77,500, or wait for a breakout at 80,000?
#BTC #ETH #BNB
Tonight, BTC is not a blind bullish call—the key is which side gets confirmed first between 77,500 and 80,000.
Traders’ original take:
1. Daan Crypto Trades|@DaanCrypto: After a quick surge, BTC consolidates; liquidity is concentrated around 77,500 and 80,000.
2. Skew|@52kskew: On the lower end of the range on the lower time frames, there is still spot sell pressure; bulls need to regain control.
3. TraderSZ|@trader1sz: Now the question is whether this is consolidation near resistance or a shift into a trend mode.
4. CryptoCred|@CryptoCred: Don’t chase after a big move; wait for trend confirmation before deploying tactical capital.
Editor’s scenario: BTC’s current price is about 78,429, with a 24-hour range of 77,851—79,564. There’s only one main path: hold 77,500 and reclaim 79,000—then there’s a chance to test 80,000; if BTC breaks below 77,500 and cannot reclaim it on the retest, switch to defense in the evening and don’t go long.
Risk: The funding rate is still 0.00922%, bullish sentiment hasn’t fully faded, but liquidity is thick on both sides—high leverage can easily get swept. The failure conditions are a break below 77,500 or a breakout above 80,000 followed by a rapid drop back into the range.
Tonight, will you wait for defense at 77,500, or wait for a breakout at 80,000?
#BTC #ETH #BNB
【Top 10 Crypto Traders’ Key Takeaways Today | BTC August 26】
In the morning, what really matters for BTC is not whether it can push higher, but whether after a pullback it can reclaim and stand above 80,000.
Traders’ original views:
1)Trader XO (X: @Trader_XO, Aug 25) emphasized that for BTC to maintain bull-market conditions, the 50-week moving average needs to keep bending upward, and price must be accepted above it, before evolving into a trend lasting multiple weeks to months. His chart is BTC/USDT weekly candlesticks—not an intraday chasing signal.
2)Daan Crypto Trades (X: @DaanCrypto, Aug 25) believes that after BTC held above 60,000, it has already reached the high-end range near 80,000. It hasn’t swept up to 83,000 yet, but resistance is clearly visible; he cautions against being overly pessimistic at supports and overly optimistic at resistances.
3)Daan also mentioned that BTC.D follows BTC higher, which usually indicates that in the early stage of a larger uptrend, BTC itself still has buyers. If the dominance rate drops too quickly instead, that would be a reason to doubt the momentum.
Editor’s scenario: Binance at 07:31 CST shows BTC around 78,678, with a 24-hour high of 81,273 and a low of 77,851. Price is still consolidating below 80,000. Today, watch just one route: as long as 77,850—78,000 is not convincingly broken down, wait for the high and low points; after price re-accepts 80,000, then look at 81,273—only afterwards discuss 83,000.
Invalidation conditions: after breaking below 77,850, it cannot quickly reclaim, or it rebounds to 80,000 only to be repeatedly pushed back down. Risk: this is a summary of viewpoints and a market scenario, not signal-following advice; with high leverage, encountering wicks, slippage, and funding-rate changes may directly magnify losses.
Will you wait for the pullback to 77,850—78,000, or wait for BTC to regain stability above 80,000?
#BTC #ETH #BNB
In the morning, what really matters for BTC is not whether it can push higher, but whether after a pullback it can reclaim and stand above 80,000.
Traders’ original views:
1)Trader XO (X: @Trader_XO, Aug 25) emphasized that for BTC to maintain bull-market conditions, the 50-week moving average needs to keep bending upward, and price must be accepted above it, before evolving into a trend lasting multiple weeks to months. His chart is BTC/USDT weekly candlesticks—not an intraday chasing signal.
2)Daan Crypto Trades (X: @DaanCrypto, Aug 25) believes that after BTC held above 60,000, it has already reached the high-end range near 80,000. It hasn’t swept up to 83,000 yet, but resistance is clearly visible; he cautions against being overly pessimistic at supports and overly optimistic at resistances.
3)Daan also mentioned that BTC.D follows BTC higher, which usually indicates that in the early stage of a larger uptrend, BTC itself still has buyers. If the dominance rate drops too quickly instead, that would be a reason to doubt the momentum.
Editor’s scenario: Binance at 07:31 CST shows BTC around 78,678, with a 24-hour high of 81,273 and a low of 77,851. Price is still consolidating below 80,000. Today, watch just one route: as long as 77,850—78,000 is not convincingly broken down, wait for the high and low points; after price re-accepts 80,000, then look at 81,273—only afterwards discuss 83,000.
Invalidation conditions: after breaking below 77,850, it cannot quickly reclaim, or it rebounds to 80,000 only to be repeatedly pushed back down. Risk: this is a summary of viewpoints and a market scenario, not signal-following advice; with high leverage, encountering wicks, slippage, and funding-rate changes may directly magnify losses.
Will you wait for the pullback to 77,850—78,000, or wait for BTC to regain stability above 80,000?
#BTC #ETH #BNB
【Top 10 Crypto Traders’ Highlights Today|BTC August 25】
BTC is not simply about chasing; the key is whether it can truly be accepted above 80,000.
Traders’ original views:
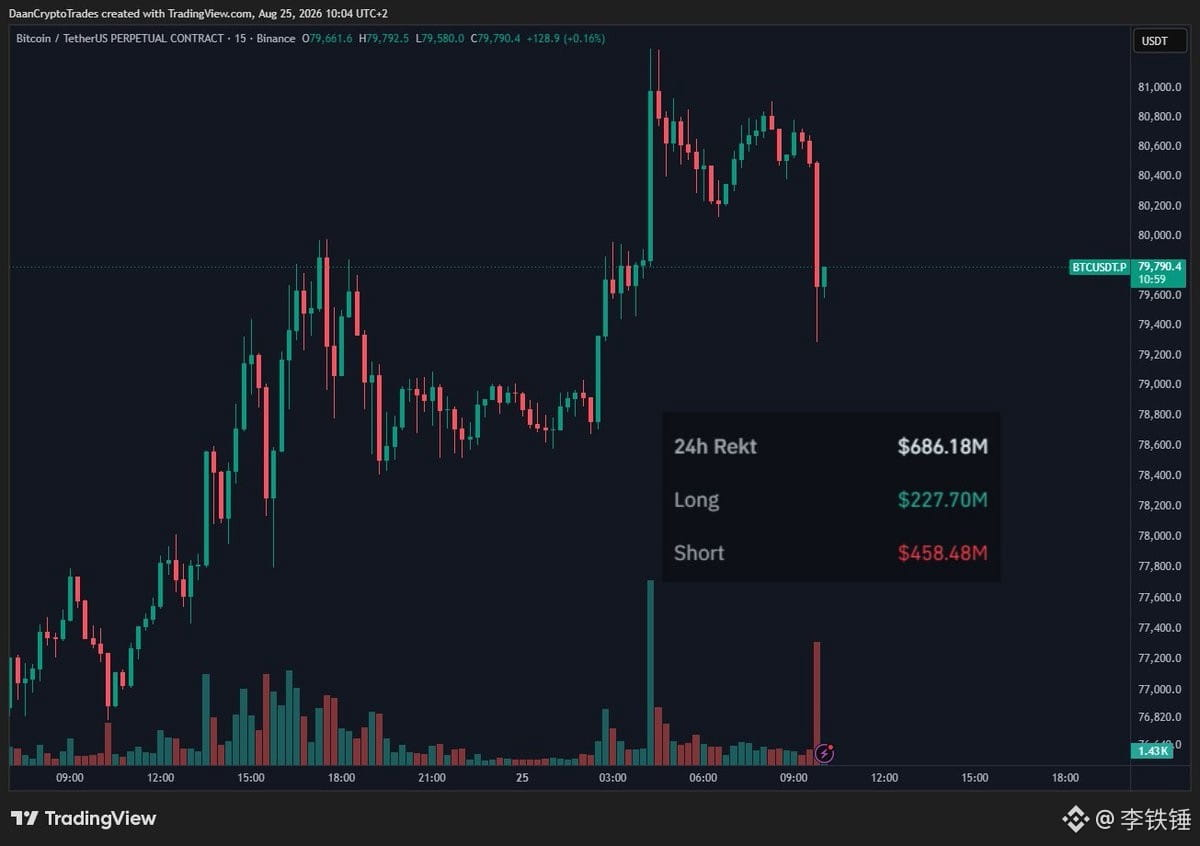
1. Daan Crypto Trades (@DaanCrypto, August 25) said that BTC’s price action has become chaotic, with both bulls and bears sides seeing large liquidations. Many highly leveraged longs were also swept out by a sharp intraday drop of 1%–3%.
2. Trader XO (@Trader_XO, August 25) believes that for a sustained bull market, price needs to be accepted above the 50-week moving average line and form a multi-week to multi-month uptrend; in the short term, there will likely be more opportunities for two-way volatility.
3. Cheds Trading (@BigCheds, August 25) pointed out that BTC’s break above 80,000 is very clean and it is now trying to push further.
Editor’s scenario: As of 18:30 CST, Binance’s latest BTCUSDT price is 79,317, with a 24-hour high of 81,273 and a low of 77,450. Tonight, we will only watch one path: first, expect consolidation/oscillation around 79,317 to 80,000. If it regains 80,000 and the subsequent retest does not break below 78,500, then look for 81,273; only if there is a breakout above 81,273 with increased volume should we discuss 82,000.
Invalidation criteria: A break below 78,500—especially if it is near 77,450—would indicate that acceptance above 80,000 has failed.
Risk: This is not trading advice. With high leverage, there can be consecutive liquidations during 1%–3% price swings. Do you think what matters more tonight is holding above 80,000, or defending 78,500?
#BTC #ETH #BNB
BTC is not simply about chasing; the key is whether it can truly be accepted above 80,000.
Traders’ original views:
1. Daan Crypto Trades (@DaanCrypto, August 25) said that BTC’s price action has become chaotic, with both bulls and bears sides seeing large liquidations. Many highly leveraged longs were also swept out by a sharp intraday drop of 1%–3%.
2. Trader XO (@Trader_XO, August 25) believes that for a sustained bull market, price needs to be accepted above the 50-week moving average line and form a multi-week to multi-month uptrend; in the short term, there will likely be more opportunities for two-way volatility.
3. Cheds Trading (@BigCheds, August 25) pointed out that BTC’s break above 80,000 is very clean and it is now trying to push further.
Editor’s scenario: As of 18:30 CST, Binance’s latest BTCUSDT price is 79,317, with a 24-hour high of 81,273 and a low of 77,450. Tonight, we will only watch one path: first, expect consolidation/oscillation around 79,317 to 80,000. If it regains 80,000 and the subsequent retest does not break below 78,500, then look for 81,273; only if there is a breakout above 81,273 with increased volume should we discuss 82,000.
Invalidation criteria: A break below 78,500—especially if it is near 77,450—would indicate that acceptance above 80,000 has failed.
Risk: This is not trading advice. With high leverage, there can be consecutive liquidations during 1%–3% price swings. Do you think what matters more tonight is holding above 80,000, or defending 78,500?
#BTC #ETH #BNB
【Top 10 Crypto Traders’ Picks for Today|BTC August 25】
Counterintuitive conclusion: This morning’s move isn’t just a straightforward chase of 80,000. Instead, the key question is whether BTC can turn the 76,670 to 74,000 zone back into support. As long as that area holds, the main track remains range-bound digestion before another test of 80,000, with further upside toward the weekly structure range of 82,000 to 84,000.
1)Daan Crypto Trades (X: @DaanCrypto)
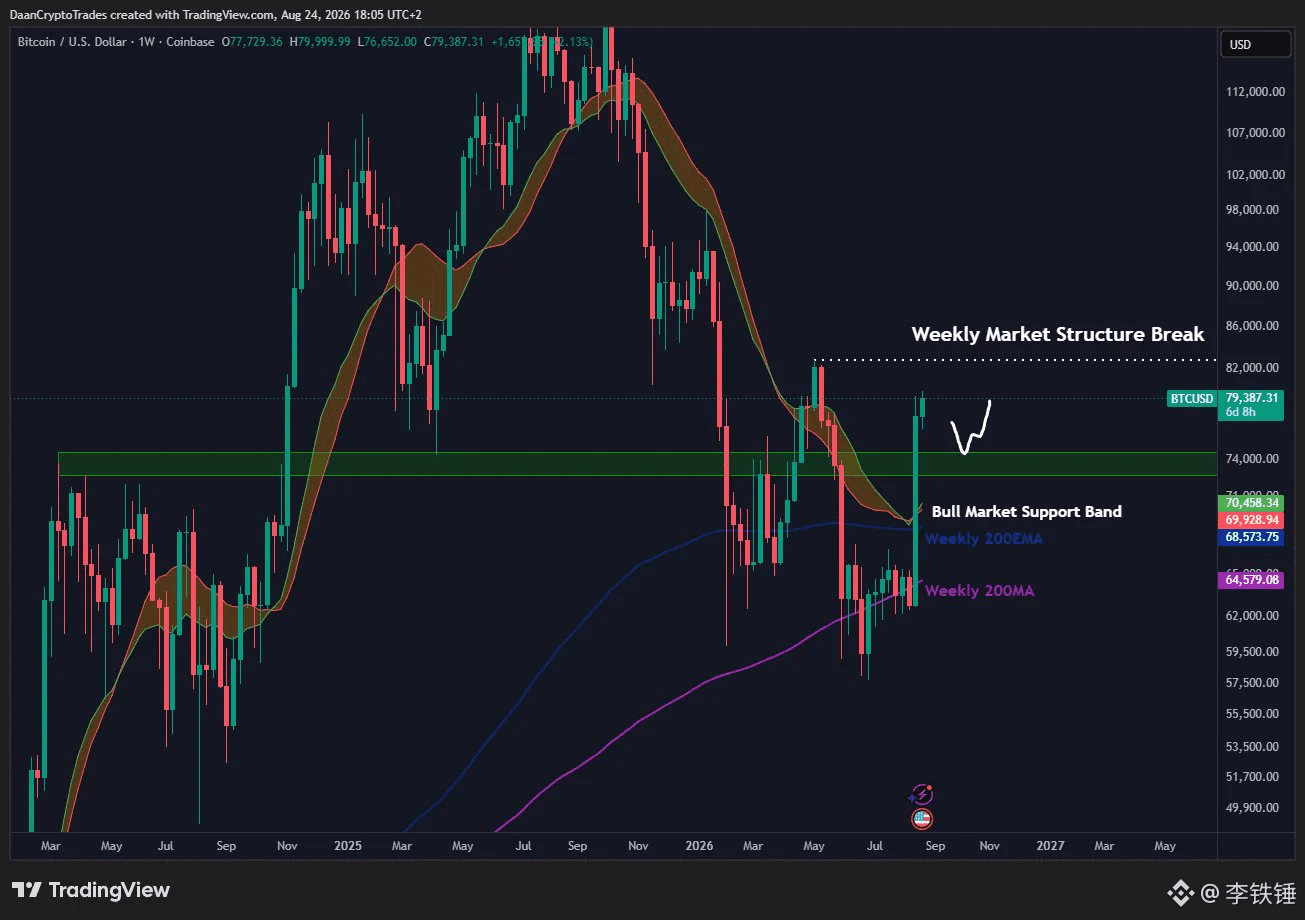
Original view: A single K-line candle has broken back above key daily and weekly levels. The short-term 73,000 to 74,000 area is important; if the weekly candle closes back below 70,000 again, it would signal clear weakness. The chart shows the BTCUSD weekly K-line, marking the bull-market support band, the 200-week moving average, and the upper weekly structure breakout zone.
2)Cheds (X: @BigCheds)
Original view: The sell wall around 80,000 isn’t necessarily a bearish sign—it could be a “loading wall,” which may get withdrawn before real trades occur. However, he also reminds that there’s a hidden divergence between the weekly RSI and price; only once price truly confirms a move does it become meaningful for trading.
3)CryptoCred (X: @CryptoCred)
Original view: The volatility after a large short liquidation is an important turning point. You can’t only look at a big bullish candle—also consider ETF flows, cross-exchange liquidity, funding rates, and OTC inventory.
Editorial scenario: Binance spot at 07:02 CST shows 78,686. The 24-hour high is 80,000 and the low is 76,670. The funding rate is about 0.006201%, not extremely crowded. My main thesis is: as long as 76,670 isn’t effectively broken down, BTC will first range between 78,000 and 80,000, then retest 80,000 a second time. If BTC holds above 80,000, next look for 82,000 to 84,000.
Invalidation conditions: After breaking below 76,670, it can’t be quickly reclaimed, or the weekly candle closes back below 70,000. The risk is repeated fake breakouts around 80,000—chasing long with leverage can easily get swept.
Do you think BTC will hold 80,000 first, or will it dip first from 76,670 to 74,000?
#BTC #ETH #BNB
Counterintuitive conclusion: This morning’s move isn’t just a straightforward chase of 80,000. Instead, the key question is whether BTC can turn the 76,670 to 74,000 zone back into support. As long as that area holds, the main track remains range-bound digestion before another test of 80,000, with further upside toward the weekly structure range of 82,000 to 84,000.
1)Daan Crypto Trades (X: @DaanCrypto)
Original view: A single K-line candle has broken back above key daily and weekly levels. The short-term 73,000 to 74,000 area is important; if the weekly candle closes back below 70,000 again, it would signal clear weakness. The chart shows the BTCUSD weekly K-line, marking the bull-market support band, the 200-week moving average, and the upper weekly structure breakout zone.
2)Cheds (X: @BigCheds)
Original view: The sell wall around 80,000 isn’t necessarily a bearish sign—it could be a “loading wall,” which may get withdrawn before real trades occur. However, he also reminds that there’s a hidden divergence between the weekly RSI and price; only once price truly confirms a move does it become meaningful for trading.
3)CryptoCred (X: @CryptoCred)
Original view: The volatility after a large short liquidation is an important turning point. You can’t only look at a big bullish candle—also consider ETF flows, cross-exchange liquidity, funding rates, and OTC inventory.
Editorial scenario: Binance spot at 07:02 CST shows 78,686. The 24-hour high is 80,000 and the low is 76,670. The funding rate is about 0.006201%, not extremely crowded. My main thesis is: as long as 76,670 isn’t effectively broken down, BTC will first range between 78,000 and 80,000, then retest 80,000 a second time. If BTC holds above 80,000, next look for 82,000 to 84,000.
Invalidation conditions: After breaking below 76,670, it can’t be quickly reclaimed, or the weekly candle closes back below 70,000. The risk is repeated fake breakouts around 80,000—chasing long with leverage can easily get swept.
Do you think BTC will hold 80,000 first, or will it dip first from 76,670 to 74,000?
#BTC #ETH #BNB
Log in to explore more content