

沧楠晟
4.9k Posts

沧楠晟
 Square Verified+
Report
Block User
公众号:@LF327369 加密飞龙 微博:加密飞龙 :推特 加密飞龙:全网同名 加密飞龙:手续费8折 LN5ZYWQB 邀请码 Web3领域研究,Crypto热点推介,土狗爱好者,一二级市场分析

Traders League Badge Beginner

PENGU Holder
Frequent Trader
5.8 Years
177 Following
31.3K+ Followers
46.5K+ Liked
1 Badges
Posts
All
Quotes
Videos
Live
PINNED
·
--
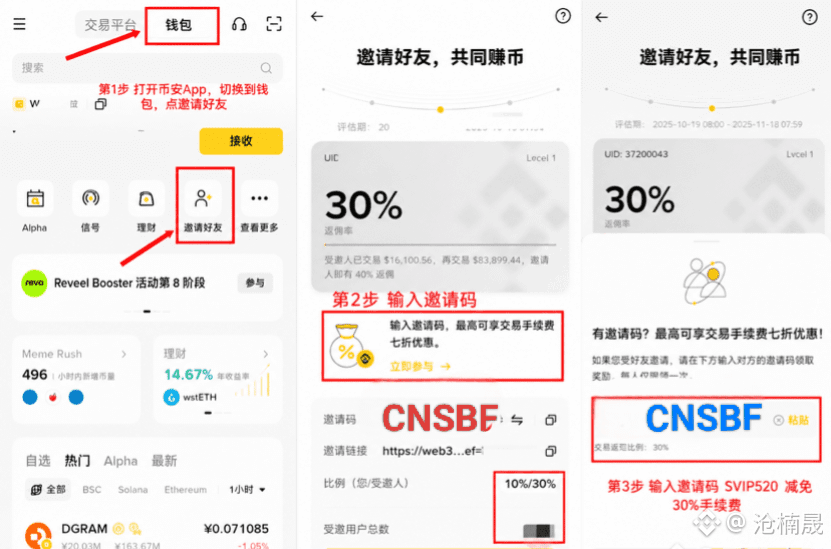
The meme market is hot right now. With tens of thousands of U trading hands frequently, just the fees alone can burn through several thousand U in a single day. This is absolutely a big problem! Money is money, no matter how little it is, so don’t ever treat it like it doesn’t matter. I strongly recommend everyone try Binance Wallet — the fee rates are really great!
First, as long as it’s an Alpha-listed coin (such as Flork, Niu Lai, etc.), the fee is always 0! The standard fee for ordinary memes is 0.5%, but if you use my referral link, you can enjoy a 30% cashback discount, which works out to only 0.35%. Recently, they also launched a 20% off promotion for the Robinhood chain. Combined with cashback, the fee is as low as 0.28%, absolutely the lowest on the entire web, and extremely friendly for large holders!
Here I’m sharing a “level-one wallet money-making idea”: everyone can register with a wallet, use an invite code to join the community, and discover the next cash cow together as early as possible!
Hurry and register with my invite code [CNSBF],
link: https://web3.binance.com/referral?ref=CNSBF.
[币安ALPHA](https://web3.binance.com/referral?ref=CNSBF) Saving money is making money, come join me and chase the next coin at low cost! $FLOCK
{future}(FLOCKUSDT)
$牛来
{future}(牛来USDT)
#美国8月新增就业16.2万近预期三倍
The meme market is hot right now. With tens of thousands of U trading hands frequently, just the fees alone can burn through several thousand U in a single day. This is absolutely a big problem! Money is money, no matter how little it is, so don’t ever treat it like it doesn’t matter. I strongly recommend everyone try Binance Wallet — the fee rates are really great!
First, as long as it’s an Alpha-listed coin (such as Flork, Niu Lai, etc.), the fee is always 0! The standard fee for ordinary memes is 0.5%, but if you use my referral link, you can enjoy a 30% cashback discount, which works out to only 0.35%. Recently, they also launched a 20% off promotion for the Robinhood chain. Combined with cashback, the fee is as low as 0.28%, absolutely the lowest on the entire web, and extremely friendly for large holders!
Here I’m sharing a “level-one wallet money-making idea”: everyone can register with a wallet, use an invite code to join the community, and discover the next cash cow together as early as possible!
Hurry and register with my invite code [CNSBF],
link: https://web3.binance.com/referral?ref=CNSBF.
币安ALPHA Saving money is making money, come join me and chase the next coin at low cost! $FLOCK
$牛来
#美国8月新增就业16.2万近预期三倍
First, as long as it’s an Alpha-listed coin (such as Flork, Niu Lai, etc.), the fee is always 0! The standard fee for ordinary memes is 0.5%, but if you use my referral link, you can enjoy a 30% cashback discount, which works out to only 0.35%. Recently, they also launched a 20% off promotion for the Robinhood chain. Combined with cashback, the fee is as low as 0.28%, absolutely the lowest on the entire web, and extremely friendly for large holders!
Here I’m sharing a “level-one wallet money-making idea”: everyone can register with a wallet, use an invite code to join the community, and discover the next cash cow together as early as possible!
Hurry and register with my invite code [CNSBF],
link: https://web3.binance.com/referral?ref=CNSBF.
币安ALPHA Saving money is making money, come join me and chase the next coin at low cost! $FLOCK
$牛来
#美国8月新增就业16.2万近预期三倍
4
1.9k
PINNED
·
--
The market is heating up, and your trading fees are turning into someone else’s “post-sleep income”
With this recent rally, I’m sure everyone has felt it too—BTC once pushed close to $78,000, the altcoin season has fully ignited, and trading volume has visibly surged. But there’s one question worth thinking about:
Where exactly does the trading fee you pay every day end up?
Referral commissions are not just about “saving on fees”
Let’s do some quick math. Binance’s spot and futures base fee rates are relatively low, but if you’re a high-frequency trader or have a certain trading volume, these small amounts add up to an eye-opening figure.
Binance Super Referral Program is designed to return part of the fees you were going to pay anyway back to your own pocket.
According to Binance’s official rules, the referrer can receive up to 40% of the commission rate, while the referred user can receive up to 20% cashback. The combined percentage for the referrer and referred user must not exceed 45%.
The market won’t always be this good, but once the referral commission pipeline is set up, it’s permanent.
When a bull market comes, trading volume grows and referral income rises with it; when a bear market comes, as long as the users you referred are still trading, the referral commissions won’t stop.
Enabling referral commissions is essentially installing a “market amplifier” for yourself—when the market is good, it helps you earn more; when the market is bad, it gives you a baseline income.
If you’re interested, just contact me directly. I’ll help you set up as a referrer and get back the fees that should rightfully belong to you.
If you need the referral commission and the referral commission enabling feature, contact me. Join the chat room to learn the specific setup process.
Click to join the referral program
[CNSBF](https://www.bsmkweb.cc/register?ref=CNSBF)
$TRUMP
{future}(TRUMPUSDT)
$ETH
{future}(ETHUSDT)
$PEPE
{spot}(PEPEUSDT)
#TRUMP突破3.4美元创3月21日以来新高 #美元跌至三个月低点
The market is heating up, and your trading fees are turning into someone else’s “post-sleep income”
With this recent rally, I’m sure everyone has felt it too—BTC once pushed close to $78,000, the altcoin season has fully ignited, and trading volume has visibly surged. But there’s one question worth thinking about:
Where exactly does the trading fee you pay every day end up?
Referral commissions are not just about “saving on fees”
Let’s do some quick math. Binance’s spot and futures base fee rates are relatively low, but if you’re a high-frequency trader or have a certain trading volume, these small amounts add up to an eye-opening figure.
Binance Super Referral Program is designed to return part of the fees you were going to pay anyway back to your own pocket.
According to Binance’s official rules, the referrer can receive up to 40% of the commission rate, while the referred user can receive up to 20% cashback. The combined percentage for the referrer and referred user must not exceed 45%.
The market won’t always be this good, but once the referral commission pipeline is set up, it’s permanent.
When a bull market comes, trading volume grows and referral income rises with it; when a bear market comes, as long as the users you referred are still trading, the referral commissions won’t stop.
Enabling referral commissions is essentially installing a “market amplifier” for yourself—when the market is good, it helps you earn more; when the market is bad, it gives you a baseline income.
If you’re interested, just contact me directly. I’ll help you set up as a referrer and get back the fees that should rightfully belong to you.
If you need the referral commission and the referral commission enabling feature, contact me. Join the chat room to learn the specific setup process.
Click to join the referral program
CNSBF
$TRUMP
$ETH
$PEPE
#TRUMP突破3.4美元创3月21日以来新高 #美元跌至三个月低点
With this recent rally, I’m sure everyone has felt it too—BTC once pushed close to $78,000, the altcoin season has fully ignited, and trading volume has visibly surged. But there’s one question worth thinking about:
Where exactly does the trading fee you pay every day end up?
Referral commissions are not just about “saving on fees”
Let’s do some quick math. Binance’s spot and futures base fee rates are relatively low, but if you’re a high-frequency trader or have a certain trading volume, these small amounts add up to an eye-opening figure.
Binance Super Referral Program is designed to return part of the fees you were going to pay anyway back to your own pocket.
According to Binance’s official rules, the referrer can receive up to 40% of the commission rate, while the referred user can receive up to 20% cashback. The combined percentage for the referrer and referred user must not exceed 45%.
The market won’t always be this good, but once the referral commission pipeline is set up, it’s permanent.
When a bull market comes, trading volume grows and referral income rises with it; when a bear market comes, as long as the users you referred are still trading, the referral commissions won’t stop.
Enabling referral commissions is essentially installing a “market amplifier” for yourself—when the market is good, it helps you earn more; when the market is bad, it gives you a baseline income.
If you’re interested, just contact me directly. I’ll help you set up as a referrer and get back the fees that should rightfully belong to you.
If you need the referral commission and the referral commission enabling feature, contact me. Join the chat room to learn the specific setup process.
Click to join the referral program
CNSBF
$TRUMP
$ETH
$PEPE
#TRUMP突破3.4美元创3月21日以来新高 #美元跌至三个月低点
3
650
·
--
Bullish
$RARE NFT market is experiencing a strong rebound. Within the seven days up to September 26, NFT sales reached approximately $55.51 million, up 57.17% from the prior week. The number of buyer addresses rose 39.65% to 160,565. NFT sales on the Ethereum network totaled $30.33 million, up as much as 113.52%, leading the entire market. Over the past 24 hours, the NFT sector overall gained 8.85%, making it one of the strongest-performing sectors. As the oldest and most established premium NFT art platform on Ethereum, SuperRare directly benefits from this structural recovery.
In late September, SuperRare scheduled a series of intensive NFT releases: on September 22, it launched Axstone’s “SUPER AXSTONE WORLD 99 IN 1” series; on September 23, it released don’t Buy’s Still MS Painting series (12 unique works, 24-hour auctions); and on September 25, it rolled out the BLOOD OF MY BLOOD series. The frequent, high-quality Drops brought sustained transaction flow and attention to the platform, and RARE, the platform’s governance token, directly benefited from the increased activity in the ecosystem.
{future}(RAREUSDT)
$RARE NFT market is experiencing a strong rebound. Within the seven days up to September 26, NFT sales reached approximately $55.51 million, up 57.17% from the prior week. The number of buyer addresses rose 39.65% to 160,565. NFT sales on the Ethereum network totaled $30.33 million, up as much as 113.52%, leading the entire market. Over the past 24 hours, the NFT sector overall gained 8.85%, making it one of the strongest-performing sectors. As the oldest and most established premium NFT art platform on Ethereum, SuperRare directly benefits from this structural recovery.
In late September, SuperRare scheduled a series of intensive NFT releases: on September 22, it launched Axstone’s “SUPER AXSTONE WORLD 99 IN 1” series; on September 23, it released don’t Buy’s Still MS Painting series (12 unique works, 24-hour auctions); and on September 25, it rolled out the BLOOD OF MY BLOOD series. The frequent, high-quality Drops brought sustained transaction flow and attention to the platform, and RARE, the platform’s governance token, directly benefited from the increased activity in the ecosystem.
In late September, SuperRare scheduled a series of intensive NFT releases: on September 22, it launched Axstone’s “SUPER AXSTONE WORLD 99 IN 1” series; on September 23, it released don’t Buy’s Still MS Painting series (12 unique works, 24-hour auctions); and on September 25, it rolled out the BLOOD OF MY BLOOD series. The frequent, high-quality Drops brought sustained transaction flow and attention to the platform, and RARE, the platform’s governance token, directly benefited from the increased activity in the ecosystem.
596
·
--
Bullish
Verified
$PHA Phala Network has fully shifted its positioning from “privacy computing” to “confidential AI.” At its core, it uses TEE (Trusted Execution Environment) to run AI model inference and agent contracts inside verifiable hardware “black boxes,” where nodes cannot see the original data. This shift hits the hottest market narrative right now: AI + privacy.
The partner side has been very active recently: Phala has integrated with Intel Trust Authority, using Intel TDX to create hardware-isolated confidential virtual machines; it has reached a strategic cooperation with io.net, leveraging IO Cloud to connect NVIDIA H100/H200 GPUs and expand decentralized AI capabilities; and it has partnered with Venice AI to enable private AI processing through TEE technology, helping PHA take a substantive position in the AI encryption track. The community has also passed GPU mining incentive proposals, and the official side has synchronized actual usage metrics for confidential AI.
{future}(PHAUSDT)
$PHA Phala Network has fully shifted its positioning from “privacy computing” to “confidential AI.” At its core, it uses TEE (Trusted Execution Environment) to run AI model inference and agent contracts inside verifiable hardware “black boxes,” where nodes cannot see the original data. This shift hits the hottest market narrative right now: AI + privacy.
The partner side has been very active recently: Phala has integrated with Intel Trust Authority, using Intel TDX to create hardware-isolated confidential virtual machines; it has reached a strategic cooperation with io.net, leveraging IO Cloud to connect NVIDIA H100/H200 GPUs and expand decentralized AI capabilities; and it has partnered with Venice AI to enable private AI processing through TEE technology, helping PHA take a substantive position in the AI encryption track. The community has also passed GPU mining incentive proposals, and the official side has synchronized actual usage metrics for confidential AI.
The partner side has been very active recently: Phala has integrated with Intel Trust Authority, using Intel TDX to create hardware-isolated confidential virtual machines; it has reached a strategic cooperation with io.net, leveraging IO Cloud to connect NVIDIA H100/H200 GPUs and expand decentralized AI capabilities; and it has partnered with Venice AI to enable private AI processing through TEE technology, helping PHA take a substantive position in the AI encryption track. The community has also passed GPU mining incentive proposals, and the official side has synchronized actual usage metrics for confidential AI.
1
1
795
·
--
Partly True
$QNT The contract total position value is approximately 11.62 million USDT, with a total position size of approximately 118,400 QNT. The ratio of large-holder long-to-short accounts is 0.82; short accounts account for 54.96%, while long accounts account for 45.04%. Short accounts have a slight numerical advantage. The key structure is as follows: in the past 24 hours, the short liquidation amount for QNT reached 3.545 million USD, while long liquidations were only 0.455 million USD. Shorts were largely swept out during the price increase. Over the past 24 hours, contract funds recorded a net inflow of approximately 1.967 million USD, with an inflow acceleration of 737%, indicating that incremental leveraged funds entered in a concentrated manner after the news was released.
On September 25, the RWA tokenization sector surged significantly overall, with ONDO and QNT leading the gains. The on-chain tokenized RWA market size is already in the range of 34 billion to 46 billion USD. Over the past year, it has grown by approximately 40% to 85%. The industry is transitioning from prototype applications to real products and infrastructure. On the same day, the U.S. Federal Reserve publicly solicited feedback on the payment stablecoin regulatory framework under the GENIUS Act. The core includes maintaining fully funded, highly liquid reserves and the application process for banks to issue stablecoins. Stablecoins and tokenized deposits are moving from the “wild growth” phase into a bank-grade rule stage.
{future}(QNTUSDT)
$QNT The contract total position value is approximately 11.62 million USDT, with a total position size of approximately 118,400 QNT. The ratio of large-holder long-to-short accounts is 0.82; short accounts account for 54.96%, while long accounts account for 45.04%. Short accounts have a slight numerical advantage. The key structure is as follows: in the past 24 hours, the short liquidation amount for QNT reached 3.545 million USD, while long liquidations were only 0.455 million USD. Shorts were largely swept out during the price increase. Over the past 24 hours, contract funds recorded a net inflow of approximately 1.967 million USD, with an inflow acceleration of 737%, indicating that incremental leveraged funds entered in a concentrated manner after the news was released.
On September 25, the RWA tokenization sector surged significantly overall, with ONDO and QNT leading the gains. The on-chain tokenized RWA market size is already in the range of 34 billion to 46 billion USD. Over the past year, it has grown by approximately 40% to 85%. The industry is transitioning from prototype applications to real products and infrastructure. On the same day, the U.S. Federal Reserve publicly solicited feedback on the payment stablecoin regulatory framework under the GENIUS Act. The core includes maintaining fully funded, highly liquid reserves and the application process for banks to issue stablecoins. Stablecoins and tokenized deposits are moving from the “wild growth” phase into a bank-grade rule stage.
On September 25, the RWA tokenization sector surged significantly overall, with ONDO and QNT leading the gains. The on-chain tokenized RWA market size is already in the range of 34 billion to 46 billion USD. Over the past year, it has grown by approximately 40% to 85%. The industry is transitioning from prototype applications to real products and infrastructure. On the same day, the U.S. Federal Reserve publicly solicited feedback on the payment stablecoin regulatory framework under the GENIUS Act. The core includes maintaining fully funded, highly liquid reserves and the application process for banks to issue stablecoins. Stablecoins and tokenized deposits are moving from the “wild growth” phase into a bank-grade rule stage.
593
·
--
Bullish
Verified
$ARK Contract total value is approximately 7.89 million USDT, with total holdings of approximately 33.77 million ARK tokens. During the day, it has continued to climb steadily from the lows. The ratio between large-holder long and short accounts is 1.11. Long accounts account for 52.50%, while short accounts account for 47.50%, giving a slight advantage to long positions. Price started rising around 0.1557, reaching a daytime high of 0.2397, representing an increase of over 35%.
The RWA tokenization narrative continues to heat up, with traditional asset management capital accelerating on-chain.
On September 24, Cathie Wood’s ARK Invest announced a partnership with tokenization platform Securitize to tokenize its ARK Venture Fund (ARKVX). The fund’s holdings include leading private tech companies such as OpenAI, Anthropic, Stripe, and Databricks. Tokenized shares will first be issued on Ethereum. This event marks that traditional asset management institutions are accelerating the process of moving private equity assets on-chain. The RWA tokenization track is moving from the concept-validation stage into a phase of practical implementation. As an asset management firm managing hundreds of billions of dollars in assets, ARK Invest’s move toward tokenization has a significant demonstration effect for the RWA sector, further strengthening the trend of capital rotating toward tokenized asset infrastructure.
{future}(ARKUSDT)
$ARK Contract total value is approximately 7.89 million USDT, with total holdings of approximately 33.77 million ARK tokens. During the day, it has continued to climb steadily from the lows. The ratio between large-holder long and short accounts is 1.11. Long accounts account for 52.50%, while short accounts account for 47.50%, giving a slight advantage to long positions. Price started rising around 0.1557, reaching a daytime high of 0.2397, representing an increase of over 35%.
The RWA tokenization narrative continues to heat up, with traditional asset management capital accelerating on-chain.
On September 24, Cathie Wood’s ARK Invest announced a partnership with tokenization platform Securitize to tokenize its ARK Venture Fund (ARKVX). The fund’s holdings include leading private tech companies such as OpenAI, Anthropic, Stripe, and Databricks. Tokenized shares will first be issued on Ethereum. This event marks that traditional asset management institutions are accelerating the process of moving private equity assets on-chain. The RWA tokenization track is moving from the concept-validation stage into a phase of practical implementation. As an asset management firm managing hundreds of billions of dollars in assets, ARK Invest’s move toward tokenization has a significant demonstration effect for the RWA sector, further strengthening the trend of capital rotating toward tokenized asset infrastructure.
The RWA tokenization narrative continues to heat up, with traditional asset management capital accelerating on-chain.
On September 24, Cathie Wood’s ARK Invest announced a partnership with tokenization platform Securitize to tokenize its ARK Venture Fund (ARKVX). The fund’s holdings include leading private tech companies such as OpenAI, Anthropic, Stripe, and Databricks. Tokenized shares will first be issued on Ethereum. This event marks that traditional asset management institutions are accelerating the process of moving private equity assets on-chain. The RWA tokenization track is moving from the concept-validation stage into a phase of practical implementation. As an asset management firm managing hundreds of billions of dollars in assets, ARK Invest’s move toward tokenization has a significant demonstration effect for the RWA sector, further strengthening the trend of capital rotating toward tokenized asset infrastructure.
579
·
--
$XAU
{future}(XAUUSDT)
Gold is still not doing very well right now—there aren’t many good opportunities, so it’s only suitable for quick short-term trades.
The 4350 I mentioned yesterday didn’t hold either, so it fell again. I followed the trend and trimmed a bit. Xiao Ling, please keep an eye on 4280–4260 below.
$XAU
Gold is still not doing very well right now—there aren’t many good opportunities, so it’s only suitable for quick short-term trades.
The 4350 I mentioned yesterday didn’t hold either, so it fell again. I followed the trend and trimmed a bit. Xiao Ling, please keep an eye on 4280–4260 below.
Gold is still not doing very well right now—there aren’t many good opportunities, so it’s only suitable for quick short-term trades.
The 4350 I mentioned yesterday didn’t hold either, so it fell again. I followed the trend and trimmed a bit. Xiao Ling, please keep an eye on 4280–4260 below.
2.5k
·
--
Verified
$FIGHT UFC official partner, sports fan economy token
FIGHT is a sports fighting ecosystem token led by Fight.ID, with multiple years of partnerships signed with the UFC. The UFC holds 40+ events per year, reaching 700 million viewers. The ecosystem uses a three-layer architecture of “identity-reputation-ownership.” Users build on-chain identities through Fight.ID, participate in event predictions and interactions to accumulate FP points. The FIGHT token is used for staking, payments, and governance. The team previously operated the UFC Strike digital collectibles platform, achieving over $20 million in sales revenue.
{future}(FIGHTUSDT)
$FIGHT UFC official partner, sports fan economy token
FIGHT is a sports fighting ecosystem token led by Fight.ID, with multiple years of partnerships signed with the UFC. The UFC holds 40+ events per year, reaching 700 million viewers. The ecosystem uses a three-layer architecture of “identity-reputation-ownership.” Users build on-chain identities through Fight.ID, participate in event predictions and interactions to accumulate FP points. The FIGHT token is used for staking, payments, and governance. The team previously operated the UFC Strike digital collectibles platform, achieving over $20 million in sales revenue.
FIGHT is a sports fighting ecosystem token led by Fight.ID, with multiple years of partnerships signed with the UFC. The UFC holds 40+ events per year, reaching 700 million viewers. The ecosystem uses a three-layer architecture of “identity-reputation-ownership.” Users build on-chain identities through Fight.ID, participate in event predictions and interactions to accumulate FP points. The FIGHT token is used for staking, payments, and governance. The team previously operated the UFC Strike digital collectibles platform, achieving over $20 million in sales revenue.
920
·
--
Bullish
Verified
$MET Meteora generated approximately $20.3 million in fee revenue over the past 30 days; just in the last 24 hours, it received $1.03 million. Active addresses surpassed 151,000, and the number of transactions increased from 2.96 million to 4.19 million. The funding rate has remained slightly positive at 0.006%, with long positions paying moderately—still not at a level of leverage crowding—leaving room for further continuation of the spot-led uptrend.
Operating as a Solana liquidity infrastructure layer since February 2023, Meteora has cumulatively processed transaction volume exceeding $208 billion. Its current TVL is over $800 million. The project allocates 88% of its quarterly revenue to buy back and burn MET tokens, directly countering dilution pressure caused by token issuance, making it one of the few DeFi protocols in the Solana ecosystem that directly links protocol revenue to token value.
{future}(METUSDT)
$MET Meteora generated approximately $20.3 million in fee revenue over the past 30 days; just in the last 24 hours, it received $1.03 million. Active addresses surpassed 151,000, and the number of transactions increased from 2.96 million to 4.19 million. The funding rate has remained slightly positive at 0.006%, with long positions paying moderately—still not at a level of leverage crowding—leaving room for further continuation of the spot-led uptrend.
Operating as a Solana liquidity infrastructure layer since February 2023, Meteora has cumulatively processed transaction volume exceeding $208 billion. Its current TVL is over $800 million. The project allocates 88% of its quarterly revenue to buy back and burn MET tokens, directly countering dilution pressure caused by token issuance, making it one of the few DeFi protocols in the Solana ecosystem that directly links protocol revenue to token value.
Operating as a Solana liquidity infrastructure layer since February 2023, Meteora has cumulatively processed transaction volume exceeding $208 billion. Its current TVL is over $800 million. The project allocates 88% of its quarterly revenue to buy back and burn MET tokens, directly countering dilution pressure caused by token issuance, making it one of the few DeFi protocols in the Solana ecosystem that directly links protocol revenue to token value.
1
577
·
--
Bullish
Partly True
$TAKE Total value of contract positions is approximately 22.28 million USDT, with a total position size of approximately 112 million TAKE tokens. Intraday, the volume has risen steadily from 83.1 million tokens to 112 million tokens, with incremental funds concentrated into the market. The long-vs-short account ratio among large holders is only 0.69. Short-only accounts account for as much as 59.26%, while long accounts make up just 40.74%, indicating extreme concentration among short accounts. The price surged rapidly from around 0.058 to 0.215. During the upward move, shorts were forced to cover, and the short-squeeze structure created an upward amplification effect on the price.
OVERTAKE is a peer-to-peer game asset trading marketplace built on the Sui blockchain. It moves traditional game account, equipment, and in-game currency trading onto the chain, solving trust issues in traditional off-platform transactions through a multisig smart contract custody mechanism. The platform has already completed a $7 million strategic financing round, with investments from entities including Sui. It has previously reached strategic partnerships with itemBay, the largest game asset trading platform in South Korea, and PlayerAuctions, a global digital asset trading platform.
{future}(TAKEUSDT)
$TAKE Total value of contract positions is approximately 22.28 million USDT, with a total position size of approximately 112 million TAKE tokens. Intraday, the volume has risen steadily from 83.1 million tokens to 112 million tokens, with incremental funds concentrated into the market. The long-vs-short account ratio among large holders is only 0.69. Short-only accounts account for as much as 59.26%, while long accounts make up just 40.74%, indicating extreme concentration among short accounts. The price surged rapidly from around 0.058 to 0.215. During the upward move, shorts were forced to cover, and the short-squeeze structure created an upward amplification effect on the price.
OVERTAKE is a peer-to-peer game asset trading marketplace built on the Sui blockchain. It moves traditional game account, equipment, and in-game currency trading onto the chain, solving trust issues in traditional off-platform transactions through a multisig smart contract custody mechanism. The platform has already completed a $7 million strategic financing round, with investments from entities including Sui. It has previously reached strategic partnerships with itemBay, the largest game asset trading platform in South Korea, and PlayerAuctions, a global digital asset trading platform.
OVERTAKE is a peer-to-peer game asset trading marketplace built on the Sui blockchain. It moves traditional game account, equipment, and in-game currency trading onto the chain, solving trust issues in traditional off-platform transactions through a multisig smart contract custody mechanism. The platform has already completed a $7 million strategic financing round, with investments from entities including Sui. It has previously reached strategic partnerships with itemBay, the largest game asset trading platform in South Korea, and PlayerAuctions, a global digital asset trading platform.
2
1.1k
·
--
Bullish
The market is this strong already, so don’t cling to the bear-market playbook. When it’s time to be aggressive, don’t be conservative.
If you don’t treat bear-market syndrome and don’t switch your mindset off that track, even when a bull market comes, you won’t be able to catch it. $ETH
{future}(ETHUSDT)
$MUBARAK
{future}(MUBARAKUSDT)
The market is this strong already, so don’t cling to the bear-market playbook. When it’s time to be aggressive, don’t be conservative.
If you don’t treat bear-market syndrome and don’t switch your mindset off that track, even when a bull market comes, you won’t be able to catch it. $ETH
$MUBARAK
If you don’t treat bear-market syndrome and don’t switch your mindset off that track, even when a bull market comes, you won’t be able to catch it. $ETH
$MUBARAK
1k
·
--
Bullish
$NIL Dusk Mainnet Deployment Schedule Locked, Encrypted Markets Narrative Enters Countdown
On September 21, Nillion officially released its “Encrypted Markets” seven-stage roadmap. In the first stage, Dusk will be deployed to the Ethereum mainnet in the first week of October, introducing condition-triggered events, permissionless nodes, and developer tools. The first batch of applications based on Covenants has been launched on the testnet. Subsequent stages will be rolled out in order: Darkfall (expanded to more EVM chains), Skyglow (cross-chain execution), Nightside (user-defined conditions), and Neon (dedicated language and virtual machine).
The Covenants mechanism is the key differentiator. Traders can predefine conditional trade instructions based on price thresholds or time windows, store them on-chain in encrypted form; the instructions remain sealed until the conditions are met. With the assistance of Nillion nodes, they are unlocked on-chain and enter settlement. The system runs in a decentralized manner and does not rely on a single operator to decide when to activate instructions. Dusk’s first version has completed end-to-end testing for sealed stop-loss orders and sealed-bid auctions.
{future}(NILUSDT)
$NIL Dusk Mainnet Deployment Schedule Locked, Encrypted Markets Narrative Enters Countdown
On September 21, Nillion officially released its “Encrypted Markets” seven-stage roadmap. In the first stage, Dusk will be deployed to the Ethereum mainnet in the first week of October, introducing condition-triggered events, permissionless nodes, and developer tools. The first batch of applications based on Covenants has been launched on the testnet. Subsequent stages will be rolled out in order: Darkfall (expanded to more EVM chains), Skyglow (cross-chain execution), Nightside (user-defined conditions), and Neon (dedicated language and virtual machine).
The Covenants mechanism is the key differentiator. Traders can predefine conditional trade instructions based on price thresholds or time windows, store them on-chain in encrypted form; the instructions remain sealed until the conditions are met. With the assistance of Nillion nodes, they are unlocked on-chain and enter settlement. The system runs in a decentralized manner and does not rely on a single operator to decide when to activate instructions. Dusk’s first version has completed end-to-end testing for sealed stop-loss orders and sealed-bid auctions.
On September 21, Nillion officially released its “Encrypted Markets” seven-stage roadmap. In the first stage, Dusk will be deployed to the Ethereum mainnet in the first week of October, introducing condition-triggered events, permissionless nodes, and developer tools. The first batch of applications based on Covenants has been launched on the testnet. Subsequent stages will be rolled out in order: Darkfall (expanded to more EVM chains), Skyglow (cross-chain execution), Nightside (user-defined conditions), and Neon (dedicated language and virtual machine).
The Covenants mechanism is the key differentiator. Traders can predefine conditional trade instructions based on price thresholds or time windows, store them on-chain in encrypted form; the instructions remain sealed until the conditions are met. With the assistance of Nillion nodes, they are unlocked on-chain and enter settlement. The system runs in a decentralized manner and does not rely on a single operator to decide when to activate instructions. Dusk’s first version has completed end-to-end testing for sealed stop-loss orders and sealed-bid auctions.
434
·
--
Bullish
$MUBARAK Long and short accounts are moving toward equilibrium; major funds are highly involved
The total value of contract positions is about 31.79 million USDT, with a total position count of about 495 million MUBARAK tokens. The ratio of large long vs. short accounts is 0.99. The share of empty (short) positions is 50.36%, while the share of long positions is 49.64%. Long and short forces are now fully balanced, in contrast to earlier products where long/short sentiment was one-sided and crowded. In terms of fund flows, the score is +57, the inflow share is 92%, and the capital acceleration is as high as 19.51x. The concentration of main-cycle institutional/whale chips is extremely high. However, note that positions among the top 100 addresses are extremely concentrated, which will significantly amplify both the speed of pull-ups and the speed of sell-offs.
{future}(MUBARAKUSDT)
$MUBARAK Long and short accounts are moving toward equilibrium; major funds are highly involved
The total value of contract positions is about 31.79 million USDT, with a total position count of about 495 million MUBARAK tokens. The ratio of large long vs. short accounts is 0.99. The share of empty (short) positions is 50.36%, while the share of long positions is 49.64%. Long and short forces are now fully balanced, in contrast to earlier products where long/short sentiment was one-sided and crowded. In terms of fund flows, the score is +57, the inflow share is 92%, and the capital acceleration is as high as 19.51x. The concentration of main-cycle institutional/whale chips is extremely high. However, note that positions among the top 100 addresses are extremely concentrated, which will significantly amplify both the speed of pull-ups and the speed of sell-offs.
The total value of contract positions is about 31.79 million USDT, with a total position count of about 495 million MUBARAK tokens. The ratio of large long vs. short accounts is 0.99. The share of empty (short) positions is 50.36%, while the share of long positions is 49.64%. Long and short forces are now fully balanced, in contrast to earlier products where long/short sentiment was one-sided and crowded. In terms of fund flows, the score is +57, the inflow share is 92%, and the capital acceleration is as high as 19.51x. The concentration of main-cycle institutional/whale chips is extremely high. However, note that positions among the top 100 addresses are extremely concentrated, which will significantly amplify both the speed of pull-ups and the speed of sell-offs.
833
·
--
Verified
$KERNEL TVL over $1 billion, three main product lines cover 10+ public chains
KernelDAO total value locked exceeds $1 billion, covering more than 10 public chains including Ethereum, BNB Chain, Arbitrum, and Optimism. Core products include: Kernel (the largest shared security network on BNB Chain, with TVL of about $650 million), Kelp LRT (Ethereum-leading liquid restaking protocol), and Gain (an automated yield vault). The project has raised a cumulative $10 million in funding, with investors including Binance Labs, SCB Limited, and Laser Digital, and it has a $40 million strategic ecosystem fund that has attracted over 25 partner projects.
{future}(KERNELUSDT)
$KERNEL TVL over $1 billion, three main product lines cover 10+ public chains
KernelDAO total value locked exceeds $1 billion, covering more than 10 public chains including Ethereum, BNB Chain, Arbitrum, and Optimism. Core products include: Kernel (the largest shared security network on BNB Chain, with TVL of about $650 million), Kelp LRT (Ethereum-leading liquid restaking protocol), and Gain (an automated yield vault). The project has raised a cumulative $10 million in funding, with investors including Binance Labs, SCB Limited, and Laser Digital, and it has a $40 million strategic ecosystem fund that has attracted over 25 partner projects.
KernelDAO total value locked exceeds $1 billion, covering more than 10 public chains including Ethereum, BNB Chain, Arbitrum, and Optimism. Core products include: Kernel (the largest shared security network on BNB Chain, with TVL of about $650 million), Kelp LRT (Ethereum-leading liquid restaking protocol), and Gain (an automated yield vault). The project has raised a cumulative $10 million in funding, with investors including Binance Labs, SCB Limited, and Laser Digital, and it has a $40 million strategic ecosystem fund that has attracted over 25 partner projects.
1
930
·
--
Bullish
As a leading RWA (real-world assets) in the Solana ecosystem, Kamino has surpassed $1 billion in RWA deposits. It has rolled out an institutional-grade yield treasury, supporting tokenized stocks and other diversified assets. In collaboration with Anchorage, Kamino has reached a three-party institutional partnership to connect the SOL staking credit channel, opening the gateway for institutional capital to enter. The accompanying KMNO-PYUSD liquidity treasury continues to provide liquidity incentives, further strengthening the ecosystem.
In terms of the sector, the Solana ecosystem has continuously attracted large-scale RWA capital over the past 30 days, making the RWA segment a key hot topic on the current layer-1 chain narrative. Large contract holders are in a favorable long position, with the long-to-short ratio at 1.55 and longs holding the dominant amount of positioning. Sector capital rotation brings opportunities for valuation recovery. $KMNO
{future}(KMNOUSDT)
As a leading RWA (real-world assets) in the Solana ecosystem, Kamino has surpassed $1 billion in RWA deposits. It has rolled out an institutional-grade yield treasury, supporting tokenized stocks and other diversified assets. In collaboration with Anchorage, Kamino has reached a three-party institutional partnership to connect the SOL staking credit channel, opening the gateway for institutional capital to enter. The accompanying KMNO-PYUSD liquidity treasury continues to provide liquidity incentives, further strengthening the ecosystem.
In terms of the sector, the Solana ecosystem has continuously attracted large-scale RWA capital over the past 30 days, making the RWA segment a key hot topic on the current layer-1 chain narrative. Large contract holders are in a favorable long position, with the long-to-short ratio at 1.55 and longs holding the dominant amount of positioning. Sector capital rotation brings opportunities for valuation recovery. $KMNO
In terms of the sector, the Solana ecosystem has continuously attracted large-scale RWA capital over the past 30 days, making the RWA segment a key hot topic on the current layer-1 chain narrative. Large contract holders are in a favorable long position, with the long-to-short ratio at 1.55 and longs holding the dominant amount of positioning. Sector capital rotation brings opportunities for valuation recovery. $KMNO
2.6k
·
--
Verified
Sino-US cooperation exceeded expectations...
Tonight, US stocks will be the first to trigger it...
If rare earths are exchanged for B300, then it would be an enormous positive catalyst.
From September 23 to 25, a state visit to the United States. $SNDK
{future}(SNDKUSDT)
$SKHYNIX
{future}(SKHYNIXUSDT)
Sino-US cooperation exceeded expectations...
Tonight, US stocks will be the first to trigger it...
If rare earths are exchanged for B300, then it would be an enormous positive catalyst.
From September 23 to 25, a state visit to the United States. $SNDK
$SKHYNIX
Tonight, US stocks will be the first to trigger it...
If rare earths are exchanged for B300, then it would be an enormous positive catalyst.
From September 23 to 25, a state visit to the United States. $SNDK
$SKHYNIX
1
2.5k
·
--
Market update: Bitcoin rises to $85,004.4, up 5.56% over the past 24 hours; Ethereum rises to $2,743.67, up 6.17% over the past 24 hours. $ETH
{future}(ETHUSDT)
$BTC
{future}(BTCUSDT)
Market update: Bitcoin rises to $85,004.4, up 5.56% over the past 24 hours; Ethereum rises to $2,743.67, up 6.17% over the past 24 hours. $ETH
$BTC
$BTC
348
·
--
Bullish
Partly True
$NIL The total contract position value is approximately 5.81 million USDT, the total position quantity is approximately 88.81 million NIL. During the day, there was a pullback from the high point, indicating that some funds have begun to withdraw during the ramp-up process. The ratio of large-holder long vs. short accounts is 1.88. Long accounts account for 65.27%, while empty short positions account for only 34.73%, meaning long-side accounts have an advantage in number. After the price surged to around 0.075, it pulled back to around 0.065. In the short term, some profit-taking has been released.
Currently, NIL benefits from a dual driver: the overall rebound in risk appetite across the crypto market and the mainnet deployment by Encrypted Markets. The narrative direction is clear. However, it’s important to note that mainnet deployment is a positive catalyst that has already been realized; the actual adoption rate and the level of developer participation still need time to be verified. The two key variables for the short-term market are (1) the progress of token unlocks on September 24 and (2) negotiations related to market makers’ selling. If the price has already risen sufficiently before the unlock, some holders may choose to realize gains ahead of time, creating a front-loaded sell pressure.
{future}(NILUSDT)
$NIL The total contract position value is approximately 5.81 million USDT, the total position quantity is approximately 88.81 million NIL. During the day, there was a pullback from the high point, indicating that some funds have begun to withdraw during the ramp-up process. The ratio of large-holder long vs. short accounts is 1.88. Long accounts account for 65.27%, while empty short positions account for only 34.73%, meaning long-side accounts have an advantage in number. After the price surged to around 0.075, it pulled back to around 0.065. In the short term, some profit-taking has been released.
Currently, NIL benefits from a dual driver: the overall rebound in risk appetite across the crypto market and the mainnet deployment by Encrypted Markets. The narrative direction is clear. However, it’s important to note that mainnet deployment is a positive catalyst that has already been realized; the actual adoption rate and the level of developer participation still need time to be verified. The two key variables for the short-term market are (1) the progress of token unlocks on September 24 and (2) negotiations related to market makers’ selling. If the price has already risen sufficiently before the unlock, some holders may choose to realize gains ahead of time, creating a front-loaded sell pressure.
Currently, NIL benefits from a dual driver: the overall rebound in risk appetite across the crypto market and the mainnet deployment by Encrypted Markets. The narrative direction is clear. However, it’s important to note that mainnet deployment is a positive catalyst that has already been realized; the actual adoption rate and the level of developer participation still need time to be verified. The two key variables for the short-term market are (1) the progress of token unlocks on September 24 and (2) negotiations related to market makers’ selling. If the price has already risen sufficiently before the unlock, some holders may choose to realize gains ahead of time, creating a front-loaded sell pressure.
2.3k
·
--
Bro, I’m back in on virtual coins again. Even though the past few days I lost so much that I even lost my underwear, I heard the rumor. A bunch of coins are being bought in bulk, and a bunch of counterfeit coins start to appreciate. I get it—this grand feast is about to begin again. This time, I won’t be the last one to leave. I want to be the first batch to make money, and I also want everyone else to foot the bill for me once.$AKE
{future}(AKEUSDT)
$UB
{future}(UBUSDT)
$CLRB.US
{stock_us}(CLRB.US)
Bro, I’m back in on virtual coins again. Even though the past few days I lost so much that I even lost my underwear, I heard the rumor. A bunch of coins are being bought in bulk, and a bunch of counterfeit coins start to appreciate. I get it—this grand feast is about to begin again. This time, I won’t be the last one to leave. I want to be the first batch to make money, and I also want everyone else to foot the bill for me once.$AKE
$UB
$CLRB.US
$UB
$CLRB.US
543
·
--
Bearish
Verified
$AKE 121st, September 21, AKE saw 2.11% of its 10 billion total token supply—2.11 billion tokens—unlocked, with a current-price value of about $127 million. In the unlocked allocation, investors accounted for 47.4% and insiders for 22.1%, totaling nearly 70%. Their cost basis is far below the current market price, and the incentive to cash out is extremely strong.
Earlier on September 20, on-chain monitoring showed the AKE price briefly spiked to 0.1646; it is suspected that a proactive market maker then withdrew 216 million AKE tokens (worth about $13.83 million) from Binance Alpha. The entity’s on-chain holdings are at least 12.4 billion tokens, representing roughly 54% of the circulating supply. This is a typical pump-and-transfer of funds: it aligns with today’s unlock release, and heavy sell-pressure from the supply side appears to have concentrated and erupted.
{future}(AKEUSDT)
$AKE 121st, September 21, AKE saw 2.11% of its 10 billion total token supply—2.11 billion tokens—unlocked, with a current-price value of about $127 million. In the unlocked allocation, investors accounted for 47.4% and insiders for 22.1%, totaling nearly 70%. Their cost basis is far below the current market price, and the incentive to cash out is extremely strong.
Earlier on September 20, on-chain monitoring showed the AKE price briefly spiked to 0.1646; it is suspected that a proactive market maker then withdrew 216 million AKE tokens (worth about $13.83 million) from Binance Alpha. The entity’s on-chain holdings are at least 12.4 billion tokens, representing roughly 54% of the circulating supply. This is a typical pump-and-transfer of funds: it aligns with today’s unlock release, and heavy sell-pressure from the supply side appears to have concentrated and erupted.
Earlier on September 20, on-chain monitoring showed the AKE price briefly spiked to 0.1646; it is suspected that a proactive market maker then withdrew 216 million AKE tokens (worth about $13.83 million) from Binance Alpha. The entity’s on-chain holdings are at least 12.4 billion tokens, representing roughly 54% of the circulating supply. This is a typical pump-and-transfer of funds: it aligns with today’s unlock release, and heavy sell-pressure from the supply side appears to have concentrated and erupted.
1
1
2.6k
Log in to explore more content
Join global crypto users on Binance Square
⚡️ Get latest and useful information about crypto.
💬 Trusted by the world’s largest crypto exchange.
👍 Discover real insights from verified creators.
Email / Phone number
Trending Topics
CircleMints500MUSDCOnSolana
12,913 views
529 Discussing
#circlemints500musdconsolana
🚨 HUGE Liquidity Boost! Circle Mints $500 Million USDC on Solana — Is a Massive DeFi Rally Next? 🚀
💵 What Happened?
In a major on-chain event, the USDC Treasury issued $500 million in USDC directly on the Solana network across two $250M transactions.
This massive influx of real-fiat-backed capital highlights a growing appetite for stablecoins in high-speed, low-cost ecosystems.
🔑 Key Takeaways & Headlines
Fresh On-Chain Liquidity: Freshly minted USDC boosts liquidity pools across Solana-based DEXs, lending markets, and yield protocols.
$SOL
Institutional Signal: Because every USDC is backed 1:1 by real reserves, large minting events reflect actual institutional or commercial capital entering the ecosystem.
Solana’s Market Share Expansion: Solana continues to capture an increasing share of total USDC circulation, threatening traditional stablecoin market distributions.
Macro & Fed Context: As traders monitor global macroeconomic developments and interest rate outlooks, high-yield on-chain opportunities attract resting capital back to Web3.
💡 Why It Matters for Traders
Lower Slippage & Better Swaps: Higher stablecoin depth means larger trades can occur without heavy market impact.
DeFi Yield Potential: Increased USDC reserves encourage higher TVL (Total Value Locked) in Solana lending and farming protocols.
Sentiment Shift: Massive stablecoin injections are historically bullish indicators for ecosystem tokens ($SOL,$JUP, $RAY,$KMNO).
What’s your play? Are you keeping cash on the sidelines or riding the Solana liquidity wave? Drop your thoughts below! 👇
#BlackRockBuildsTokenizedPortfoliosForOndo #solana #defi
Lily星星
·4 Likes
·2.3k views
PolymarketBankFailureBetsDrawFDICConcern
28,410 views
725 Discussing
BlackRockBuildsTokenizedPortfoliosForOndo
22,479 views
494 Discussing