
KID19
31 Posts

KID19
Report
Block User
Frequent Trader
5.7 Years
1.0K+ Following
305 Followers
58 Liked
Posts
·
--
#Plasam
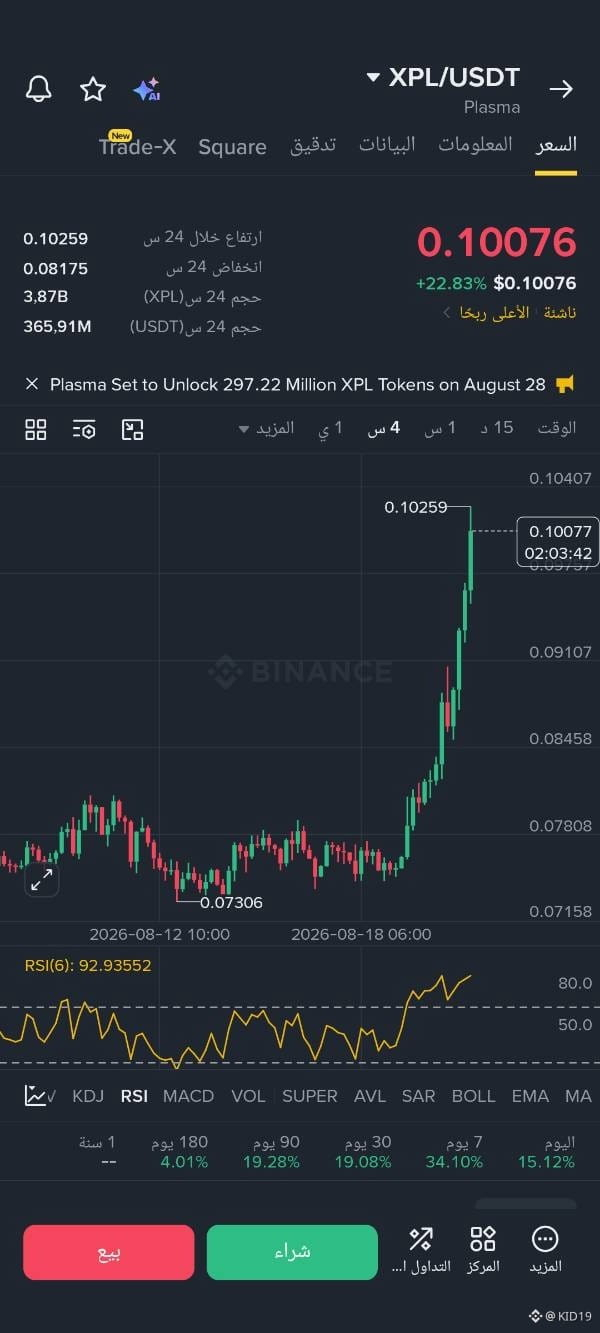
🎯Target Entry Zone🎯
: Between 0.0845 and 0.0817 (previous support and resistance levels shown on the right axis).
🫰👇👇👇👇
Profit-Taking Targets (Take Profit):
🟢First Target: 0.0910
🟢Second Target: 0.1000
🟢Third Target: 0.1025 (current breakout high).
🔴Stop Loss: Close a 4-hour candle below the 0.0780 level
{future}(XPLUSDT)
#Plasam
🎯Target Entry Zone🎯
: Between 0.0845 and 0.0817 (previous support and resistance levels shown on the right axis).
🫰👇👇👇👇
Profit-Taking Targets (Take Profit):
🟢First Target: 0.0910
🟢Second Target: 0.1000
🟢Third Target: 0.1025 (current breakout high).
🔴Stop Loss: Close a 4-hour candle below the 0.0780 level
🎯Target Entry Zone🎯
: Between 0.0845 and 0.0817 (previous support and resistance levels shown on the right axis).
🫰👇👇👇👇
Profit-Taking Targets (Take Profit):
🟢First Target: 0.0910
🟢Second Target: 0.1000
🟢Third Target: 0.1025 (current breakout high).
🔴Stop Loss: Close a 4-hour candle below the 0.0780 level
7
109
·
--
💥#GENIUSA 💥📢
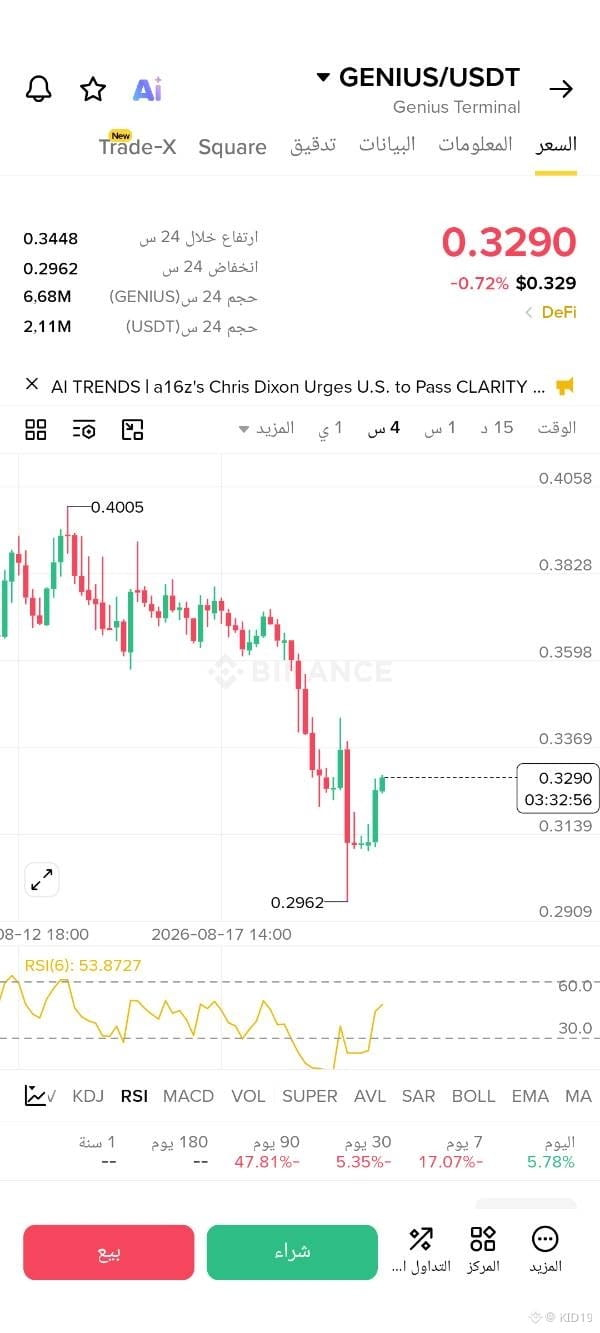
🚨If the price is able to break through the resistance level of 0.3598🚨👇👇 and hold above it with a strong candlestick close, 🚀momentum will turn in favor of the buyers, opening the way to visit the levels of 0.3828 and then the previous peak at 0.4005.
{future}(GENIUSUSDT)
💥#GENIUSA 💥📢
🚨If the price is able to break through the resistance level of 0.3598🚨👇👇 and hold above it with a strong candlestick close, 🚀momentum will turn in favor of the buyers, opening the way to visit the levels of 0.3828 and then the previous peak at 0.4005.
🚨If the price is able to break through the resistance level of 0.3598🚨👇👇 and hold above it with a strong candlestick close, 🚀momentum will turn in favor of the buyers, opening the way to visit the levels of 0.3828 and then the previous peak at 0.4005.
6
343
·
--
#dusk $DUSK @Dusk_Foundation
Real Asset Tokenization (RWA): The project primarily focuses on a massive and future-facing market by converting traditional assets (such as stocks, bonds, and real estate) into tokens on the blockchain. [1, 2]
Zero-Knowledge Proofs: Enables institutions and companies to conduct transactions and trade assets with complete privacy and confidentiality without disclosing sensitive data to competitors, while also providing financial regulators with the ability to review and verify them. [1, 2]
Compatibility with the Ethereum ecosystem (DuskEVM): Allows developers to upgrade the EVM to build decentralized finance (DeFi) applications and use familiar Ethereum tools directly on the Dusk network. [1, 2]
Full regulatory compliance (MiCA Compliant): The project stands out for its focus on European markets and its alignment with modern regulatory legislation, making it an attractive option for institutions that fear legal issues. [1]
📊 Investment and Risk Assessment ⚠️
Despite the project’s high technical value, it is important to note that investing in mid- and small-cap crypto assets involves high risks and may result in the complete loss of capital:
Dependence on institutional adoption: The success of the token $DUSK depends directly on the extent to which real financial institutions are willing to use the network to issue and trade their assets. [1, 2]
{future}(DUSKUSDT)
$DUSK
#dusk $DUSK @Dusk
Real Asset Tokenization (RWA): The project primarily focuses on a massive and future-facing market by converting traditional assets (such as stocks, bonds, and real estate) into tokens on the blockchain. [1, 2]
Zero-Knowledge Proofs: Enables institutions and companies to conduct transactions and trade assets with complete privacy and confidentiality without disclosing sensitive data to competitors, while also providing financial regulators with the ability to review and verify them. [1, 2]
Compatibility with the Ethereum ecosystem (DuskEVM): Allows developers to upgrade the EVM to build decentralized finance (DeFi) applications and use familiar Ethereum tools directly on the Dusk network. [1, 2]
Full regulatory compliance (MiCA Compliant): The project stands out for its focus on European markets and its alignment with modern regulatory legislation, making it an attractive option for institutions that fear legal issues. [1]
📊 Investment and Risk Assessment ⚠️
Despite the project’s high technical value, it is important to note that investing in mid- and small-cap crypto assets involves high risks and may result in the complete loss of capital:
Dependence on institutional adoption: The success of the token $DUSK depends directly on the extent to which real financial institutions are willing to use the network to issue and trade their assets. [1, 2]
$DUSK
Real Asset Tokenization (RWA): The project primarily focuses on a massive and future-facing market by converting traditional assets (such as stocks, bonds, and real estate) into tokens on the blockchain. [1, 2]
Zero-Knowledge Proofs: Enables institutions and companies to conduct transactions and trade assets with complete privacy and confidentiality without disclosing sensitive data to competitors, while also providing financial regulators with the ability to review and verify them. [1, 2]
Compatibility with the Ethereum ecosystem (DuskEVM): Allows developers to upgrade the EVM to build decentralized finance (DeFi) applications and use familiar Ethereum tools directly on the Dusk network. [1, 2]
Full regulatory compliance (MiCA Compliant): The project stands out for its focus on European markets and its alignment with modern regulatory legislation, making it an attractive option for institutions that fear legal issues. [1]
📊 Investment and Risk Assessment ⚠️
Despite the project’s high technical value, it is important to note that investing in mid- and small-cap crypto assets involves high risks and may result in the complete loss of capital:
Dependence on institutional adoption: The success of the token $DUSK depends directly on the extent to which real financial institutions are willing to use the network to issue and trade their assets. [1, 2]
$DUSK
5
37
·
--
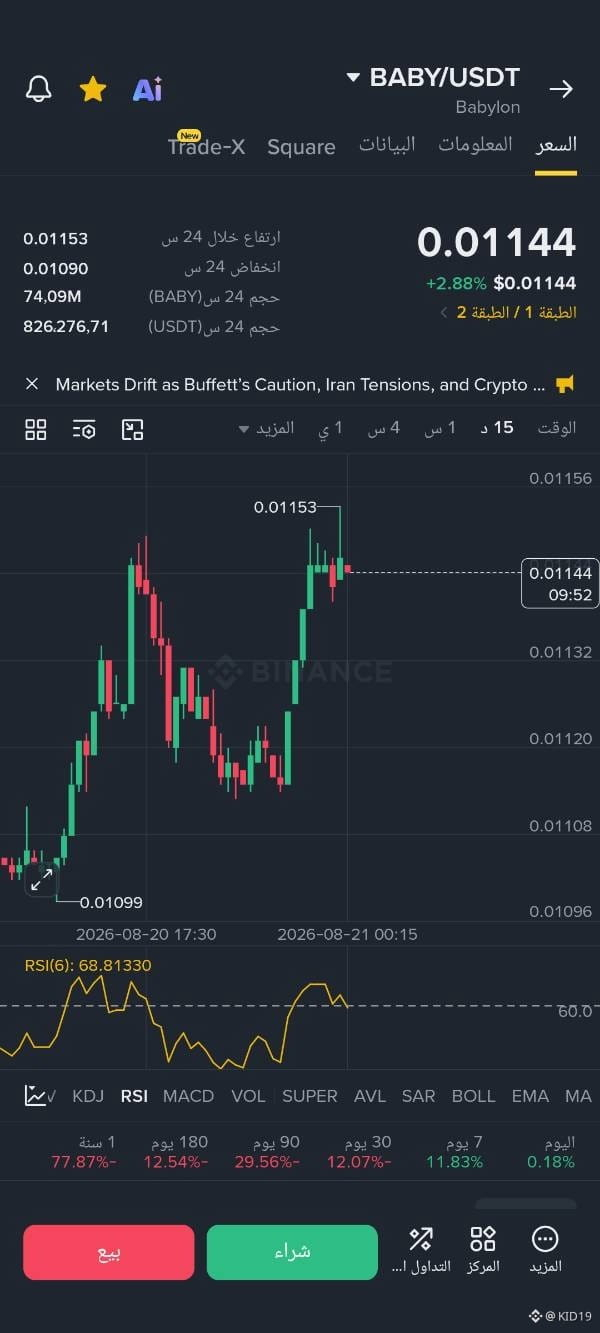
#BABYLONG 👏👆
Near Resistance: The last peak at $0.01153 (shown by a horizontal white line on the chart). A breakout of this level and holding above it could push the price to test the next resistance levels toward $0.0125.
Near Support: The local bottom formed at $0.01099. A break below this level may open the door to deeper support areas at $0.01050.
{spot}(BABYUSDT)
#BABYLONG 👏👆
Near Resistance: The last peak at $0.01153 (shown by a horizontal white line on the chart). A breakout of this level and holding above it could push the price to test the next resistance levels toward $0.0125.
Near Support: The local bottom formed at $0.01099. A break below this level may open the door to deeper support areas at $0.01050.
Near Resistance: The last peak at $0.01153 (shown by a horizontal white line on the chart). A breakout of this level and holding above it could push the price to test the next resistance levels toward $0.0125.
Near Support: The local bottom formed at $0.01099. A break below this level may open the door to deeper support areas at $0.01050.
5
117
·
--
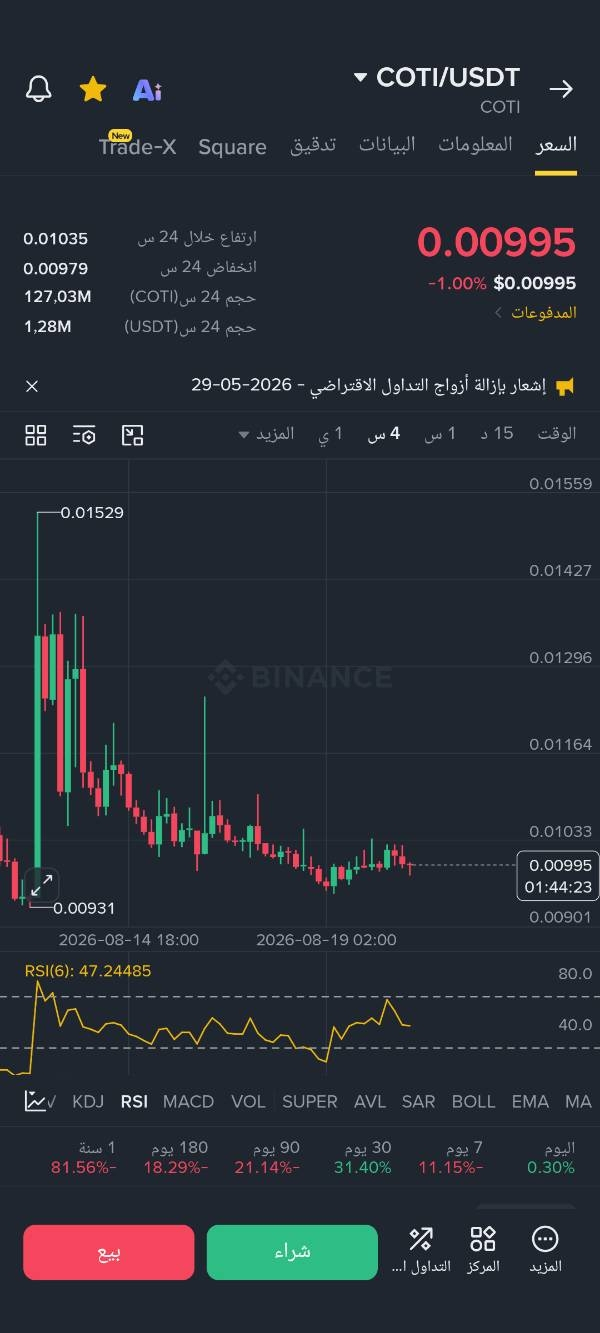
#COTI/USDT⚡️⚡️
The First Scenario: Buying on a Rebound from Support (Safest)
Timing: Wait until the price dips slightly to touch the support zone between 0.00931 and 0.00901.
Entry Condition: The appearance of a rising green reversal candle (such as a Hammer or Engulfing candle) from within that zone, coinciding with the RSI indicator falling below the 30 levels (oversold), then rising back up.
👈👉
The Second Scenario: Buying After Breaking the Downtrend Line
Timing: If the price does not drop to the support and starts rising immediately.
Entry Condition: Wait until the price breaks the nearby resistance levels at 0.01033 with stability (a 4-hour candle close above it) to ensure the end of the short downward wave and the start of a new upward wave toward 0.01164.
{future}(COTIUSDT)
#COTI/USDT⚡️⚡️
The First Scenario: Buying on a Rebound from Support (Safest)
Timing: Wait until the price dips slightly to touch the support zone between 0.00931 and 0.00901.
Entry Condition: The appearance of a rising green reversal candle (such as a Hammer or Engulfing candle) from within that zone, coinciding with the RSI indicator falling below the 30 levels (oversold), then rising back up.
👈👉
The Second Scenario: Buying After Breaking the Downtrend Line
Timing: If the price does not drop to the support and starts rising immediately.
Entry Condition: Wait until the price breaks the nearby resistance levels at 0.01033 with stability (a 4-hour candle close above it) to ensure the end of the short downward wave and the start of a new upward wave toward 0.01164.
The First Scenario: Buying on a Rebound from Support (Safest)
Timing: Wait until the price dips slightly to touch the support zone between 0.00931 and 0.00901.
Entry Condition: The appearance of a rising green reversal candle (such as a Hammer or Engulfing candle) from within that zone, coinciding with the RSI indicator falling below the 30 levels (oversold), then rising back up.
👈👉
The Second Scenario: Buying After Breaking the Downtrend Line
Timing: If the price does not drop to the support and starts rising immediately.
Entry Condition: Wait until the price breaks the nearby resistance levels at 0.01033 with stability (a 4-hour candle close above it) to ensure the end of the short downward wave and the start of a new upward wave toward 0.01164.
1
2
446
·
--
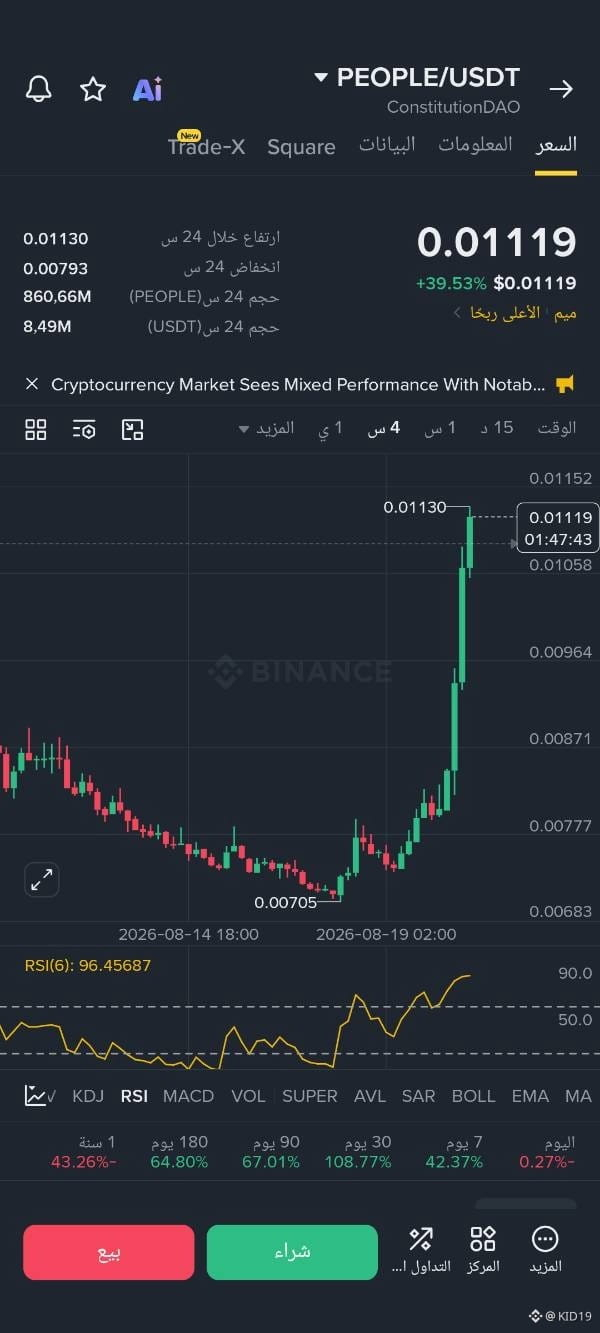
Technical Analysis of the Current Chart
#people🔥🔥
Current Price and Momentum: The pair is trading at 0.01119 USDT, recording a sharp breakout increase of 39.53%+ over the last 24 hours. [1, 2]
Relative Strength Index (RSI) (6): The indicator is at 96.45, an extreme overbought zone that reflects a very strong surge by buyers, but it also warns that a correction or profit-taking may be near. Indicators rarely stay above 90 for extended periods.
Near Support and Resistance:
Confirmed Resistance: The most recent peak at 0.01130 shown on the chart.
Previous Bottom (Support): Levels at 0.00705 from which the latest upswing successfully began
Technical Analysis of the Current Chart
#people🔥🔥
Current Price and Momentum: The pair is trading at 0.01119 USDT, recording a sharp breakout increase of 39.53%+ over the last 24 hours. [1, 2]
Relative Strength Index (RSI) (6): The indicator is at 96.45, an extreme overbought zone that reflects a very strong surge by buyers, but it also warns that a correction or profit-taking may be near. Indicators rarely stay above 90 for extended periods.
Near Support and Resistance:
Confirmed Resistance: The most recent peak at 0.01130 shown on the chart.
Previous Bottom (Support): Levels at 0.00705 from which the latest upswing successfully began
#people🔥🔥
Current Price and Momentum: The pair is trading at 0.01119 USDT, recording a sharp breakout increase of 39.53%+ over the last 24 hours. [1, 2]
Relative Strength Index (RSI) (6): The indicator is at 96.45, an extreme overbought zone that reflects a very strong surge by buyers, but it also warns that a correction or profit-taking may be near. Indicators rarely stay above 90 for extended periods.
Near Support and Resistance:
Confirmed Resistance: The most recent peak at 0.01130 shown on the chart.
Previous Bottom (Support): Levels at 0.00705 from which the latest upswing successfully began
1
211
·
--
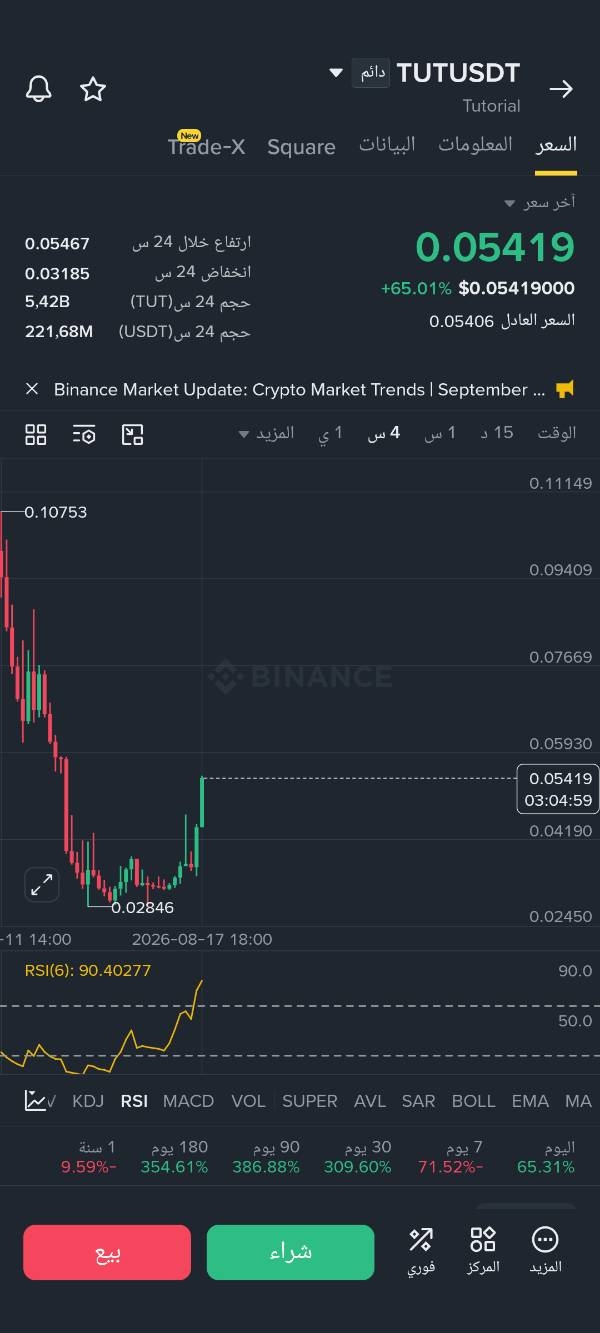
💥#tutotial 💥👈👈👇👇
Sudden Increase (+65.01%): The current price at 0.05419 represents a strong vertical rise after a consolidation period near the historical bottom at 0.02846.
Relative Strength Index RSI(6): The indicator is showing a very high value at 90.40. Technically, any reading above 70 means the coin is in the extremely overbought area (Overbought), and reaching above 90 reflects a peak move that may not be sustainable for long without a correction.
Trading Volume: There has been an enormous liquidity inflow during the past 24 hours, with a volume of 5.42B.
👌👌
Wait for a Cooldown: If you want to invest or trade the coin, it is recommended to wait for a downward correction and a clear rebound from support zones (such as 0.04190), along with the RSI indicator dropping to more moderate levels (below 50–60).
💥#tutotial 💥👈👈👇👇
Sudden Increase (+65.01%): The current price at 0.05419 represents a strong vertical rise after a consolidation period near the historical bottom at 0.02846.
Relative Strength Index RSI(6): The indicator is showing a very high value at 90.40. Technically, any reading above 70 means the coin is in the extremely overbought area (Overbought), and reaching above 90 reflects a peak move that may not be sustainable for long without a correction.
Trading Volume: There has been an enormous liquidity inflow during the past 24 hours, with a volume of 5.42B.
👌👌
Wait for a Cooldown: If you want to invest or trade the coin, it is recommended to wait for a downward correction and a clear rebound from support zones (such as 0.04190), along with the RSI indicator dropping to more moderate levels (below 50–60).
Sudden Increase (+65.01%): The current price at 0.05419 represents a strong vertical rise after a consolidation period near the historical bottom at 0.02846.
Relative Strength Index RSI(6): The indicator is showing a very high value at 90.40. Technically, any reading above 70 means the coin is in the extremely overbought area (Overbought), and reaching above 90 reflects a peak move that may not be sustainable for long without a correction.
Trading Volume: There has been an enormous liquidity inflow during the past 24 hours, with a volume of 5.42B.
👌👌
Wait for a Cooldown: If you want to invest or trade the coin, it is recommended to wait for a downward correction and a clear rebound from support zones (such as 0.04190), along with the RSI indicator dropping to more moderate levels (below 50–60).
1
2
144
·
--
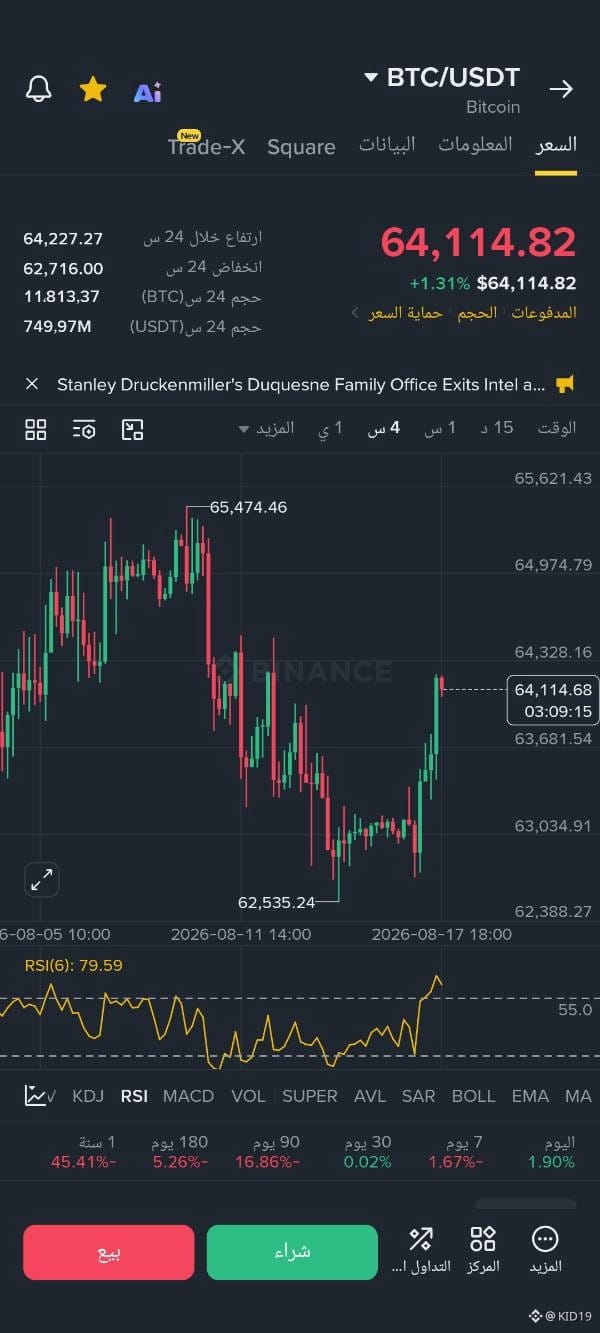
💥#BTC 💥#BTC 💥
👈 Current price action: Bitcoin is trading at the 64,114.82 USDT level, extending upward in a green bounce from the most recent bottom formed at 62,535.24 USDT.
👇👇👇
Nearby resistance levels: The price is approaching a secondary resistance area and a near-term target at 64,328.16 USDT. If it manages to break above it and closes successfully above it, that would open the way to target stronger resistance levels at 64,974.79 USDT, then the previous peak at 65,474.46 USDT
{spot}(BTCUSDT)
💥#BTC 💥#BTC 💥
👈 Current price action: Bitcoin is trading at the 64,114.82 USDT level, extending upward in a green bounce from the most recent bottom formed at 62,535.24 USDT.
👇👇👇
Nearby resistance levels: The price is approaching a secondary resistance area and a near-term target at 64,328.16 USDT. If it manages to break above it and closes successfully above it, that would open the way to target stronger resistance levels at 64,974.79 USDT, then the previous peak at 65,474.46 USDT
👈 Current price action: Bitcoin is trading at the 64,114.82 USDT level, extending upward in a green bounce from the most recent bottom formed at 62,535.24 USDT.
👇👇👇
Nearby resistance levels: The price is approaching a secondary resistance area and a near-term target at 64,328.16 USDT. If it manages to break above it and closes successfully above it, that would open the way to target stronger resistance levels at 64,974.79 USDT, then the previous peak at 65,474.46 USDT
1
121
·
--
💥$1000RATS 💥
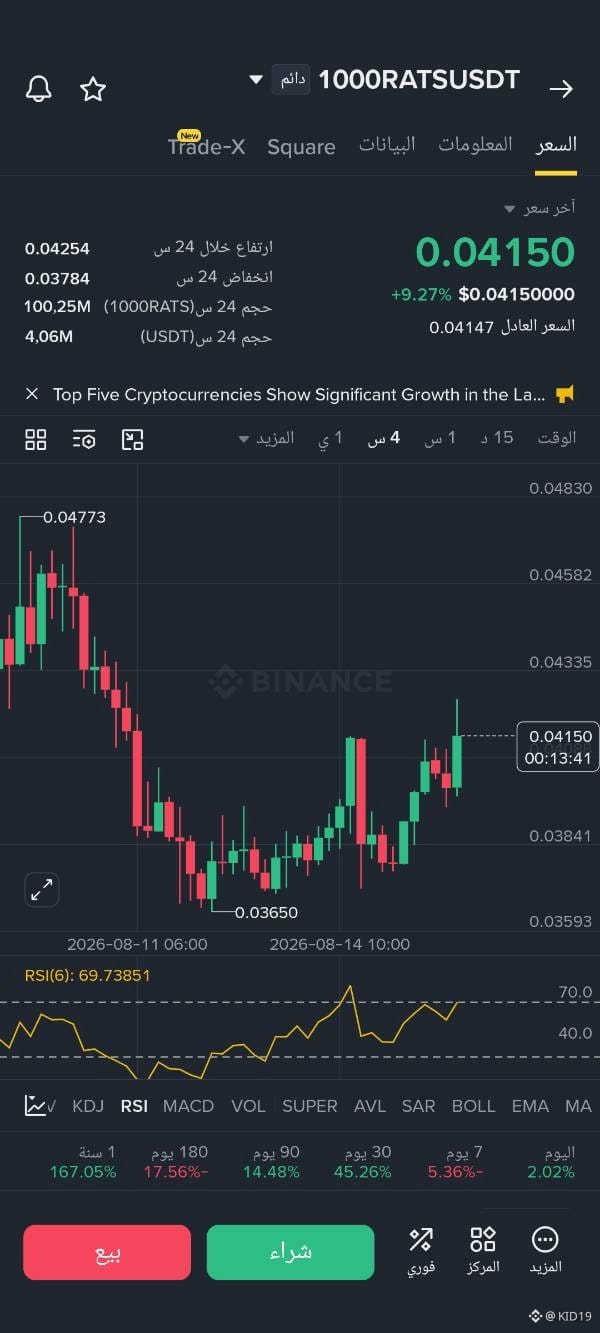
Current price: The price is currently trading at 0.04150, recording a +9.27% increase, reflecting bullish momentum in the short term.
Candlestick movement: The price managed to rebound from the last sub-low at 0.03650, forming a series of rising (green) candles that broke through nearby resistance levels.
Relative Strength Index RSI(6): The indicator is currently at 69.73, very close to the "overbought" zone (above 70). This indicates the strength of the current bullish momentum, but it also calls for caution due to the potential for a correction or temporary profit-taking.
To enter a buy trade: It is best to wait for a clear breakout with stability above the nearby resistance, or wait for a corrective pullback toward the levels 0.03950 - 0.03841 to buy with lower risk.
Stop Loss: It is recommended to place it clearly below the last low, specifically at 0.03590 to protect capital.
{future}(1000RATSUSDT)
💥$1000RATS 💥
Current price: The price is currently trading at 0.04150, recording a +9.27% increase, reflecting bullish momentum in the short term.
Candlestick movement: The price managed to rebound from the last sub-low at 0.03650, forming a series of rising (green) candles that broke through nearby resistance levels.
Relative Strength Index RSI(6): The indicator is currently at 69.73, very close to the "overbought" zone (above 70). This indicates the strength of the current bullish momentum, but it also calls for caution due to the potential for a correction or temporary profit-taking.
To enter a buy trade: It is best to wait for a clear breakout with stability above the nearby resistance, or wait for a corrective pullback toward the levels 0.03950 - 0.03841 to buy with lower risk.
Stop Loss: It is recommended to place it clearly below the last low, specifically at 0.03590 to protect capital.
Current price: The price is currently trading at 0.04150, recording a +9.27% increase, reflecting bullish momentum in the short term.
Candlestick movement: The price managed to rebound from the last sub-low at 0.03650, forming a series of rising (green) candles that broke through nearby resistance levels.
Relative Strength Index RSI(6): The indicator is currently at 69.73, very close to the "overbought" zone (above 70). This indicates the strength of the current bullish momentum, but it also calls for caution due to the potential for a correction or temporary profit-taking.
To enter a buy trade: It is best to wait for a clear breakout with stability above the nearby resistance, or wait for a corrective pullback toward the levels 0.03950 - 0.03841 to buy with lower risk.
Stop Loss: It is recommended to place it clearly below the last low, specifically at 0.03590 to protect capital.
2
205
·
--
Bearish
#bank 🧑💻🔥
I’m waiting for you and keeping an eye on you 👇👈
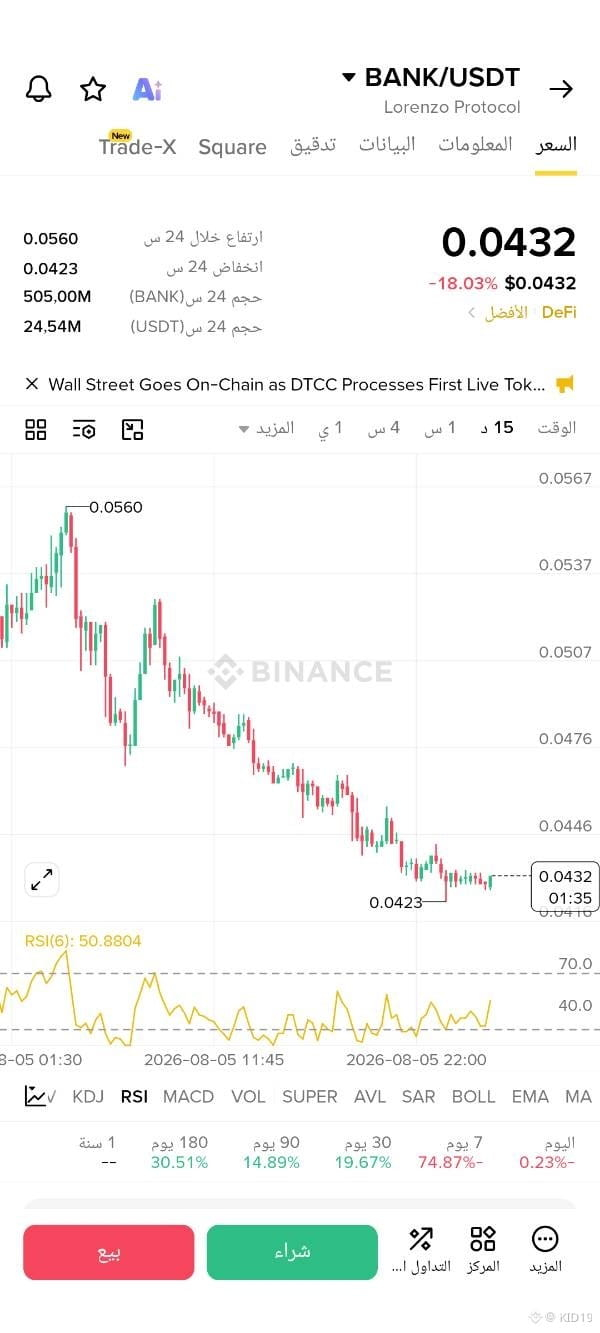
Current price: The token is trading at 0.0432, recording a sharp decline of 18.03% during the day.
Price Action structure: Price is moving in a clear downtrend channel, forming lower highs and lower lows since the 0.0560 levels.
Positive scenario (rebound and upward correction)
Condition: Price holds steady above the current support level 0.0423.
Expectation: If this support holds, we may see a corrective bounce upward to test nearby resistance levels at 0.0446, then 0.0476.
2. Negative scenario (continued price bleeding)
Condition: A break of the 0.0423 support level with a full bearish candle downward, along with an increase in trading volume.
Expectation: Continued decline in search of new lows not visible on the current screen, which would deepen weekly losses.
{spot}(BANKUSDT)
#bank 🧑💻🔥
I’m waiting for you and keeping an eye on you 👇👈
Current price: The token is trading at 0.0432, recording a sharp decline of 18.03% during the day.
Price Action structure: Price is moving in a clear downtrend channel, forming lower highs and lower lows since the 0.0560 levels.
Positive scenario (rebound and upward correction)
Condition: Price holds steady above the current support level 0.0423.
Expectation: If this support holds, we may see a corrective bounce upward to test nearby resistance levels at 0.0446, then 0.0476.
2. Negative scenario (continued price bleeding)
Condition: A break of the 0.0423 support level with a full bearish candle downward, along with an increase in trading volume.
Expectation: Continued decline in search of new lows not visible on the current screen, which would deepen weekly losses.
I’m waiting for you and keeping an eye on you 👇👈
Current price: The token is trading at 0.0432, recording a sharp decline of 18.03% during the day.
Price Action structure: Price is moving in a clear downtrend channel, forming lower highs and lower lows since the 0.0560 levels.
Positive scenario (rebound and upward correction)
Condition: Price holds steady above the current support level 0.0423.
Expectation: If this support holds, we may see a corrective bounce upward to test nearby resistance levels at 0.0446, then 0.0476.
2. Negative scenario (continued price bleeding)
Condition: A break of the 0.0423 support level with a full bearish candle downward, along with an increase in trading volume.
Expectation: Continued decline in search of new lows not visible on the current screen, which would deepen weekly losses.
1
1
271
·
--
#HEI
🔥Profit Harvesting👈🔥
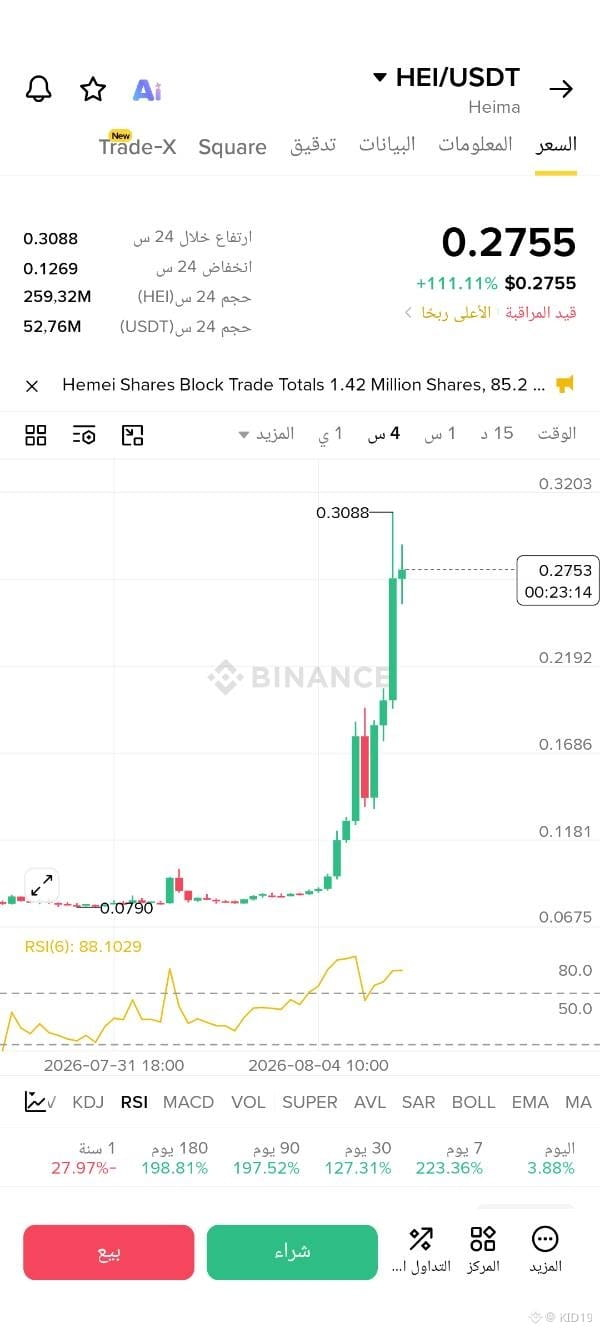
A sharp rise exceeding 110% and an RSI index close to 90 indicate that the market urgently needs to catch its breath and inject new liquidity. Expected support zones: If the price declines due to profit-taking, the nearby and attractive support levels for re-buying are around 0.2192, then the stronger support levels around 0.1686.
{spot}(HEIUSDT)
#HEI
🔥Profit Harvesting👈🔥
A sharp rise exceeding 110% and an RSI index close to 90 indicate that the market urgently needs to catch its breath and inject new liquidity. Expected support zones: If the price declines due to profit-taking, the nearby and attractive support levels for re-buying are around 0.2192, then the stronger support levels around 0.1686.
🔥Profit Harvesting👈🔥
A sharp rise exceeding 110% and an RSI index close to 90 indicate that the market urgently needs to catch its breath and inject new liquidity. Expected support zones: If the price declines due to profit-taking, the nearby and attractive support levels for re-buying are around 0.2192, then the stronger support levels around 0.1686.
1
112
·
--
#GIGGEL
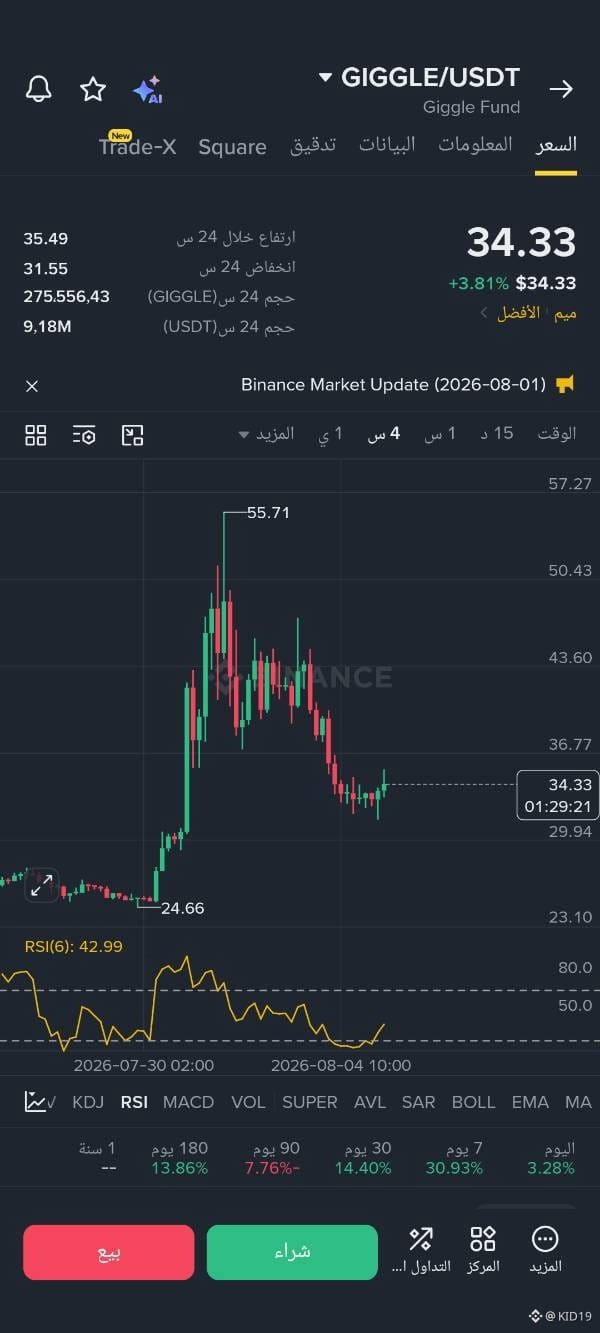
Current Price: The price is trading at 34.33 USDT. Overall Trend: The coin is in a bearish correction (Pullback) phase after a strong uptrend that pushed it to a peak at 55.71 USDT. Relative Strength Index RSI (6): It is currently at 42.99, indicating that the price is nearing relatively oversold zones in the short term, which may support price stabilization around current levels. Current Support and Resistance Zones: Nearest and Strongest Support: At 24.66 USDT (the previous low shown on the chart from which the uptrend began). First Resistance: At 43.60 USDT. Main Resistance: The previous peak at 55.71 USDT.
{future}(GIGGLEUSDT)
#GIGGEL
Current Price: The price is trading at 34.33 USDT. Overall Trend: The coin is in a bearish correction (Pullback) phase after a strong uptrend that pushed it to a peak at 55.71 USDT. Relative Strength Index RSI (6): It is currently at 42.99, indicating that the price is nearing relatively oversold zones in the short term, which may support price stabilization around current levels. Current Support and Resistance Zones: Nearest and Strongest Support: At 24.66 USDT (the previous low shown on the chart from which the uptrend began). First Resistance: At 43.60 USDT. Main Resistance: The previous peak at 55.71 USDT.
Current Price: The price is trading at 34.33 USDT. Overall Trend: The coin is in a bearish correction (Pullback) phase after a strong uptrend that pushed it to a peak at 55.71 USDT. Relative Strength Index RSI (6): It is currently at 42.99, indicating that the price is nearing relatively oversold zones in the short term, which may support price stabilization around current levels. Current Support and Resistance Zones: Nearest and Strongest Support: At 24.66 USDT (the previous low shown on the chart from which the uptrend began). First Resistance: At 43.60 USDT. Main Resistance: The previous peak at 55.71 USDT.
1
138
·
--
#10000SATS
🔥Suggested Entry Zone:🔥
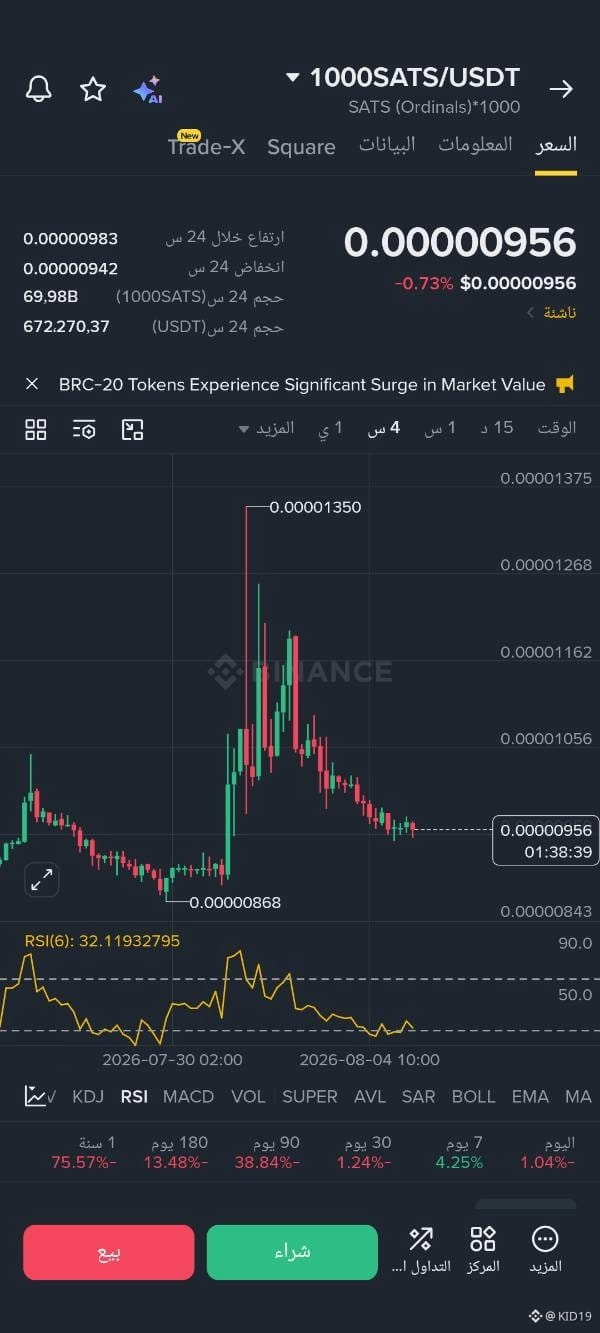
It is recommended to enter gradually in the range between 0.00000940 and 0.00000956 USDT (the current price is very close to today’s bottom, and the RSI indicator at 32.11 is approaching rebound zones).
Take Profit targets:
⭐️First target (short-term): 0.00001056 USDT (a nearby resistance level on the candlestick chart).
⭐️Second target (mid-term): 0.00001162 USDT.
Max Goal (previous high): 0.00001350 USDT.
Stop Loss level:
A strict stop loss must be activated below the lowest previous swing low at 0.00000850 USDT
{spot}(1000SATSUSDT)
#10000SATS
🔥Suggested Entry Zone:🔥
It is recommended to enter gradually in the range between 0.00000940 and 0.00000956 USDT (the current price is very close to today’s bottom, and the RSI indicator at 32.11 is approaching rebound zones).
Take Profit targets:
⭐️First target (short-term): 0.00001056 USDT (a nearby resistance level on the candlestick chart).
⭐️Second target (mid-term): 0.00001162 USDT.
Max Goal (previous high): 0.00001350 USDT.
Stop Loss level:
A strict stop loss must be activated below the lowest previous swing low at 0.00000850 USDT
🔥Suggested Entry Zone:🔥
It is recommended to enter gradually in the range between 0.00000940 and 0.00000956 USDT (the current price is very close to today’s bottom, and the RSI indicator at 32.11 is approaching rebound zones).
Take Profit targets:
⭐️First target (short-term): 0.00001056 USDT (a nearby resistance level on the candlestick chart).
⭐️Second target (mid-term): 0.00001162 USDT.
Max Goal (previous high): 0.00001350 USDT.
Stop Loss level:
A strict stop loss must be activated below the lowest previous swing low at 0.00000850 USDT
1
153
·
--
$DEXE $DEXE 💥
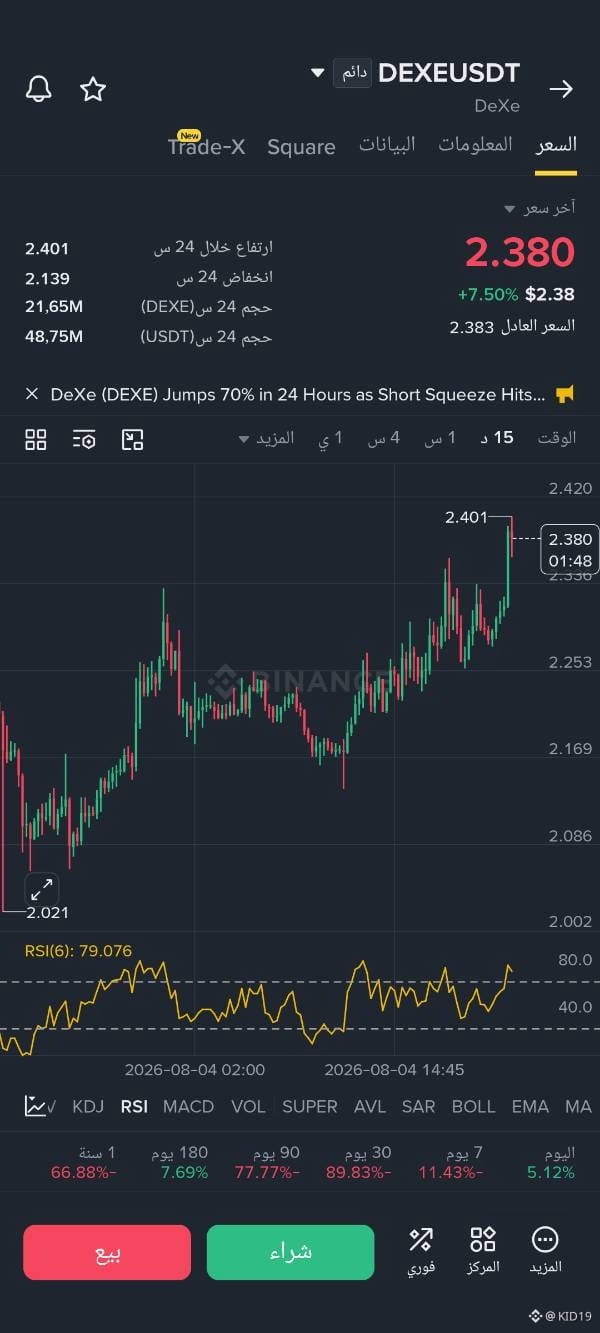
If the price manages to sneak through the $2.420 barrier and hold above it with a 4-hour candle, the next target will be to test higher resistance zones. However, this scenario requires a massive inflow of new buying liquidity to overcome the current traders’ urge to sell and take profits.
{future}(DEXEUSDT)
$DEXE $DEXE 💥
If the price manages to sneak through the $2.420 barrier and hold above it with a 4-hour candle, the next target will be to test higher resistance zones. However, this scenario requires a massive inflow of new buying liquidity to overcome the current traders’ urge to sell and take profits.
If the price manages to sneak through the $2.420 barrier and hold above it with a 4-hour candle, the next target will be to test higher resistance zones. However, this scenario requires a massive inflow of new buying liquidity to overcome the current traders’ urge to sell and take profits.
2
2
651
·
--
💥Current Indicators:💥
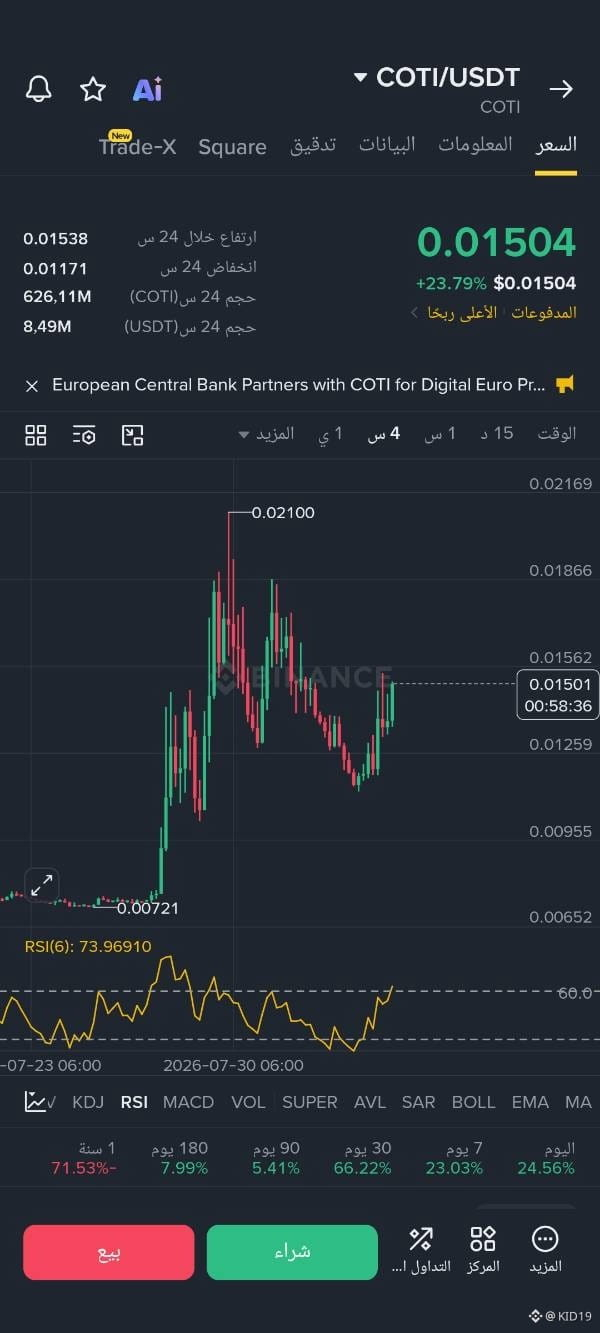
The price has risen from its lowest levels
Recently, at $0.00721, it is now approaching the testing of nearby resistance levels around $0.01562.
Relative Strength Index RSI(6): It is at 73.96, meaning the coin has entered the overbought zone in the very short term, which may call for caution regarding a temporary pullback and profit-taking
{spot}(COTIUSDT)
💥Current Indicators:💥
The price has risen from its lowest levels
Recently, at $0.00721, it is now approaching the testing of nearby resistance levels around $0.01562.
Relative Strength Index RSI(6): It is at 73.96, meaning the coin has entered the overbought zone in the very short term, which may call for caution regarding a temporary pullback and profit-taking
The price has risen from its lowest levels
Recently, at $0.00721, it is now approaching the testing of nearby resistance levels around $0.01562.
Relative Strength Index RSI(6): It is at 73.96, meaning the coin has entered the overbought zone in the very short term, which may call for caution regarding a temporary pullback and profit-taking
2
159
·
--
👌Expected technical outlook👌$STO
💥Positive scenario:💥
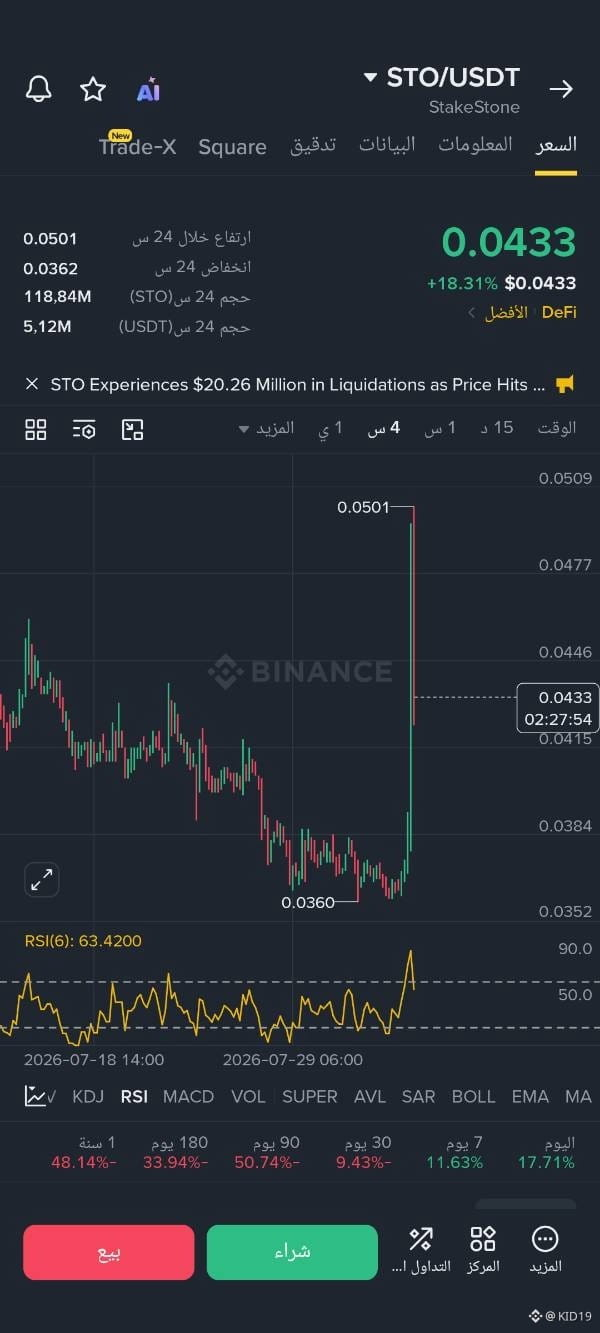
If the price manages to stabilize and form a base above the 0.0415 - 0.0430 USDT levels as a new support, it may return to test the previous high at 0.0501 USDT and attempt to break through it toward 0.0509 USDT.
👎Negative scenario (correction):
Since the rise was steep and fast, it’s very common to see quick profit-taking, which may push the price down to retest the lower support levels at 0.0384 USDT.
{spot}(STOUSDT)
👌Expected technical outlook👌$STO
💥Positive scenario:💥
If the price manages to stabilize and form a base above the 0.0415 - 0.0430 USDT levels as a new support, it may return to test the previous high at 0.0501 USDT and attempt to break through it toward 0.0509 USDT.
👎Negative scenario (correction):
Since the rise was steep and fast, it’s very common to see quick profit-taking, which may push the price down to retest the lower support levels at 0.0384 USDT.
💥Positive scenario:💥
If the price manages to stabilize and form a base above the 0.0415 - 0.0430 USDT levels as a new support, it may return to test the previous high at 0.0501 USDT and attempt to break through it toward 0.0509 USDT.
👎Negative scenario (correction):
Since the rise was steep and fast, it’s very common to see quick profit-taking, which may push the price down to retest the lower support levels at 0.0384 USDT.
2
3
242
·
--
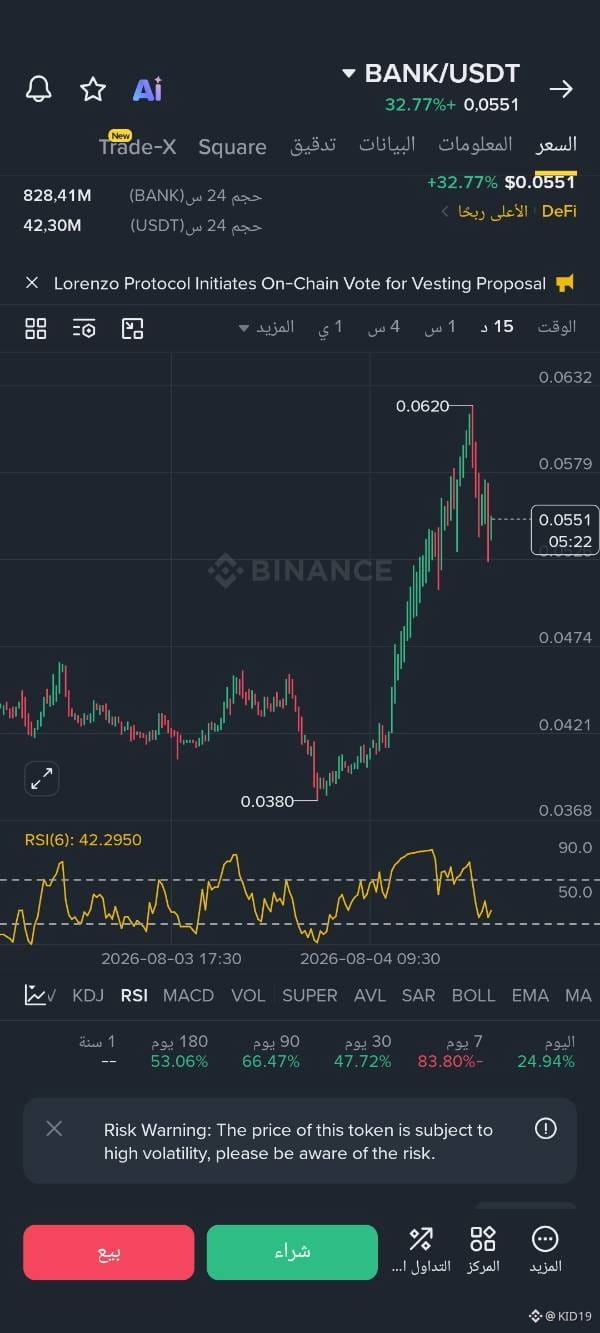
💥Price Forecasts (Short to Medium Term)💥
Given the nature of the project and the high volatility it features, the forecasts are divided into two scenarios:
1. The Negative Scenario (Correction and Profit-Taking) — most likely at the moment
Due to the rapid decline in the RSI indicator and the appearance of bearish candles after a sharp rise, the price may move toward a retest of support zones:
First support: 0.0474 USDT (a previous accumulation area on the chart).
Main support: 0.0421 USDT to 0.0380 USDT.
2. The Positive Scenario (Resumption of the Uptrend)
If trading stabilizes above 0.0520 USDT and liquidity returns:
First resistance: 0.0579 USDT.
Main resistance: a breakout above the 0.0620 USDT level and holding above it would pave the way to target 0.0632 USDT and beyond. [1]
{spot}(BANKUSDT)
💥Price Forecasts (Short to Medium Term)💥
Given the nature of the project and the high volatility it features, the forecasts are divided into two scenarios:
1. The Negative Scenario (Correction and Profit-Taking) — most likely at the moment
Due to the rapid decline in the RSI indicator and the appearance of bearish candles after a sharp rise, the price may move toward a retest of support zones:
First support: 0.0474 USDT (a previous accumulation area on the chart).
Main support: 0.0421 USDT to 0.0380 USDT.
2. The Positive Scenario (Resumption of the Uptrend)
If trading stabilizes above 0.0520 USDT and liquidity returns:
First resistance: 0.0579 USDT.
Main resistance: a breakout above the 0.0620 USDT level and holding above it would pave the way to target 0.0632 USDT and beyond. [1]
Given the nature of the project and the high volatility it features, the forecasts are divided into two scenarios:
1. The Negative Scenario (Correction and Profit-Taking) — most likely at the moment
Due to the rapid decline in the RSI indicator and the appearance of bearish candles after a sharp rise, the price may move toward a retest of support zones:
First support: 0.0474 USDT (a previous accumulation area on the chart).
Main support: 0.0421 USDT to 0.0380 USDT.
2. The Positive Scenario (Resumption of the Uptrend)
If trading stabilizes above 0.0520 USDT and liquidity returns:
First resistance: 0.0579 USDT.
Main resistance: a breakout above the 0.0620 USDT level and holding above it would pave the way to target 0.0632 USDT and beyond. [1]
1
2
261
·
--
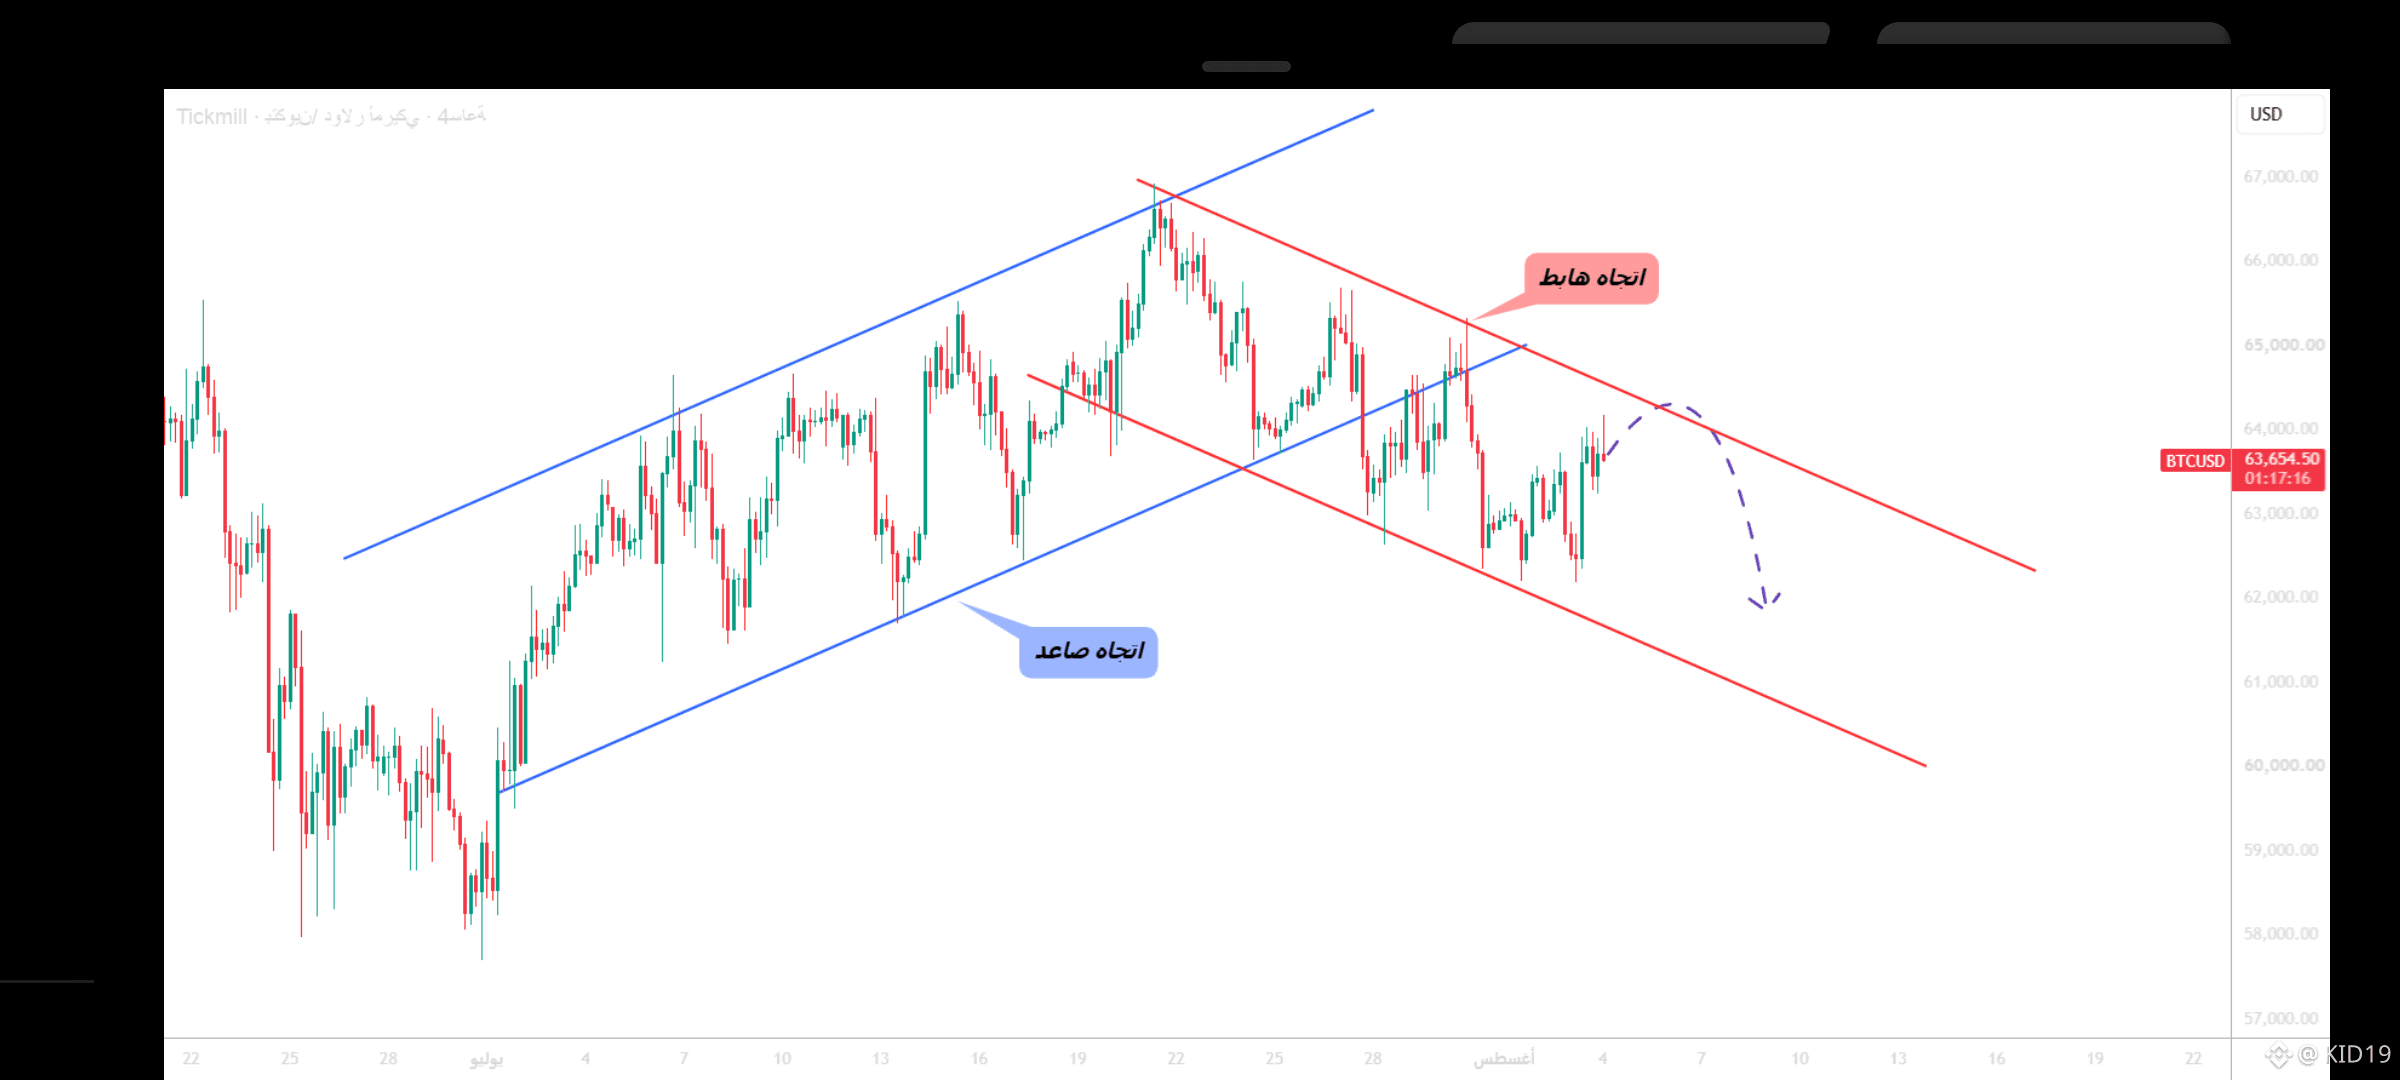
💥Current Situation💥
After breaking the ascending channel in blue, momentum on Bitcoin
turned bearish, and the price started moving
within a descending channel that reflects the sellers’ control
in the short term.
Where do we stand now?🙄
#
The price is approaching the upper limit of the descending channel—
this is the area we will watch for a return of selling pressure.
Preferred scenario
As long as this descending channel continues to contain the price action,
Price:
We will look for Sell Setups in line with the trend, from the vicinity of the upper
channel boundary, in anticipation
of the continuation of the bearish wave.
On the other hand, if the price manages to break the channel and close above it,
this may be the first sign of weakening bearish momentum
and the possibility of starting an upward corrective wave.
Will the channel hold again?
Will the sellers succeed in defending the upper limit?
Disclaimer: This analysis is for educational purposes only and does not constitute investment advice. Trading involves risk and requires adherence to capital management.#ptc
{spot}(BTCUSDT)
💥Current Situation💥
After breaking the ascending channel in blue, momentum on Bitcoin
turned bearish, and the price started moving
within a descending channel that reflects the sellers’ control
in the short term.
Where do we stand now?🙄
#
The price is approaching the upper limit of the descending channel—
this is the area we will watch for a return of selling pressure.
Preferred scenario
As long as this descending channel continues to contain the price action,
Price:
We will look for Sell Setups in line with the trend, from the vicinity of the upper
channel boundary, in anticipation
of the continuation of the bearish wave.
On the other hand, if the price manages to break the channel and close above it,
this may be the first sign of weakening bearish momentum
and the possibility of starting an upward corrective wave.
Will the channel hold again?
Will the sellers succeed in defending the upper limit?
Disclaimer: This analysis is for educational purposes only and does not constitute investment advice. Trading involves risk and requires adherence to capital management.#ptc
After breaking the ascending channel in blue, momentum on Bitcoin
turned bearish, and the price started moving
within a descending channel that reflects the sellers’ control
in the short term.
Where do we stand now?🙄
#
The price is approaching the upper limit of the descending channel—
this is the area we will watch for a return of selling pressure.
Preferred scenario
As long as this descending channel continues to contain the price action,
Price:
We will look for Sell Setups in line with the trend, from the vicinity of the upper
channel boundary, in anticipation
of the continuation of the bearish wave.
On the other hand, if the price manages to break the channel and close above it,
this may be the first sign of weakening bearish momentum
and the possibility of starting an upward corrective wave.
Will the channel hold again?
Will the sellers succeed in defending the upper limit?
Disclaimer: This analysis is for educational purposes only and does not constitute investment advice. Trading involves risk and requires adherence to capital management.#ptc
1
191
·
--
Oversold conditions in buying + covering of short-selling positions at exposed sales centers
+ Inflows to exchange-traded funds (ETFs)
The convergence of three buying forces following a sustained decline showed that technical indicators were in a state of severe overselling. This coincided with short-covering operations and institutional activity aimed at buying the dip through exchange-traded funds, which formed a three-pronged inflow of capital—providing strong support at low levels and establishing a solid base in the range of $62,400–$63,000.
#BTC
{spot}(BTCUSDT)
Oversold conditions in buying + covering of short-selling positions at exposed sales centers
+ Inflows to exchange-traded funds (ETFs)
The convergence of three buying forces following a sustained decline showed that technical indicators were in a state of severe overselling. This coincided with short-covering operations and institutional activity aimed at buying the dip through exchange-traded funds, which formed a three-pronged inflow of capital—providing strong support at low levels and establishing a solid base in the range of $62,400–$63,000.
#BTC
+ Inflows to exchange-traded funds (ETFs)
The convergence of three buying forces following a sustained decline showed that technical indicators were in a state of severe overselling. This coincided with short-covering operations and institutional activity aimed at buying the dip through exchange-traded funds, which formed a three-pronged inflow of capital—providing strong support at low levels and establishing a solid base in the range of $62,400–$63,000.
#BTC
1
113
Log in to explore more content
Join global crypto users on Binance Square
⚡️ Get latest and useful information about crypto.
💬 Trusted by the world’s largest crypto exchange.
👍 Discover real insights from verified creators.
Email / Phone number
Trending Topics
AIStocksWhatNext
440,129 views
3,299 Discussing
Share & Win Traffic Reward in our Trending Hashtag Campaign
✨Topic: What Other Investment Opportunities Remain as AI Stocks Keep Rising?
👉How to Join:
Publish a short post or article with hashtag #AIStocksWhatNext
Share whether you’re bullish or bearish, and post your AI stock holdings or trade — using the trade widget may improve your eligibility.
You can also strengthen your post by sharing data or charts, and avoiding AI-generated images.
✍️Create content based on the below angles:
- Nvidia says chip sales will double next year, and top AI companies keep hitting record revenue, the compute spend behind it is just as staggering. Is AI demand really taking off? And how long can it last? AI stocks are up across the board. Is this a real breakout, or just a short-term bounce?
- Industry leaders are calling to slow down AI development, while Trump plans to build an “AI Force”, claiming AI could account for 25% of U.S. GDP in the future. Whose side are you on? Will state-level backing be a long-term win for AI stocks?
- Are you buying AI stocks? Share your AI-related trade/holdings with our trade sharing widget.
⏰Campaign Period:
- 2026-09-22 7:00 - 2026-09-24 4:00 UTC
🎁Reward:
- Qualified posts that comply with the above guidelines and contain more than 100 words will be reviewed and may receive a random traffic boost of 500 to 3,000 views. You will receive a notification from your feed secretary if your post is selected.
- Get a chance to have your article featured on Binance Square Official
Need ideas for your post? Visit the topic page #AIStocksWhatNext or the Square Guide on How to Post for Better Reach.
Binance Square Official
·399 Likes
·996.3k views
BitcoinTops$87KAtEightMonthHigh
18 views
5 Discussing
BitwiseNEARStakingETPAssetsTop$100M
3,821 views
38 Discussing