
KanT Crypto
4.5k Posts

KanT Crypto
Report
Block User
Decoding Politics. Tracking Crypto. Real-time news. 100% Signal with 0% Noise.
Open Trade

BNB Holder
Frequent Trader
1.2 Years
126 Following
1.7K+ Followers
8.4K+ Liked
Posts
Portfolio
All
Quotes
Videos
Live
PINNED
·
--
Bullish
Verified
🚨 BREAKING: 🇺🇸 Trump Reportedly Signs Order Letting Tax-Free Red Diesel Run on US Highways
The move would allow dyed off-road diesel, normally reserved for farms and heavy equipment, on public roads for the rest of 2026.
It's the same fuel. The red dye only marks that highway taxes weren't paid: 24.3 cents a gallon federal, plus about 35.5 cents in state taxes on average. Louisiana and Nebraska had already eased the rules on their own.
The catch: analysts say it won't lower the wholesale price. Refiners still get market rates, so the relief comes from skipped taxes, not more supply.
For markets, cheaper fuel at the pump cools inflation a little, and every bit helps the case for a Fed on hold.
Watch whether pump prices actually fall, and whether the diesel export-ban talk comes back.
Not financial advice.
$CL
{future}(CLUSDT)
$BZ
{future}(BZUSDT)
$NATGAS
{future}(NATGASUSDT)
🚨 BREAKING: 🇺🇸 Trump Reportedly Signs Order Letting Tax-Free Red Diesel Run on US Highways
The move would allow dyed off-road diesel, normally reserved for farms and heavy equipment, on public roads for the rest of 2026.
It's the same fuel. The red dye only marks that highway taxes weren't paid: 24.3 cents a gallon federal, plus about 35.5 cents in state taxes on average. Louisiana and Nebraska had already eased the rules on their own.
The catch: analysts say it won't lower the wholesale price. Refiners still get market rates, so the relief comes from skipped taxes, not more supply.
For markets, cheaper fuel at the pump cools inflation a little, and every bit helps the case for a Fed on hold.
Watch whether pump prices actually fall, and whether the diesel export-ban talk comes back.
Not financial advice.
$CL
$BZ
$NATGAS
The move would allow dyed off-road diesel, normally reserved for farms and heavy equipment, on public roads for the rest of 2026.
It's the same fuel. The red dye only marks that highway taxes weren't paid: 24.3 cents a gallon federal, plus about 35.5 cents in state taxes on average. Louisiana and Nebraska had already eased the rules on their own.
The catch: analysts say it won't lower the wholesale price. Refiners still get market rates, so the relief comes from skipped taxes, not more supply.
For markets, cheaper fuel at the pump cools inflation a little, and every bit helps the case for a Fed on hold.
Watch whether pump prices actually fall, and whether the diesel export-ban talk comes back.
Not financial advice.
$CL
$BZ
$NATGAS
1
1
28
31.8k
PINNED
·
--
Bearish
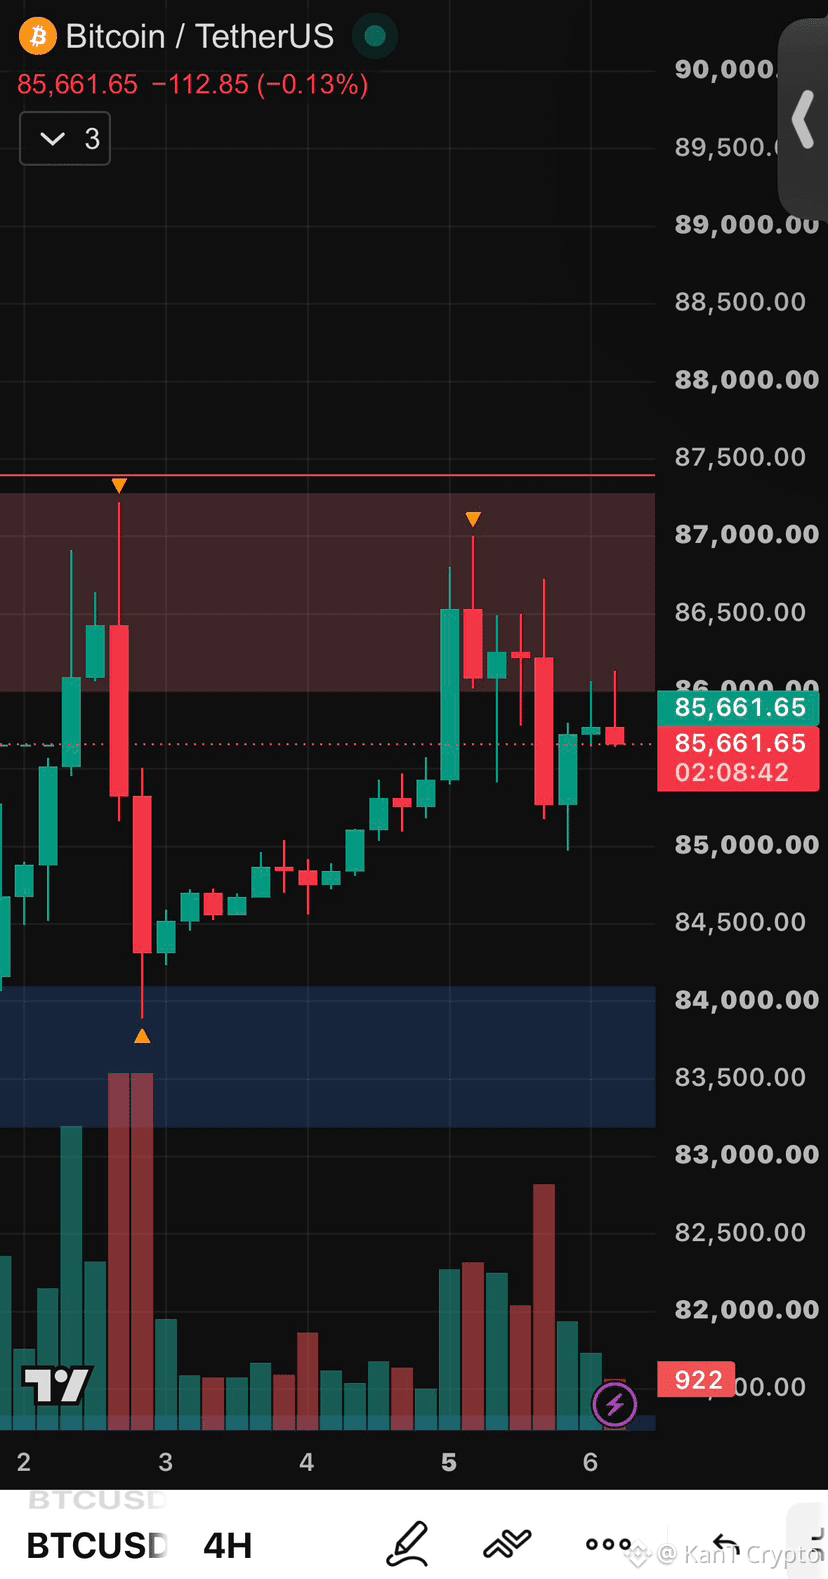
⚠️ The $87K Wall Just Blocked Bitcoin for the Third Time
Same wall. Same result.
Late September: rejected at $87.4K.
October 2: rejected at $87.2K.
October 5: rejected near $87K, then sold straight down to $85K.
Now BTC sits at $85,660 on the 4H, catching its breath. 👀
For the record, last time we said another rejection would make $85K the first stop. That's exactly where the selling paused, and the level is holding for now.
Look closer at those tops, though. Each push peaks a little lower: $87.4K, $87.2K, $87K, then $86.7K, and the latest bounce stalled near $86.1K. Buyers keep showing up, just with less force each time.
The lows tell the opposite story: $83.9K after the jobs-report flush, $85K this time. Higher lows under lower highs means the range is getting squeezed from both sides, and squeezes don't last forever.
The levels.
A 4H close above $87.4K finally breaks the wall, and the September highs turn into support.
Lose $85K, and the $83.2K to $84.1K demand zone is next, the same area that caught the last flush.
When a range tightens like this, the break usually comes fast. Let it pick a direction before you do.
Fourth try breaks the wall, or does $85K crack first? 🔥
Not financial advice.
$BTC
{future}(BTCUSDT)
$RLC
{future}(RLCUSDT)
$NEAR
{future}(NEARUSDT)
⚠️ The $87K Wall Just Blocked Bitcoin for the Third Time
Same wall. Same result.
Late September: rejected at $87.4K.
October 2: rejected at $87.2K.
October 5: rejected near $87K, then sold straight down to $85K.
Now BTC sits at $85,660 on the 4H, catching its breath. 👀
For the record, last time we said another rejection would make $85K the first stop. That's exactly where the selling paused, and the level is holding for now.
Look closer at those tops, though. Each push peaks a little lower: $87.4K, $87.2K, $87K, then $86.7K, and the latest bounce stalled near $86.1K. Buyers keep showing up, just with less force each time.
The lows tell the opposite story: $83.9K after the jobs-report flush, $85K this time. Higher lows under lower highs means the range is getting squeezed from both sides, and squeezes don't last forever.
The levels.
A 4H close above $87.4K finally breaks the wall, and the September highs turn into support.
Lose $85K, and the $83.2K to $84.1K demand zone is next, the same area that caught the last flush.
When a range tightens like this, the break usually comes fast. Let it pick a direction before you do.
Fourth try breaks the wall, or does $85K crack first? 🔥
Not financial advice.
$BTC
$RLC
$NEAR
Same wall. Same result.
Late September: rejected at $87.4K.
October 2: rejected at $87.2K.
October 5: rejected near $87K, then sold straight down to $85K.
Now BTC sits at $85,660 on the 4H, catching its breath. 👀
For the record, last time we said another rejection would make $85K the first stop. That's exactly where the selling paused, and the level is holding for now.
Look closer at those tops, though. Each push peaks a little lower: $87.4K, $87.2K, $87K, then $86.7K, and the latest bounce stalled near $86.1K. Buyers keep showing up, just with less force each time.
The lows tell the opposite story: $83.9K after the jobs-report flush, $85K this time. Higher lows under lower highs means the range is getting squeezed from both sides, and squeezes don't last forever.
The levels.
A 4H close above $87.4K finally breaks the wall, and the September highs turn into support.
Lose $85K, and the $83.2K to $84.1K demand zone is next, the same area that caught the last flush.
When a range tightens like this, the break usually comes fast. Let it pick a direction before you do.
Fourth try breaks the wall, or does $85K crack first? 🔥
Not financial advice.
$BTC
$RLC
$NEAR
1
10
7.5k
·
--
Bearish
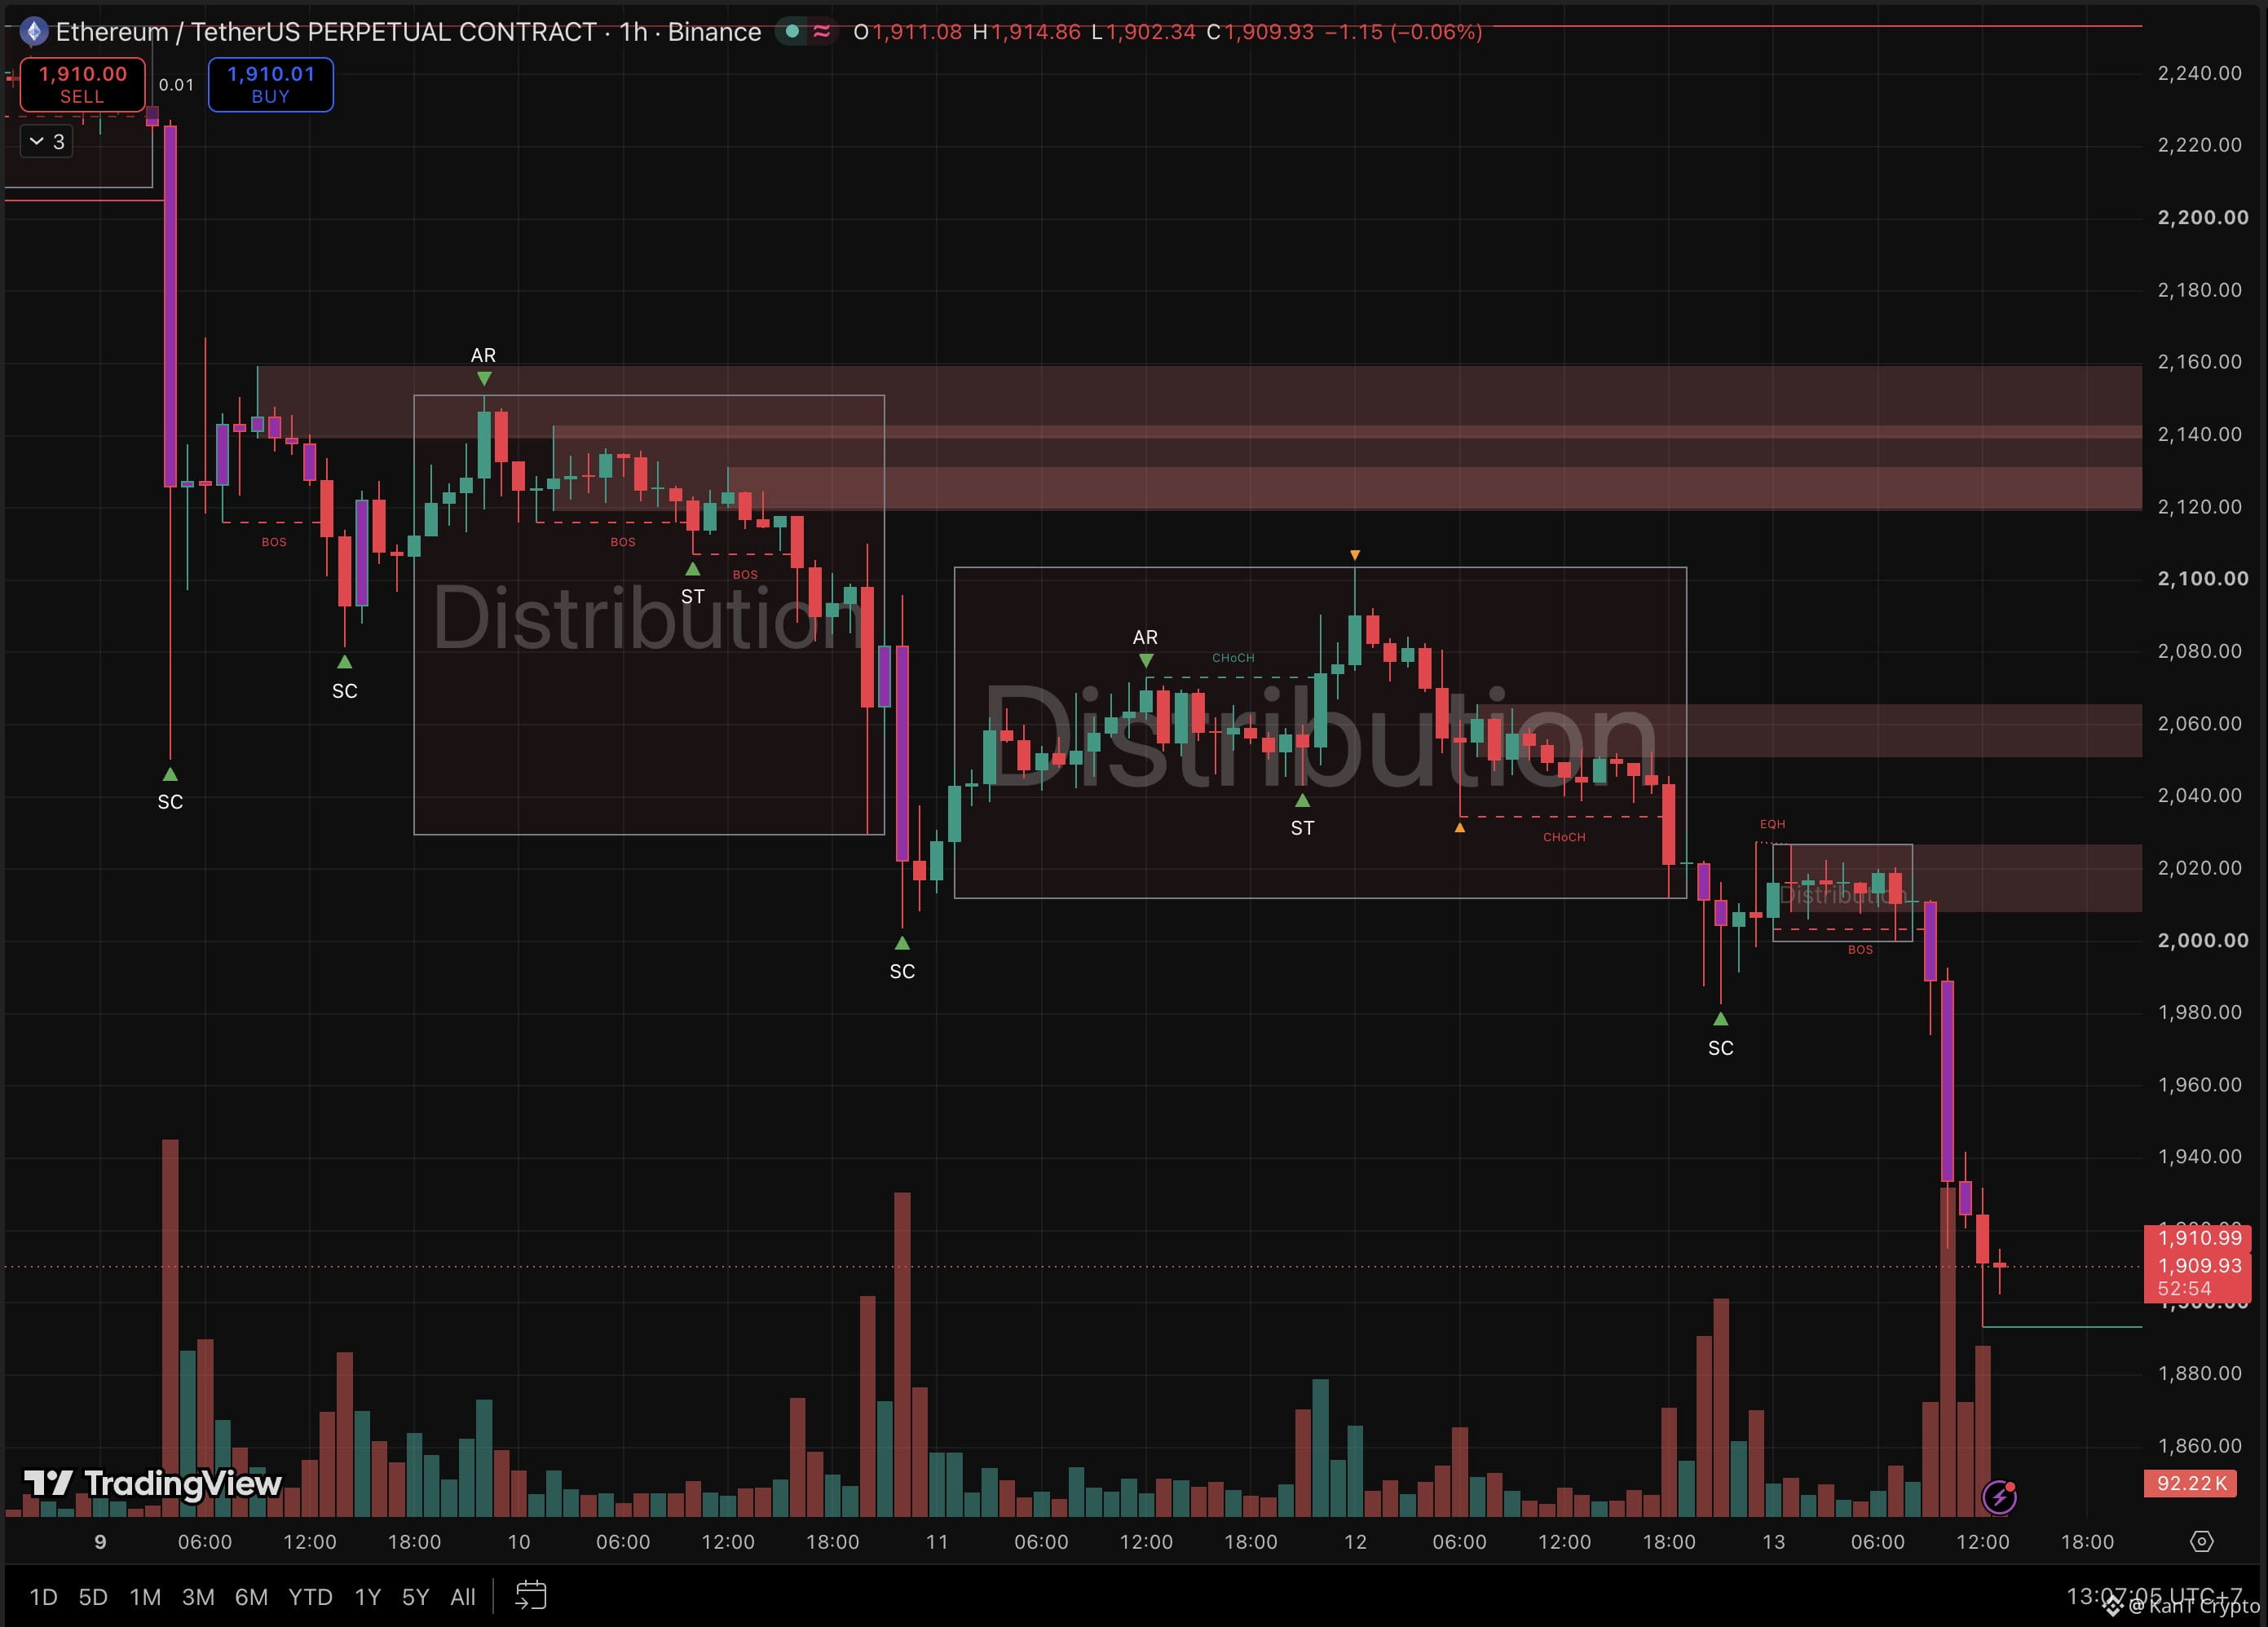
🚨 JUST IN: Bitcoin cracks $68K. Ethereum cracks $1,900.
Two round numbers. One afternoon. Zero bounce.
BTC: $67,971, about 9% off this week’s $74.7K high
ETH: $1,899, about 7% off $2,050
Liquidations: over $1.4B in 24h, longs roughly 8 to 1
Look at the shape of the move.
Bitcoin’s last bounce near $71.6K got sold within hours.
Then the candles got longer, not shorter.
That’s acceleration, not exhaustion. 📉
Ethereum did the same thing in fast-forward.
It sat above $2,000 like it was safe, then dropped nearly $80 in two candles.
Every long that buys the dip here becomes the next liquidation if price keeps sliding.
That’s the fuel behind cascades like this.
$68.5K for Bitcoin and $2,000 for Ethereum were floors this morning.
Now they’re ceilings. 👀
BTC reclaims $68.5K on a 4H close → first sign the flush is ending.
ETH reclaims $2,000 → the breakdown was a trap.
Fail both → no marked floor yet, and round numbers alone won’t stop this.
Waterfalls end when sellers run out, not when a chart looks “too low.” Let a base form before betting on one.
Capitulation bottom, or still mid-waterfall?
Not financial advice.
$BTC
{future}(BTCUSDT)
$ETH
{future}(ETHUSDT)
$NVDA
{future}(NVDAUSDT)
🚨 JUST IN: Bitcoin cracks $68K. Ethereum cracks $1,900.
Two round numbers. One afternoon. Zero bounce.
BTC: $67,971, about 9% off this week’s $74.7K high
ETH: $1,899, about 7% off $2,050
Liquidations: over $1.4B in 24h, longs roughly 8 to 1
Look at the shape of the move.
Bitcoin’s last bounce near $71.6K got sold within hours.
Then the candles got longer, not shorter.
That’s acceleration, not exhaustion. 📉
Ethereum did the same thing in fast-forward.
It sat above $2,000 like it was safe, then dropped nearly $80 in two candles.
Every long that buys the dip here becomes the next liquidation if price keeps sliding.
That’s the fuel behind cascades like this.
$68.5K for Bitcoin and $2,000 for Ethereum were floors this morning.
Now they’re ceilings. 👀
BTC reclaims $68.5K on a 4H close → first sign the flush is ending.
ETH reclaims $2,000 → the breakdown was a trap.
Fail both → no marked floor yet, and round numbers alone won’t stop this.
Waterfalls end when sellers run out, not when a chart looks “too low.” Let a base form before betting on one.
Capitulation bottom, or still mid-waterfall?
Not financial advice.
$BTC
$ETH
$NVDA
Two round numbers. One afternoon. Zero bounce.
BTC: $67,971, about 9% off this week’s $74.7K high
ETH: $1,899, about 7% off $2,050
Liquidations: over $1.4B in 24h, longs roughly 8 to 1
Look at the shape of the move.
Bitcoin’s last bounce near $71.6K got sold within hours.
Then the candles got longer, not shorter.
That’s acceleration, not exhaustion. 📉
Ethereum did the same thing in fast-forward.
It sat above $2,000 like it was safe, then dropped nearly $80 in two candles.
Every long that buys the dip here becomes the next liquidation if price keeps sliding.
That’s the fuel behind cascades like this.
$68.5K for Bitcoin and $2,000 for Ethereum were floors this morning.
Now they’re ceilings. 👀
BTC reclaims $68.5K on a 4H close → first sign the flush is ending.
ETH reclaims $2,000 → the breakdown was a trap.
Fail both → no marked floor yet, and round numbers alone won’t stop this.
Waterfalls end when sellers run out, not when a chart looks “too low.” Let a base form before betting on one.
Capitulation bottom, or still mid-waterfall?
Not financial advice.
$BTC
$ETH
$NVDA
1
2.1k
·
--
Bearish
Verified
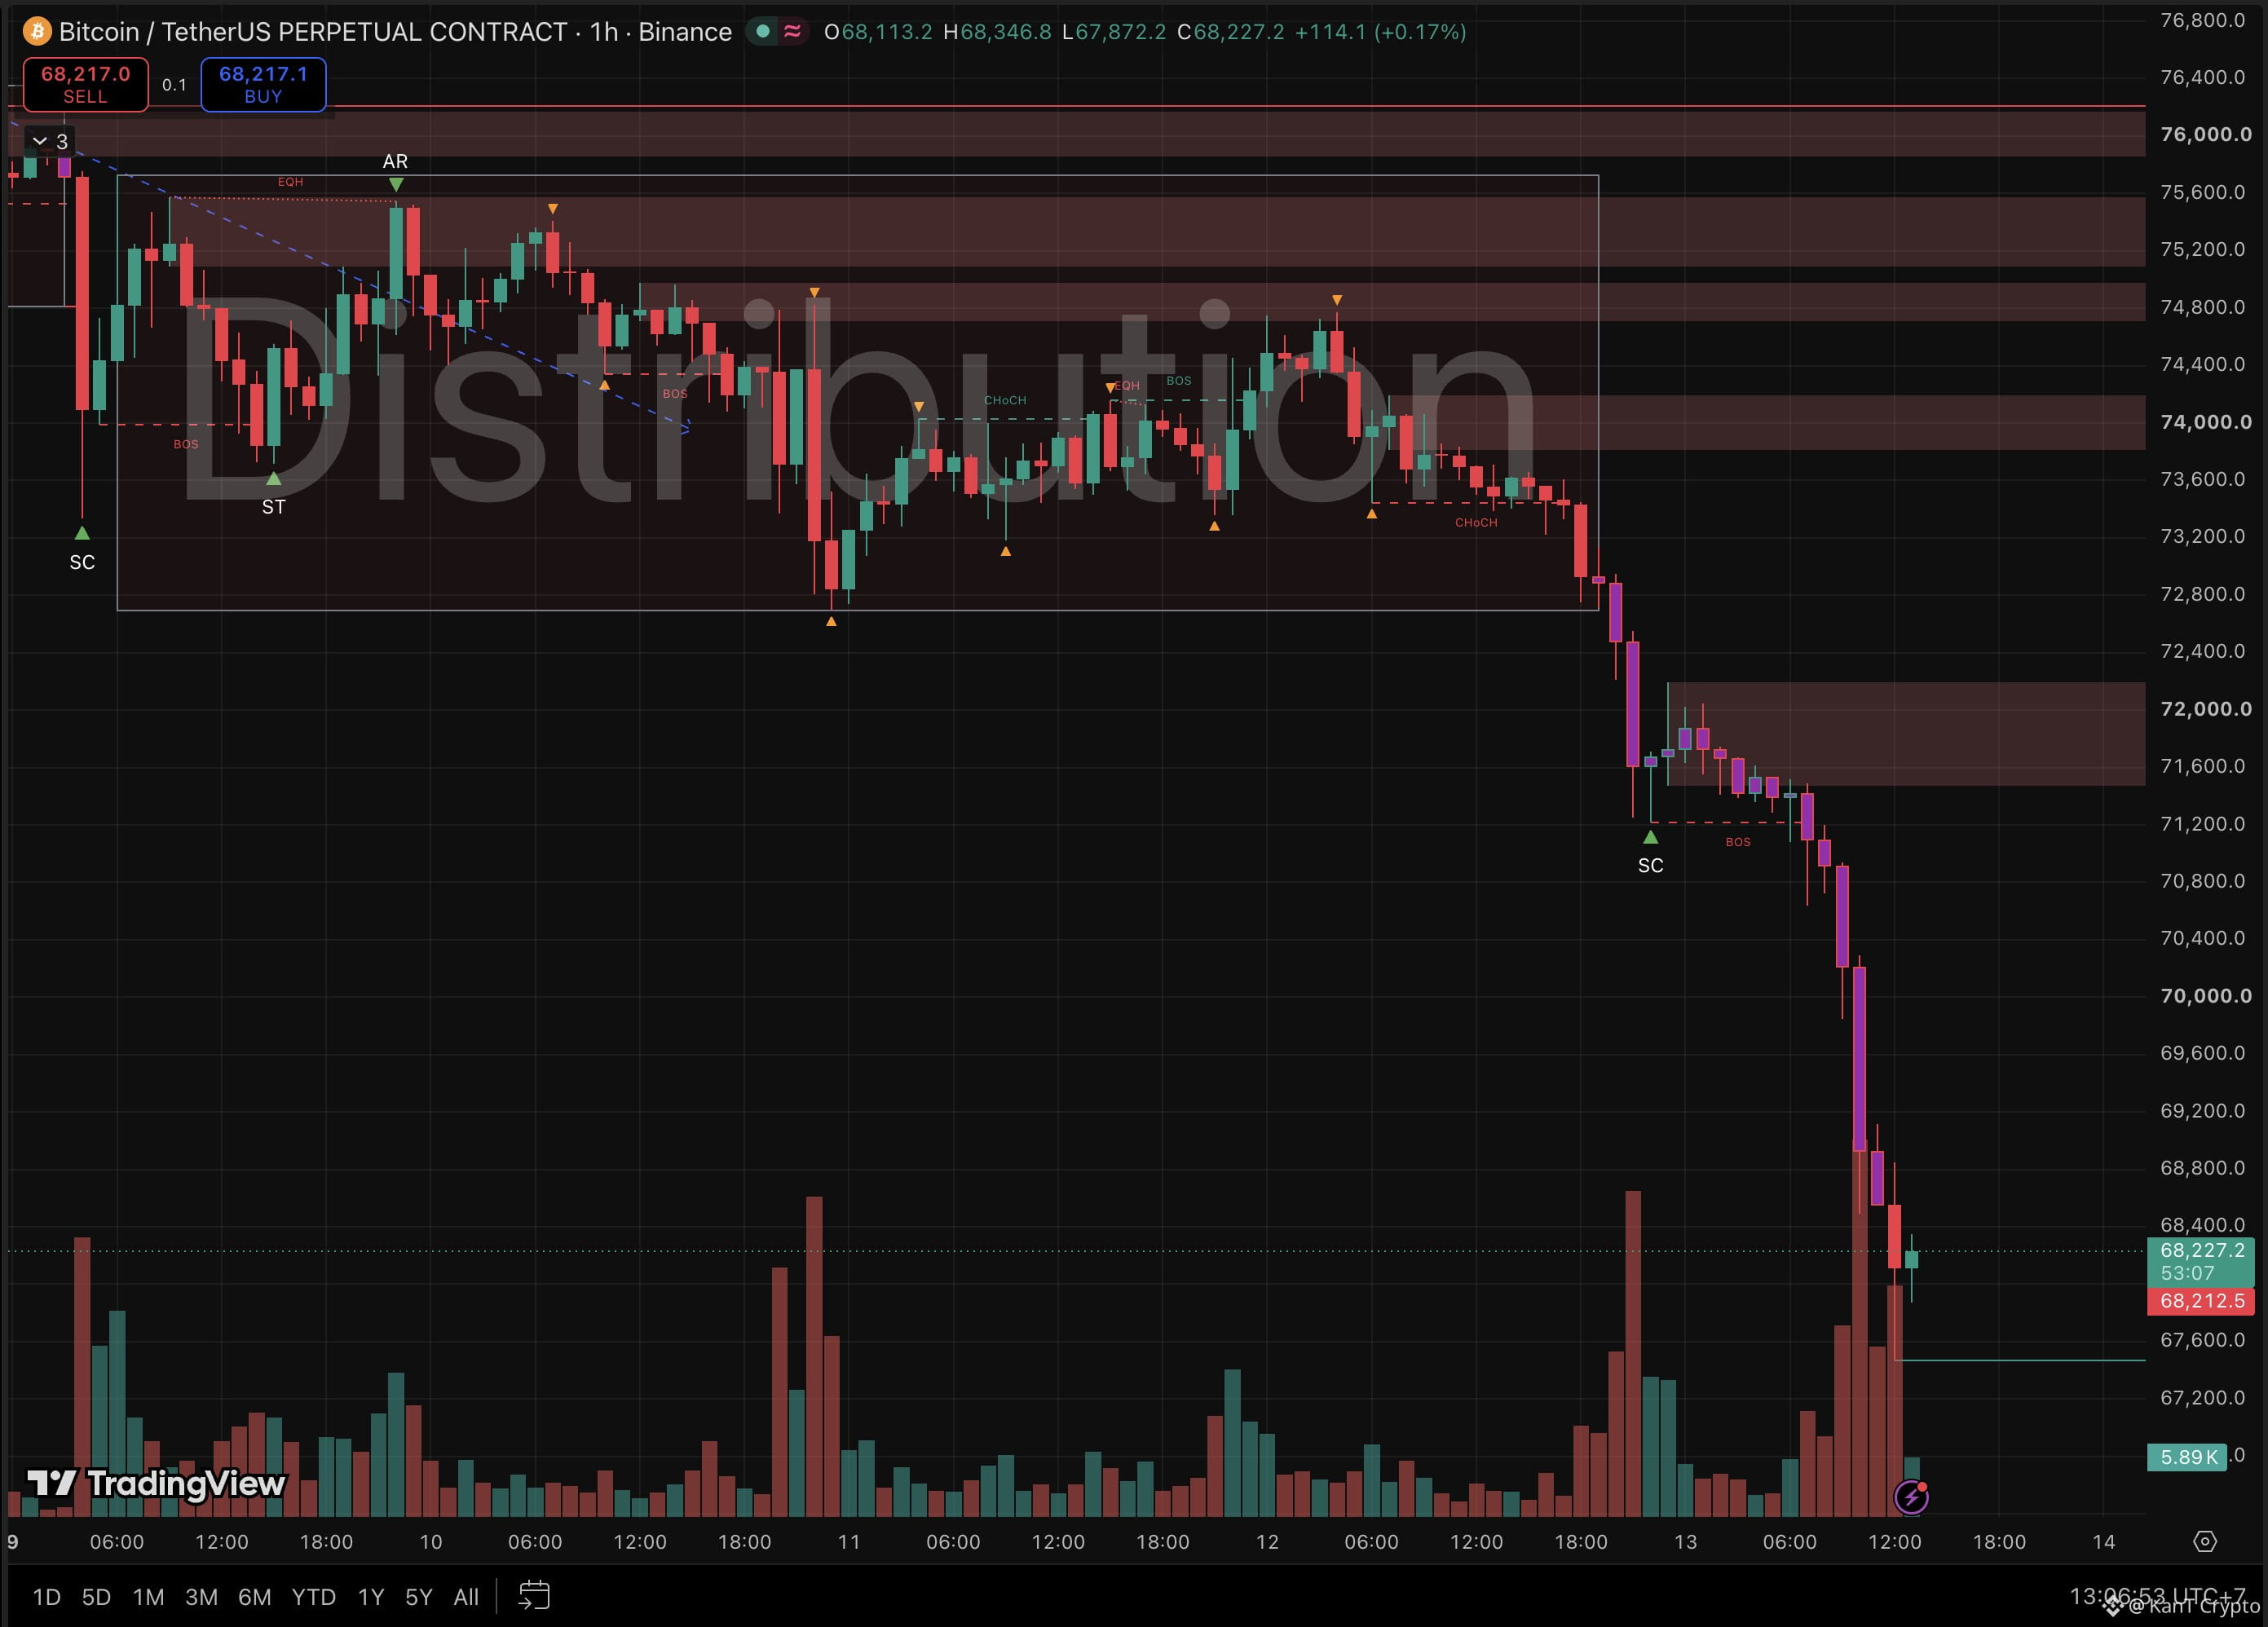
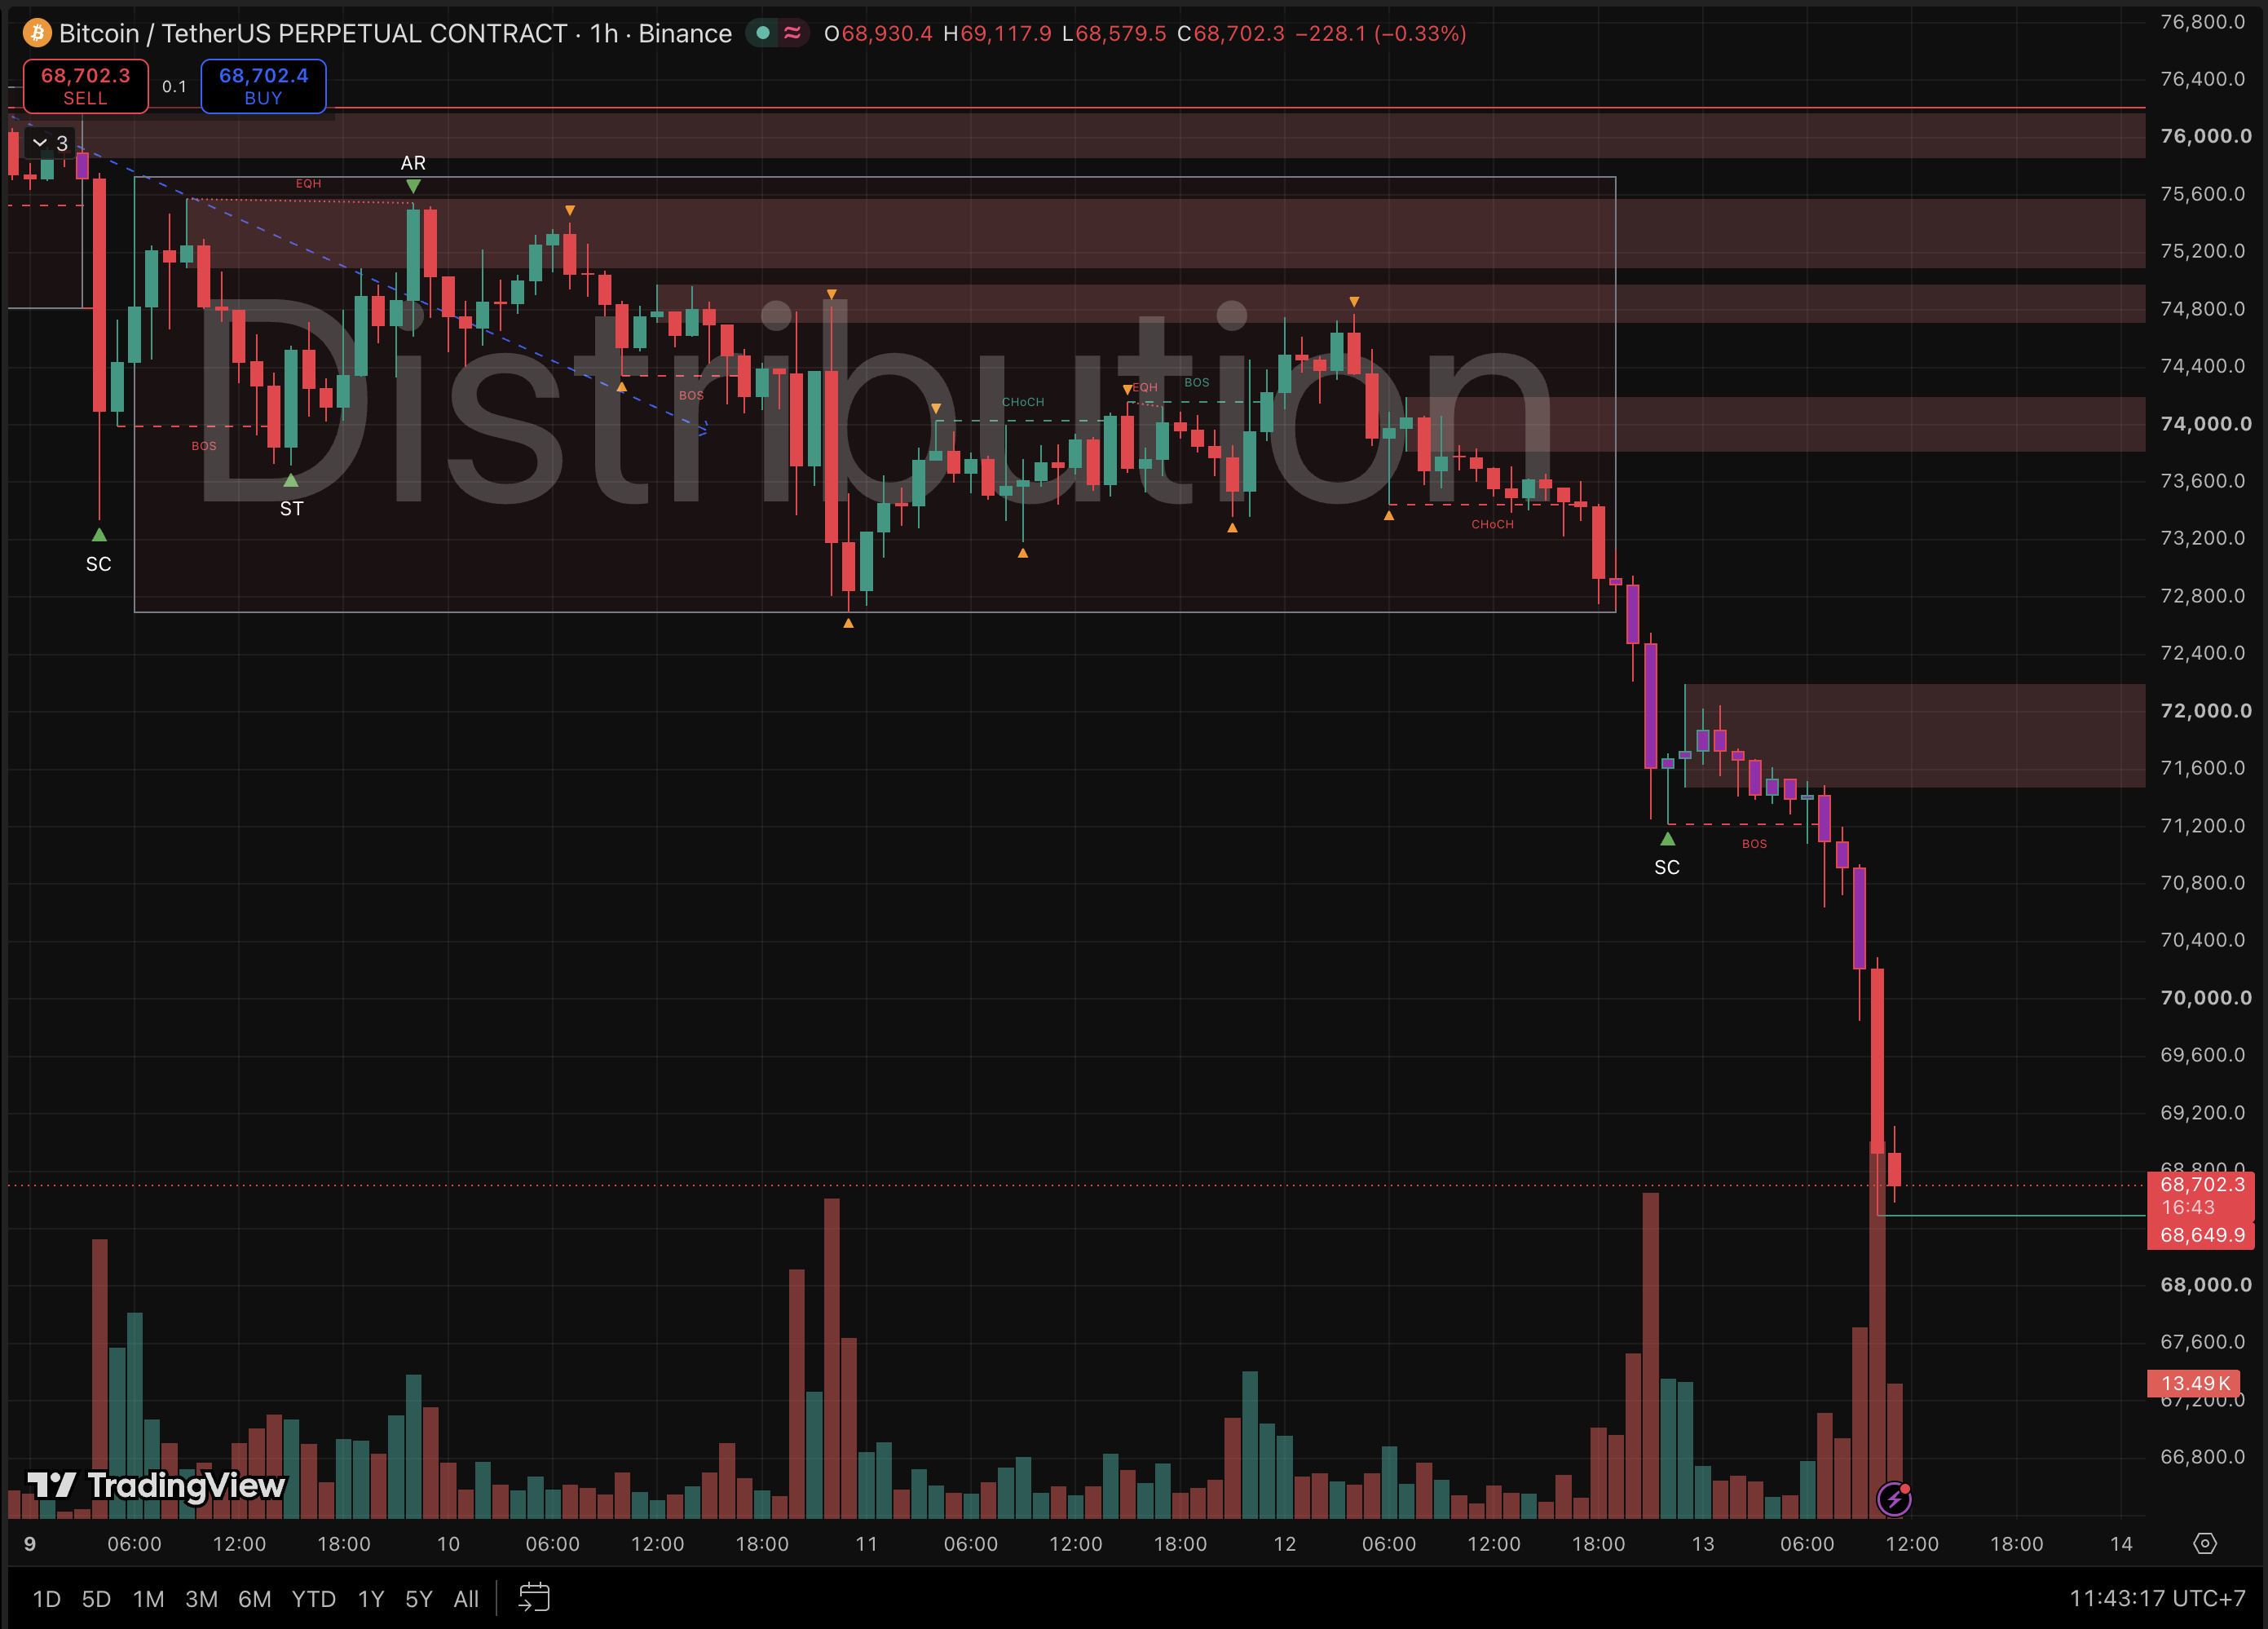
💥 Nvidia lost its CEO. Bitcoin lost $70K. 👀
Low: ~$68.5K, first time under $70K since August
From the top of the range: about -9%
BTC longs liquidated: $653M, 96% of all BTC liquidations
Jensen Huang resigned, CFO Colette Kress stepped in as interim CEO, and Nvidia fell about 10% at Thursday’s open.
But it wasn’t the only weight.
Dollar index above 103, a 19-month high.
Spot ETFs bleeding $1.44B over five straight sessions.
The chart saw this coming.
Four days stuck between $72.7K and $75.7K.
Every rally sold under $75K.
That’s distribution (big players quietly selling into a flat range).
Yesterday’s map: lose $73.2K and below $72.7K it’s empty air.
The air was $4,000 deep. 🩸
Once the range broke, the first selling climax at $71.2K bounced straight into supply at $71.5K to $72.2K and got sold again.
Lower high. Lower low.
Then the floor gave way on the biggest volume bar on this chart.
Volume that big can mark a capitulation low, the moment sellers run out.
Or it can just be the opening act.
Reclaim $70K on a 4H close → flush looks done, $71.2K to $72.2K is the ceiling.
Lose $68.5K → nothing marked on this chart until well below.
Catching knives in a fresh downtrend is how accounts end. Let the 4H close show you who’s in control.
Capitulation low, or the opening act?
Not financial advice.
$BTC
{future}(BTCUSDT)
$NVDA
{future}(NVDAUSDT)
$SOL
{future}(SOLUSDT)
💥 Nvidia lost its CEO. Bitcoin lost $70K. 👀
Low: ~$68.5K, first time under $70K since August
From the top of the range: about -9%
BTC longs liquidated: $653M, 96% of all BTC liquidations
Jensen Huang resigned, CFO Colette Kress stepped in as interim CEO, and Nvidia fell about 10% at Thursday’s open.
But it wasn’t the only weight.
Dollar index above 103, a 19-month high.
Spot ETFs bleeding $1.44B over five straight sessions.
The chart saw this coming.
Four days stuck between $72.7K and $75.7K.
Every rally sold under $75K.
That’s distribution (big players quietly selling into a flat range).
Yesterday’s map: lose $73.2K and below $72.7K it’s empty air.
The air was $4,000 deep. 🩸
Once the range broke, the first selling climax at $71.2K bounced straight into supply at $71.5K to $72.2K and got sold again.
Lower high. Lower low.
Then the floor gave way on the biggest volume bar on this chart.
Volume that big can mark a capitulation low, the moment sellers run out.
Or it can just be the opening act.
Reclaim $70K on a 4H close → flush looks done, $71.2K to $72.2K is the ceiling.
Lose $68.5K → nothing marked on this chart until well below.
Catching knives in a fresh downtrend is how accounts end. Let the 4H close show you who’s in control.
Capitulation low, or the opening act?
Not financial advice.
$BTC
$NVDA
$SOL
Low: ~$68.5K, first time under $70K since August
From the top of the range: about -9%
BTC longs liquidated: $653M, 96% of all BTC liquidations
Jensen Huang resigned, CFO Colette Kress stepped in as interim CEO, and Nvidia fell about 10% at Thursday’s open.
But it wasn’t the only weight.
Dollar index above 103, a 19-month high.
Spot ETFs bleeding $1.44B over five straight sessions.
The chart saw this coming.
Four days stuck between $72.7K and $75.7K.
Every rally sold under $75K.
That’s distribution (big players quietly selling into a flat range).
Yesterday’s map: lose $73.2K and below $72.7K it’s empty air.
The air was $4,000 deep. 🩸
Once the range broke, the first selling climax at $71.2K bounced straight into supply at $71.5K to $72.2K and got sold again.
Lower high. Lower low.
Then the floor gave way on the biggest volume bar on this chart.
Volume that big can mark a capitulation low, the moment sellers run out.
Or it can just be the opening act.
Reclaim $70K on a 4H close → flush looks done, $71.2K to $72.2K is the ceiling.
Lose $68.5K → nothing marked on this chart until well below.
Catching knives in a fresh downtrend is how accounts end. Let the 4H close show you who’s in control.
Capitulation low, or the opening act?
Not financial advice.
$BTC
$NVDA
$SOL
1
846
·
--
Bearish
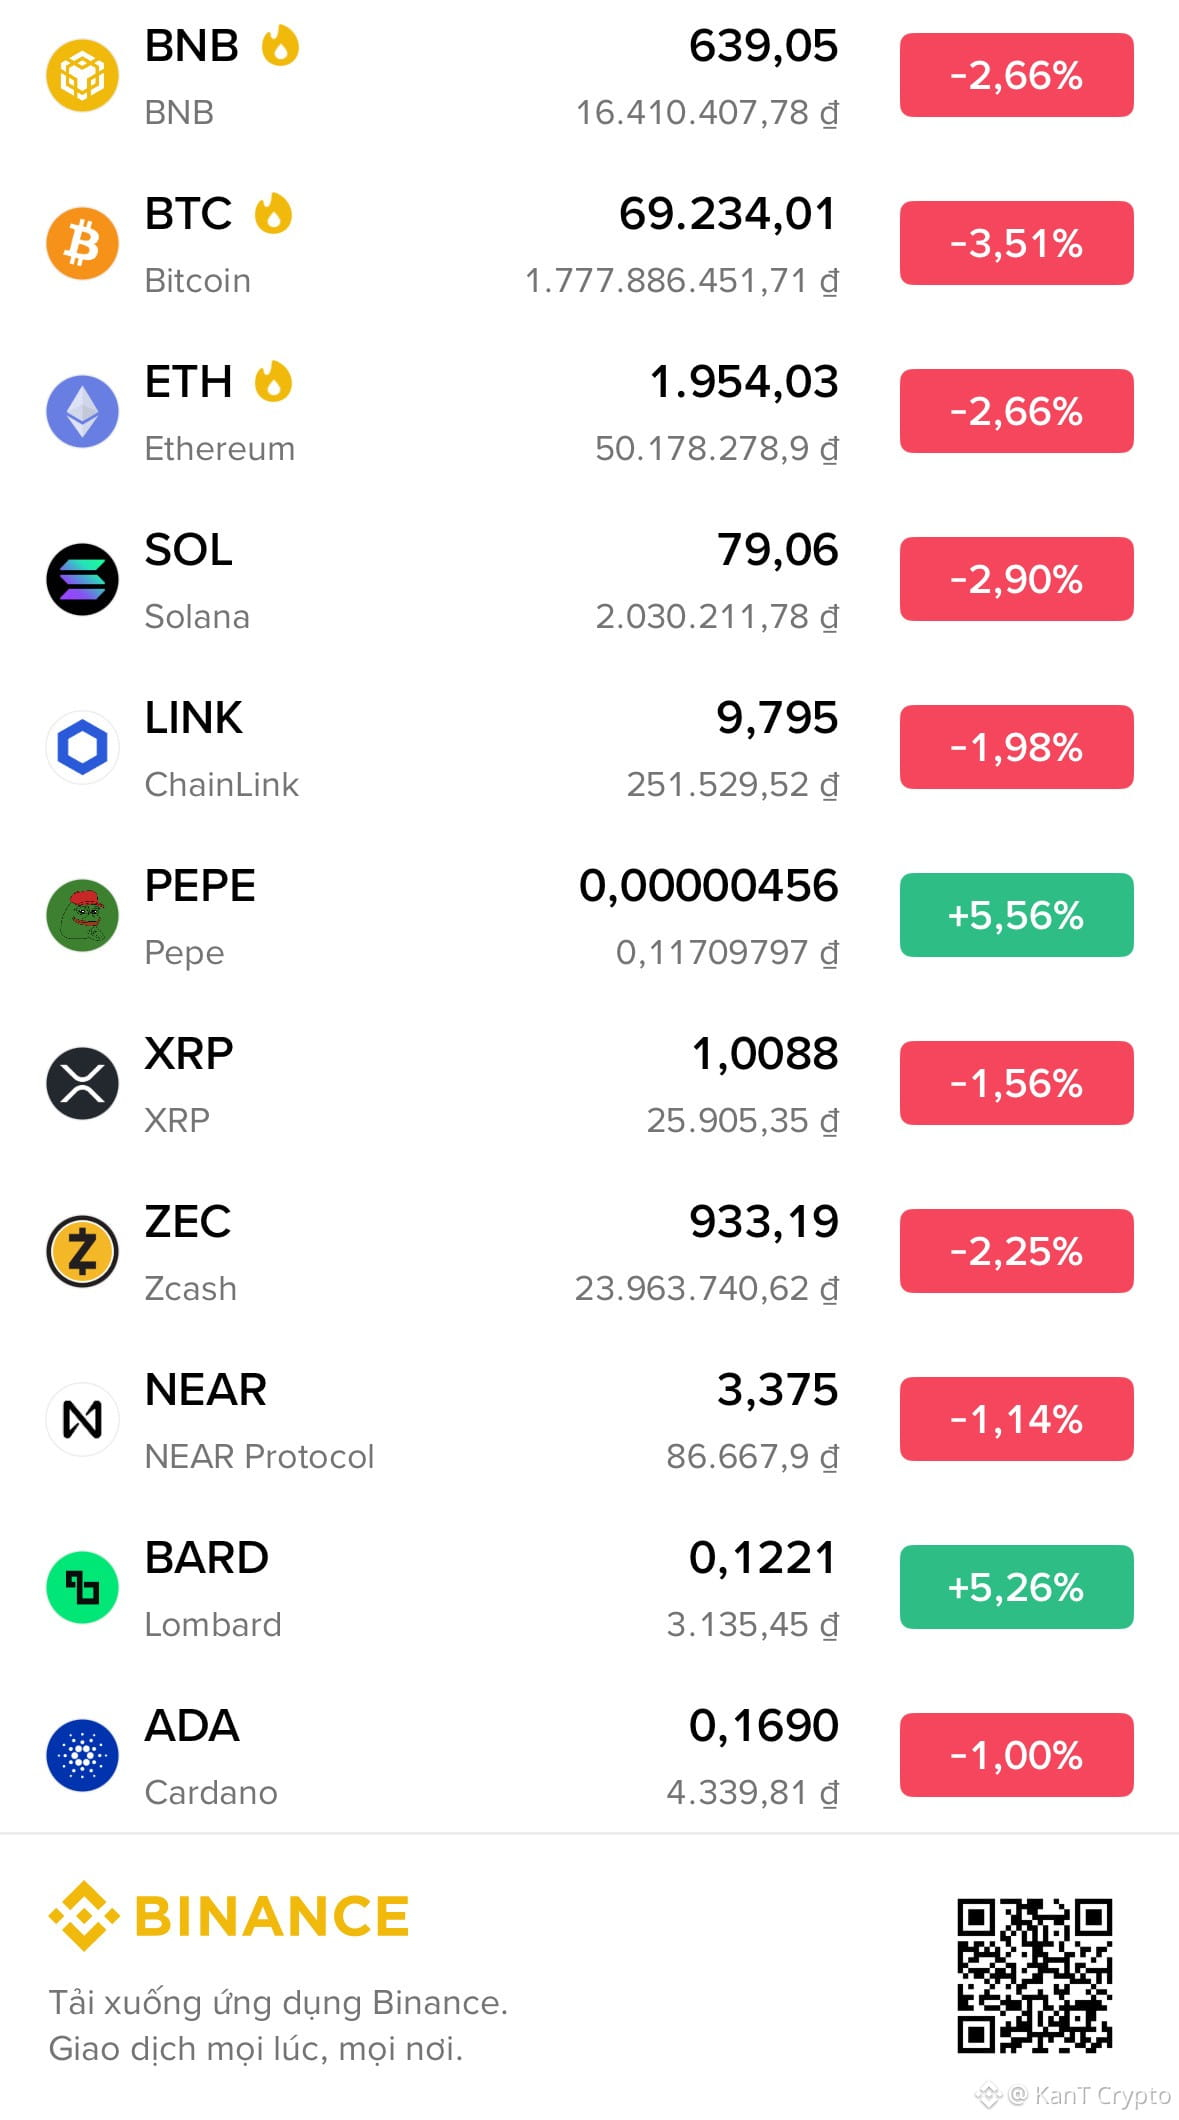
JUST IN: $500,000,000 liquidated from the crypto market in the past hour.
$BTC falls under $69,000
$ETH falls under $1,950
$XRP falls under $1.01
$SOL falls under $80
$BTC
{future}(BTCUSDT)
{future}(ETHUSDT)
$SOL
{future}(SOLUSDT)
JUST IN: $500,000,000 liquidated from the crypto market in the past hour.
$BTC falls under $69,000
$ETH falls under $1,950
$XRP falls under $1.01
$SOL falls under $80
$BTC
$SOL
$BTC falls under $69,000
$ETH falls under $1,950
$XRP falls under $1.01
$SOL falls under $80
$BTC
$SOL
1
88
·
--
Bearish
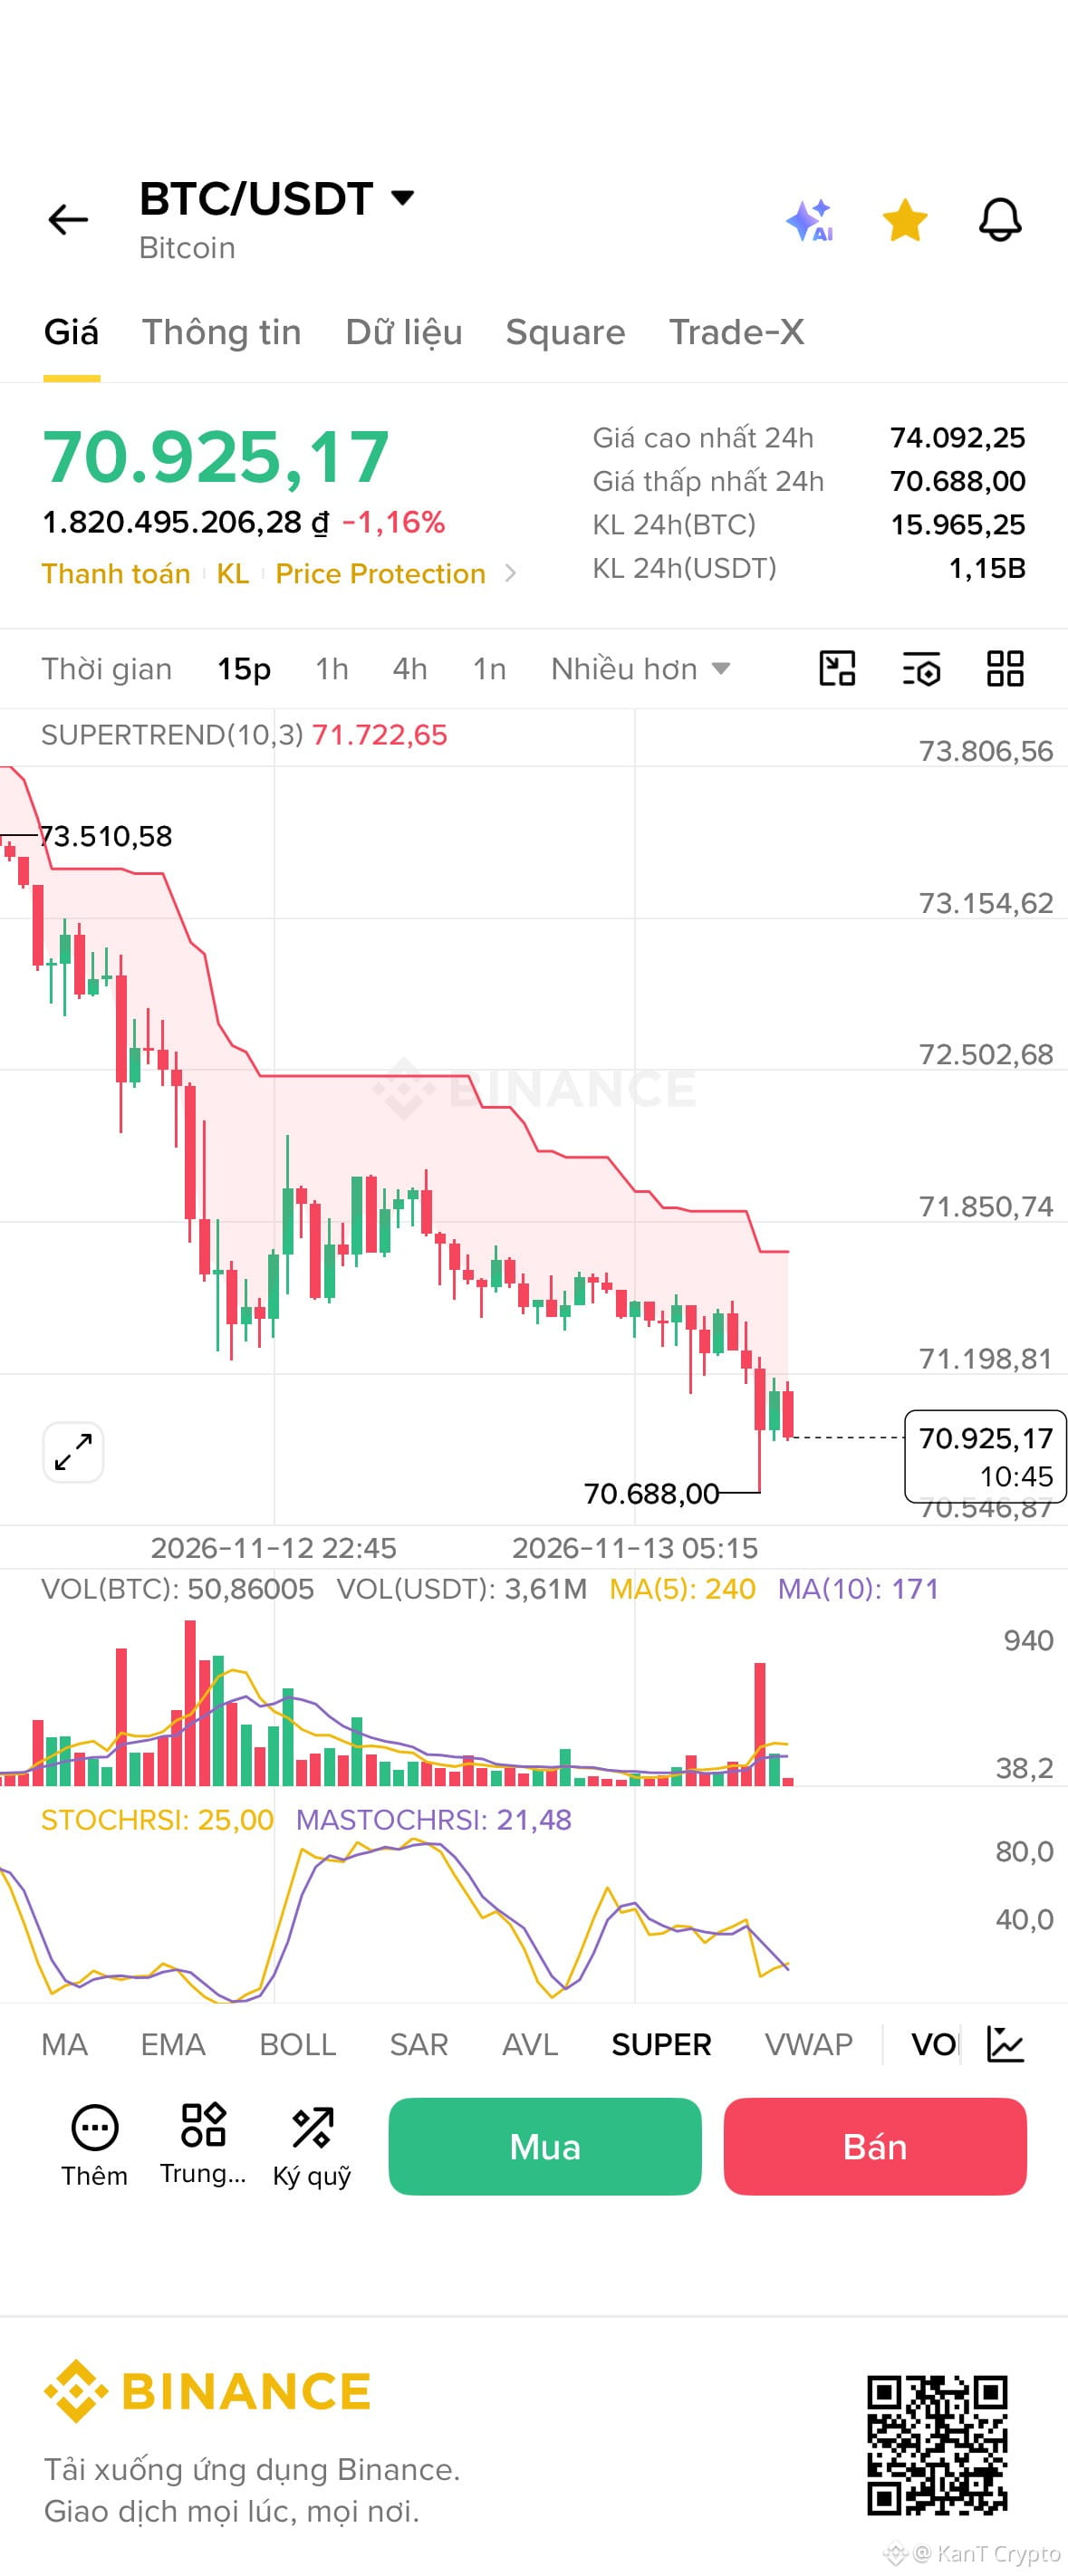
$BTC just dropped below $71,000
$50 Million longs liquidated in 15 mins.
{future}(BTCUSDT)
$ETH
{future}(ETHUSDT)
$SOL
{future}(SOLUSDT)
$BTC just dropped below $71,000
$50 Million longs liquidated in 15 mins.
$ETH
$SOL
$50 Million longs liquidated in 15 mins.
$ETH
$SOL
Sourced by user sharing on Binance
2
123
·
--
Bearish
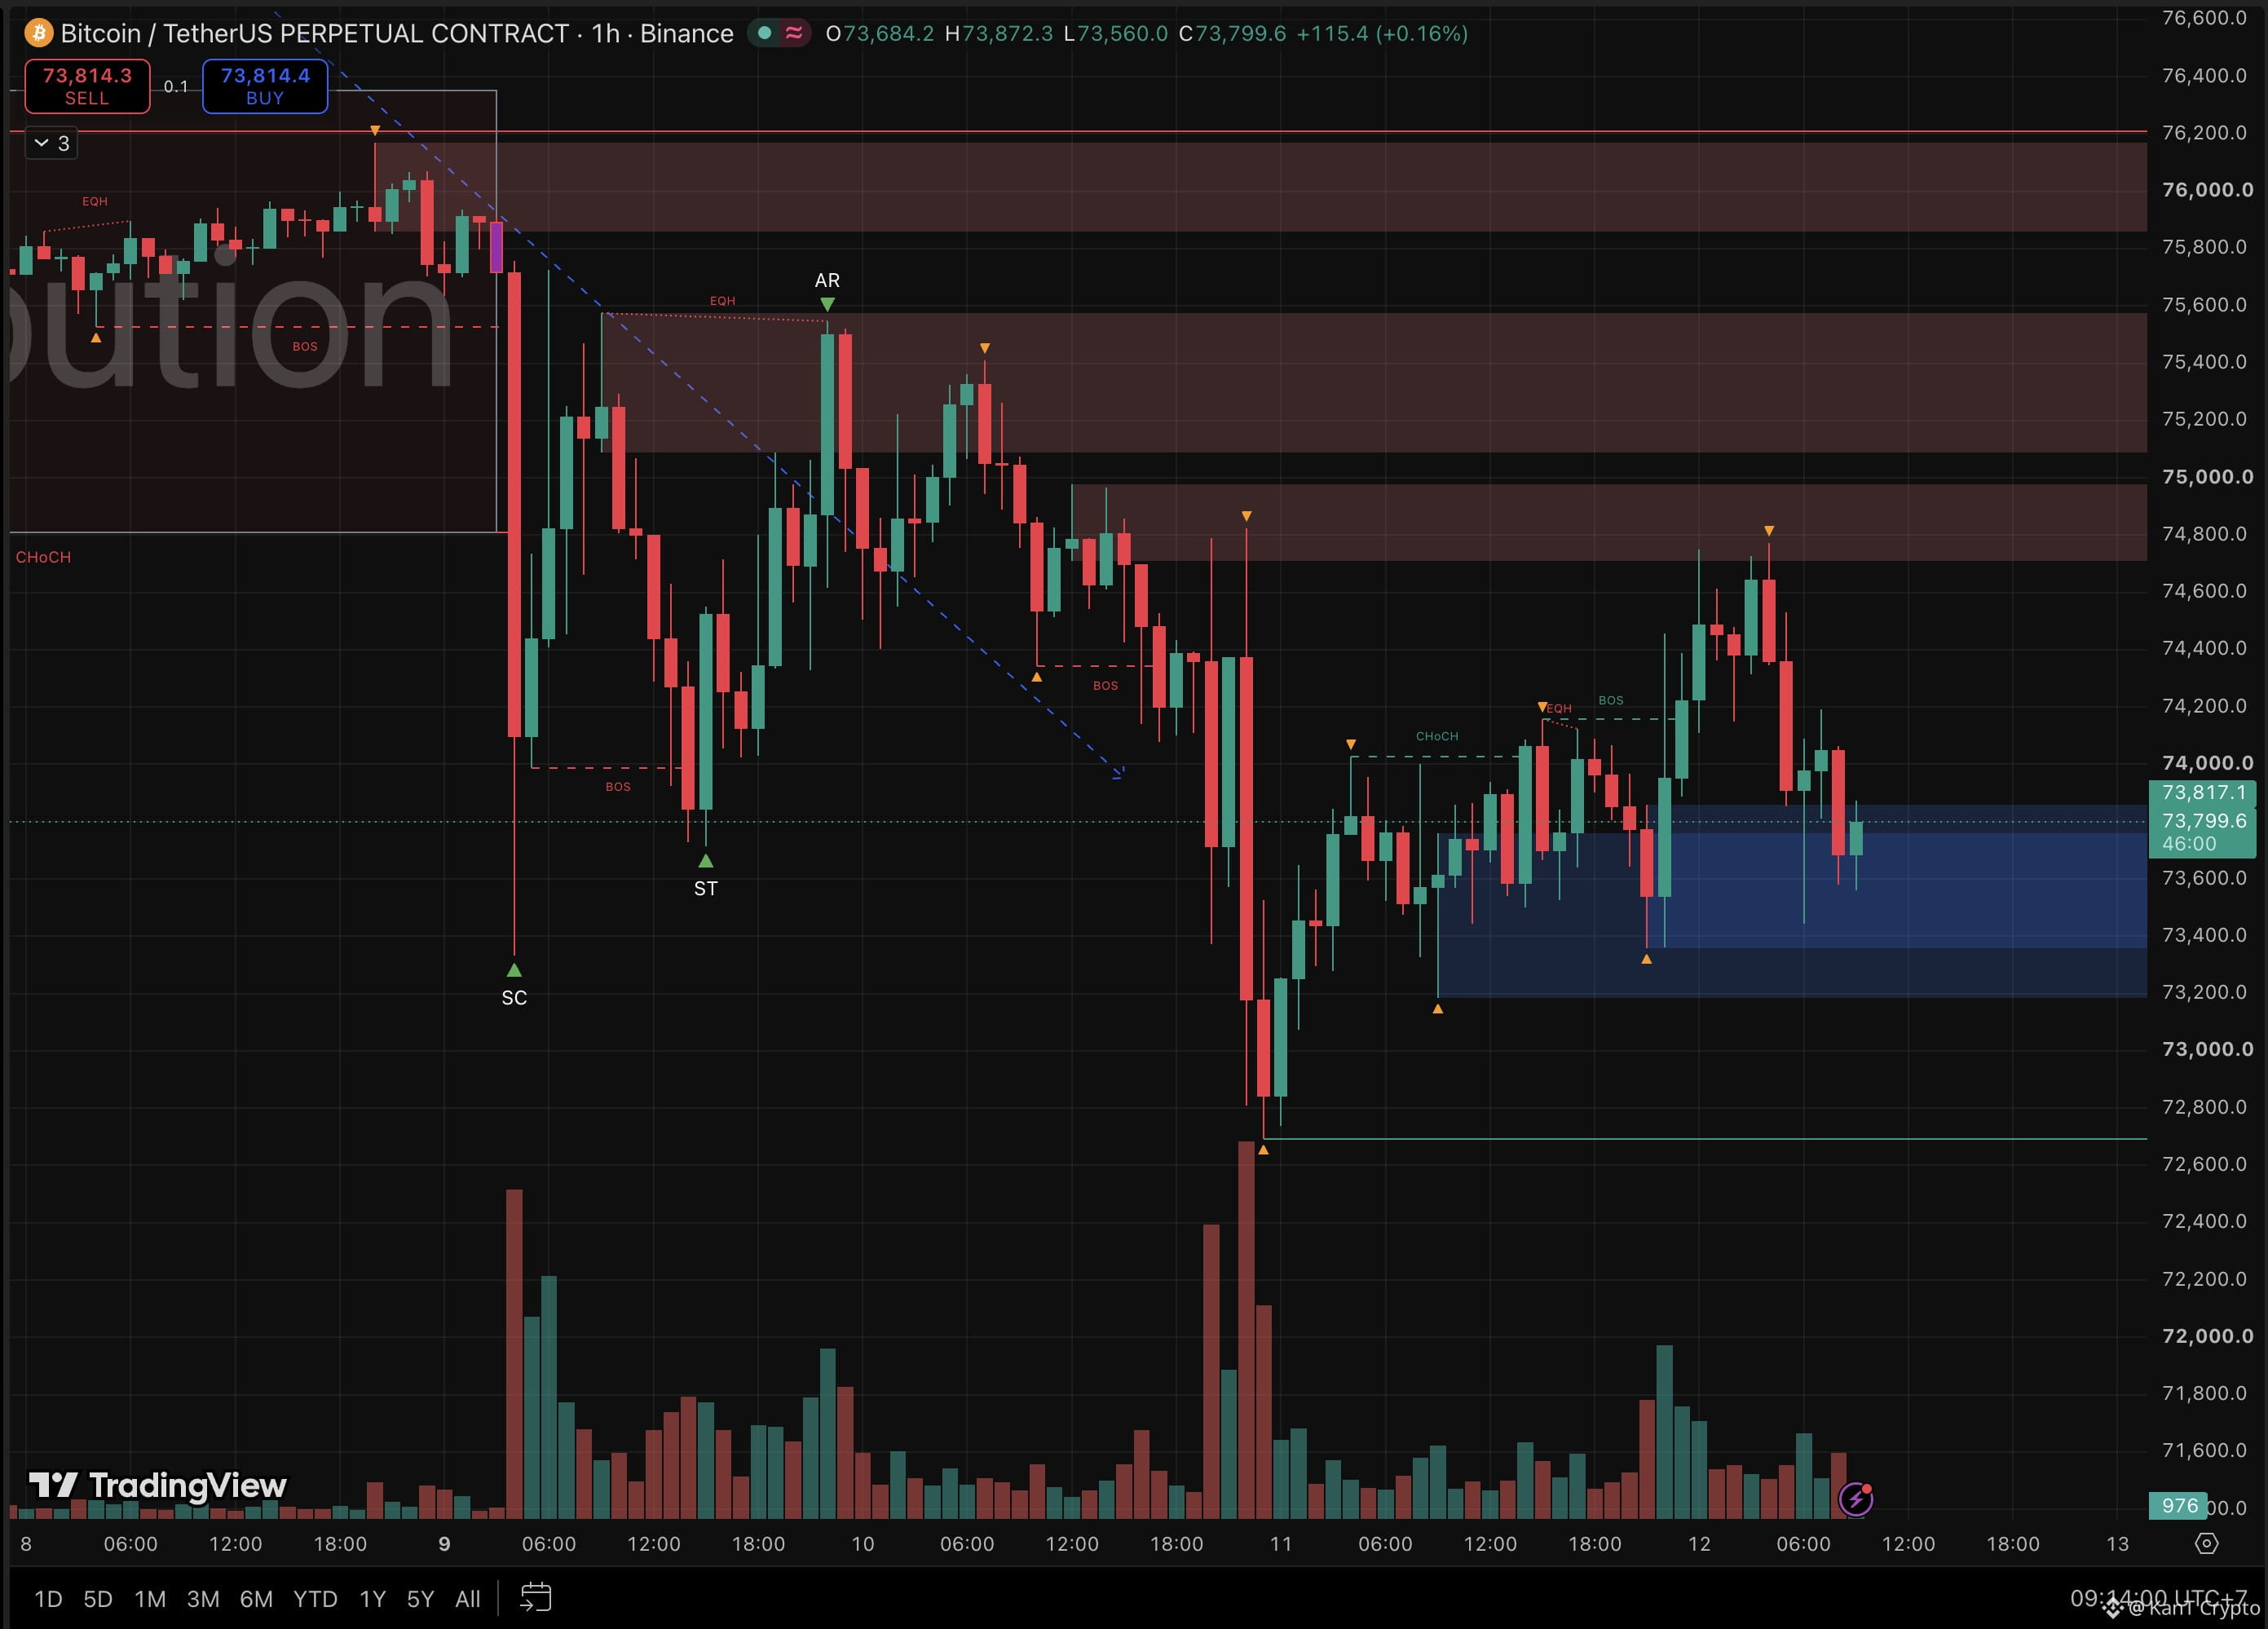
⚠️ Bitcoin keeps walking into the same $75K wall like it forgot it was there.
Second faceplant this week.
Tuesday's spike: ~$74.8K, then a dump to $72.7K
Overnight high: ~$74.75K
Now: $73,800
Wall: supply from $74.7K to $75K, where sellers keep waiting
The painful part? Bulls actually won something first.
Yesterday's bounce printed a CHoCH at $74K (the first sign a trend may be flipping) and a BOS at $74.15K (structure confirming higher).
Then the wall slapped it.
Price fell back under both levels within hours. 📉
A breakout that can't hold its own breakout level is a warning, not a win.
But the floor is just as stubborn.
$72.7K, then $73.2K, then $73.35K, then $73.45K.
Higher lows, every single dip.
And price is sitting inside the $73.2K to $73.85K demand zone, where buyers showed up twice already.
So Bitcoin is boxed in: rising floor, flat ceiling.
Something gives soon. 👀
Reclaim $74K on a 4H close → the flip is back on, and the $75K wall gets a third test.
Lose $73.2K → the higher lows break, $72.7K is next, and below that the chart is empty air.
Two rejections at the same level means sellers are camped there. Don't buy the ceiling, and don't short the floor.
Third time through $75K, or does $73.2K crack first?
Not financial advice.
$BTC
{future}(BTCUSDT)
$ETH
{future}(ETHUSDT)
$SOL
{future}(SOLUSDT)
⚠️ Bitcoin keeps walking into the same $75K wall like it forgot it was there.
Second faceplant this week.
Tuesday's spike: ~$74.8K, then a dump to $72.7K
Overnight high: ~$74.75K
Now: $73,800
Wall: supply from $74.7K to $75K, where sellers keep waiting
The painful part? Bulls actually won something first.
Yesterday's bounce printed a CHoCH at $74K (the first sign a trend may be flipping) and a BOS at $74.15K (structure confirming higher).
Then the wall slapped it.
Price fell back under both levels within hours. 📉
A breakout that can't hold its own breakout level is a warning, not a win.
But the floor is just as stubborn.
$72.7K, then $73.2K, then $73.35K, then $73.45K.
Higher lows, every single dip.
And price is sitting inside the $73.2K to $73.85K demand zone, where buyers showed up twice already.
So Bitcoin is boxed in: rising floor, flat ceiling.
Something gives soon. 👀
Reclaim $74K on a 4H close → the flip is back on, and the $75K wall gets a third test.
Lose $73.2K → the higher lows break, $72.7K is next, and below that the chart is empty air.
Two rejections at the same level means sellers are camped there. Don't buy the ceiling, and don't short the floor.
Third time through $75K, or does $73.2K crack first?
Not financial advice.
$BTC
$ETH
$SOL
Second faceplant this week.
Tuesday's spike: ~$74.8K, then a dump to $72.7K
Overnight high: ~$74.75K
Now: $73,800
Wall: supply from $74.7K to $75K, where sellers keep waiting
The painful part? Bulls actually won something first.
Yesterday's bounce printed a CHoCH at $74K (the first sign a trend may be flipping) and a BOS at $74.15K (structure confirming higher).
Then the wall slapped it.
Price fell back under both levels within hours. 📉
A breakout that can't hold its own breakout level is a warning, not a win.
But the floor is just as stubborn.
$72.7K, then $73.2K, then $73.35K, then $73.45K.
Higher lows, every single dip.
And price is sitting inside the $73.2K to $73.85K demand zone, where buyers showed up twice already.
So Bitcoin is boxed in: rising floor, flat ceiling.
Something gives soon. 👀
Reclaim $74K on a 4H close → the flip is back on, and the $75K wall gets a third test.
Lose $73.2K → the higher lows break, $72.7K is next, and below that the chart is empty air.
Two rejections at the same level means sellers are camped there. Don't buy the ceiling, and don't short the floor.
Third time through $75K, or does $73.2K crack first?
Not financial advice.
$BTC
$ETH
$SOL
1
473
·
--
Bullish
Verified
💰 Anthropic was eyeing a $2 TRILLION IPO in September. The price tag just landed near $1 trillion. 👀
The AI hangover is real.
Price range: $70 to $78 a share
Value: ~$916B to $1.02T (up to $1.4T fully diluted)
Raise: up to ~$64B
Debut: Nasdaq, ticker ANT, Nov 19
So "can it hold $1T?" isn't a hypothetical anymore. That's the range.
The bull case writes itself.
Revenue: $33.2B in the first nine months of 2026, up from $2.5B a year earlier.
Growth like that at this size is almost unheard of.
And the last mega debut, SpaceX, popped 19% on day one in June. 🚀
The bear case is just as loud.
About $900B in compute and infrastructure commitments, $70B of it due within a year.
Founders keep 50.1% of the vote, so new shareholders get little say.
Some big investors already say the price may need to slide toward $1T after the AI selloff.
Crypto traders, careful with the pre-IPO perps.
SpaceX perps traded about 15% above its final IPO price, and venues warned the real price could land 25% away from perp levels.
Leverage on a number that doesn't exist yet is a coin flip with fees.
Pricing on Nov 18 is the tell.
Top of the range or above → demand is real, $1T holds.
Below the range → AI just got a new, lower benchmark.
Trillion-dollar debut, or a reality check for AI?
#AnthropicIPO
Not financial advice.
$ANTHROPIC
{future}(ANTHROPICUSDT)
$SPCX
{future}(SPCXUSDT)
$TSLA
{future}(TSLAUSDT)
💰 Anthropic was eyeing a $2 TRILLION IPO in September. The price tag just landed near $1 trillion. 👀
The AI hangover is real.
Price range: $70 to $78 a share
Value: ~$916B to $1.02T (up to $1.4T fully diluted)
Raise: up to ~$64B
Debut: Nasdaq, ticker ANT, Nov 19
So "can it hold $1T?" isn't a hypothetical anymore. That's the range.
The bull case writes itself.
Revenue: $33.2B in the first nine months of 2026, up from $2.5B a year earlier.
Growth like that at this size is almost unheard of.
And the last mega debut, SpaceX, popped 19% on day one in June. 🚀
The bear case is just as loud.
About $900B in compute and infrastructure commitments, $70B of it due within a year.
Founders keep 50.1% of the vote, so new shareholders get little say.
Some big investors already say the price may need to slide toward $1T after the AI selloff.
Crypto traders, careful with the pre-IPO perps.
SpaceX perps traded about 15% above its final IPO price, and venues warned the real price could land 25% away from perp levels.
Leverage on a number that doesn't exist yet is a coin flip with fees.
Pricing on Nov 18 is the tell.
Top of the range or above → demand is real, $1T holds.
Below the range → AI just got a new, lower benchmark.
Trillion-dollar debut, or a reality check for AI?
#AnthropicIPO
Not financial advice.
$ANTHROPIC
$SPCX
$TSLA
The AI hangover is real.
Price range: $70 to $78 a share
Value: ~$916B to $1.02T (up to $1.4T fully diluted)
Raise: up to ~$64B
Debut: Nasdaq, ticker ANT, Nov 19
So "can it hold $1T?" isn't a hypothetical anymore. That's the range.
The bull case writes itself.
Revenue: $33.2B in the first nine months of 2026, up from $2.5B a year earlier.
Growth like that at this size is almost unheard of.
And the last mega debut, SpaceX, popped 19% on day one in June. 🚀
The bear case is just as loud.
About $900B in compute and infrastructure commitments, $70B of it due within a year.
Founders keep 50.1% of the vote, so new shareholders get little say.
Some big investors already say the price may need to slide toward $1T after the AI selloff.
Crypto traders, careful with the pre-IPO perps.
SpaceX perps traded about 15% above its final IPO price, and venues warned the real price could land 25% away from perp levels.
Leverage on a number that doesn't exist yet is a coin flip with fees.
Pricing on Nov 18 is the tell.
Top of the range or above → demand is real, $1T holds.
Below the range → AI just got a new, lower benchmark.
Trillion-dollar debut, or a reality check for AI?
#AnthropicIPO
Not financial advice.
$ANTHROPIC
$SPCX
$TSLA

2
908
·
--
Bearish
Verified
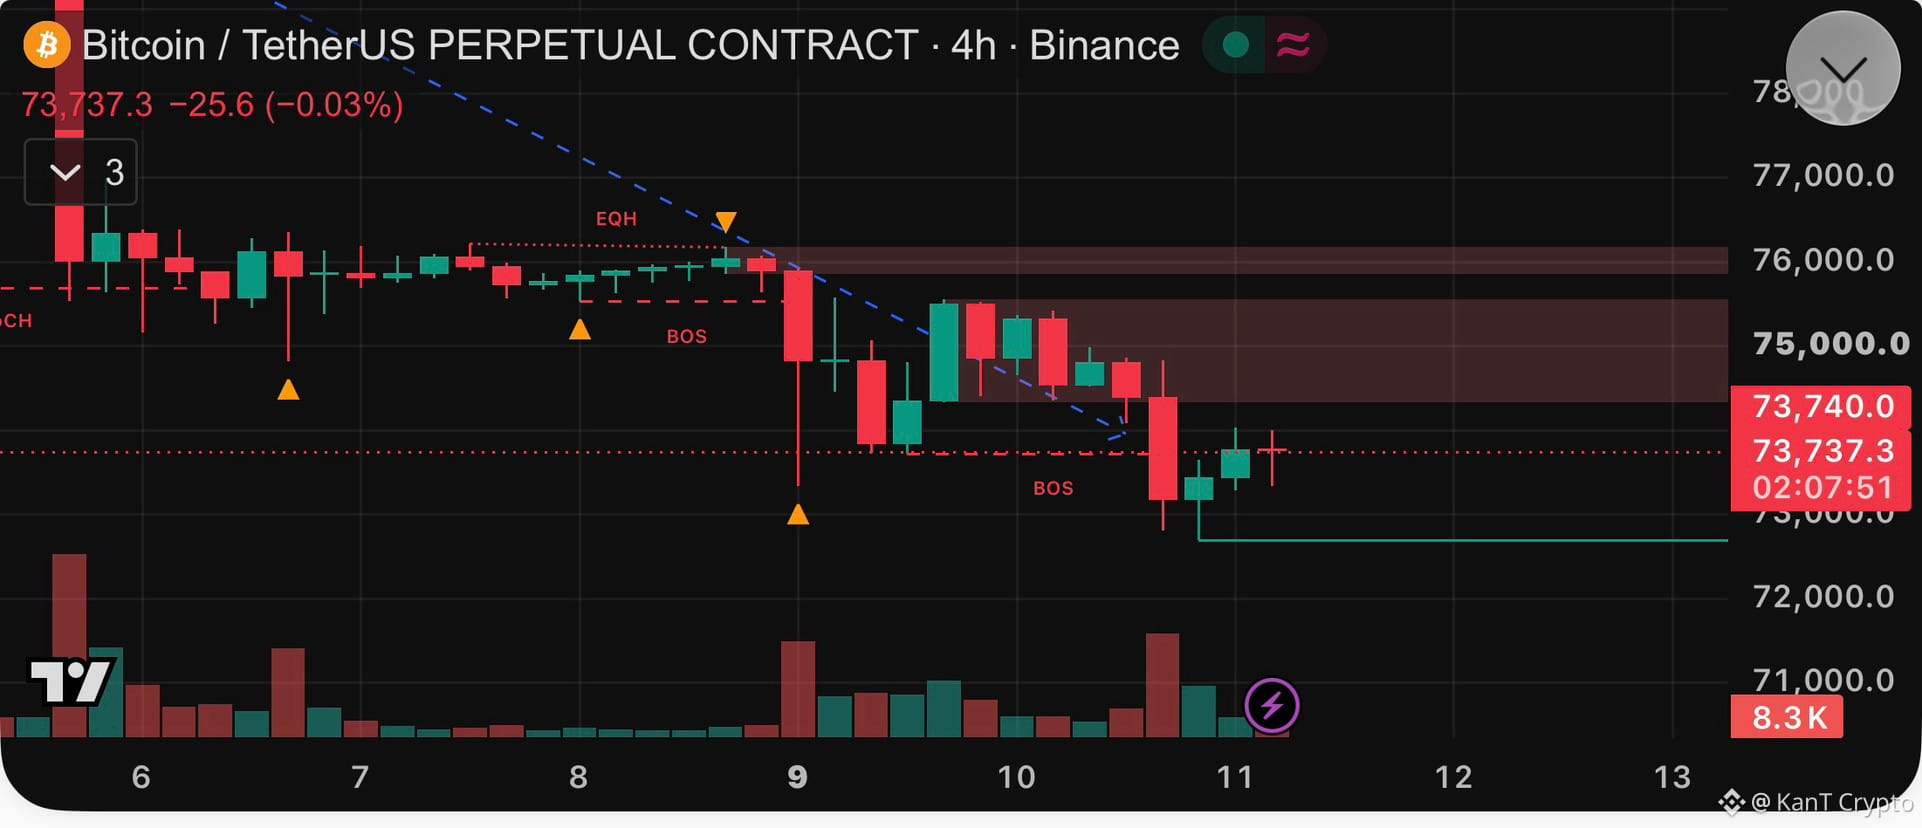
🩸 Bitcoin spent two days knocking on $76K. Hot CPI answered and shoved it down to $72.7K.
Not even close.
Attempt high: $75.5K
Low after CPI: ~$72.7K
Now: $73,737
Crypto longs liquidated: $511M in 24h 💥
One 4H candle flipped the script.
October CPI rose 0.4%, above forecasts.
December hike odds jumped to 85% from 77%.
The CPI candle dumped about $1,200 on volume bigger than Sunday's crash bar.
The chart had flagged it.
Yesterday's map: lose $74.66K and $73.7K, then $73.3K, come back.
Both went. Then it overshot to $72.7K.
Now the ugly part.
The rising lows are gone.
The breakout above the downtrend line failed.
A fresh BOS (break of structure, the trend printing a new low) sits at $73.7K.
And price is parked right under it.
Old floor, new ceiling. 👀
The bounce off $72.7K is running on shrinking volume.
Reclaim $74.3K on a 4H close → bulls are back inside the range, $75.5K next.
Rejected at $73.7K → another run at $72.7K, and nothing on the chart holds until $72K.
Buying the first green candle under a fresh BOS is exactly how the last two flushes found their fuel.
Retest and reclaim, or $72K next?
Not financial advice.
$BTC
{future}(BTCUSDT)
$ETH
{future}(ETHUSDT)
$SOL
{future}(SOLUSDT)
🩸 Bitcoin spent two days knocking on $76K. Hot CPI answered and shoved it down to $72.7K.
Not even close.
Attempt high: $75.5K
Low after CPI: ~$72.7K
Now: $73,737
Crypto longs liquidated: $511M in 24h 💥
One 4H candle flipped the script.
October CPI rose 0.4%, above forecasts.
December hike odds jumped to 85% from 77%.
The CPI candle dumped about $1,200 on volume bigger than Sunday's crash bar.
The chart had flagged it.
Yesterday's map: lose $74.66K and $73.7K, then $73.3K, come back.
Both went. Then it overshot to $72.7K.
Now the ugly part.
The rising lows are gone.
The breakout above the downtrend line failed.
A fresh BOS (break of structure, the trend printing a new low) sits at $73.7K.
And price is parked right under it.
Old floor, new ceiling. 👀
The bounce off $72.7K is running on shrinking volume.
Reclaim $74.3K on a 4H close → bulls are back inside the range, $75.5K next.
Rejected at $73.7K → another run at $72.7K, and nothing on the chart holds until $72K.
Buying the first green candle under a fresh BOS is exactly how the last two flushes found their fuel.
Retest and reclaim, or $72K next?
Not financial advice.
$BTC
$ETH
$SOL
Not even close.
Attempt high: $75.5K
Low after CPI: ~$72.7K
Now: $73,737
Crypto longs liquidated: $511M in 24h 💥
One 4H candle flipped the script.
October CPI rose 0.4%, above forecasts.
December hike odds jumped to 85% from 77%.
The CPI candle dumped about $1,200 on volume bigger than Sunday's crash bar.
The chart had flagged it.
Yesterday's map: lose $74.66K and $73.7K, then $73.3K, come back.
Both went. Then it overshot to $72.7K.
Now the ugly part.
The rising lows are gone.
The breakout above the downtrend line failed.
A fresh BOS (break of structure, the trend printing a new low) sits at $73.7K.
And price is parked right under it.
Old floor, new ceiling. 👀
The bounce off $72.7K is running on shrinking volume.
Reclaim $74.3K on a 4H close → bulls are back inside the range, $75.5K next.
Rejected at $73.7K → another run at $72.7K, and nothing on the chart holds until $72K.
Buying the first green candle under a fresh BOS is exactly how the last two flushes found their fuel.
Retest and reclaim, or $72K next?
Not financial advice.
$BTC
$ETH
$SOL
1
235
·
--
Bullish
JUST IN: 🇺🇸🇮🇷 Treasury Secretary Scott Bessent forced to relocate to US military base following threats against his life from Iran.
$BTC
{future}(BTCUSDT)
$CL
{future}(CLUSDT)
$BZ
{future}(BZUSDT)
JUST IN: 🇺🇸🇮🇷 Treasury Secretary Scott Bessent forced to relocate to US military base following threats against his life from Iran.
$BTC
$CL
$BZ
$BTC
$CL
$BZ


3
560
·
--
Bearish
💥BREAKING:
🇺🇸 US CPI data came in at 0.4% MOM
Expectations: 0.3%
$BTC
{future}(BTCUSDT)
$NVDA
$ETH
{future}(NVDAUSDT)
{future}(ETHUSDT)
💥BREAKING:
🇺🇸 US CPI data came in at 0.4% MOM
Expectations: 0.3%
$BTC
$NVDA
$ETH
🇺🇸 US CPI data came in at 0.4% MOM
Expectations: 0.3%
$BTC
$NVDA
$ETH

1
139
·
--
Bullish
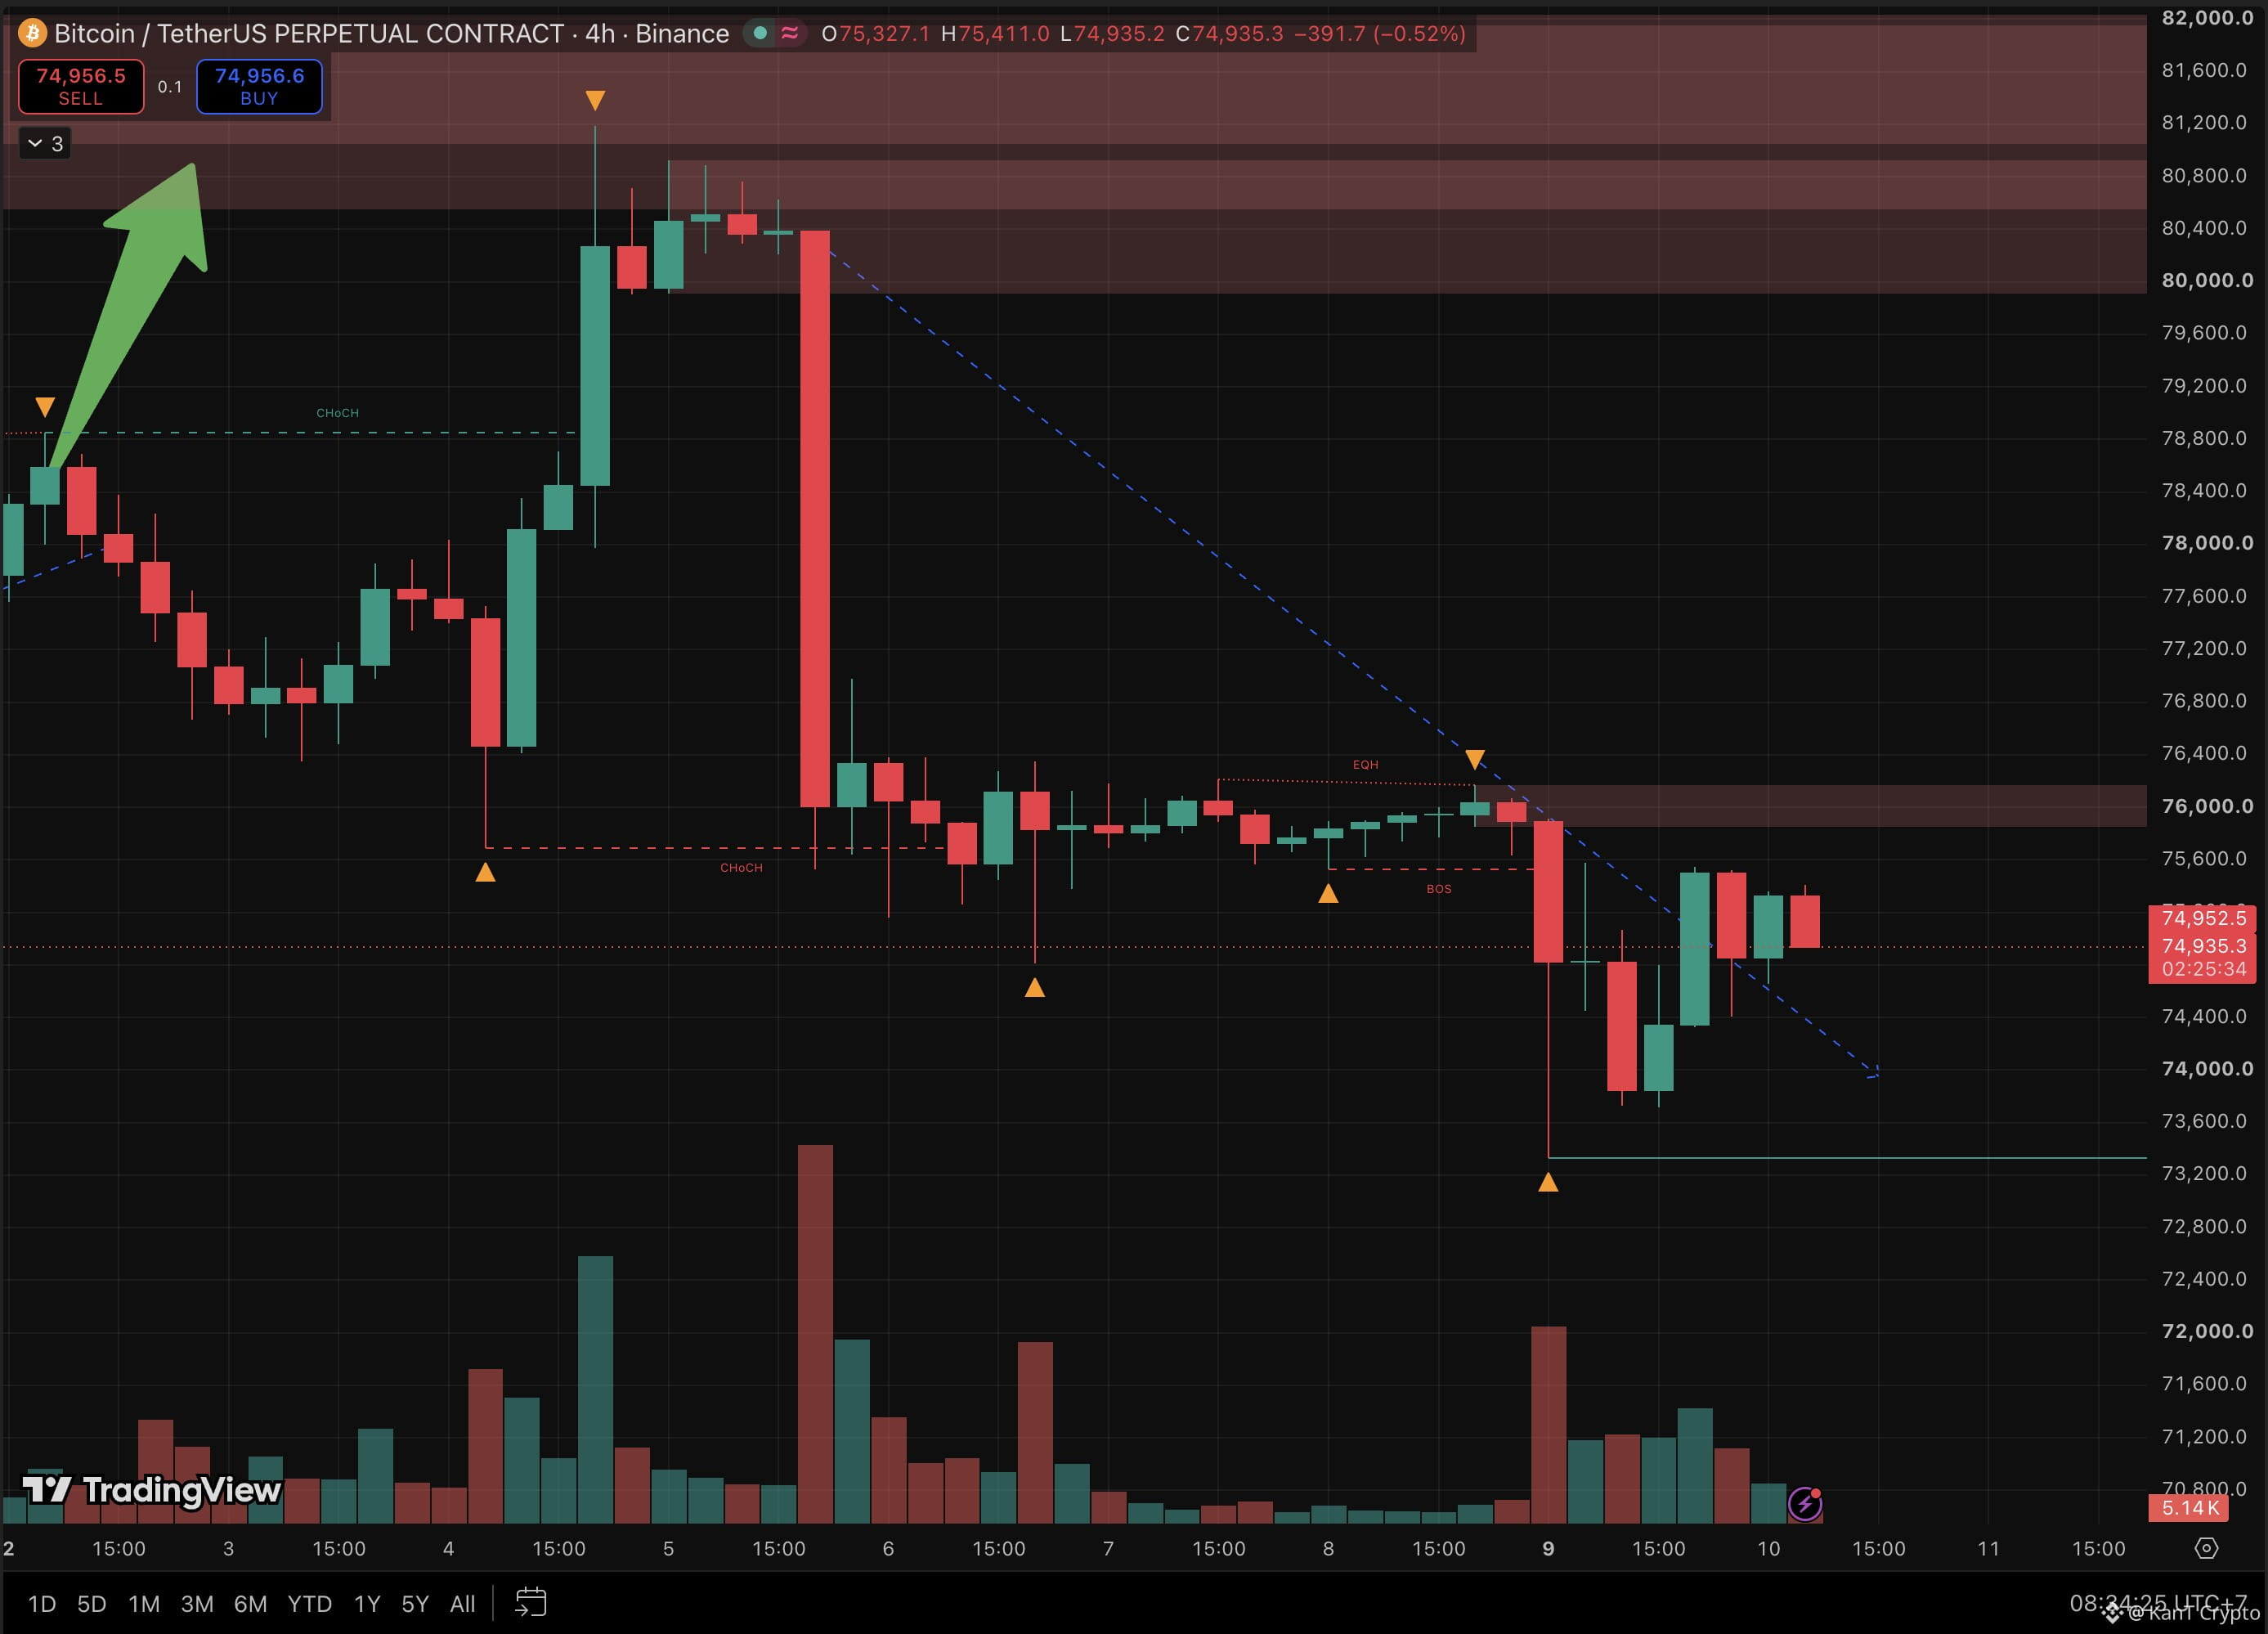
🎯 $76K isn’t just a round number. It’s the line that FLIPS Bitcoin’s 4H trend. 👀
Problem is, Bitcoin can’t even get past $75.5K yet.
Now: $74,935
Crash low: $73.3K
Higher lows since: $73.7K, $74.4K, $74.66K
Ceiling: $75.5K, tested three times on the 4H
The bounce has real structure. The retest of Sunday’s low held $400 higher, and every dip since has bottomed above the last. Monday’s push also closed above the downtrend line from Thursday’s plunge off $80.4K, and it has held on every close since.
But that ceiling is Sunday’s breakdown level, and no 4H candle has closed back above it. It also sits under a stack: last week’s $75.7K CHoCH (the break that flipped the trend down), supply (where sellers wait) from $75.85K to $76.15K, then equal highs at $76.2K, a flat top where stop orders pile up. The last push came on a third of Monday’s volume.
That’s why $76.2K is the real test. A 4H close above it clears the stack, runs those stops and breaks the last lower high, a CHoCH back to bullish.
What to watch:
4H close above $76.2K → trend flips up, $78.85K is the next marked level.
4H close below $74.66K → the rising lows break, $73.7K then $73.3K come back.
First pokes through a stack like this fail all the time. Trust the 4H close, not the wick.
Breakout through $76.2K, or another lap down to $73.7K?
Not financial advice.
$BTC
{future}(BTCUSDT)
$SOL
{future}(SOLUSDT)
$ETH
{future}(ETHUSDT)
🎯 $76K isn’t just a round number. It’s the line that FLIPS Bitcoin’s 4H trend. 👀
Problem is, Bitcoin can’t even get past $75.5K yet.
Now: $74,935
Crash low: $73.3K
Higher lows since: $73.7K, $74.4K, $74.66K
Ceiling: $75.5K, tested three times on the 4H
The bounce has real structure. The retest of Sunday’s low held $400 higher, and every dip since has bottomed above the last. Monday’s push also closed above the downtrend line from Thursday’s plunge off $80.4K, and it has held on every close since.
But that ceiling is Sunday’s breakdown level, and no 4H candle has closed back above it. It also sits under a stack: last week’s $75.7K CHoCH (the break that flipped the trend down), supply (where sellers wait) from $75.85K to $76.15K, then equal highs at $76.2K, a flat top where stop orders pile up. The last push came on a third of Monday’s volume.
That’s why $76.2K is the real test. A 4H close above it clears the stack, runs those stops and breaks the last lower high, a CHoCH back to bullish.
What to watch:
4H close above $76.2K → trend flips up, $78.85K is the next marked level.
4H close below $74.66K → the rising lows break, $73.7K then $73.3K come back.
First pokes through a stack like this fail all the time. Trust the 4H close, not the wick.
Breakout through $76.2K, or another lap down to $73.7K?
Not financial advice.
$BTC
$SOL
$ETH
Problem is, Bitcoin can’t even get past $75.5K yet.
Now: $74,935
Crash low: $73.3K
Higher lows since: $73.7K, $74.4K, $74.66K
Ceiling: $75.5K, tested three times on the 4H
The bounce has real structure. The retest of Sunday’s low held $400 higher, and every dip since has bottomed above the last. Monday’s push also closed above the downtrend line from Thursday’s plunge off $80.4K, and it has held on every close since.
But that ceiling is Sunday’s breakdown level, and no 4H candle has closed back above it. It also sits under a stack: last week’s $75.7K CHoCH (the break that flipped the trend down), supply (where sellers wait) from $75.85K to $76.15K, then equal highs at $76.2K, a flat top where stop orders pile up. The last push came on a third of Monday’s volume.
That’s why $76.2K is the real test. A 4H close above it clears the stack, runs those stops and breaks the last lower high, a CHoCH back to bullish.
What to watch:
4H close above $76.2K → trend flips up, $78.85K is the next marked level.
4H close below $74.66K → the rising lows break, $73.7K then $73.3K come back.
First pokes through a stack like this fail all the time. Trust the 4H close, not the wick.
Breakout through $76.2K, or another lap down to $73.7K?
Not financial advice.
$BTC
$SOL
$ETH
3
525
·
--
Bullish
🚨INSANE REVERSAL
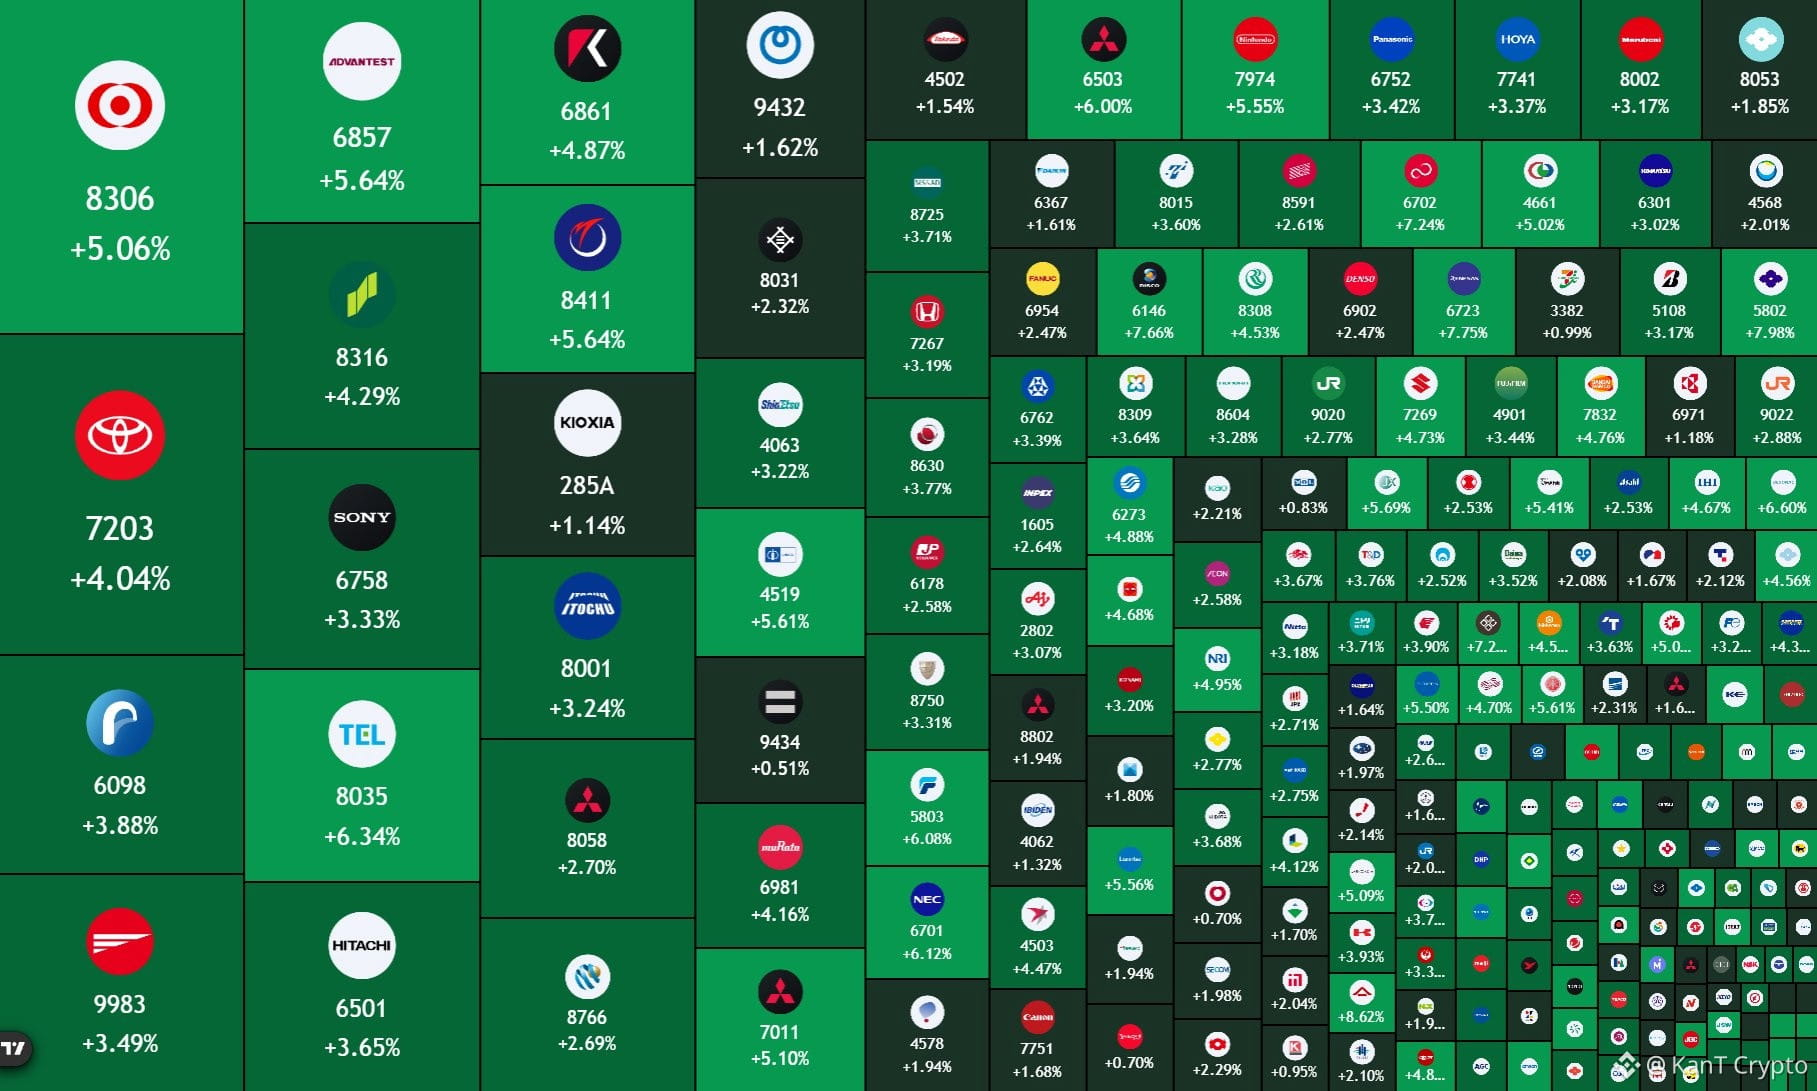
¥41,212,500,000,000 ($262B) added to Japanese stocks today following Friday's historic sell-off.
$BTC
{future}(BTCUSDT)
$NVDA
{future}(NVDAUSDT)
$ETH
{future}(ETHUSDT)
🚨INSANE REVERSAL
¥41,212,500,000,000 ($262B) added to Japanese stocks today following Friday's historic sell-off.
$BTC
$NVDA
$ETH
¥41,212,500,000,000 ($262B) added to Japanese stocks today following Friday's historic sell-off.
$BTC
$NVDA
$ETH
1
444
·
--
Bullish
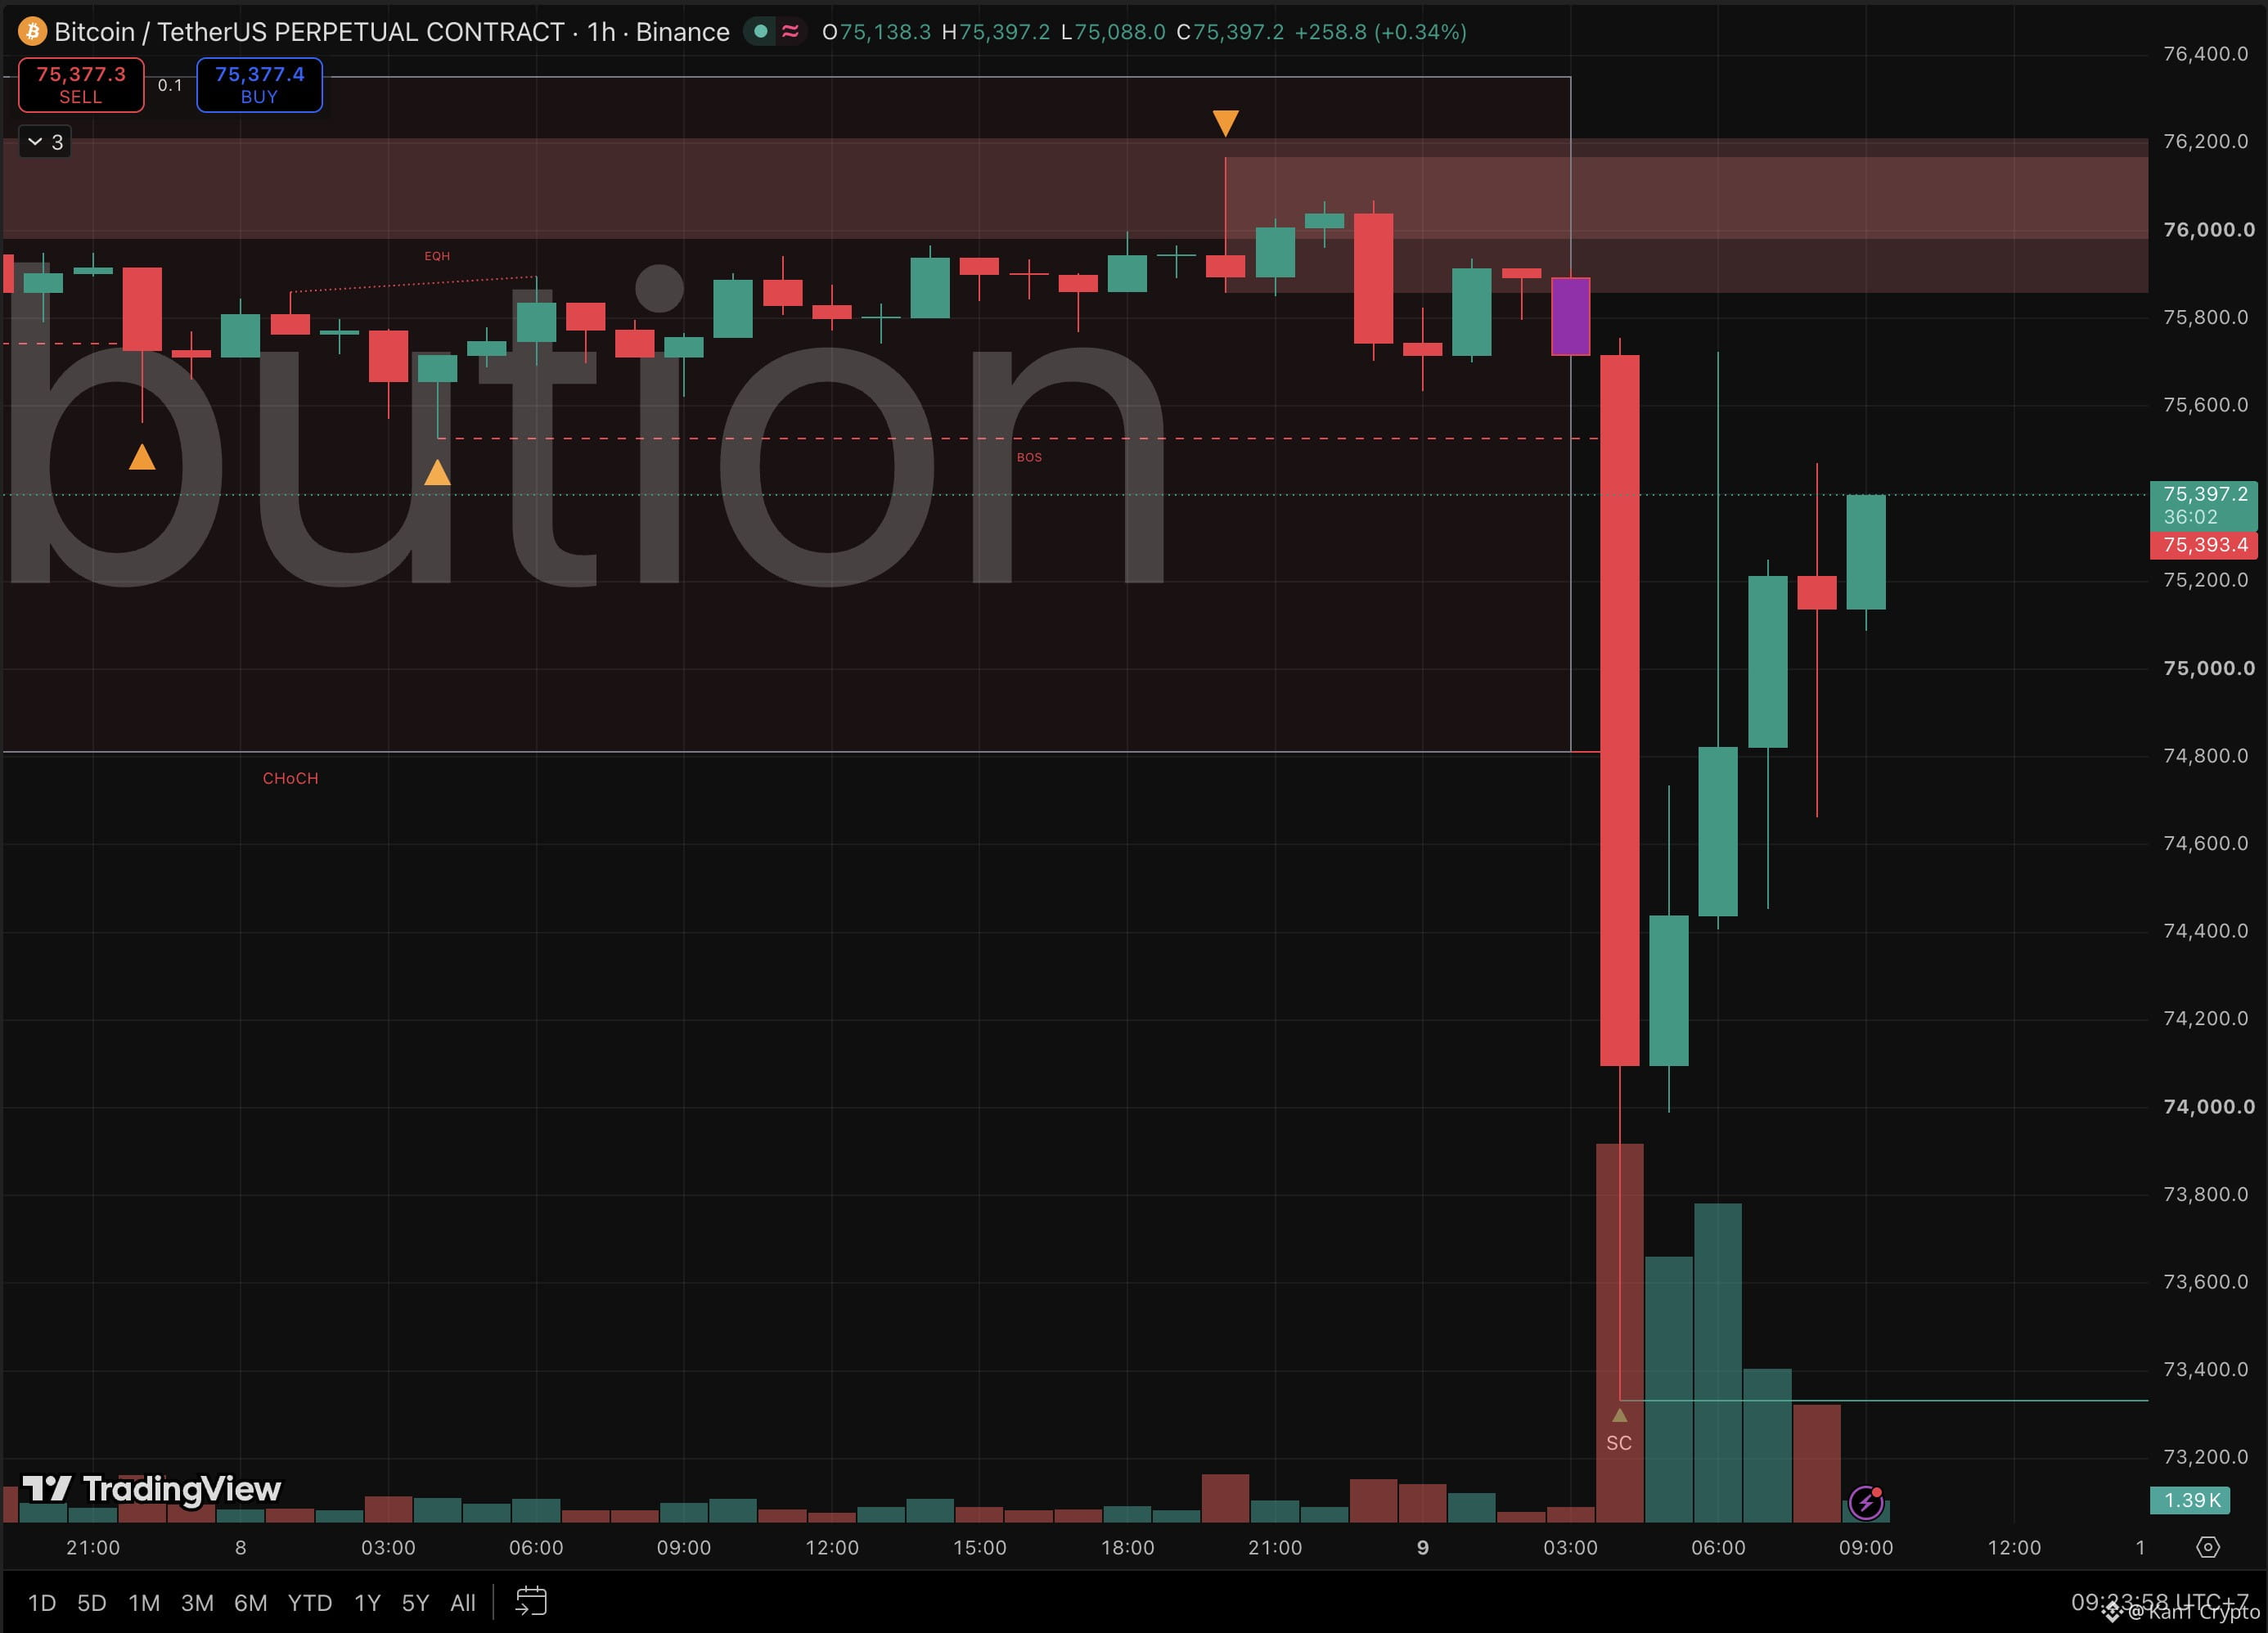
⚡ Bitcoin dropped $2,400 in ONE hour, then clawed back 87% of it. Bottom, or bait? 👀
On Sunday it was the only big market open, so it took the hit alone.
Drop: ~$75.7K to ~$73.3K
Crypto longs wiped: $700M+ in about 20 minutes
Low: a hair above the 200-day average (~$73.2K)
Now: $75,397
The flush hit within an hour of Nvidia’s board announcing an investigation into CEO Jensen Huang. No one has confirmed a link. But when US futures reopened two hours later, Nasdaq futures dipped only about 0.2%, and Bitcoin briefly erased the whole drop.
Friday’s map said losing $75K opens the 200-day near $73.2K. The wick stopped about $150 above it, a selling climax (panic selling that exhausts sellers) on a huge volume spike.
Now the bounce is back at the old floor. $75.5K held all weekend, and supply sits right above at $75.85K to $76.2K. Either a base is starting here, or this is a last point of supply (a relief rally sellers use to reload).
What to watch:
4H close above $76.2K → the breakdown was a shakeout, $77K then $78.85K next.
Rejection here and a loss of $74.8K → the $73.3K low and the 200-day get retested.
Tuesday’s CPI is the last inflation print before the Fed’s December call, with hike odds near 77% and $1.28B pulled from spot ETFs last week. Thin Sunday liquidity just moved price 3% in under an hour. Size for that.
Base at the 200-day, or a bounce built for sellers?
Not financial advice.
$BTC
{future}(BTCUSDT)
$NVDA
{future}(NVDAUSDT)
$ETH
{future}(ETHUSDT)
⚡ Bitcoin dropped $2,400 in ONE hour, then clawed back 87% of it. Bottom, or bait? 👀
On Sunday it was the only big market open, so it took the hit alone.
Drop: ~$75.7K to ~$73.3K
Crypto longs wiped: $700M+ in about 20 minutes
Low: a hair above the 200-day average (~$73.2K)
Now: $75,397
The flush hit within an hour of Nvidia’s board announcing an investigation into CEO Jensen Huang. No one has confirmed a link. But when US futures reopened two hours later, Nasdaq futures dipped only about 0.2%, and Bitcoin briefly erased the whole drop.
Friday’s map said losing $75K opens the 200-day near $73.2K. The wick stopped about $150 above it, a selling climax (panic selling that exhausts sellers) on a huge volume spike.
Now the bounce is back at the old floor. $75.5K held all weekend, and supply sits right above at $75.85K to $76.2K. Either a base is starting here, or this is a last point of supply (a relief rally sellers use to reload).
What to watch:
4H close above $76.2K → the breakdown was a shakeout, $77K then $78.85K next.
Rejection here and a loss of $74.8K → the $73.3K low and the 200-day get retested.
Tuesday’s CPI is the last inflation print before the Fed’s December call, with hike odds near 77% and $1.28B pulled from spot ETFs last week. Thin Sunday liquidity just moved price 3% in under an hour. Size for that.
Base at the 200-day, or a bounce built for sellers?
Not financial advice.
$BTC
$NVDA
$ETH
On Sunday it was the only big market open, so it took the hit alone.
Drop: ~$75.7K to ~$73.3K
Crypto longs wiped: $700M+ in about 20 minutes
Low: a hair above the 200-day average (~$73.2K)
Now: $75,397
The flush hit within an hour of Nvidia’s board announcing an investigation into CEO Jensen Huang. No one has confirmed a link. But when US futures reopened two hours later, Nasdaq futures dipped only about 0.2%, and Bitcoin briefly erased the whole drop.
Friday’s map said losing $75K opens the 200-day near $73.2K. The wick stopped about $150 above it, a selling climax (panic selling that exhausts sellers) on a huge volume spike.
Now the bounce is back at the old floor. $75.5K held all weekend, and supply sits right above at $75.85K to $76.2K. Either a base is starting here, or this is a last point of supply (a relief rally sellers use to reload).
What to watch:
4H close above $76.2K → the breakdown was a shakeout, $77K then $78.85K next.
Rejection here and a loss of $74.8K → the $73.3K low and the 200-day get retested.
Tuesday’s CPI is the last inflation print before the Fed’s December call, with hike odds near 77% and $1.28B pulled from spot ETFs last week. Thin Sunday liquidity just moved price 3% in under an hour. Size for that.
Base at the 200-day, or a bounce built for sellers?
Not financial advice.
$BTC
$NVDA
$ETH
1
493
·
--
Bearish
🚨 INSANE REVERSAL
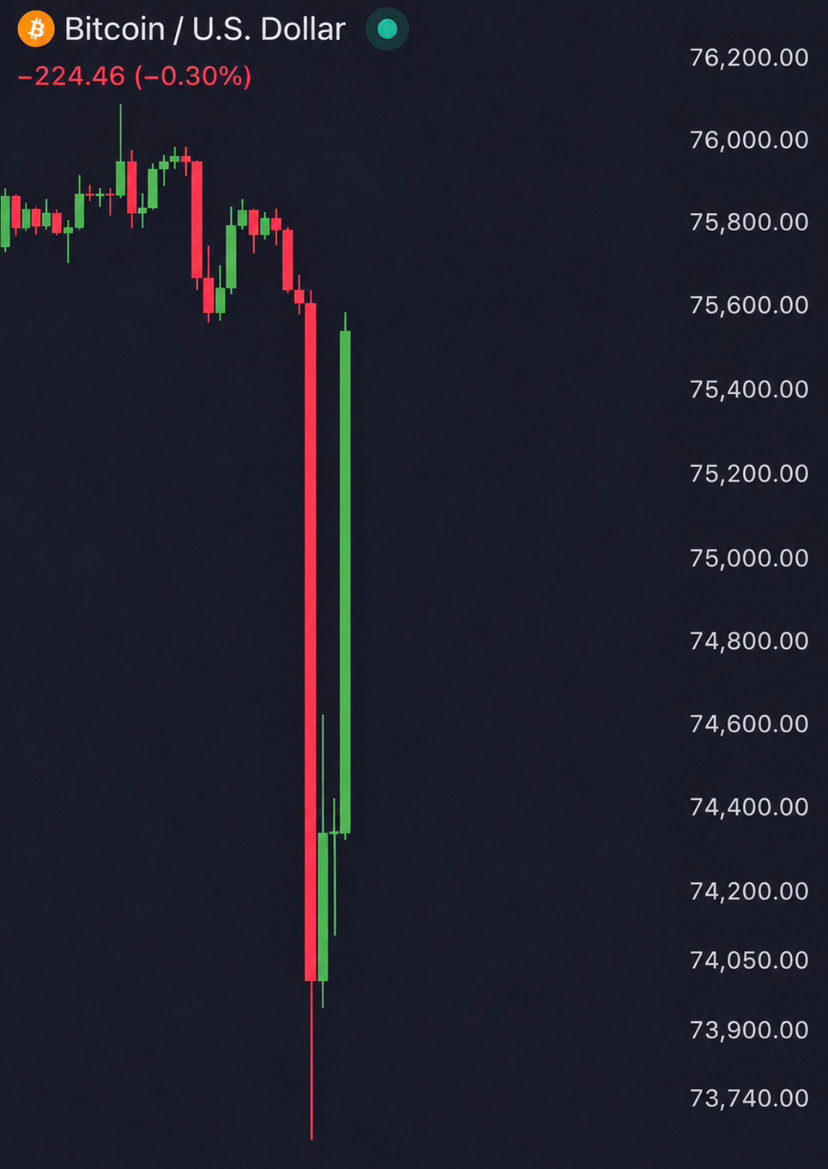
Just 1 hour after dumping $2,000 and liquidating $1 BILLION in 10 minutes, $BTC is back at pre-dump levels.
WHAT IS THIS PRICE ACTION??
{future}(BTCUSDT)
$ETH
{future}(ETHUSDT)
$SOL
{future}(SOLUSDT)
🚨 INSANE REVERSAL
Just 1 hour after dumping $2,000 and liquidating $1 BILLION in 10 minutes, $BTC is back at pre-dump levels.
WHAT IS THIS PRICE ACTION??
$ETH
$SOL
Just 1 hour after dumping $2,000 and liquidating $1 BILLION in 10 minutes, $BTC is back at pre-dump levels.
WHAT IS THIS PRICE ACTION??
$ETH
$SOL
1
334
·
--
Bearish
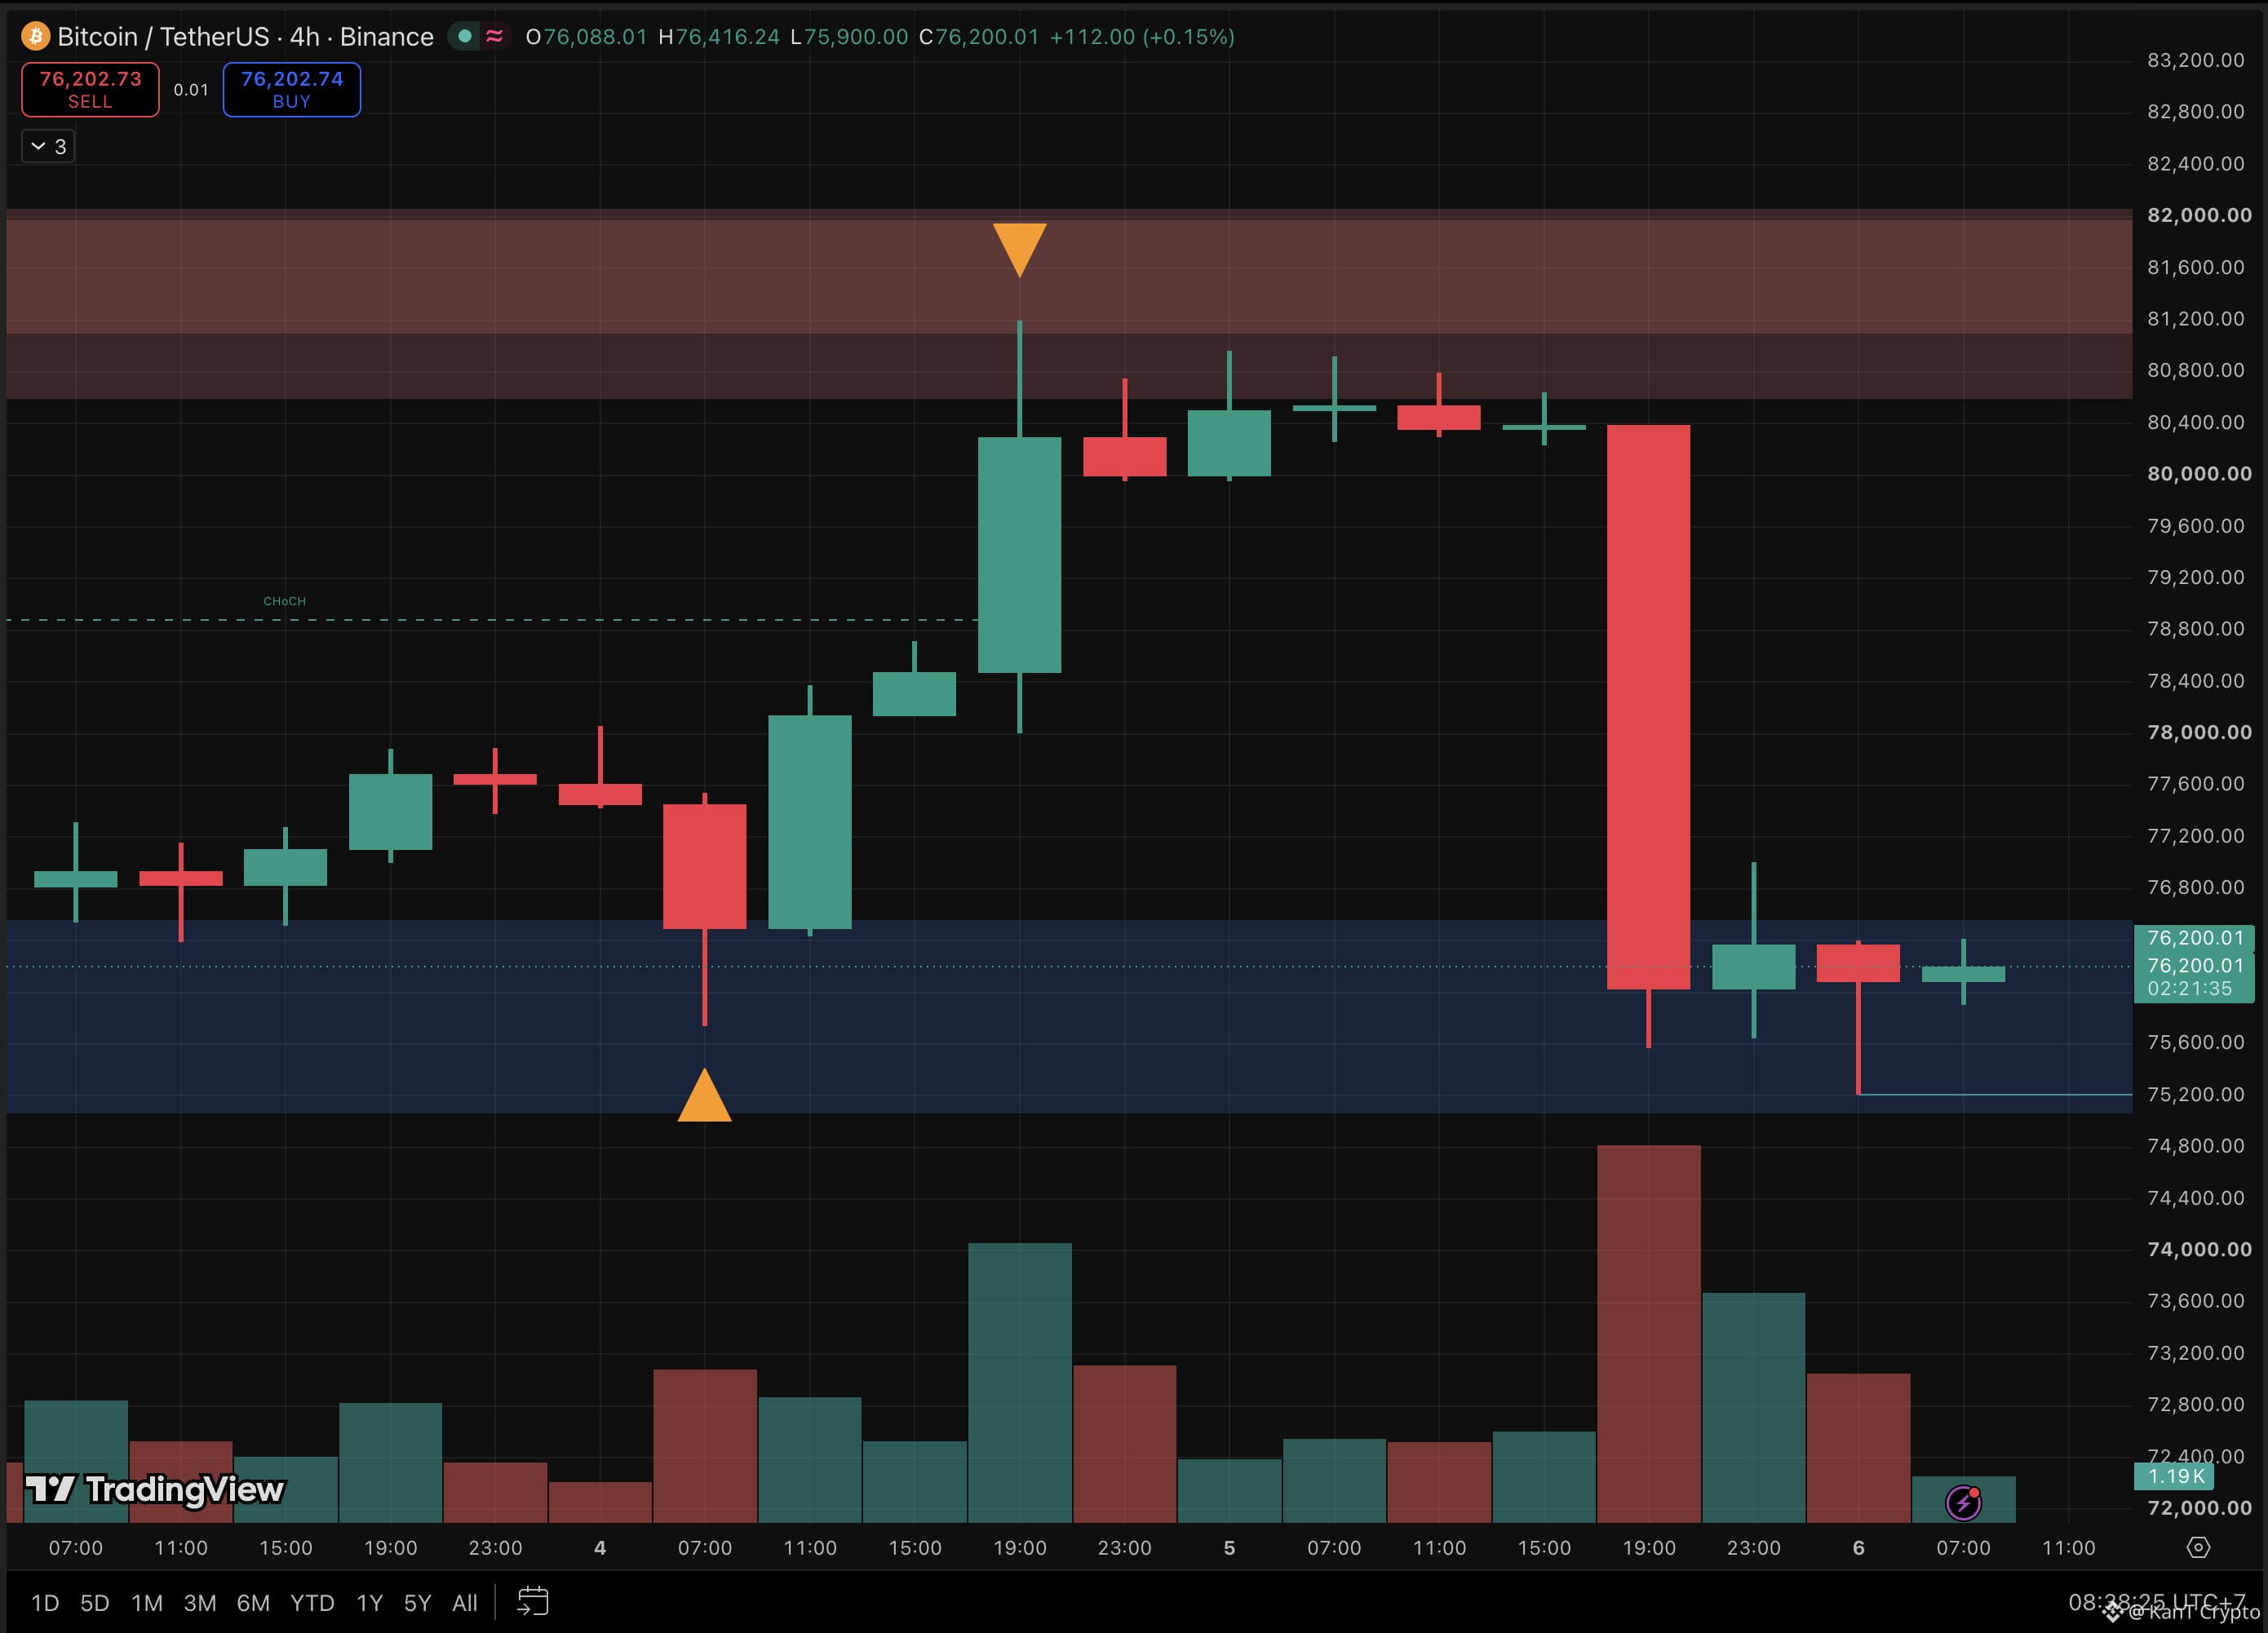
📉 $75.7K. $81.2K. $75.2K. Bitcoin’s 48-hour roller coaster just handed the bill to the bulls.
Wednesday the bears paid. Thursday it was the longs’ turn.
Dump candle: $80.4K to $76K, down 5.4% in 4H
Long liquidations: $954M in 24h, 88% of the total
Nasdaq 100: down 6.4%, worst session since March 2020
Gold, same session: up 0.6%
The midterm result that lifted stocks on Wednesday turned on them Thursday, as investors priced in a slower, pricier AI buildout. Bitcoin sank in the same hours on this chart’s heaviest volume, trading like a tech stock, not digital gold.
Yesterday’s map said lose $78.85K and the CHoCH (first sign of a trend flip) fails. It failed inside one candle, then blew through the $76.4K to $77.1K demand it pointed to. The ETF test flopped too: $74.6M in after $1.16B out.
The new low undercut election night, so the bounce structure is gone. But $75.2K landed inside the $75K to $76.5K demand zone, three candles wicked down and closed back near $76K or better, and open futures bets fell to their lowest since mid-September. Much of the leverage is already out.
What to watch:
4H close above $77K → that wick looks like a spring (a fake breakdown that traps sellers), $78.85K next as resistance.
4H close below $75K → demand breaks, the 200-day near $73.2K opens up.
Today’s US jobs report lands on a shaken market. Two liquidation waves in 48 hours, one each way. Leverage lost both times.
Spring off $75K, or a pause before the 200-day?
Not financial advice.
$BTC
{future}(BTCUSDT)
$ETH
{future}(ETHUSDT)
$NEAR
{future}(NEARUSDT)
📉 $75.7K. $81.2K. $75.2K. Bitcoin’s 48-hour roller coaster just handed the bill to the bulls.
Wednesday the bears paid. Thursday it was the longs’ turn.
Dump candle: $80.4K to $76K, down 5.4% in 4H
Long liquidations: $954M in 24h, 88% of the total
Nasdaq 100: down 6.4%, worst session since March 2020
Gold, same session: up 0.6%
The midterm result that lifted stocks on Wednesday turned on them Thursday, as investors priced in a slower, pricier AI buildout. Bitcoin sank in the same hours on this chart’s heaviest volume, trading like a tech stock, not digital gold.
Yesterday’s map said lose $78.85K and the CHoCH (first sign of a trend flip) fails. It failed inside one candle, then blew through the $76.4K to $77.1K demand it pointed to. The ETF test flopped too: $74.6M in after $1.16B out.
The new low undercut election night, so the bounce structure is gone. But $75.2K landed inside the $75K to $76.5K demand zone, three candles wicked down and closed back near $76K or better, and open futures bets fell to their lowest since mid-September. Much of the leverage is already out.
What to watch:
4H close above $77K → that wick looks like a spring (a fake breakdown that traps sellers), $78.85K next as resistance.
4H close below $75K → demand breaks, the 200-day near $73.2K opens up.
Today’s US jobs report lands on a shaken market. Two liquidation waves in 48 hours, one each way. Leverage lost both times.
Spring off $75K, or a pause before the 200-day?
Not financial advice.
$BTC
$ETH
$NEAR
Wednesday the bears paid. Thursday it was the longs’ turn.
Dump candle: $80.4K to $76K, down 5.4% in 4H
Long liquidations: $954M in 24h, 88% of the total
Nasdaq 100: down 6.4%, worst session since March 2020
Gold, same session: up 0.6%
The midterm result that lifted stocks on Wednesday turned on them Thursday, as investors priced in a slower, pricier AI buildout. Bitcoin sank in the same hours on this chart’s heaviest volume, trading like a tech stock, not digital gold.
Yesterday’s map said lose $78.85K and the CHoCH (first sign of a trend flip) fails. It failed inside one candle, then blew through the $76.4K to $77.1K demand it pointed to. The ETF test flopped too: $74.6M in after $1.16B out.
The new low undercut election night, so the bounce structure is gone. But $75.2K landed inside the $75K to $76.5K demand zone, three candles wicked down and closed back near $76K or better, and open futures bets fell to their lowest since mid-September. Much of the leverage is already out.
What to watch:
4H close above $77K → that wick looks like a spring (a fake breakdown that traps sellers), $78.85K next as resistance.
4H close below $75K → demand breaks, the 200-day near $73.2K opens up.
Today’s US jobs report lands on a shaken market. Two liquidation waves in 48 hours, one each way. Leverage lost both times.
Spring off $75K, or a pause before the 200-day?
Not financial advice.
$BTC
$ETH
$NEAR
2
427
·
--
Bearish
What the actual man
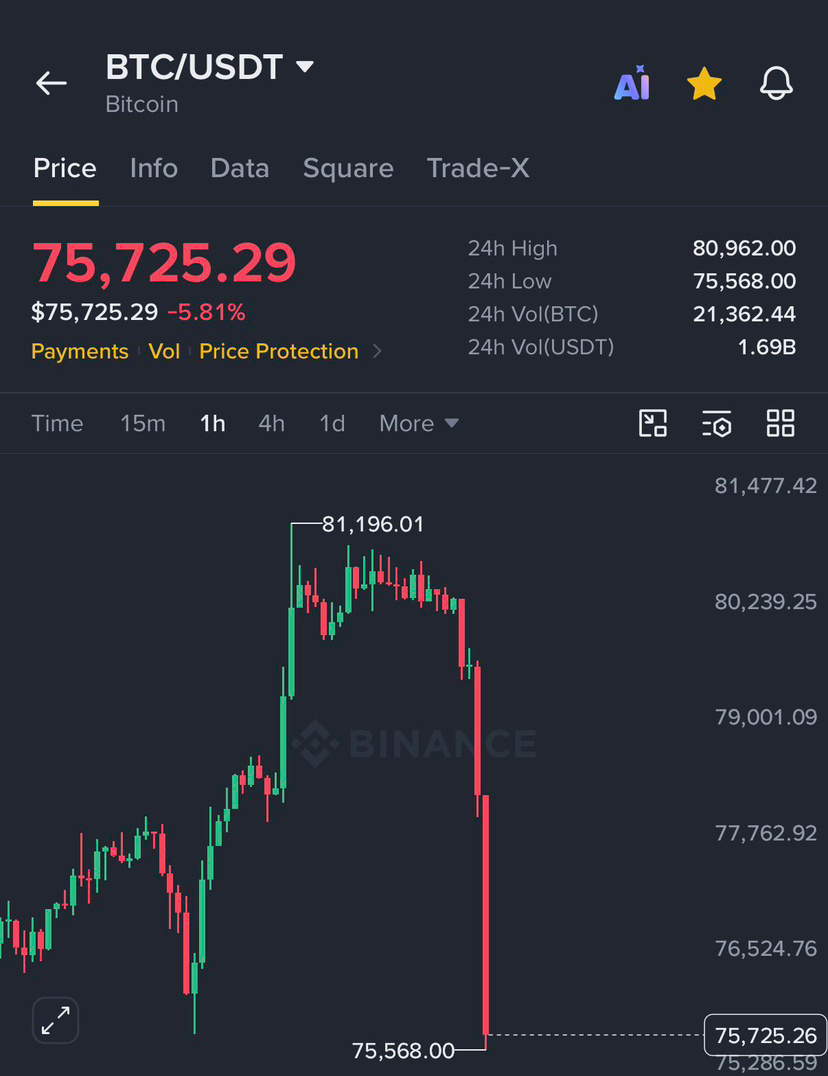
Bitcoin crashed -$5,000 today and dropped to a 45 day low of $75,500 erasing the entire midterm pump.
This is Pure manipulation to liquidate both longs and shorts.
$BTC
{future}(BTCUSDT)
$SOL
{future}(SOLUSDT)
$ETH
{future}(ETHUSDT)
What the actual man
Bitcoin crashed -$5,000 today and dropped to a 45 day low of $75,500 erasing the entire midterm pump.
This is Pure manipulation to liquidate both longs and shorts.
$BTC
$SOL
$ETH
Bitcoin crashed -$5,000 today and dropped to a 45 day low of $75,500 erasing the entire midterm pump.
This is Pure manipulation to liquidate both longs and shorts.
$BTC
$SOL
$ETH
1
48
·
--
Bearish
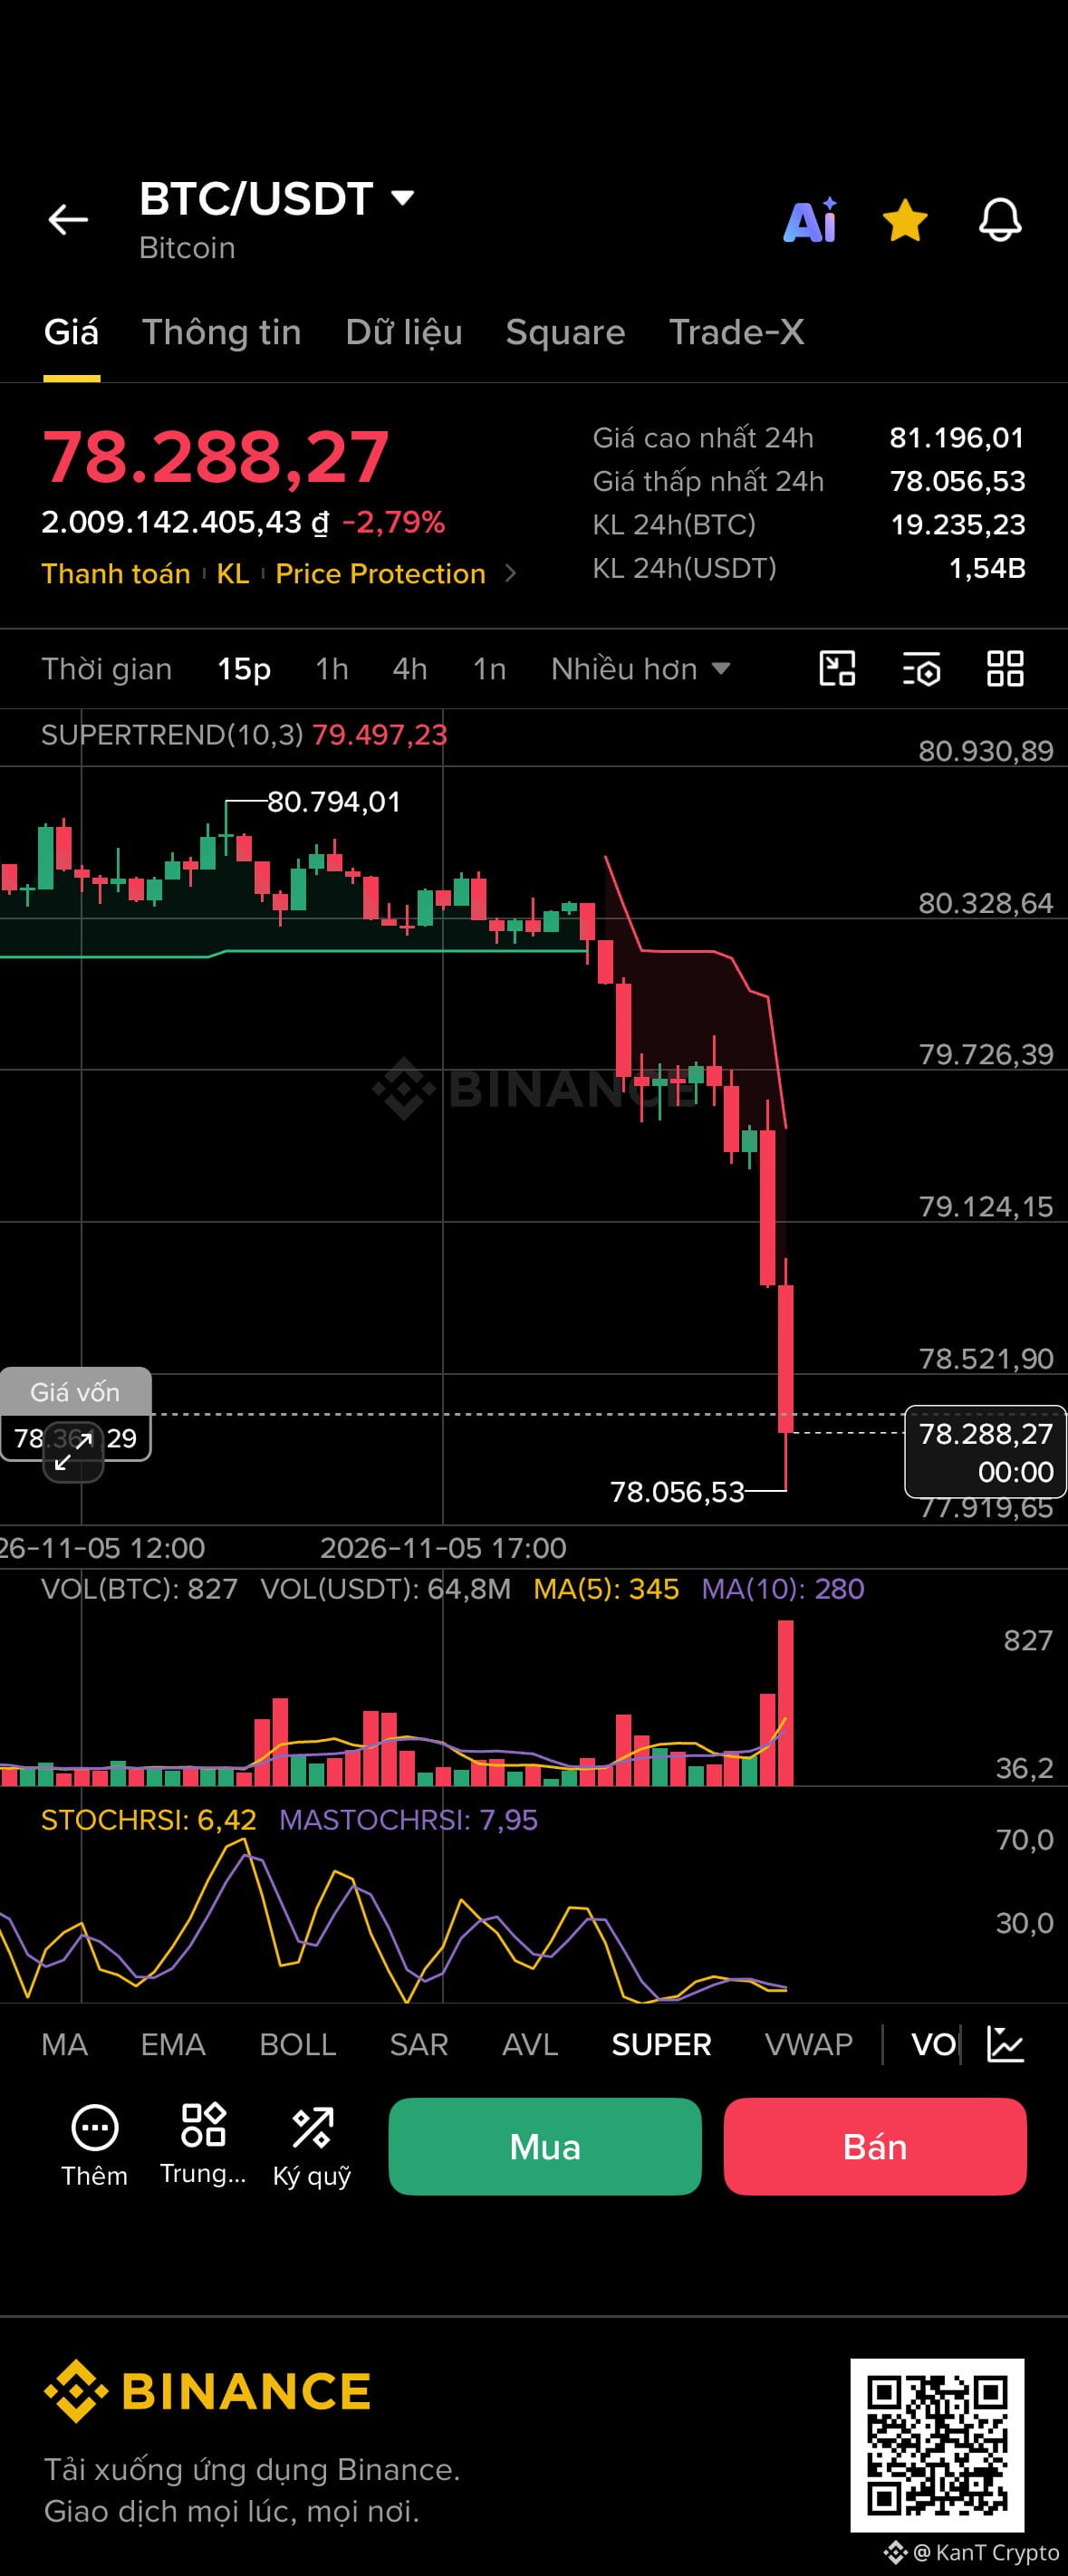
JUST IN: $210,000,000 worth of crypto longs liquidated in the past 30 minutes.
$BTC
{future}(BTCUSDT)
$ETH
{future}(ETHUSDT)
$SOL
{future}(SOLUSDT)
JUST IN: $210,000,000 worth of crypto longs liquidated in the past 30 minutes.
$BTC
$ETH
$SOL
$BTC
$ETH
$SOL
Sourced by user sharing on Binance
1
158
·
--
Bearish
Partly True
🚨 INSANE CRASH
$700 BILLION has been wiped out from the US stock market within just 10 minutes of market open, as the S&P 500 dumps -1%.
$NVDA
{future}(NVDAUSDT)
$AVGO
{future}(AVGOUSDT)
$TSLA
{future}(TSLAUSDT)
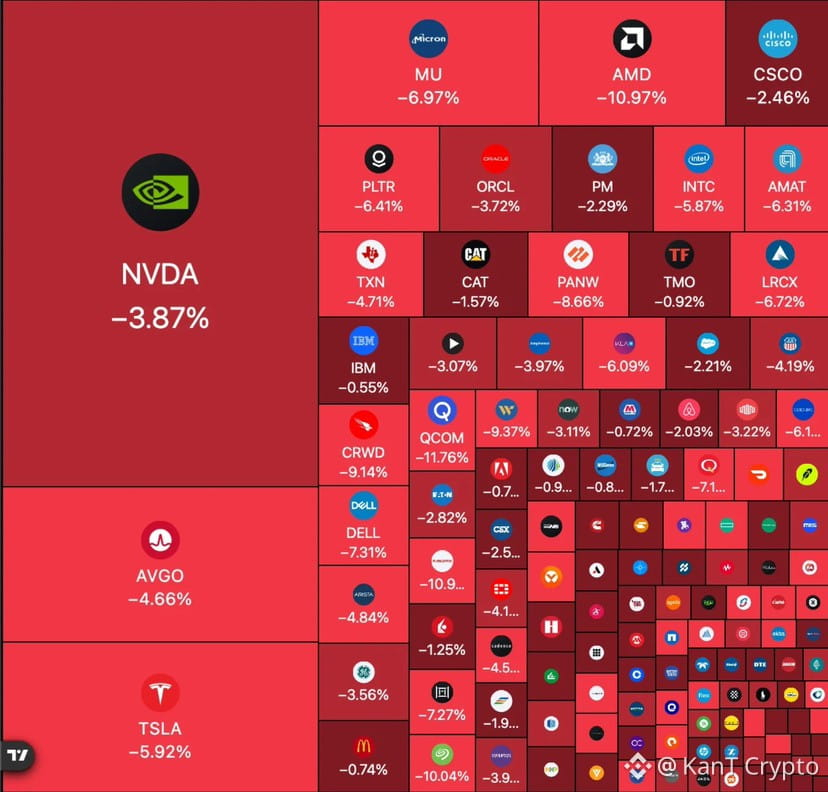
🚨 INSANE CRASH
$700 BILLION has been wiped out from the US stock market within just 10 minutes of market open, as the S&P 500 dumps -1%.
$NVDA
$AVGO
$TSLA
$700 BILLION has been wiped out from the US stock market within just 10 minutes of market open, as the S&P 500 dumps -1%.
$NVDA
$AVGO
$TSLA
1
2
16
20.9k
·
--
Bullish
BREAKING: Samsung Wallet officially launches USDC stablecoin transfers for 82 million Galaxy devices in the US.
$SUI
{future}(SUIUSDT)
$SOL
{future}(SOLUSDT)
$USDC
{future}(USDCUSDT)
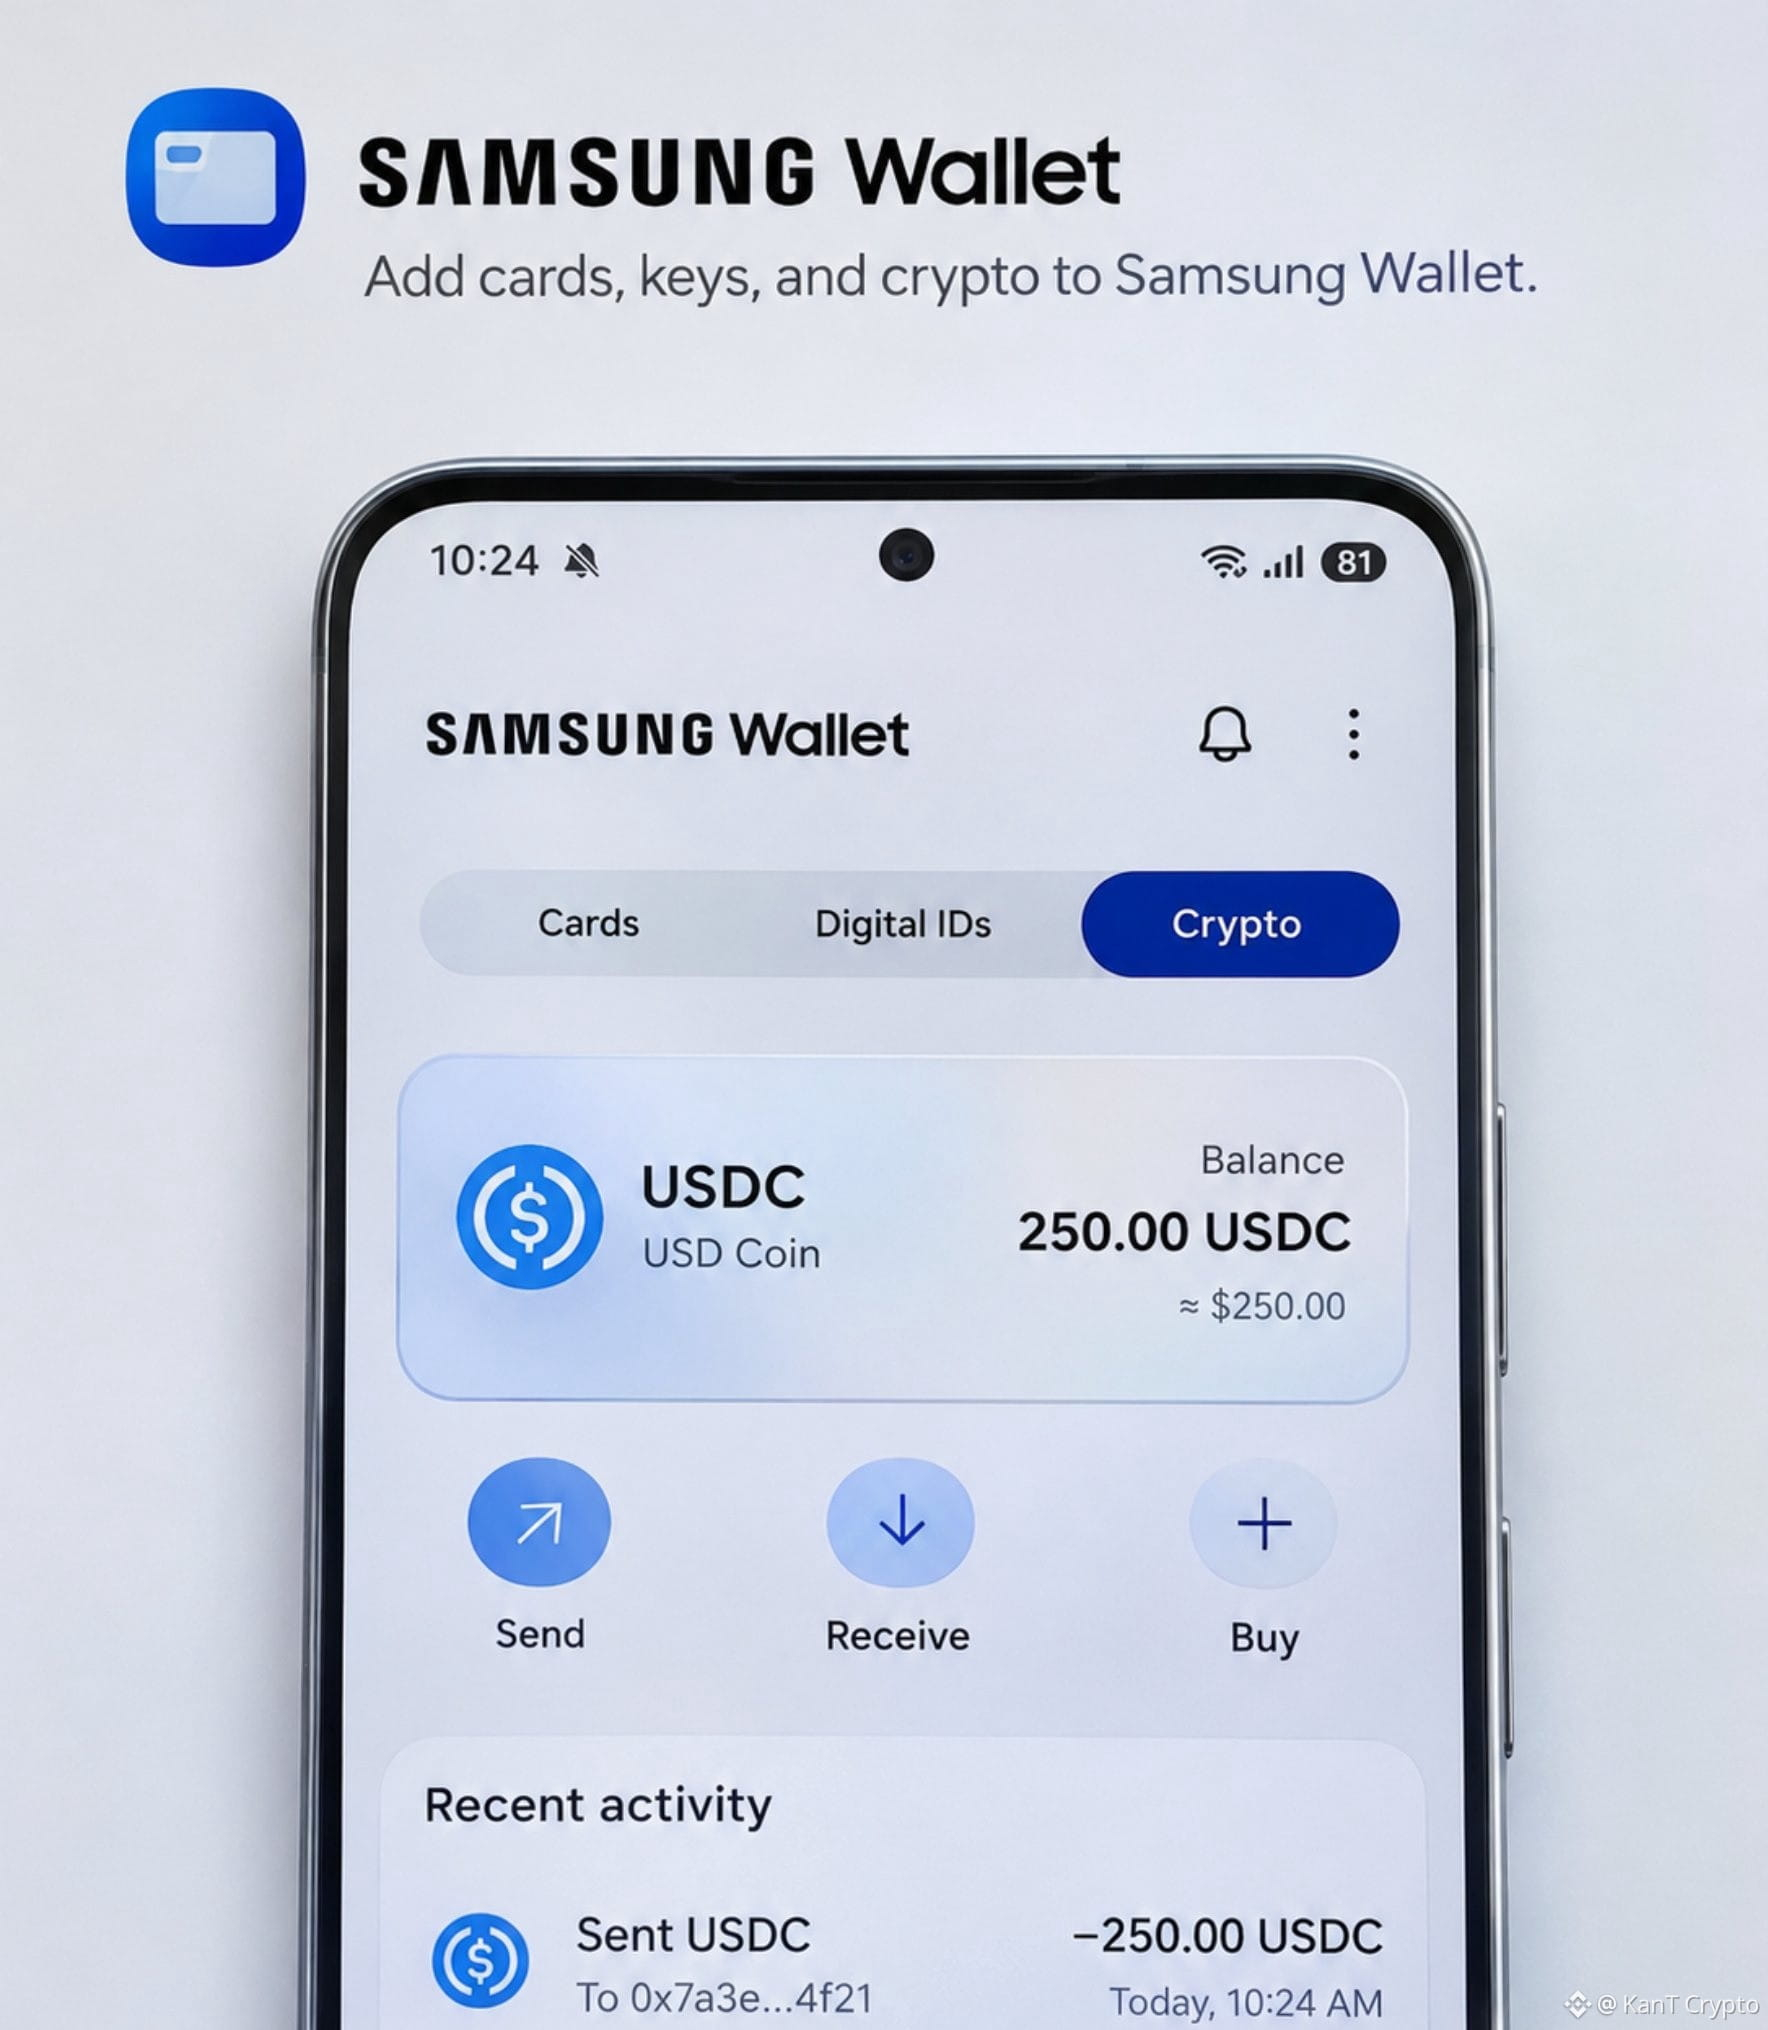
BREAKING: Samsung Wallet officially launches USDC stablecoin transfers for 82 million Galaxy devices in the US.
$SUI
$SOL
$USDC
$SUI
$SOL
$USDC

1
330
Log in to explore more content
Join global crypto users on Binance Square
⚡️ Get latest and useful information about crypto.
💬 Trusted by the world’s largest crypto exchange.
👍 Discover real insights from verified creators.
Email / Phone number
Trending Topics
WhatWillDriveCryptoandStocks’NextRebound?
58,830 views
825 Discussing
Bitcoin Slips Below $70,000 as Dollar Index Hits 19-Month High
Binance News
·17 Likes
·37.7k views
Anthropic’s6xIPODemandSignalsPotentialRecordRaise
18,697 views
388 Discussing
USCryptoETFsLose$1.48BInFiveDays
272 views
10 Discussing