
定投30年
120 Posts

定投30年
Report
Block User
一个普通程序员,坚持定投比特币,记录财富增长的全过程
Open Trade
Frequent Trader
6.3 Months
5 Following
3 Followers
1 Liked
Posts
Portfolio
All
Videos
·
--
$OP isn't following the decline this time. Contract positions are still increasing, but account positioning isn't one-sided.
Binance data as of 23:12 Beijing time: $OP spot was around 0.1082 USDT, up 3.74% over 24h; over the same period, $BTC was around 75,455, down 2.10%. OP rebounded about 8.6% from its intraday low of 0.0996, and was only about 1.1% below its high of 0.1094; BTC pulled back about 2.9% from its high.
On the contract side: OPUSDT perpetual open interest rose from around 118.7 million tokens to around 121.4 million over the past 24 hours, an increase of about 2.3%; its notional value rose about 3.8%. The global long/short account ratio was around 1.00, with long accounts making up about 49.9%. The taker buy/sell ratio over the past hour was around 0.92, and the funding rate was about 0.01%.
Price strength came first, followed by an increase in leveraged positions, but accounts still aren't crowded onto one side. A rise doesn't mean longs are already crowded.
Data from Binance spot ticker and public futures APIs. Not investment advice.
$OP $BTC
$OP isn't following the decline this time. Contract positions are still increasing, but account positioning isn't one-sided.
Binance data as of 23:12 Beijing time: $OP spot was around 0.1082 USDT, up 3.74% over 24h; over the same period, $BTC was around 75,455, down 2.10%. OP rebounded about 8.6% from its intraday low of 0.0996, and was only about 1.1% below its high of 0.1094; BTC pulled back about 2.9% from its high.
On the contract side: OPUSDT perpetual open interest rose from around 118.7 million tokens to around 121.4 million over the past 24 hours, an increase of about 2.3%; its notional value rose about 3.8%. The global long/short account ratio was around 1.00, with long accounts making up about 49.9%. The taker buy/sell ratio over the past hour was around 0.92, and the funding rate was about 0.01%.
Price strength came first, followed by an increase in leveraged positions, but accounts still aren't crowded onto one side. A rise doesn't mean longs are already crowded.
Data from Binance spot ticker and public futures APIs. Not investment advice.
$OP $BTC
Binance data as of 23:12 Beijing time: $OP spot was around 0.1082 USDT, up 3.74% over 24h; over the same period, $BTC was around 75,455, down 2.10%. OP rebounded about 8.6% from its intraday low of 0.0996, and was only about 1.1% below its high of 0.1094; BTC pulled back about 2.9% from its high.
On the contract side: OPUSDT perpetual open interest rose from around 118.7 million tokens to around 121.4 million over the past 24 hours, an increase of about 2.3%; its notional value rose about 3.8%. The global long/short account ratio was around 1.00, with long accounts making up about 49.9%. The taker buy/sell ratio over the past hour was around 0.92, and the funding rate was about 0.01%.
Price strength came first, followed by an increase in leveraged positions, but accounts still aren't crowded onto one side. A rise doesn't mean longs are already crowded.
Data from Binance spot ticker and public futures APIs. Not investment advice.
$OP $BTC
213
·
--
$SUI held up relatively well this round, but positions in futures are being unwound.
Binance data as of 22:57 Beijing time: $SUI spot price was about 0.872 USDT, down 1.25% over 24h; over the same period, $BTC was about 75,394, down 3.63%. SUI fell about 1.5% from its intraday high of 0.885 and rebounded about 5.0% from its low of 0.830; BTC fell about 3.7% from its high and barely bounced from its low.
On the futures side: SUIUSDT perpetual open interest (in coins) fell from about 102.5 million to about 97.21 million over the past 24 hours, down about 5.1%; notional open interest fell about 10%. The global long/short account ratio remains around 2.00, with long accounts making up about 66.6%. The taker buy/sell ratio over the past hour was about 1.00, and the funding rate was about 0.0087%.
Spot is holding up better than BTC, while leveraged positions are shrinking and accounts remain tilted long. Holding up well does not mean anyone is adding positions.
Data from Binance spot ticker and public futures APIs. Not investment advice.
$SUI $BTC
$SUI held up relatively well this round, but positions in futures are being unwound.
Binance data as of 22:57 Beijing time: $SUI spot price was about 0.872 USDT, down 1.25% over 24h; over the same period, $BTC was about 75,394, down 3.63%. SUI fell about 1.5% from its intraday high of 0.885 and rebounded about 5.0% from its low of 0.830; BTC fell about 3.7% from its high and barely bounced from its low.
On the futures side: SUIUSDT perpetual open interest (in coins) fell from about 102.5 million to about 97.21 million over the past 24 hours, down about 5.1%; notional open interest fell about 10%. The global long/short account ratio remains around 2.00, with long accounts making up about 66.6%. The taker buy/sell ratio over the past hour was about 1.00, and the funding rate was about 0.0087%.
Spot is holding up better than BTC, while leveraged positions are shrinking and accounts remain tilted long. Holding up well does not mean anyone is adding positions.
Data from Binance spot ticker and public futures APIs. Not investment advice.
$SUI $BTC
Binance data as of 22:57 Beijing time: $SUI spot price was about 0.872 USDT, down 1.25% over 24h; over the same period, $BTC was about 75,394, down 3.63%. SUI fell about 1.5% from its intraday high of 0.885 and rebounded about 5.0% from its low of 0.830; BTC fell about 3.7% from its high and barely bounced from its low.
On the futures side: SUIUSDT perpetual open interest (in coins) fell from about 102.5 million to about 97.21 million over the past 24 hours, down about 5.1%; notional open interest fell about 10%. The global long/short account ratio remains around 2.00, with long accounts making up about 66.6%. The taker buy/sell ratio over the past hour was about 1.00, and the funding rate was about 0.0087%.
Spot is holding up better than BTC, while leveraged positions are shrinking and accounts remain tilted long. Holding up well does not mean anyone is adding positions.
Data from Binance spot ticker and public futures APIs. Not investment advice.
$SUI $BTC
310
·
--
$INJ barely followed the decline today.
Binance data as of 22:24 (Beijing time): $INJ spot was around 8.287 USDT, +0.12% over 24h; over the same period, $BTC was around 75,724, down 4.62%. INJ rebounded about 6.5% from its intraday low of 7.778, and was just about 1.9% below its high of 8.448. BTC pulled back about 4.9% from its high and rebounded only about 0.7% from its low.
On the futures side: INJUSDT perpetual open interest (in coins) rose from around 3.71 million to around 3.73 million over the past 7 hours, a change of less than 1%. The funding rate was 0.01%. During the 21:00 hour, taker sells totaled about 507,000 coins and taker buys about 423,000, for a buy/sell ratio of 0.84.
During the same decline, spot relative strength varied widely, while futures positions did not noticeably build up. It’s fine to look at relative performance, but don’t take “resilience” as a direct indication of leverage direction.
Data from Binance spot tickers and public futures APIs. Not investment advice.
$INJ $BTC
$INJ barely followed the decline today.
Binance data as of 22:24 (Beijing time): $INJ spot was around 8.287 USDT, +0.12% over 24h; over the same period, $BTC was around 75,724, down 4.62%. INJ rebounded about 6.5% from its intraday low of 7.778, and was just about 1.9% below its high of 8.448. BTC pulled back about 4.9% from its high and rebounded only about 0.7% from its low.
On the futures side: INJUSDT perpetual open interest (in coins) rose from around 3.71 million to around 3.73 million over the past 7 hours, a change of less than 1%. The funding rate was 0.01%. During the 21:00 hour, taker sells totaled about 507,000 coins and taker buys about 423,000, for a buy/sell ratio of 0.84.
During the same decline, spot relative strength varied widely, while futures positions did not noticeably build up. It’s fine to look at relative performance, but don’t take “resilience” as a direct indication of leverage direction.
Data from Binance spot tickers and public futures APIs. Not investment advice.
$INJ $BTC
Binance data as of 22:24 (Beijing time): $INJ spot was around 8.287 USDT, +0.12% over 24h; over the same period, $BTC was around 75,724, down 4.62%. INJ rebounded about 6.5% from its intraday low of 7.778, and was just about 1.9% below its high of 8.448. BTC pulled back about 4.9% from its high and rebounded only about 0.7% from its low.
On the futures side: INJUSDT perpetual open interest (in coins) rose from around 3.71 million to around 3.73 million over the past 7 hours, a change of less than 1%. The funding rate was 0.01%. During the 21:00 hour, taker sells totaled about 507,000 coins and taker buys about 423,000, for a buy/sell ratio of 0.84.
During the same decline, spot relative strength varied widely, while futures positions did not noticeably build up. It’s fine to look at relative performance, but don’t take “resilience” as a direct indication of leverage direction.
Data from Binance spot tickers and public futures APIs. Not investment advice.
$INJ $BTC
290
·
--
$ARB is one of the few major coins trading in the green today.
Binance data as of 22:04 (Beijing time): $ARB spot was around 0.1686 USDT, up 3.56% over 24 hours; over the same period, $BTC was around 75,719, down 4.91%. ARB rebounded about 12.3% from its intraday low of 0.1501 and is now near its high of 0.1699.
The futures side is worth a closer look: ARBUSDT perpetual open interest (in tokens) rose from about 226 million at 17:00 to about 244 million at 22:00, an increase of roughly 8% in five hours. The funding rate is 0.01%, right around its default level. But in the past few hours, the taker buy/sell ratio has stayed below 1. During the 21:00 hour, taker sells totaled about 12.09 million tokens versus roughly 8.6 million in taker buys.
Prices are rising and positions are growing, but taker flow still leans toward selling. This suggests that some traders are adding to positions during the rally, while others are taking profits through market sells. For spot, relative strength is all you need to watch; in futures, don't treat a "green move against the trend" as a one-way signal.
Data from Binance spot tickers and public futures endpoints. Not investment advice.
$ARB $BTC
$ARB is one of the few major coins trading in the green today.
Binance data as of 22:04 (Beijing time): $ARB spot was around 0.1686 USDT, up 3.56% over 24 hours; over the same period, $BTC was around 75,719, down 4.91%. ARB rebounded about 12.3% from its intraday low of 0.1501 and is now near its high of 0.1699.
The futures side is worth a closer look: ARBUSDT perpetual open interest (in tokens) rose from about 226 million at 17:00 to about 244 million at 22:00, an increase of roughly 8% in five hours. The funding rate is 0.01%, right around its default level. But in the past few hours, the taker buy/sell ratio has stayed below 1. During the 21:00 hour, taker sells totaled about 12.09 million tokens versus roughly 8.6 million in taker buys.
Prices are rising and positions are growing, but taker flow still leans toward selling. This suggests that some traders are adding to positions during the rally, while others are taking profits through market sells. For spot, relative strength is all you need to watch; in futures, don't treat a "green move against the trend" as a one-way signal.
Data from Binance spot tickers and public futures endpoints. Not investment advice.
$ARB $BTC
Binance data as of 22:04 (Beijing time): $ARB spot was around 0.1686 USDT, up 3.56% over 24 hours; over the same period, $BTC was around 75,719, down 4.91%. ARB rebounded about 12.3% from its intraday low of 0.1501 and is now near its high of 0.1699.
The futures side is worth a closer look: ARBUSDT perpetual open interest (in tokens) rose from about 226 million at 17:00 to about 244 million at 22:00, an increase of roughly 8% in five hours. The funding rate is 0.01%, right around its default level. But in the past few hours, the taker buy/sell ratio has stayed below 1. During the 21:00 hour, taker sells totaled about 12.09 million tokens versus roughly 8.6 million in taker buys.
Prices are rising and positions are growing, but taker flow still leans toward selling. This suggests that some traders are adding to positions during the rally, while others are taking profits through market sells. For spot, relative strength is all you need to watch; in futures, don't treat a "green move against the trend" as a one-way signal.
Data from Binance spot tickers and public futures endpoints. Not investment advice.
$ARB $BTC
4
·
--
$ARB is up nearly 4% today, while $BTC is down 5%.
Binance data as of 21:57 Beijing time: $ARB spot is around 0.1689 USDT, up 3.75% over 24 hours. It climbed from 0.1501 intraday to near its high of 0.1699. Over the same period, $BTC is around 75,682, down 5.02%. ARBUSDT perpetual open interest (in coins) rose from about 224 million at 16:00 to about 240 million at 21:00, an increase of around 7% in five hours. The funding rate is 0.01%, a normal level. However, the taker buy/sell ratios over the past three hours were 0.87, 0.67, and 0.80, respectively, with taker selling consistently outweighing taker buying.
Price and open interest are both rising, while aggressive trades are skewed toward selling. This suggests the rally is being driven mainly by passive bid-side support, while market buyers are still selling. The long/short account ratio is around 1.29, with neither side dominating.
If you hold spot, don't chase the price higher just because it's moving against the trend. First watch to see whether volume picks up above 0.17. If you're trading futures, be cautious: with open interest rising this quickly, a pullback could liquidate leveraged positions on either side.
This data is for observation only and does not constitute investment advice.
$ARB is up nearly 4% today, while $BTC is down 5%.
Binance data as of 21:57 Beijing time: $ARB spot is around 0.1689 USDT, up 3.75% over 24 hours. It climbed from 0.1501 intraday to near its high of 0.1699. Over the same period, $BTC is around 75,682, down 5.02%. ARBUSDT perpetual open interest (in coins) rose from about 224 million at 16:00 to about 240 million at 21:00, an increase of around 7% in five hours. The funding rate is 0.01%, a normal level. However, the taker buy/sell ratios over the past three hours were 0.87, 0.67, and 0.80, respectively, with taker selling consistently outweighing taker buying.
Price and open interest are both rising, while aggressive trades are skewed toward selling. This suggests the rally is being driven mainly by passive bid-side support, while market buyers are still selling. The long/short account ratio is around 1.29, with neither side dominating.
If you hold spot, don't chase the price higher just because it's moving against the trend. First watch to see whether volume picks up above 0.17. If you're trading futures, be cautious: with open interest rising this quickly, a pullback could liquidate leveraged positions on either side.
This data is for observation only and does not constitute investment advice.
Binance data as of 21:57 Beijing time: $ARB spot is around 0.1689 USDT, up 3.75% over 24 hours. It climbed from 0.1501 intraday to near its high of 0.1699. Over the same period, $BTC is around 75,682, down 5.02%. ARBUSDT perpetual open interest (in coins) rose from about 224 million at 16:00 to about 240 million at 21:00, an increase of around 7% in five hours. The funding rate is 0.01%, a normal level. However, the taker buy/sell ratios over the past three hours were 0.87, 0.67, and 0.80, respectively, with taker selling consistently outweighing taker buying.
Price and open interest are both rising, while aggressive trades are skewed toward selling. This suggests the rally is being driven mainly by passive bid-side support, while market buyers are still selling. The long/short account ratio is around 1.29, with neither side dominating.
If you hold spot, don't chase the price higher just because it's moving against the trend. First watch to see whether volume picks up above 0.17. If you're trading futures, be cautious: with open interest rising this quickly, a pullback could liquidate leveraged positions on either side.
This data is for observation only and does not constitute investment advice.
327
·
--
$LINK fell by more than 4%, but open positions in the futures market barely moved.
Binance data as of 21:29 Beijing time: $LINK spot was around 10.93 USDT, down 4.36% over 24 hours, with a range of 10.51–11.46. It has already rebounded about 4% from its intraday low. Over the past five hours, open interest in LINKUSDT perpetuals (measured in tokens) fluctuated between 7.78 million and 7.82 million, most recently around 7.81 million—about 0.3% higher than five hours ago. The funding rate was around 0.009%, close to the default level.
Open interest did not decline as prices fell, suggesting this drop was driven less by a wave of long liquidations and more by selling pressure in the spot market. It also means leveraged positions in the market remain largely intact; if the price falls below 10.5 again, those positions will be the ones to watch.
Spot holders can treat 10.5 as a level to monitor and avoid chasing the price after a single rebound. Futures traders should look beyond price alone: a clear decline in open interest is often a sign that this correction is being absorbed.
For informational purposes only; not investment advice.
$LINK fell by more than 4%, but open positions in the futures market barely moved.
Binance data as of 21:29 Beijing time: $LINK spot was around 10.93 USDT, down 4.36% over 24 hours, with a range of 10.51–11.46. It has already rebounded about 4% from its intraday low. Over the past five hours, open interest in LINKUSDT perpetuals (measured in tokens) fluctuated between 7.78 million and 7.82 million, most recently around 7.81 million—about 0.3% higher than five hours ago. The funding rate was around 0.009%, close to the default level.
Open interest did not decline as prices fell, suggesting this drop was driven less by a wave of long liquidations and more by selling pressure in the spot market. It also means leveraged positions in the market remain largely intact; if the price falls below 10.5 again, those positions will be the ones to watch.
Spot holders can treat 10.5 as a level to monitor and avoid chasing the price after a single rebound. Futures traders should look beyond price alone: a clear decline in open interest is often a sign that this correction is being absorbed.
For informational purposes only; not investment advice.
Binance data as of 21:29 Beijing time: $LINK spot was around 10.93 USDT, down 4.36% over 24 hours, with a range of 10.51–11.46. It has already rebounded about 4% from its intraday low. Over the past five hours, open interest in LINKUSDT perpetuals (measured in tokens) fluctuated between 7.78 million and 7.82 million, most recently around 7.81 million—about 0.3% higher than five hours ago. The funding rate was around 0.009%, close to the default level.
Open interest did not decline as prices fell, suggesting this drop was driven less by a wave of long liquidations and more by selling pressure in the spot market. It also means leveraged positions in the market remain largely intact; if the price falls below 10.5 again, those positions will be the ones to watch.
Spot holders can treat 10.5 as a level to monitor and avoid chasing the price after a single rebound. Futures traders should look beyond price alone: a clear decline in open interest is often a sign that this correction is being absorbed.
For informational purposes only; not investment advice.
84
·
--
$DOGE didn’t fall especially sharply today, but aggressive sellers consistently outnumbered aggressive buyers.
Binance data as of 21:16 (Beijing time): $DOGE spot was around 0.0722 USDT, down 4.97% over 24 hours, with a range of 0.0702–0.0761. It is now less than 3% above the day’s low. The aggressive buy/sell ratios for DOGEUSDT perpetuals over the last four hours were 1.01, 0.72, 1.00, and 0.79, respectively. In the last hour, aggressive selling totaled about 85.82 million tokens, compared with about 67.56 million bought aggressively. The funding rate was around 0.006%, essentially neutral.
The aggressive buy/sell ratio measures the direction of market orders: below 1 means more volume is hitting the market on the sell side. Over the four hours, selling was clearly dominant twice, while the other two periods were merely even. Buyers never managed to gain the upper hand.
If you’re holding spot, there’s no need to rush in—first see whether buyers are willing to step in around 0.070. If you’re trading futures, take note: the low funding rate suggests shorts aren’t crowded yet. In this kind of slow grind, it’s easy to get trapped after going heavily into a dip-buying position.
This data is for observation only and does not constitute investment advice.
$DOGE didn’t fall especially sharply today, but aggressive sellers consistently outnumbered aggressive buyers.
Binance data as of 21:16 (Beijing time): $DOGE spot was around 0.0722 USDT, down 4.97% over 24 hours, with a range of 0.0702–0.0761. It is now less than 3% above the day’s low. The aggressive buy/sell ratios for DOGEUSDT perpetuals over the last four hours were 1.01, 0.72, 1.00, and 0.79, respectively. In the last hour, aggressive selling totaled about 85.82 million tokens, compared with about 67.56 million bought aggressively. The funding rate was around 0.006%, essentially neutral.
The aggressive buy/sell ratio measures the direction of market orders: below 1 means more volume is hitting the market on the sell side. Over the four hours, selling was clearly dominant twice, while the other two periods were merely even. Buyers never managed to gain the upper hand.
If you’re holding spot, there’s no need to rush in—first see whether buyers are willing to step in around 0.070. If you’re trading futures, take note: the low funding rate suggests shorts aren’t crowded yet. In this kind of slow grind, it’s easy to get trapped after going heavily into a dip-buying position.
This data is for observation only and does not constitute investment advice.
Binance data as of 21:16 (Beijing time): $DOGE spot was around 0.0722 USDT, down 4.97% over 24 hours, with a range of 0.0702–0.0761. It is now less than 3% above the day’s low. The aggressive buy/sell ratios for DOGEUSDT perpetuals over the last four hours were 1.01, 0.72, 1.00, and 0.79, respectively. In the last hour, aggressive selling totaled about 85.82 million tokens, compared with about 67.56 million bought aggressively. The funding rate was around 0.006%, essentially neutral.
The aggressive buy/sell ratio measures the direction of market orders: below 1 means more volume is hitting the market on the sell side. Over the four hours, selling was clearly dominant twice, while the other two periods were merely even. Buyers never managed to gain the upper hand.
If you’re holding spot, there’s no need to rush in—first see whether buyers are willing to step in around 0.070. If you’re trading futures, take note: the low funding rate suggests shorts aren’t crowded yet. In this kind of slow grind, it’s easy to get trapped after going heavily into a dip-buying position.
This data is for observation only and does not constitute investment advice.
84
·
--
$XRP fell 9% in a day, while three out of four accounts in the futures market are still long.
Binance data as of 21:09 Beijing time: $XRP spot was around 1.186 USDT, down 9.28% over 24 hours. It slid from 1.311 to an intraday low of 1.178, with 24-hour trading volume of about 160 million USDT. The long/short account ratio for XRPUSDT perpetuals was around 3.05, with long accounts making up 75.3%—almost unchanged over the past three hours. The latest funding rate was 0.01%, within the usual range.
This ratio is based on the number of accounts, not position size. Many small accounts may be buying the dip and going long, while large investors may not be on the same side. With the price down nearly 10% but the share of long accounts unchanged, there has not yet been any obvious capitulation in the form of forced position closures.
Spot holders can watch to see whether there is support around 1.18. Futures traders should consider that, with longs so concentrated, a further breakdown could trigger forced liquidations and add to selling pressure.
This data is for observation only and does not constitute investment advice.
$XRP fell 9% in a day, while three out of four accounts in the futures market are still long.
Binance data as of 21:09 Beijing time: $XRP spot was around 1.186 USDT, down 9.28% over 24 hours. It slid from 1.311 to an intraday low of 1.178, with 24-hour trading volume of about 160 million USDT. The long/short account ratio for XRPUSDT perpetuals was around 3.05, with long accounts making up 75.3%—almost unchanged over the past three hours. The latest funding rate was 0.01%, within the usual range.
This ratio is based on the number of accounts, not position size. Many small accounts may be buying the dip and going long, while large investors may not be on the same side. With the price down nearly 10% but the share of long accounts unchanged, there has not yet been any obvious capitulation in the form of forced position closures.
Spot holders can watch to see whether there is support around 1.18. Futures traders should consider that, with longs so concentrated, a further breakdown could trigger forced liquidations and add to selling pressure.
This data is for observation only and does not constitute investment advice.
Binance data as of 21:09 Beijing time: $XRP spot was around 1.186 USDT, down 9.28% over 24 hours. It slid from 1.311 to an intraday low of 1.178, with 24-hour trading volume of about 160 million USDT. The long/short account ratio for XRPUSDT perpetuals was around 3.05, with long accounts making up 75.3%—almost unchanged over the past three hours. The latest funding rate was 0.01%, within the usual range.
This ratio is based on the number of accounts, not position size. Many small accounts may be buying the dip and going long, while large investors may not be on the same side. With the price down nearly 10% but the share of long accounts unchanged, there has not yet been any obvious capitulation in the form of forced position closures.
Spot holders can watch to see whether there is support around 1.18. Futures traders should consider that, with longs so concentrated, a further breakdown could trigger forced liquidations and add to selling pressure.
This data is for observation only and does not constitute investment advice.
17
·
--
$SOL fell, but positions in futures increased instead.
Binance data as of 21:04 (Beijing time): $SOL spot was around 90.19 USDT, down 5.57% over 24 hours, with an intraday low of 88.30. Over the same period, open interest in SOLUSDT perpetual contracts rose from about 9.16 million to around 9.30 million tokens, an increase of roughly 1.5%. By token count, this was not a case of deleveraging. The latest funding rate was about 0.003%, close to neutral.
When prices fall while open interest rises, it suggests that traders opened new positions during the decline. They may be chasing the drop with shorts, or buying the dip with longs; these two figures alone don’t reveal which. But the funding rate is not high, so at least longs are not overcrowded on one side.
Spot traders can first watch to see whether the price holds near 88. For futures traders, keep in mind that as open interest builds, a break in either direction can amplify volatility. Set your position size and stop-loss in advance.
This data is for observation only and does not constitute investment advice.
$SOL fell, but positions in futures increased instead.
Binance data as of 21:04 (Beijing time): $SOL spot was around 90.19 USDT, down 5.57% over 24 hours, with an intraday low of 88.30. Over the same period, open interest in SOLUSDT perpetual contracts rose from about 9.16 million to around 9.30 million tokens, an increase of roughly 1.5%. By token count, this was not a case of deleveraging. The latest funding rate was about 0.003%, close to neutral.
When prices fall while open interest rises, it suggests that traders opened new positions during the decline. They may be chasing the drop with shorts, or buying the dip with longs; these two figures alone don’t reveal which. But the funding rate is not high, so at least longs are not overcrowded on one side.
Spot traders can first watch to see whether the price holds near 88. For futures traders, keep in mind that as open interest builds, a break in either direction can amplify volatility. Set your position size and stop-loss in advance.
This data is for observation only and does not constitute investment advice.
Binance data as of 21:04 (Beijing time): $SOL spot was around 90.19 USDT, down 5.57% over 24 hours, with an intraday low of 88.30. Over the same period, open interest in SOLUSDT perpetual contracts rose from about 9.16 million to around 9.30 million tokens, an increase of roughly 1.5%. By token count, this was not a case of deleveraging. The latest funding rate was about 0.003%, close to neutral.
When prices fall while open interest rises, it suggests that traders opened new positions during the decline. They may be chasing the drop with shorts, or buying the dip with longs; these two figures alone don’t reveal which. But the funding rate is not high, so at least longs are not overcrowded on one side.
Spot traders can first watch to see whether the price holds near 88. For futures traders, keep in mind that as open interest builds, a break in either direction can amplify volatility. Set your position size and stop-loss in advance.
This data is for observation only and does not constitute investment advice.
154
·
--
$BNB fell much less than the broader market today.
As of 20:57 Beijing time, Binance Spot showed $BNB at around 695.6 USDT, down 2.13% over 24 hours; over the same period, $BTC was around 76,031, down 4.56%. Its range was also narrower: BNB's high-to-low range was about 4.0% relative to its open, compared with about 5.8% for BTC.
If you hold spot positions in both, today's losses on the BTC side will stand out more. At the same leverage in perpetuals, BNB also faced somewhat less intraday volatility. This is just a relative-strength observation, not a claim that exchange tokens are always more resilient in downturns.
Data from Binance Spot 24hr ticker. Not investment advice.
$BNB $BTC
$BNB fell much less than the broader market today.
As of 20:57 Beijing time, Binance Spot showed $BNB at around 695.6 USDT, down 2.13% over 24 hours; over the same period, $BTC was around 76,031, down 4.56%. Its range was also narrower: BNB's high-to-low range was about 4.0% relative to its open, compared with about 5.8% for BTC.
If you hold spot positions in both, today's losses on the BTC side will stand out more. At the same leverage in perpetuals, BNB also faced somewhat less intraday volatility. This is just a relative-strength observation, not a claim that exchange tokens are always more resilient in downturns.
Data from Binance Spot 24hr ticker. Not investment advice.
$BNB $BTC
As of 20:57 Beijing time, Binance Spot showed $BNB at around 695.6 USDT, down 2.13% over 24 hours; over the same period, $BTC was around 76,031, down 4.56%. Its range was also narrower: BNB's high-to-low range was about 4.0% relative to its open, compared with about 5.8% for BTC.
If you hold spot positions in both, today's losses on the BTC side will stand out more. At the same leverage in perpetuals, BNB also faced somewhat less intraday volatility. This is just a relative-strength observation, not a claim that exchange tokens are always more resilient in downturns.
Data from Binance Spot 24hr ticker. Not investment advice.
$BNB $BTC
100
·
--
Within the same downturn, $ETH was slightly weaker than $BTC .
As of 20:43 Beijing time, Binance spot $BTC was around 76,211 USDT, down about 4.50% over 24 hours; $ETH was around 2,244 USDT, down about 6.40%. The relative-strength gap was approximately 1.9 percentage points. ETH/BTC was around 0.02944, down approximately 2.0% from its ratio at the day's open.
ETH's intraday high-low range was about 8.4% of its opening price, compared with about 5.8% for BTC. If you're rotating between spot assets, you can note this relative-strength comparison. On the futures side, if leverage is similar on both, ETH's pullback tends to stand out more. Don't rush to draw conclusions about the cause; the ticker only describes what happened.
Data: Binance spot 24-hour ticker, 20:43 snapshot. For market tracking only; not investment advice.
Within the same downturn, $ETH was slightly weaker than $BTC .
As of 20:43 Beijing time, Binance spot $BTC was around 76,211 USDT, down about 4.50% over 24 hours; $ETH was around 2,244 USDT, down about 6.40%. The relative-strength gap was approximately 1.9 percentage points. ETH/BTC was around 0.02944, down approximately 2.0% from its ratio at the day's open.
ETH's intraday high-low range was about 8.4% of its opening price, compared with about 5.8% for BTC. If you're rotating between spot assets, you can note this relative-strength comparison. On the futures side, if leverage is similar on both, ETH's pullback tends to stand out more. Don't rush to draw conclusions about the cause; the ticker only describes what happened.
Data: Binance spot 24-hour ticker, 20:43 snapshot. For market tracking only; not investment advice.
As of 20:43 Beijing time, Binance spot $BTC was around 76,211 USDT, down about 4.50% over 24 hours; $ETH was around 2,244 USDT, down about 6.40%. The relative-strength gap was approximately 1.9 percentage points. ETH/BTC was around 0.02944, down approximately 2.0% from its ratio at the day's open.
ETH's intraday high-low range was about 8.4% of its opening price, compared with about 5.8% for BTC. If you're rotating between spot assets, you can note this relative-strength comparison. On the futures side, if leverage is similar on both, ETH's pullback tends to stand out more. Don't rush to draw conclusions about the cause; the ticker only describes what happened.
Data: Binance spot 24-hour ticker, 20:43 snapshot. For market tracking only; not investment advice.
1
·
--
When checking the funding rate in futures, don’t treat it as a signal for market direction.
As of 20:30 Beijing time, the latest funding rate for Binance $BTC perpetual futures was about 0.0070% (approximately 0.70 basis points), equivalent to an annualized rate of around 7.7%. The rate was slightly positive, meaning longs were paying shorts.
At the same time, spot was trading at around 76,331 USDT, down about 4.7% over 24 hours. When longs are still paying funding while spot continues to fall, it more often means leveraged longs haven’t fully exited—not that a bottom is imminent.
When the funding rate is very small, its impact on short-term costs is often more tangible than its value as a “sentiment signal.” Trade spot according to your own pace, and factor funding costs into your calculations before opening futures positions.
Data: Binance futures premiumIndex + spot ticker, 20:30 snapshot. For market reference only; not investment advice.
When checking the funding rate in futures, don’t treat it as a signal for market direction.
As of 20:30 Beijing time, the latest funding rate for Binance $BTC perpetual futures was about 0.0070% (approximately 0.70 basis points), equivalent to an annualized rate of around 7.7%. The rate was slightly positive, meaning longs were paying shorts.
At the same time, spot was trading at around 76,331 USDT, down about 4.7% over 24 hours. When longs are still paying funding while spot continues to fall, it more often means leveraged longs haven’t fully exited—not that a bottom is imminent.
When the funding rate is very small, its impact on short-term costs is often more tangible than its value as a “sentiment signal.” Trade spot according to your own pace, and factor funding costs into your calculations before opening futures positions.
Data: Binance futures premiumIndex + spot ticker, 20:30 snapshot. For market reference only; not investment advice.
As of 20:30 Beijing time, the latest funding rate for Binance $BTC perpetual futures was about 0.0070% (approximately 0.70 basis points), equivalent to an annualized rate of around 7.7%. The rate was slightly positive, meaning longs were paying shorts.
At the same time, spot was trading at around 76,331 USDT, down about 4.7% over 24 hours. When longs are still paying funding while spot continues to fall, it more often means leveraged longs haven’t fully exited—not that a bottom is imminent.
When the funding rate is very small, its impact on short-term costs is often more tangible than its value as a “sentiment signal.” Trade spot according to your own pace, and factor funding costs into your calculations before opening futures positions.
Data: Binance futures premiumIndex + spot ticker, 20:30 snapshot. For market reference only; not investment advice.
74
·
--
When watching $BTC, don’t focus on just one price move.
As of 20:21 Beijing time, the current price on Binance was 76,211.74 USDT, down about 4.9% over 24 hours. But from 75,615.55 at 15:00 to the current price, it has rebounded about 0.79%.
A rebound within a downtrend is not the same as a trend reversal.
For spot trading, you can buy in batches at your own pace. For futures, calculate your liquidation distance first. The current price is still about 5.16% below the 24-hour high of 80,180.01.
Market data source: Binance public spot market and 1-hour candlesticks, snapshot at 20:21. For market information only; not investment advice.
When watching $BTC , don’t focus on just one price move.
As of 20:21 Beijing time, the current price on Binance was 76,211.74 USDT, down about 4.9% over 24 hours. But from 75,615.55 at 15:00 to the current price, it has rebounded about 0.79%.
A rebound within a downtrend is not the same as a trend reversal.
For spot trading, you can buy in batches at your own pace. For futures, calculate your liquidation distance first. The current price is still about 5.16% below the 24-hour high of 80,180.01.
Market data source: Binance public spot market and 1-hour candlesticks, snapshot at 20:21. For market information only; not investment advice.
As of 20:21 Beijing time, the current price on Binance was 76,211.74 USDT, down about 4.9% over 24 hours. But from 75,615.55 at 15:00 to the current price, it has rebounded about 0.79%.
A rebound within a downtrend is not the same as a trend reversal.
For spot trading, you can buy in batches at your own pace. For futures, calculate your liquidation distance first. The current price is still about 5.16% below the 24-hour high of 80,180.01.
Market data source: Binance public spot market and 1-hour candlesticks, snapshot at 20:21. For market information only; not investment advice.
93
·
--
I looked back at the mistake I’m most prone to making: I saved the money, but only dared to invest half of it regularly.
Saving the same $10,000 each year from 1996 to 2025 (S&P 500, including dividends).
People who invested the full amount every year:
Principal: $300,000
At the end of 2005 → $137,000
At the end of 2015 → $452,000
At the end of 2025 → $2,040,000
People who invested half each year and kept half in cash:
Principal: also $300,000
At the end of 2005 → $119,000
At the end of 2015 → $326,000
At the end of 2025 → $1,170,000
That $150,000 in cash sat there for 30 years, earning zero interest.
In the end, it was worth $870,000 less.
I used to be the second kind of person, and thought I was being prudent.
Data: Slickcharts annual total returns for the S&P 500; invested at the beginning of each year. Cash earned zero interest. Taxes, fees, exchange rates, and inflation are excluded. Past performance does not guarantee future results. This is not investment advice.
I looked back at the mistake I’m most prone to making: I saved the money, but only dared to invest half of it regularly.
Saving the same $10,000 each year from 1996 to 2025 (S&P 500, including dividends).
People who invested the full amount every year:
Principal: $300,000
At the end of 2005 → $137,000
At the end of 2015 → $452,000
At the end of 2025 → $2,040,000
People who invested half each year and kept half in cash:
Principal: also $300,000
At the end of 2005 → $119,000
At the end of 2015 → $326,000
At the end of 2025 → $1,170,000
That $150,000 in cash sat there for 30 years, earning zero interest.
In the end, it was worth $870,000 less.
I used to be the second kind of person, and thought I was being prudent.
Data: Slickcharts annual total returns for the S&P 500; invested at the beginning of each year. Cash earned zero interest. Taxes, fees, exchange rates, and inflation are excluded. Past performance does not guarantee future results. This is not investment advice.
Saving the same $10,000 each year from 1996 to 2025 (S&P 500, including dividends).
People who invested the full amount every year:
Principal: $300,000
At the end of 2005 → $137,000
At the end of 2015 → $452,000
At the end of 2025 → $2,040,000
People who invested half each year and kept half in cash:
Principal: also $300,000
At the end of 2005 → $119,000
At the end of 2015 → $326,000
At the end of 2025 → $1,170,000
That $150,000 in cash sat there for 30 years, earning zero interest.
In the end, it was worth $870,000 less.
I used to be the second kind of person, and thought I was being prudent.
Data: Slickcharts annual total returns for the S&P 500; invested at the beginning of each year. Cash earned zero interest. Taxes, fees, exchange rates, and inflation are excluded. Past performance does not guarantee future results. This is not investment advice.
29
·
--
Invest the same $10,000 each year in the S&P 500 for 30 years, with just one difference: the management fee.
Invest at the beginning of each year from 1996 through the end of 2025 (including dividends).
Index fund with a 0.03% fee:
Principal: $300,000
End of 2005 → $137,000
End of 2015 → $451,000
End of 2025 → $2,027,000
Fund with a 1.5% fee:
Principal: $300,000
End of 2005 → $125,000
End of 2015 → $377,000
End of 2025 → $1,508,000
That’s a difference of just 1.47% per year, but after 30 years you end up with $519,000 less.
The amount lost is far more than the principal.
That money goes to the fund companies.
Data: Slickcharts S&P 500 annual total returns. Fees deducted annually. Taxes, exchange rates, and inflation not included. Past performance does not guarantee future results. This is not investment advice.
Invest the same $10,000 each year in the S&P 500 for 30 years, with just one difference: the management fee.
Invest at the beginning of each year from 1996 through the end of 2025 (including dividends).
Index fund with a 0.03% fee:
Principal: $300,000
End of 2005 → $137,000
End of 2015 → $451,000
End of 2025 → $2,027,000
Fund with a 1.5% fee:
Principal: $300,000
End of 2005 → $125,000
End of 2015 → $377,000
End of 2025 → $1,508,000
That’s a difference of just 1.47% per year, but after 30 years you end up with $519,000 less.
The amount lost is far more than the principal.
That money goes to the fund companies.
Data: Slickcharts S&P 500 annual total returns. Fees deducted annually. Taxes, exchange rates, and inflation not included. Past performance does not guarantee future results. This is not investment advice.
Invest at the beginning of each year from 1996 through the end of 2025 (including dividends).
Index fund with a 0.03% fee:
Principal: $300,000
End of 2005 → $137,000
End of 2015 → $451,000
End of 2025 → $2,027,000
Fund with a 1.5% fee:
Principal: $300,000
End of 2005 → $125,000
End of 2015 → $377,000
End of 2025 → $1,508,000
That’s a difference of just 1.47% per year, but after 30 years you end up with $519,000 less.
The amount lost is far more than the principal.
That money goes to the fund companies.
Data: Slickcharts S&P 500 annual total returns. Fees deducted annually. Taxes, exchange rates, and inflation not included. Past performance does not guarantee future results. This is not investment advice.
25
·
--
Invest 10 years earlier, then stop—or start 10 years later and keep investing until today: who ends up with more?
Invest $10,000 at the beginning of each year in the S&P 500 (including dividends), through the end of 2025.
Started in 1995, invested for 10 years, then never added another dollar:
Principal: $100,000
End of 2004 → $152,000
End of 2008 → $123,000
End of 2019 → $554,000
End of 2025 → $1.288 million
Started in 2005, invested every year for 21 years without missing a year:
Principal: $210,000
End of 2008 → $29,000 (with $40,000 invested so far)
End of 2013 → $151,000
End of 2019 → $393,000
End of 2025 → $1.016 million
They invested twice as much principal, yet ended up $272,000 behind.
Twenty-one years of persistence couldn't catch up with someone else's 10-year head start.
Most people can't stick with it for even 21 years.
Data: Slickcharts annual total returns for the S&P 500; investments made at the beginning of each year. Excludes taxes, fees, currency effects, and inflation. Past performance does not guarantee future results. This is not investment advice.
#定投 #标普500 #USStocks
Invest 10 years earlier, then stop—or start 10 years later and keep investing until today: who ends up with more?
Invest $10,000 at the beginning of each year in the S&P 500 (including dividends), through the end of 2025.
Started in 1995, invested for 10 years, then never added another dollar:
Principal: $100,000
End of 2004 → $152,000
End of 2008 → $123,000
End of 2019 → $554,000
End of 2025 → $1.288 million
Started in 2005, invested every year for 21 years without missing a year:
Principal: $210,000
End of 2008 → $29,000 (with $40,000 invested so far)
End of 2013 → $151,000
End of 2019 → $393,000
End of 2025 → $1.016 million
They invested twice as much principal, yet ended up $272,000 behind.
Twenty-one years of persistence couldn't catch up with someone else's 10-year head start.
Most people can't stick with it for even 21 years.
Data: Slickcharts annual total returns for the S&P 500; investments made at the beginning of each year. Excludes taxes, fees, currency effects, and inflation. Past performance does not guarantee future results. This is not investment advice.
#定投 #标普500 #USStocks
Invest $10,000 at the beginning of each year in the S&P 500 (including dividends), through the end of 2025.
Started in 1995, invested for 10 years, then never added another dollar:
Principal: $100,000
End of 2004 → $152,000
End of 2008 → $123,000
End of 2019 → $554,000
End of 2025 → $1.288 million
Started in 2005, invested every year for 21 years without missing a year:
Principal: $210,000
End of 2008 → $29,000 (with $40,000 invested so far)
End of 2013 → $151,000
End of 2019 → $393,000
End of 2025 → $1.016 million
They invested twice as much principal, yet ended up $272,000 behind.
Twenty-one years of persistence couldn't catch up with someone else's 10-year head start.
Most people can't stick with it for even 21 years.
Data: Slickcharts annual total returns for the S&P 500; investments made at the beginning of each year. Excludes taxes, fees, currency effects, and inflation. Past performance does not guarantee future results. This is not investment advice.
#定投 #标普500 #USStocks
18
·
--
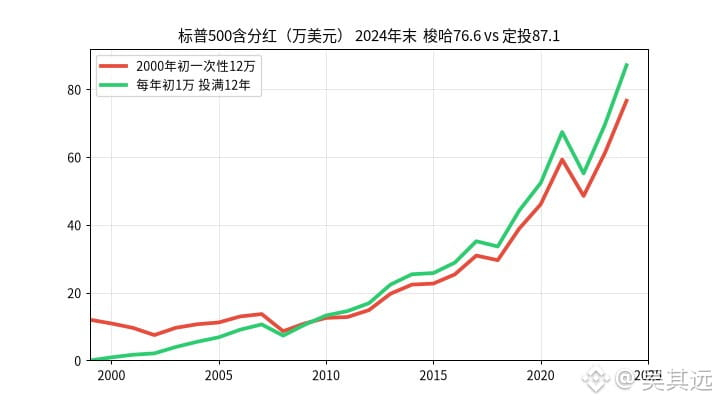
Dollar-cost averaging isn’t about making more money; it’s about still having ammunition when the market is at its peak.
At the start of 2000, invest the same $120,000 in the S&P 500 (including dividends).
The person who invested it all at once:
End of 2000 → $109,000
End of 2002 → $75,000
End of 2005 → $112,000
End of 2008 → $86,000
End of 2011 → $128,000
The person who invested $10,000 at the start of each year for 12 years:
End of 2000: invested $10,000 → $9,000
End of 2002: invested $30,000 → $21,000
End of 2005: invested $60,000 → $68,000
End of 2008: invested $90,000 → $73,000
End of 2011: invested $120,000 → $146,000
End of 2024 → $871,000
(The all-at-once investor had $766,000 at the end of 2024.)
The all-at-once investor was still in the red at the end of 2009 ($109,000).
The dollar-cost averager was hit hard in 2008, but had pulled ahead by 2010.
Same $120,000 initial investment, but a difference of $105,000.
Data: Slickcharts annual total returns for the S&P 500; investments made at the start of each year; taxes, fees, and exchange rates not included. Past performance does not guarantee future results. This is not investment advice.
#定投 #标普500 #USStocks
Dollar-cost averaging isn’t about making more money; it’s about still having ammunition when the market is at its peak.
At the start of 2000, invest the same $120,000 in the S&P 500 (including dividends).
The person who invested it all at once:
End of 2000 → $109,000
End of 2002 → $75,000
End of 2005 → $112,000
End of 2008 → $86,000
End of 2011 → $128,000
The person who invested $10,000 at the start of each year for 12 years:
End of 2000: invested $10,000 → $9,000
End of 2002: invested $30,000 → $21,000
End of 2005: invested $60,000 → $68,000
End of 2008: invested $90,000 → $73,000
End of 2011: invested $120,000 → $146,000
End of 2024 → $871,000
(The all-at-once investor had $766,000 at the end of 2024.)
The all-at-once investor was still in the red at the end of 2009 ($109,000).
The dollar-cost averager was hit hard in 2008, but had pulled ahead by 2010.
Same $120,000 initial investment, but a difference of $105,000.
Data: Slickcharts annual total returns for the S&P 500; investments made at the start of each year; taxes, fees, and exchange rates not included. Past performance does not guarantee future results. This is not investment advice.
#定投 #标普500 #USStocks
At the start of 2000, invest the same $120,000 in the S&P 500 (including dividends).
The person who invested it all at once:
End of 2000 → $109,000
End of 2002 → $75,000
End of 2005 → $112,000
End of 2008 → $86,000
End of 2011 → $128,000
The person who invested $10,000 at the start of each year for 12 years:
End of 2000: invested $10,000 → $9,000
End of 2002: invested $30,000 → $21,000
End of 2005: invested $60,000 → $68,000
End of 2008: invested $90,000 → $73,000
End of 2011: invested $120,000 → $146,000
End of 2024 → $871,000
(The all-at-once investor had $766,000 at the end of 2024.)
The all-at-once investor was still in the red at the end of 2009 ($109,000).
The dollar-cost averager was hit hard in 2008, but had pulled ahead by 2010.
Same $120,000 initial investment, but a difference of $105,000.
Data: Slickcharts annual total returns for the S&P 500; investments made at the start of each year; taxes, fees, and exchange rates not included. Past performance does not guarantee future results. This is not investment advice.
#定投 #标普500 #USStocks
21
·
--
Starting in 2007, invest $10,000 at the beginning of each year in the S&P 500 (including dividends).
In 2008, it fell 37%, and the $20,000 in the account shrank to $13,000.
Two people went their separate ways that year.
The one who stopped investing regularly and switched to holding cash:
End of 2009: Contributions $30,000 → $26,000
End of 2012: Contributions $60,000 → $62,000
End of 2016: Contributions $100,000 → $118,000
End of 2020: Contributions $140,000 → $189,000
End of 2024: Contributions $180,000 → $275,000
The one who gritted their teeth and kept investing regularly:
End of 2009: Contributions $30,000 → $29,000
End of 2012: Contributions $60,000 → $77,000
End of 2016: Contributions $100,000 → $183,000
End of 2020: Contributions $140,000 → $393,000
End of 2024: Contributions $180,000 → $712,000
Both put in $180,000, but the difference was $437,000.
The turning point was not stopping in early 2009.
Based on the S&P 500’s annual total returns including dividends, with investments made at the beginning of each year. Cash earns 0% interest. Taxes and exchange rates are excluded. Past performance does not indicate future results and this is not investment advice.
#定投 #标普500 #USStocks
Starting in 2007, invest $10,000 at the beginning of each year in the S&P 500 (including dividends).
In 2008, it fell 37%, and the $20,000 in the account shrank to $13,000.
Two people went their separate ways that year.
The one who stopped investing regularly and switched to holding cash:
End of 2009: Contributions $30,000 → $26,000
End of 2012: Contributions $60,000 → $62,000
End of 2016: Contributions $100,000 → $118,000
End of 2020: Contributions $140,000 → $189,000
End of 2024: Contributions $180,000 → $275,000
The one who gritted their teeth and kept investing regularly:
End of 2009: Contributions $30,000 → $29,000
End of 2012: Contributions $60,000 → $77,000
End of 2016: Contributions $100,000 → $183,000
End of 2020: Contributions $140,000 → $393,000
End of 2024: Contributions $180,000 → $712,000
Both put in $180,000, but the difference was $437,000.
The turning point was not stopping in early 2009.
Based on the S&P 500’s annual total returns including dividends, with investments made at the beginning of each year. Cash earns 0% interest. Taxes and exchange rates are excluded. Past performance does not indicate future results and this is not investment advice.
#定投 #标普500 #USStocks
In 2008, it fell 37%, and the $20,000 in the account shrank to $13,000.
Two people went their separate ways that year.
The one who stopped investing regularly and switched to holding cash:
End of 2009: Contributions $30,000 → $26,000
End of 2012: Contributions $60,000 → $62,000
End of 2016: Contributions $100,000 → $118,000
End of 2020: Contributions $140,000 → $189,000
End of 2024: Contributions $180,000 → $275,000
The one who gritted their teeth and kept investing regularly:
End of 2009: Contributions $30,000 → $29,000
End of 2012: Contributions $60,000 → $77,000
End of 2016: Contributions $100,000 → $183,000
End of 2020: Contributions $140,000 → $393,000
End of 2024: Contributions $180,000 → $712,000
Both put in $180,000, but the difference was $437,000.
The turning point was not stopping in early 2009.
Based on the S&P 500’s annual total returns including dividends, with investments made at the beginning of each year. Cash earns 0% interest. Taxes and exchange rates are excluded. Past performance does not indicate future results and this is not investment advice.
#定投 #标普500 #USStocks
14
·
--
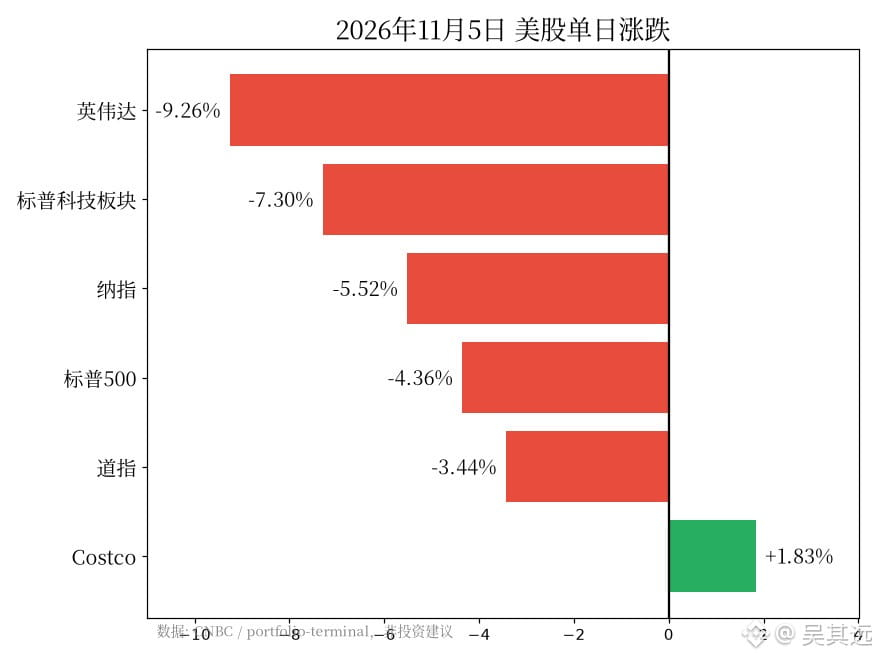
Thursday, November 5: one day on Wall Street
Nasdaq -5.52%
S&P 500 -4.36%
Dow -3.44%
Nvidia -9.26%
S&P tech sector -7.30%, its worst day since March 2020
The Magnificent Seven lost over $1 trillion in market value in a single day
Meanwhile, on the other side:
Costco +1.83%
416 NYSE stocks rose, while 2,344 fell
Nvidia is down for the year, -2.6%
The S&P closed at 7353.73, just 5.95% below its October 6 record high
The Nasdaq is more than 10% below its October 6 high, entering correction territory
The tech sector had its worst day since March 2020, while the S&P is still just 6% off its high.
Those panicking are the ones who went all-in chasing AI. Those investing a fixed amount in the S&P every month bought near the lowest closing price since July 29.
Data: CNBC, portfolio-terminal closing statistics for November 5. Not investment advice.
#美股 #英伟达 #Nasdaq
Thursday, November 5: one day on Wall Street
Nasdaq -5.52%
S&P 500 -4.36%
Dow -3.44%
Nvidia -9.26%
S&P tech sector -7.30%, its worst day since March 2020
The Magnificent Seven lost over $1 trillion in market value in a single day
Meanwhile, on the other side:
Costco +1.83%
416 NYSE stocks rose, while 2,344 fell
Nvidia is down for the year, -2.6%
The S&P closed at 7353.73, just 5.95% below its October 6 record high
The Nasdaq is more than 10% below its October 6 high, entering correction territory
The tech sector had its worst day since March 2020, while the S&P is still just 6% off its high.
Those panicking are the ones who went all-in chasing AI. Those investing a fixed amount in the S&P every month bought near the lowest closing price since July 29.
Data: CNBC, portfolio-terminal closing statistics for November 5. Not investment advice.
#美股 #英伟达 #Nasdaq
Nasdaq -5.52%
S&P 500 -4.36%
Dow -3.44%
Nvidia -9.26%
S&P tech sector -7.30%, its worst day since March 2020
The Magnificent Seven lost over $1 trillion in market value in a single day
Meanwhile, on the other side:
Costco +1.83%
416 NYSE stocks rose, while 2,344 fell
Nvidia is down for the year, -2.6%
The S&P closed at 7353.73, just 5.95% below its October 6 record high
The Nasdaq is more than 10% below its October 6 high, entering correction territory
The tech sector had its worst day since March 2020, while the S&P is still just 6% off its high.
Those panicking are the ones who went all-in chasing AI. Those investing a fixed amount in the S&P every month bought near the lowest closing price since July 29.
Data: CNBC, portfolio-terminal closing statistics for November 5. Not investment advice.
#美股 #英伟达 #Nasdaq
59
·
--
Someone who went all in on the S&P 500 with 120,000 at the start of 2000:
End of 2000: 109,000
End of 2001: 96,000
End of 2002: 75,000
End of 2006: 130,000
End of 2008: 86,000
End of 2010: 126,000
End of 2013: 197,000
The same 120,000, invested in 10,000 installments at the start of each year:
End of 2000: 9,000 (10,000 invested)
End of 2002: 21,000 (30,000 invested)
End of 2006: 91,000 (70,000 invested)
End of 2008: 73,000 (90,000 invested)
End of 2010: 133,000 (110,000 invested)
End of 2013: 224,000 (all 120,000 invested)
It pulled ahead in 2010 and stayed ahead after that.
But this is cherry-picking the worst possible starting point. Vanguard statistics show that from 1976 to 2022, lump-sum investing outperformed dollar-cost averaging about 68% of the time.
Dollar-cost averaging wins by helping you stay invested, not through the math.
Data: Slickcharts S&P 500 annual total returns (including dividends), compounded annually based on year-end figures. Not investment advice.
#定投 #标普500 #USstocks
Someone who went all in on the S&P 500 with 120,000 at the start of 2000:
End of 2000: 109,000
End of 2001: 96,000
End of 2002: 75,000
End of 2006: 130,000
End of 2008: 86,000
End of 2010: 126,000
End of 2013: 197,000
The same 120,000, invested in 10,000 installments at the start of each year:
End of 2000: 9,000 (10,000 invested)
End of 2002: 21,000 (30,000 invested)
End of 2006: 91,000 (70,000 invested)
End of 2008: 73,000 (90,000 invested)
End of 2010: 133,000 (110,000 invested)
End of 2013: 224,000 (all 120,000 invested)
It pulled ahead in 2010 and stayed ahead after that.
But this is cherry-picking the worst possible starting point. Vanguard statistics show that from 1976 to 2022, lump-sum investing outperformed dollar-cost averaging about 68% of the time.
Dollar-cost averaging wins by helping you stay invested, not through the math.
Data: Slickcharts S&P 500 annual total returns (including dividends), compounded annually based on year-end figures. Not investment advice.
#定投 #标普500 #USstocks
End of 2000: 109,000
End of 2001: 96,000
End of 2002: 75,000
End of 2006: 130,000
End of 2008: 86,000
End of 2010: 126,000
End of 2013: 197,000
The same 120,000, invested in 10,000 installments at the start of each year:
End of 2000: 9,000 (10,000 invested)
End of 2002: 21,000 (30,000 invested)
End of 2006: 91,000 (70,000 invested)
End of 2008: 73,000 (90,000 invested)
End of 2010: 133,000 (110,000 invested)
End of 2013: 224,000 (all 120,000 invested)
It pulled ahead in 2010 and stayed ahead after that.
But this is cherry-picking the worst possible starting point. Vanguard statistics show that from 1976 to 2022, lump-sum investing outperformed dollar-cost averaging about 68% of the time.
Dollar-cost averaging wins by helping you stay invested, not through the math.
Data: Slickcharts S&P 500 annual total returns (including dividends), compounded annually based on year-end figures. Not investment advice.
#定投 #标普500 #USstocks
36
Log in to explore more content
Join global crypto users on Binance Square
⚡️ Get latest and useful information about crypto.
💬 Trusted by the world’s largest crypto exchange.
👍 Discover real insights from verified creators.
Email / Phone number
Trending Topics
JobsReportRaisesHikeOdds
3,725 views
162 Discussing
TradFi News | US Adds 165,000 Jobs in October, More Than Double the 65,000 Forecast, as Unemployment Falls to 4.1%
Binance News
·6 Likes
·4.7k views
US Data Center Rules May Constrain AI Expansion
875 views
29 Discussing
CanUSStocksReboundAfterNonfarmPayrolls?
15,930 views
413 Discussing