

币圈十二叔
5.2k Posts

币圈十二叔
Report
Block User
量化交易员🤠量化带单中欢迎跟单🤖币安手续费八折返佣码: SR988
High-Frequency Trader
1.2 Years
12 Following
1.1K+ Followers
431 Liked
Posts
All
Quotes
Videos
·
--
Guys, yesterday’s closing numbers are in. +$13.94 for the day, all 4 trades won, a 100% win rate. Not a lot of money, but we got the direction right.
The biggest gains came from the public portfolio: +$13.38, accounting for almost all the profits. $TSLL alone brought in +$13.00, or +0.42%, and $SNDK added another +$0.38. The flow of funds in U.S. stocks is favorable, and the trend is still intact. I can hold my positions with confidence, and the money will come in time. Pick the right assets, then leave the rest to time.
The private portfolio made +$0.27, and the signal portfolio made +$0.29—both from trades on $SOL . A profit is a profit, but this is so little it’s almost like making nothing 😅 Altcoins didn’t make any meaningful moves, and I didn’t force myself to add to my positions. I’d rather make a small profit than open trades recklessly.
The biggest thing to reflect on: all four trades were closed passively via force_exit, with not a single active take-profit. Risk controls hit the close button for me, which shows my take-profit plan didn’t keep pace with the market. Luck can bring small wins; discipline brings big ones.
Don’t get carried away by a 100% win rate—the sample is only 4 trades, so it has limited value as a benchmark 👍 Don’t be afraid to take action, but position sizing always comes before emotion.
#每日战报 #十二叔 #吃肉
Guys, yesterday’s closing numbers are in. +$13.94 for the day, all 4 trades won, a 100% win rate. Not a lot of money, but we got the direction right.
The biggest gains came from the public portfolio: +$13.38, accounting for almost all the profits. $TSLL alone brought in +$13.00, or +0.42%, and $SNDK added another +$0.38. The flow of funds in U.S. stocks is favorable, and the trend is still intact. I can hold my positions with confidence, and the money will come in time. Pick the right assets, then leave the rest to time.
The private portfolio made +$0.27, and the signal portfolio made +$0.29—both from trades on $SOL . A profit is a profit, but this is so little it’s almost like making nothing 😅 Altcoins didn’t make any meaningful moves, and I didn’t force myself to add to my positions. I’d rather make a small profit than open trades recklessly.
The biggest thing to reflect on: all four trades were closed passively via force_exit, with not a single active take-profit. Risk controls hit the close button for me, which shows my take-profit plan didn’t keep pace with the market. Luck can bring small wins; discipline brings big ones.
Don’t get carried away by a 100% win rate—the sample is only 4 trades, so it has limited value as a benchmark 👍 Don’t be afraid to take action, but position sizing always comes before emotion.
#每日战报 #十二叔 #吃肉
The biggest gains came from the public portfolio: +$13.38, accounting for almost all the profits. $TSLL alone brought in +$13.00, or +0.42%, and $SNDK added another +$0.38. The flow of funds in U.S. stocks is favorable, and the trend is still intact. I can hold my positions with confidence, and the money will come in time. Pick the right assets, then leave the rest to time.
The private portfolio made +$0.27, and the signal portfolio made +$0.29—both from trades on $SOL . A profit is a profit, but this is so little it’s almost like making nothing 😅 Altcoins didn’t make any meaningful moves, and I didn’t force myself to add to my positions. I’d rather make a small profit than open trades recklessly.
The biggest thing to reflect on: all four trades were closed passively via force_exit, with not a single active take-profit. Risk controls hit the close button for me, which shows my take-profit plan didn’t keep pace with the market. Luck can bring small wins; discipline brings big ones.
Don’t get carried away by a 100% win rate—the sample is only 4 trades, so it has limited value as a benchmark 👍 Don’t be afraid to take action, but position sizing always comes before emotion.
#每日战报 #十二叔 #吃肉
1
·
--
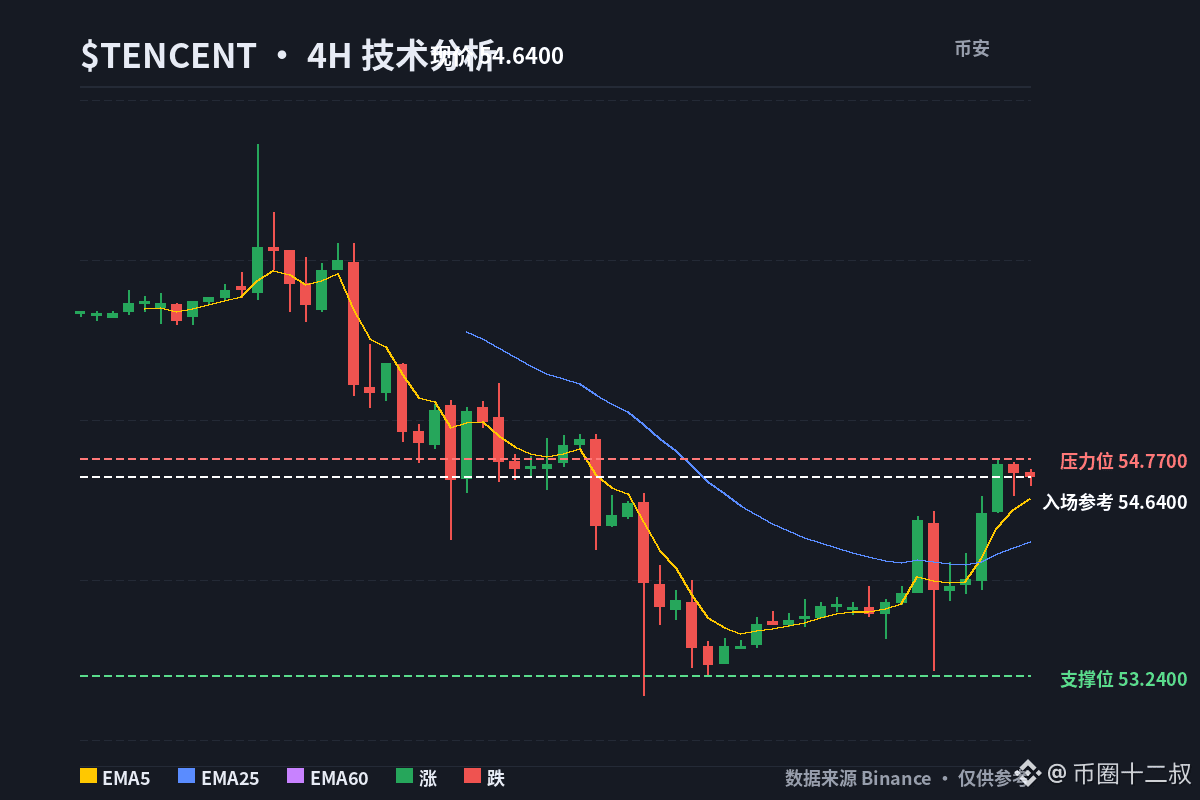
I saw that a platform had listed $TENCENT for 10x leveraged contracts. It was its ninth market, and io:TCNT had open interest of around $42,000.
On October 1, when Hong Kong markets were closed for National Day, FT reported that $TENCENT was going to rent 100,000 AI chips from Oracle for about $7 billion.
The stock price had barely had time to react to the news.
I saw that a platform had listed $TENCENT for 10x leveraged contracts. It was its ninth market, and io:TCNT had open interest of around $42,000.
On October 1, when Hong Kong markets were closed for National Day, FT reported that $TENCENT was going to rent 100,000 AI chips from Oracle for about $7 billion.
The stock price had barely had time to react to the news.
On October 1, when Hong Kong markets were closed for National Day, FT reported that $TENCENT was going to rent 100,000 AI chips from Oracle for about $7 billion.
The stock price had barely had time to react to the news.
22
·
--
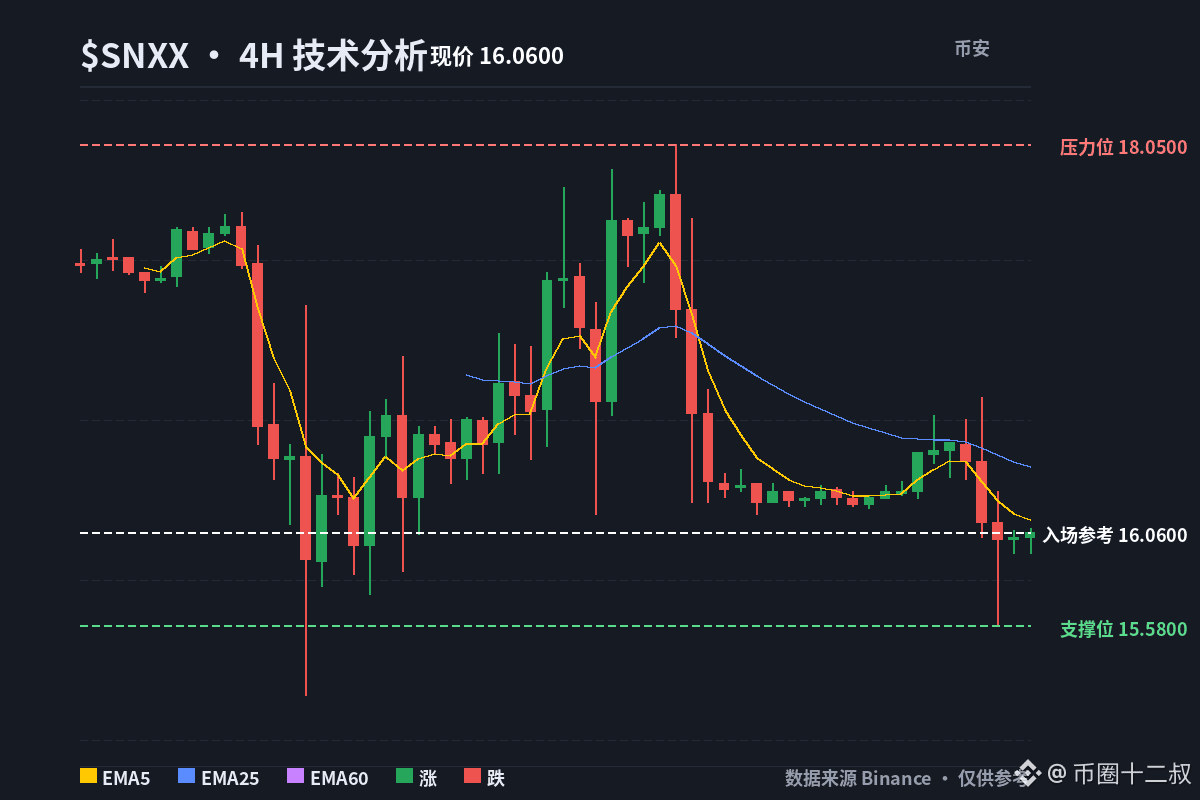
$SNXX Today's bearish options activity is pretty interesting: the October 9 $15.50 puts were swept twice.
$32,500 traded, at $0.65 per contract, with volume 1.4 times open interest.
The current price is $16.27. Buyers were aggressive, effectively betting that it will fall to $14.85 in 7 days just to break even—that's 8.7% downside from the current price.
It's not a lot of money, but the direction is clear.
I only watch the flow, not the noise.
$SNXX Today's bearish options activity is pretty interesting: the October 9 $15.50 puts were swept twice.
$32,500 traded, at $0.65 per contract, with volume 1.4 times open interest.
The current price is $16.27. Buyers were aggressive, effectively betting that it will fall to $14.85 in 7 days just to break even—that's 8.7% downside from the current price.
It's not a lot of money, but the direction is clear.
I only watch the flow, not the noise.
$32,500 traded, at $0.65 per contract, with volume 1.4 times open interest.
The current price is $16.27. Buyers were aggressive, effectively betting that it will fall to $14.85 in 7 days just to break even—that's 8.7% downside from the current price.
It's not a lot of money, but the direction is clear.
I only watch the flow, not the noise.
14
·
--
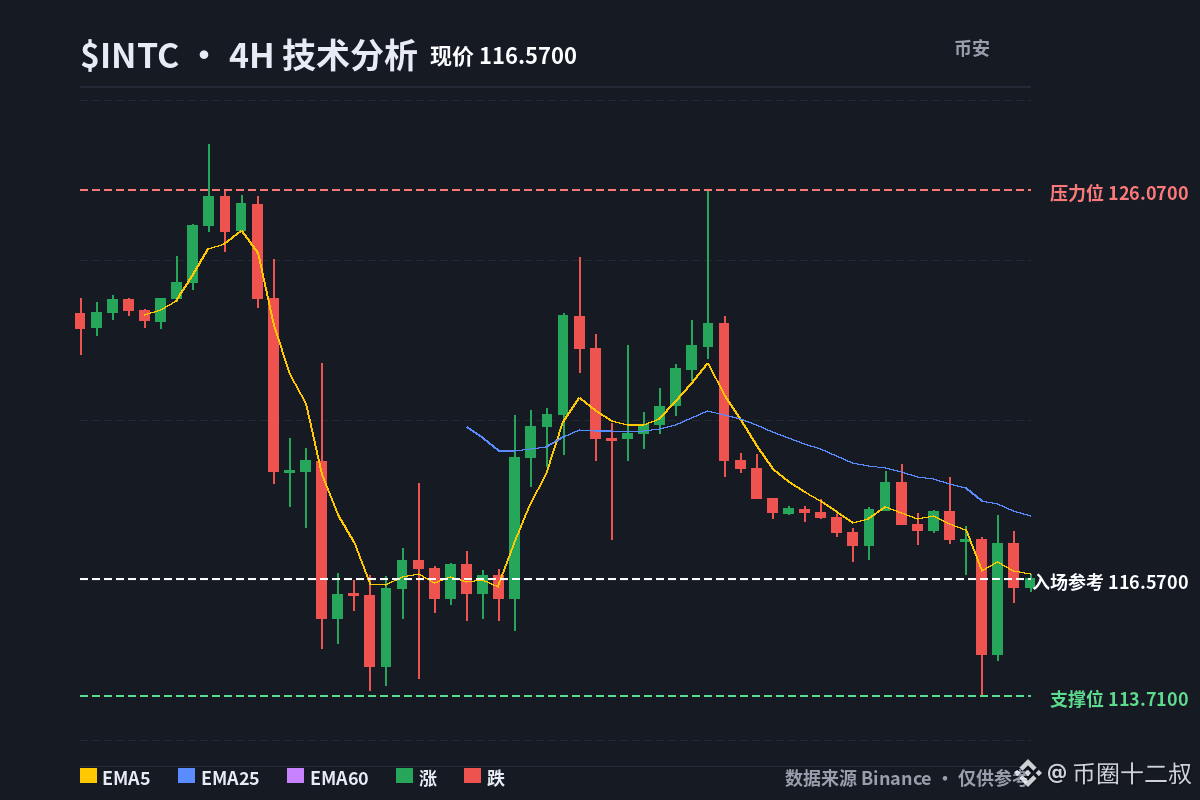
$NVDA hit a new all-time high again today. This trend is clearly telling you that $MU and $INTC are next.
$NVDA hit a new all-time high again today. This trend is clearly telling you that $MU and $INTC are next.
55
·
--
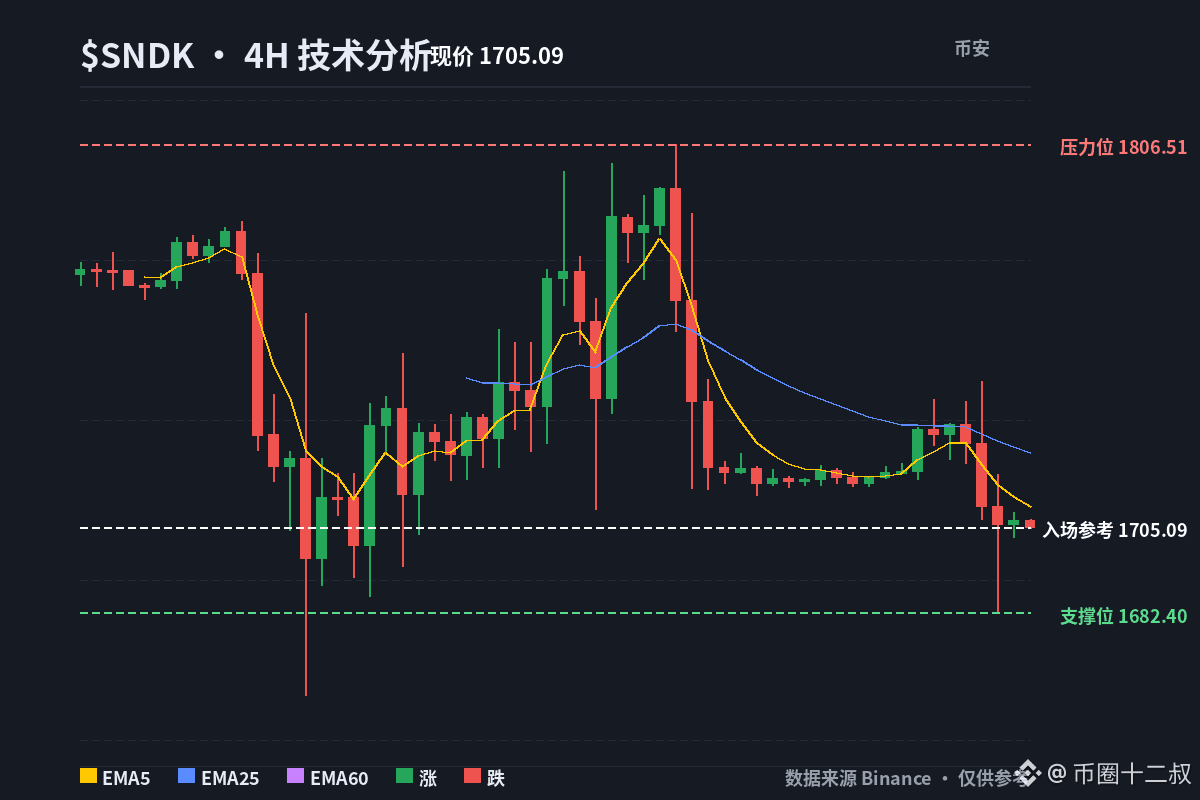
$SNDK fell today, even though the broader market was clearly up.
I took a look, and it seems the money today was mostly flowing into big-cap names in big tech and AI, while NAND and storage didn’t get a turn.
SNDK itself hasn’t had any meaningful bad news come out, and I still think the fundamentals for NAND and AI storage are pretty solid.
$SNDK fell today, even though the broader market was clearly up.
I took a look, and it seems the money today was mostly flowing into big-cap names in big tech and AI, while NAND and storage didn’t get a turn.
SNDK itself hasn’t had any meaningful bad news come out, and I still think the fundamentals for NAND and AI storage are pretty solid.
I took a look, and it seems the money today was mostly flowing into big-cap names in big tech and AI, while NAND and storage didn’t get a turn.
SNDK itself hasn’t had any meaningful bad news come out, and I still think the fundamentals for NAND and AI storage are pretty solid.
92
·
--
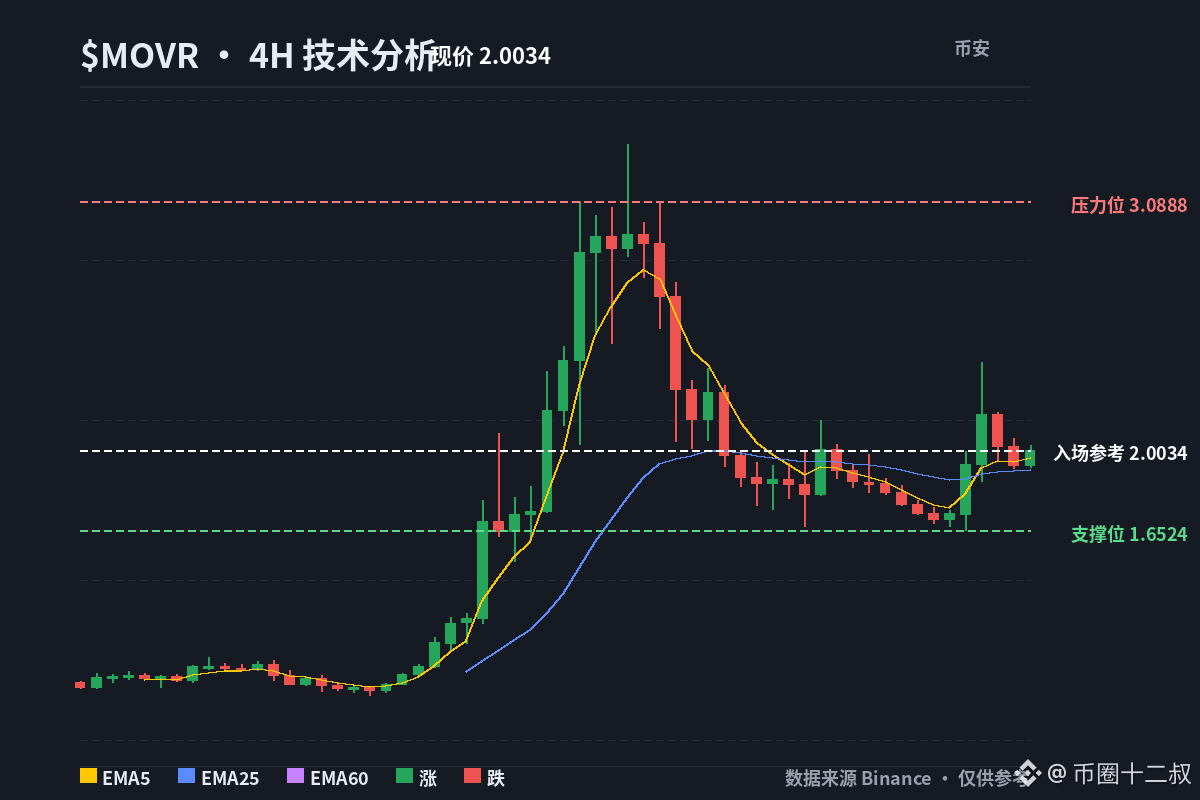
$MOVR has caught the attention of several media outlets over the past couple of days. TokenPost covered its gain of over 50%, CoinDCX said the rally was impressive, and BeInCrypto specifically mentioned that whales were accumulating.
Honestly, it’s pretty rare for a coin that still has a Binance monitoring tag to get this much exposure.
$MOVR has caught the attention of several media outlets over the past couple of days. TokenPost covered its gain of over 50%, CoinDCX said the rally was impressive, and BeInCrypto specifically mentioned that whales were accumulating.
Honestly, it’s pretty rare for a coin that still has a Binance monitoring tag to get this much exposure.
Honestly, it’s pretty rare for a coin that still has a Binance monitoring tag to get this much exposure.
49
·
--
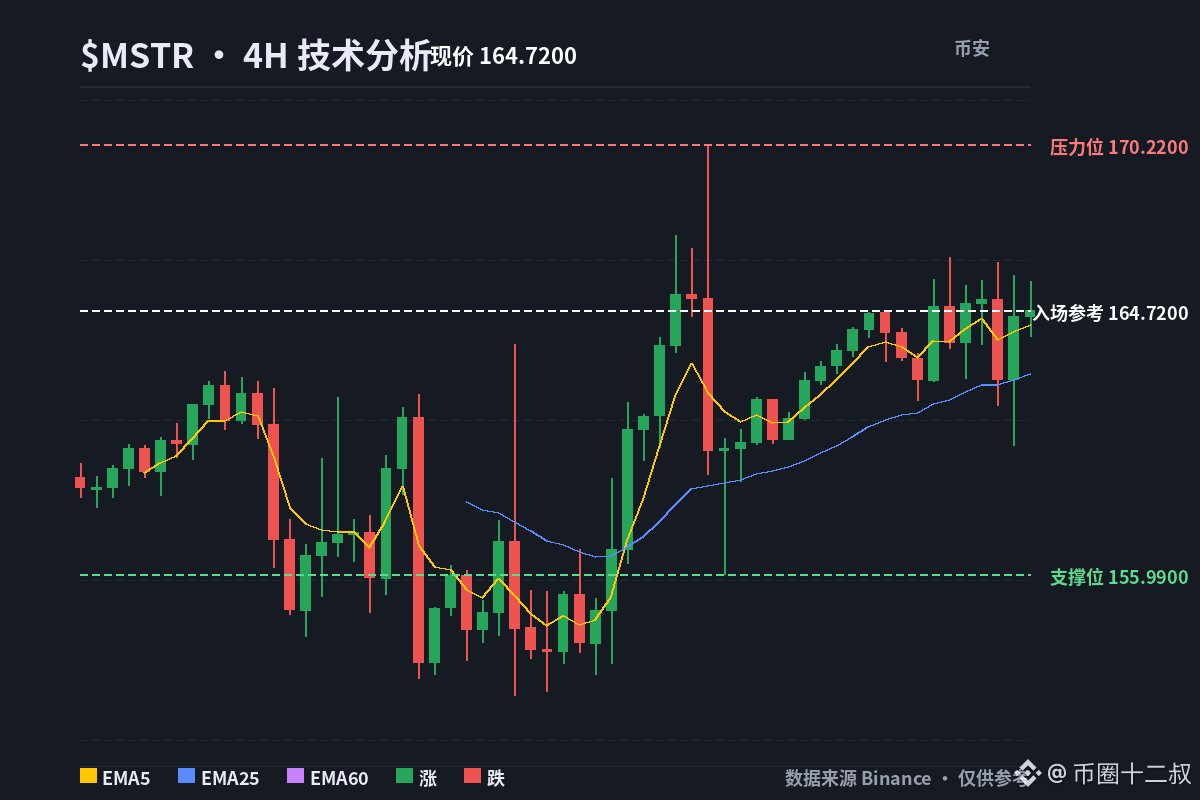
The composite trend strength of $BTC is still rising, at 0.96. Basically, 96% of the indicators are in agreement that the outlook is bullish.
For example, $MSTR , the high-beta asset I've been keeping an eye on that amplifies moves in $BTC , has also shifted from range-bound to bullish according to my analysis.
I've had a position for a long time. This time, it's on a longer-term cycle.
The composite trend strength of $BTC is still rising, at 0.96. Basically, 96% of the indicators are in agreement that the outlook is bullish.
For example, $MSTR , the high-beta asset I've been keeping an eye on that amplifies moves in $BTC , has also shifted from range-bound to bullish according to my analysis.
I've had a position for a long time. This time, it's on a longer-term cycle.
For example, $MSTR , the high-beta asset I've been keeping an eye on that amplifies moves in $BTC , has also shifted from range-bound to bullish according to my analysis.
I've had a position for a long time. This time, it's on a longer-term cycle.
69
·
--
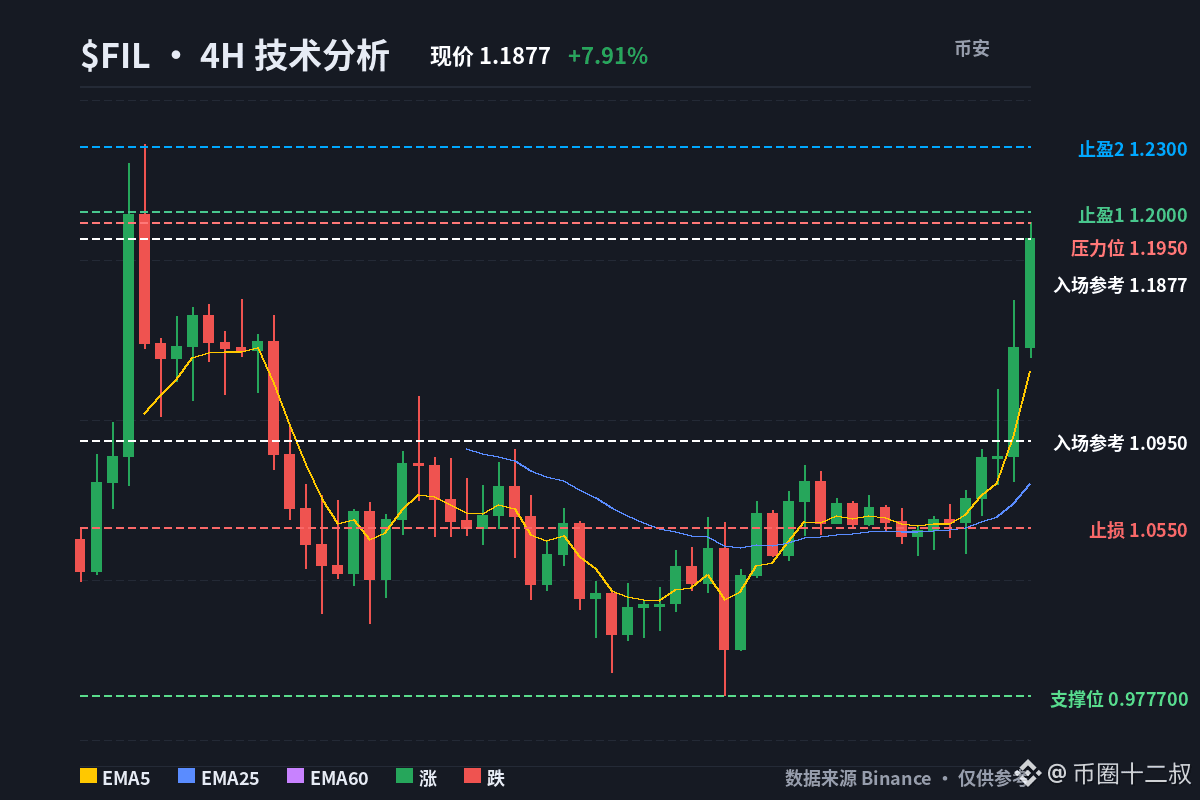
$FIL 24h +7.91%, ranked 15th on the gainers list. OI of 281M weighs on a market cap of 975M, meaning leverage is about 28.8%—that’s a hefty position. I’d rather not chase it.
My plan is simple: I’ll wait for a pullback to around 1.095 to go long, and if it drops below 1.055, I’ll admit I’m wrong and exit.
First, a note on the figures: the order book shows 1.1325, while the 4h candlestick snapshot is 1.19—a difference of about 5%. I won’t chase based on a rounded price; I’ll calculate the risk/reward using the live price, around $1.13.
Here’s the technical picture: 4h EMA5 is 1.1268, EMA25 is 1.0753, and EMA60 is 1.0700; daily EMA5 is 1.0979 and EMA25 is 0.9807. They’re all in a bullish alignment, so the trend is still intact. The problem is that 4h RSI7 is already 89.8, daily RSI7 is 74.5, and volatility over the last 3 4h candles is 5.51%. The trend deserves respect, but at this price, the risk/reward for chasing longs has been seriously squeezed.
Sentiment is the key. The funding rate is +0.06%, so it’s positive and longs are paying. The account long/short ratio is 1.586, and the top-trader position ratio is 2.909. Retail and the big players are on the same side this time, all crowded into longs. OI/market cap is 28.8%, so leverage is substantial. This is a classic setup where longs are paying protection money—which side gives in first? If price doesn’t push higher, those paying the protection money will be the first to buckle, and a pullback can come faster than expected. So I’d rather wait for support on a pullback than carry someone else’s bags above 1.13.
Meanwhile, BTC is down 0.14% and ALL is down 0.96%. $FIL is moving independently against the broader market, which deserves respect, but without the broader market to support it during a downturn, an independent move can become even more sentiment-driven. The contract has been listed for 2180 days, so liquidity in this established coin is mature—but with heavy leverage, sentiment can still turn quickly.
📊 Direction: Wait for a pullback to go long
💰 Entry reference: Around 1.095 (support at the daily EMA5 + stabilization after a pullback)
🛑 Stop loss: 1.055 (a break below the 4h EMA25 area invalidates the bullish thesis; admit I’m wrong and exit)
🎯 Take profit 1: 1.20 (nearby psychological resistance)
🎯 Take profit 2: 1.23 (previous high in the 4h/daily range)
The bulls may be willing to pay protection money, but that doesn’t mean Uncle Twelve is willing to carry their bags.
Are you waiting to go long on a pullback to 1.095, or betting that the bulls will admit they’re wrong if it breaks below 1.055? Pick one.
$FIL #技术分析 #十二叔
$FIL 24h +7.91%, ranked 15th on the gainers list. OI of 281M weighs on a market cap of 975M, meaning leverage is about 28.8%—that’s a hefty position. I’d rather not chase it.
My plan is simple: I’ll wait for a pullback to around 1.095 to go long, and if it drops below 1.055, I’ll admit I’m wrong and exit.
First, a note on the figures: the order book shows 1.1325, while the 4h candlestick snapshot is 1.19—a difference of about 5%. I won’t chase based on a rounded price; I’ll calculate the risk/reward using the live price, around $1.13.
Here’s the technical picture: 4h EMA5 is 1.1268, EMA25 is 1.0753, and EMA60 is 1.0700; daily EMA5 is 1.0979 and EMA25 is 0.9807. They’re all in a bullish alignment, so the trend is still intact. The problem is that 4h RSI7 is already 89.8, daily RSI7 is 74.5, and volatility over the last 3 4h candles is 5.51%. The trend deserves respect, but at this price, the risk/reward for chasing longs has been seriously squeezed.
Sentiment is the key. The funding rate is +0.06%, so it’s positive and longs are paying. The account long/short ratio is 1.586, and the top-trader position ratio is 2.909. Retail and the big players are on the same side this time, all crowded into longs. OI/market cap is 28.8%, so leverage is substantial. This is a classic setup where longs are paying protection money—which side gives in first? If price doesn’t push higher, those paying the protection money will be the first to buckle, and a pullback can come faster than expected. So I’d rather wait for support on a pullback than carry someone else’s bags above 1.13.
Meanwhile, BTC is down 0.14% and ALL is down 0.96%. $FIL is moving independently against the broader market, which deserves respect, but without the broader market to support it during a downturn, an independent move can become even more sentiment-driven. The contract has been listed for 2180 days, so liquidity in this established coin is mature—but with heavy leverage, sentiment can still turn quickly.
📊 Direction: Wait for a pullback to go long
💰 Entry reference: Around 1.095 (support at the daily EMA5 + stabilization after a pullback)
🛑 Stop loss: 1.055 (a break below the 4h EMA25 area invalidates the bullish thesis; admit I’m wrong and exit)
🎯 Take profit 1: 1.20 (nearby psychological resistance)
🎯 Take profit 2: 1.23 (previous high in the 4h/daily range)
The bulls may be willing to pay protection money, but that doesn’t mean Uncle Twelve is willing to carry their bags.
Are you waiting to go long on a pullback to 1.095, or betting that the bulls will admit they’re wrong if it breaks below 1.055? Pick one.
$FIL #技术分析 #十二叔
My plan is simple: I’ll wait for a pullback to around 1.095 to go long, and if it drops below 1.055, I’ll admit I’m wrong and exit.
First, a note on the figures: the order book shows 1.1325, while the 4h candlestick snapshot is 1.19—a difference of about 5%. I won’t chase based on a rounded price; I’ll calculate the risk/reward using the live price, around $1.13.
Here’s the technical picture: 4h EMA5 is 1.1268, EMA25 is 1.0753, and EMA60 is 1.0700; daily EMA5 is 1.0979 and EMA25 is 0.9807. They’re all in a bullish alignment, so the trend is still intact. The problem is that 4h RSI7 is already 89.8, daily RSI7 is 74.5, and volatility over the last 3 4h candles is 5.51%. The trend deserves respect, but at this price, the risk/reward for chasing longs has been seriously squeezed.
Sentiment is the key. The funding rate is +0.06%, so it’s positive and longs are paying. The account long/short ratio is 1.586, and the top-trader position ratio is 2.909. Retail and the big players are on the same side this time, all crowded into longs. OI/market cap is 28.8%, so leverage is substantial. This is a classic setup where longs are paying protection money—which side gives in first? If price doesn’t push higher, those paying the protection money will be the first to buckle, and a pullback can come faster than expected. So I’d rather wait for support on a pullback than carry someone else’s bags above 1.13.
Meanwhile, BTC is down 0.14% and ALL is down 0.96%. $FIL is moving independently against the broader market, which deserves respect, but without the broader market to support it during a downturn, an independent move can become even more sentiment-driven. The contract has been listed for 2180 days, so liquidity in this established coin is mature—but with heavy leverage, sentiment can still turn quickly.
📊 Direction: Wait for a pullback to go long
💰 Entry reference: Around 1.095 (support at the daily EMA5 + stabilization after a pullback)
🛑 Stop loss: 1.055 (a break below the 4h EMA25 area invalidates the bullish thesis; admit I’m wrong and exit)
🎯 Take profit 1: 1.20 (nearby psychological resistance)
🎯 Take profit 2: 1.23 (previous high in the 4h/daily range)
The bulls may be willing to pay protection money, but that doesn’t mean Uncle Twelve is willing to carry their bags.
Are you waiting to go long on a pullback to 1.095, or betting that the bulls will admit they’re wrong if it breaks below 1.055? Pick one.
$FIL #技术分析 #十二叔
92
·
--
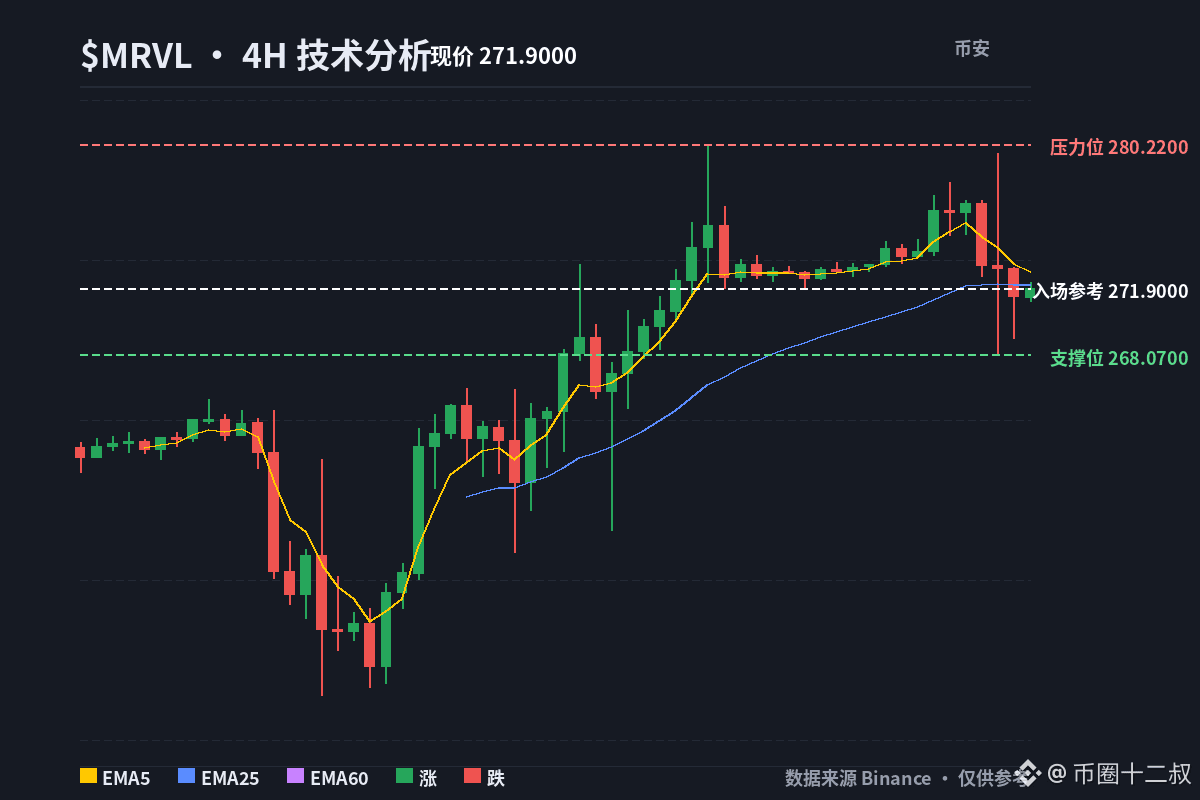
My breakout list has 9 stocks in total, with the upside measured from the top of each stock’s buy range.
$NVDA still has 33 points of upside, $MRVL has 16 points, and $HPE is the strongest at 37 points.
The remaining stocks are also strengthening in sync, all within the 16%–21% range. Overall, this wave of breakouts is quite broad-based. Keep following along with the list I shared earlier.
My breakout list has 9 stocks in total, with the upside measured from the top of each stock’s buy range.
$NVDA still has 33 points of upside, $MRVL has 16 points, and $HPE is the strongest at 37 points.
The remaining stocks are also strengthening in sync, all within the 16%–21% range. Overall, this wave of breakouts is quite broad-based. Keep following along with the list I shared earlier.
$NVDA still has 33 points of upside, $MRVL has 16 points, and $HPE is the strongest at 37 points.
The remaining stocks are also strengthening in sync, all within the 16%–21% range. Overall, this wave of breakouts is quite broad-based. Keep following along with the list I shared earlier.
6
·
--
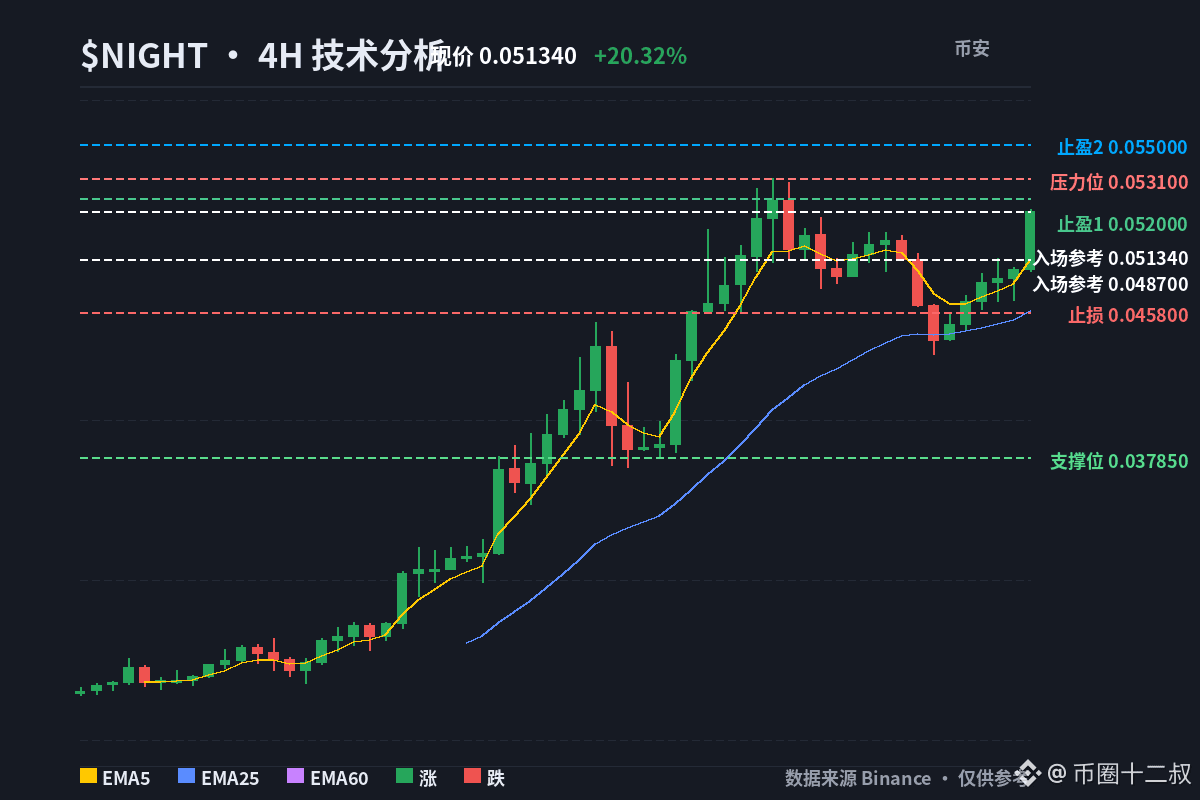
$NIGHT Chasing the pump feels great—until it dumps, then it’s a funeral. Up +20.32% in 24h and climbing to #4 on the gainers’ list, I’m still not chasing. I’m bullish, but I’ll only buy a pullback near 0.0487. If it breaks below 0.0458, I’ll admit defeat.
First, the technicals: the 4h and daily EMAs are both in bullish alignment, with EMA5>EMA25>EMA60. The trend is still intact. But the daily RSI7 is already at 81.1, and the 4h RSI7 is 72.3—both in overbought territory. The current price of 0.05192 is about 6.6% above the 4h EMA5 at 0.04871, so the risk/reward is too thin for chasing here. Volatility over the last three daily candles is 13.91%; one wick could easily shake out anyone buying the top.
Sentiment is worth watching even more closely: the funding rate is +0.0300%, so longs are paying a protection fee. The account long/short ratio is 1.0978, and the top-trader position ratio is 1.9622—big players are more firmly bullish than retail. The catch is that positive funding means longs are crowded. If price pulls back, who’ll be the first to fold? Most likely the most heavily leveraged traders. OI is 42M, market cap is 793M, and OI/market cap is about 5.3%—not extreme, but the contract has only been listed for 299 days, and new coins can turn fast.
BTC is down 0.17% over 24h, and ALL is down 0.96%, while $NIGHT is up 20% against the trend. This independent move deserves respect, but if the tide turns, there’s no broader market support to cushion the fall. My plan: wait for a pullback, then go long near 0.0487 (4h EMA5); stop-loss at 0.0458 (if it breaks below 4h EMA25, I’ll admit defeat); take-profit 1 at 0.0520, take-profit 2 at 0.0550. Position size determines your state of mind—don’t get carried away.
Would you buy the pullback at 0.0487, or admit the bullish thesis is wrong if it breaks below 0.0458? Pick one.
$NIGHT #技术分析 #UncleTwelve
$NIGHT Chasing the pump feels great—until it dumps, then it’s a funeral. Up +20.32% in 24h and climbing to #4 on the gainers’ list, I’m still not chasing. I’m bullish, but I’ll only buy a pullback near 0.0487. If it breaks below 0.0458, I’ll admit defeat.
First, the technicals: the 4h and daily EMAs are both in bullish alignment, with EMA5>EMA25>EMA60. The trend is still intact. But the daily RSI7 is already at 81.1, and the 4h RSI7 is 72.3—both in overbought territory. The current price of 0.05192 is about 6.6% above the 4h EMA5 at 0.04871, so the risk/reward is too thin for chasing here. Volatility over the last three daily candles is 13.91%; one wick could easily shake out anyone buying the top.
Sentiment is worth watching even more closely: the funding rate is +0.0300%, so longs are paying a protection fee. The account long/short ratio is 1.0978, and the top-trader position ratio is 1.9622—big players are more firmly bullish than retail. The catch is that positive funding means longs are crowded. If price pulls back, who’ll be the first to fold? Most likely the most heavily leveraged traders. OI is 42M, market cap is 793M, and OI/market cap is about 5.3%—not extreme, but the contract has only been listed for 299 days, and new coins can turn fast.
BTC is down 0.17% over 24h, and ALL is down 0.96%, while $NIGHT is up 20% against the trend. This independent move deserves respect, but if the tide turns, there’s no broader market support to cushion the fall. My plan: wait for a pullback, then go long near 0.0487 (4h EMA5); stop-loss at 0.0458 (if it breaks below 4h EMA25, I’ll admit defeat); take-profit 1 at 0.0520, take-profit 2 at 0.0550. Position size determines your state of mind—don’t get carried away.
Would you buy the pullback at 0.0487, or admit the bullish thesis is wrong if it breaks below 0.0458? Pick one.
$NIGHT #技术分析 #UncleTwelve
First, the technicals: the 4h and daily EMAs are both in bullish alignment, with EMA5>EMA25>EMA60. The trend is still intact. But the daily RSI7 is already at 81.1, and the 4h RSI7 is 72.3—both in overbought territory. The current price of 0.05192 is about 6.6% above the 4h EMA5 at 0.04871, so the risk/reward is too thin for chasing here. Volatility over the last three daily candles is 13.91%; one wick could easily shake out anyone buying the top.
Sentiment is worth watching even more closely: the funding rate is +0.0300%, so longs are paying a protection fee. The account long/short ratio is 1.0978, and the top-trader position ratio is 1.9622—big players are more firmly bullish than retail. The catch is that positive funding means longs are crowded. If price pulls back, who’ll be the first to fold? Most likely the most heavily leveraged traders. OI is 42M, market cap is 793M, and OI/market cap is about 5.3%—not extreme, but the contract has only been listed for 299 days, and new coins can turn fast.
BTC is down 0.17% over 24h, and ALL is down 0.96%, while $NIGHT is up 20% against the trend. This independent move deserves respect, but if the tide turns, there’s no broader market support to cushion the fall. My plan: wait for a pullback, then go long near 0.0487 (4h EMA5); stop-loss at 0.0458 (if it breaks below 4h EMA25, I’ll admit defeat); take-profit 1 at 0.0520, take-profit 2 at 0.0550. Position size determines your state of mind—don’t get carried away.
Would you buy the pullback at 0.0487, or admit the bullish thesis is wrong if it breaks below 0.0458? Pick one.
$NIGHT #技术分析 #UncleTwelve
59
·
--
Looking at the PEG ratio, undervalued stocks are really piling up—all clustered between 0.1x and 0.6x. You don’t see that every day.
$NVDA is only around 0.5x, $AVGO is down to 0.3x, and $MU is even lower at 0.1x. The rest are lined up in the same range.
There are clearly plenty of bargains here; the question is whether the market agrees.
Looking at the PEG ratio, undervalued stocks are really piling up—all clustered between 0.1x and 0.6x. You don’t see that every day.
$NVDA is only around 0.5x, $AVGO is down to 0.3x, and $MU is even lower at 0.1x. The rest are lined up in the same range.
There are clearly plenty of bargains here; the question is whether the market agrees.
$NVDA is only around 0.5x, $AVGO is down to 0.3x, and $MU is even lower at 0.1x. The rest are lined up in the same range.
There are clearly plenty of bargains here; the question is whether the market agrees.
18
·
--
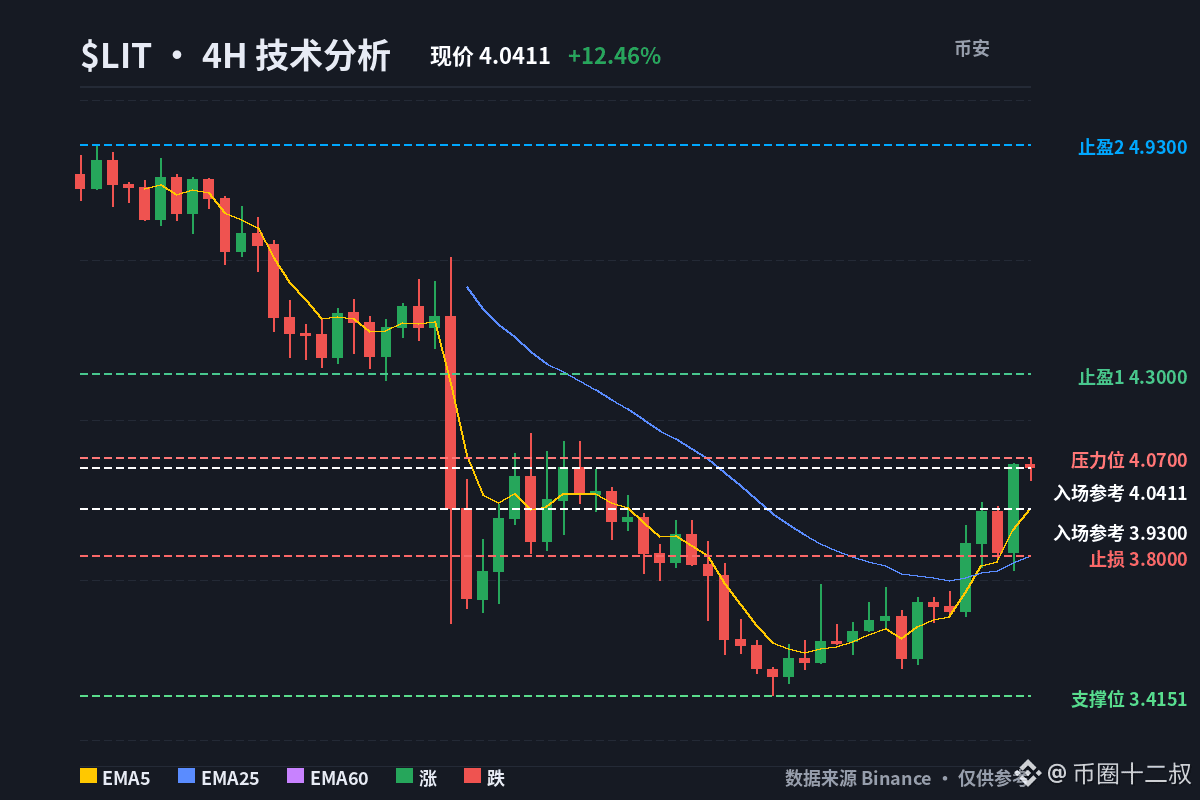
$LIT is stuck below the 4h EMA60 at 4.08, yet it’s up 12.46% over 24h and ranks #8 on the gainers list—the most dangerous price level is right overhead, so I’m not chasing. I’ll wait for a pullback to 3.93 (4h EMA5) to go long; if it breaks below 3.80, I’ll admit defeat. First, a note on the data: the live price from the API is 5.4451, while the candlestick snapshot is 4.04—a full 30% gap. I won’t pretend I don’t see it: EMA and RSI are all based on the candlesticks, so I’m calculating the risk/reward based on the candlestick structure.
What really makes me hold back is positioning. The large-holder position ratio is 3.12, with long positions three times the size of shorts; the account long/short ratio is only 1.0243, so retail is basically sitting it out. What does that tell us? Large holders are pushing ahead with longs on their own, while retail isn’t providing support—there’s no one to take the baton, but no one helping to push it higher either. Then there’s the funding rate: -0.0695%. Shorts are paying a protection fee every 24 hours, so the fuel for a short squeeze is real—but fuel doesn’t mean it’s time to light the match. OI is 498M against a market cap of 1009M, meaning leverage is nearly half the market cap. Get the direction wrong, and things can turn in the blink of an eye. Uncle Twelve doesn’t chase a rally with no one providing support.
Don’t judge the trend by the gains alone. The 4h EMA5 (3.93) has just crossed above the EMA25 (3.80), but price still hasn’t reclaimed the EMA60 (4.08); on the daily chart, the EMA5 is under price, while the EMA25 at 4.30 is still overhead. This is a rebound structure, not a trend reversal. The 4h RSI7 is already at 72.5, while the daily RSI7 is only 47—the short-term timeframe is overheated, and the risk/reward for chasing longs has already thinned out. BTC is up just 0.33%, while the broader market is down 1.22%. $LIT moving against the market is a plus, but with no market support if the tide turns, a pullback could come even faster.
📊 Direction: Wait for a pullback to go long
💰 Entry reference: Around 3.93 (4h EMA5); enter only if the pullback holds above 3.80 and buying support appears
🛑 Stop-loss: 3.80 (below the 4h EMA25); if it breaks below, admit defeat and exit
🎯 Take profit 1: 4.30 (daily EMA25 resistance)
🎯 Take profit 2: 4.93 (4h range high)
A short squeeze being possible doesn’t mean it’s time to chase—the difference between getting in early and being left holding the bag is just one price level.
Would you go long on a pullback and hold at 3.93, or admit defeat on the long side if it breaks below 3.80? Pick one.
$LIT #技术分析 #UncleTwelve
$LIT is stuck below the 4h EMA60 at 4.08, yet it’s up 12.46% over 24h and ranks #8 on the gainers list—the most dangerous price level is right overhead, so I’m not chasing. I’ll wait for a pullback to 3.93 (4h EMA5) to go long; if it breaks below 3.80, I’ll admit defeat. First, a note on the data: the live price from the API is 5.4451, while the candlestick snapshot is 4.04—a full 30% gap. I won’t pretend I don’t see it: EMA and RSI are all based on the candlesticks, so I’m calculating the risk/reward based on the candlestick structure.
What really makes me hold back is positioning. The large-holder position ratio is 3.12, with long positions three times the size of shorts; the account long/short ratio is only 1.0243, so retail is basically sitting it out. What does that tell us? Large holders are pushing ahead with longs on their own, while retail isn’t providing support—there’s no one to take the baton, but no one helping to push it higher either. Then there’s the funding rate: -0.0695%. Shorts are paying a protection fee every 24 hours, so the fuel for a short squeeze is real—but fuel doesn’t mean it’s time to light the match. OI is 498M against a market cap of 1009M, meaning leverage is nearly half the market cap. Get the direction wrong, and things can turn in the blink of an eye. Uncle Twelve doesn’t chase a rally with no one providing support.
Don’t judge the trend by the gains alone. The 4h EMA5 (3.93) has just crossed above the EMA25 (3.80), but price still hasn’t reclaimed the EMA60 (4.08); on the daily chart, the EMA5 is under price, while the EMA25 at 4.30 is still overhead. This is a rebound structure, not a trend reversal. The 4h RSI7 is already at 72.5, while the daily RSI7 is only 47—the short-term timeframe is overheated, and the risk/reward for chasing longs has already thinned out. BTC is up just 0.33%, while the broader market is down 1.22%. $LIT moving against the market is a plus, but with no market support if the tide turns, a pullback could come even faster.
📊 Direction: Wait for a pullback to go long
💰 Entry reference: Around 3.93 (4h EMA5); enter only if the pullback holds above 3.80 and buying support appears
🛑 Stop-loss: 3.80 (below the 4h EMA25); if it breaks below, admit defeat and exit
🎯 Take profit 1: 4.30 (daily EMA25 resistance)
🎯 Take profit 2: 4.93 (4h range high)
A short squeeze being possible doesn’t mean it’s time to chase—the difference between getting in early and being left holding the bag is just one price level.
Would you go long on a pullback and hold at 3.93, or admit defeat on the long side if it breaks below 3.80? Pick one.
$LIT #技术分析 #UncleTwelve
What really makes me hold back is positioning. The large-holder position ratio is 3.12, with long positions three times the size of shorts; the account long/short ratio is only 1.0243, so retail is basically sitting it out. What does that tell us? Large holders are pushing ahead with longs on their own, while retail isn’t providing support—there’s no one to take the baton, but no one helping to push it higher either. Then there’s the funding rate: -0.0695%. Shorts are paying a protection fee every 24 hours, so the fuel for a short squeeze is real—but fuel doesn’t mean it’s time to light the match. OI is 498M against a market cap of 1009M, meaning leverage is nearly half the market cap. Get the direction wrong, and things can turn in the blink of an eye. Uncle Twelve doesn’t chase a rally with no one providing support.
Don’t judge the trend by the gains alone. The 4h EMA5 (3.93) has just crossed above the EMA25 (3.80), but price still hasn’t reclaimed the EMA60 (4.08); on the daily chart, the EMA5 is under price, while the EMA25 at 4.30 is still overhead. This is a rebound structure, not a trend reversal. The 4h RSI7 is already at 72.5, while the daily RSI7 is only 47—the short-term timeframe is overheated, and the risk/reward for chasing longs has already thinned out. BTC is up just 0.33%, while the broader market is down 1.22%. $LIT moving against the market is a plus, but with no market support if the tide turns, a pullback could come even faster.
📊 Direction: Wait for a pullback to go long
💰 Entry reference: Around 3.93 (4h EMA5); enter only if the pullback holds above 3.80 and buying support appears
🛑 Stop-loss: 3.80 (below the 4h EMA25); if it breaks below, admit defeat and exit
🎯 Take profit 1: 4.30 (daily EMA25 resistance)
🎯 Take profit 2: 4.93 (4h range high)
A short squeeze being possible doesn’t mean it’s time to chase—the difference between getting in early and being left holding the bag is just one price level.
Would you go long on a pullback and hold at 3.93, or admit defeat on the long side if it breaks below 3.80? Pick one.
$LIT #技术分析 #UncleTwelve
20
·
--
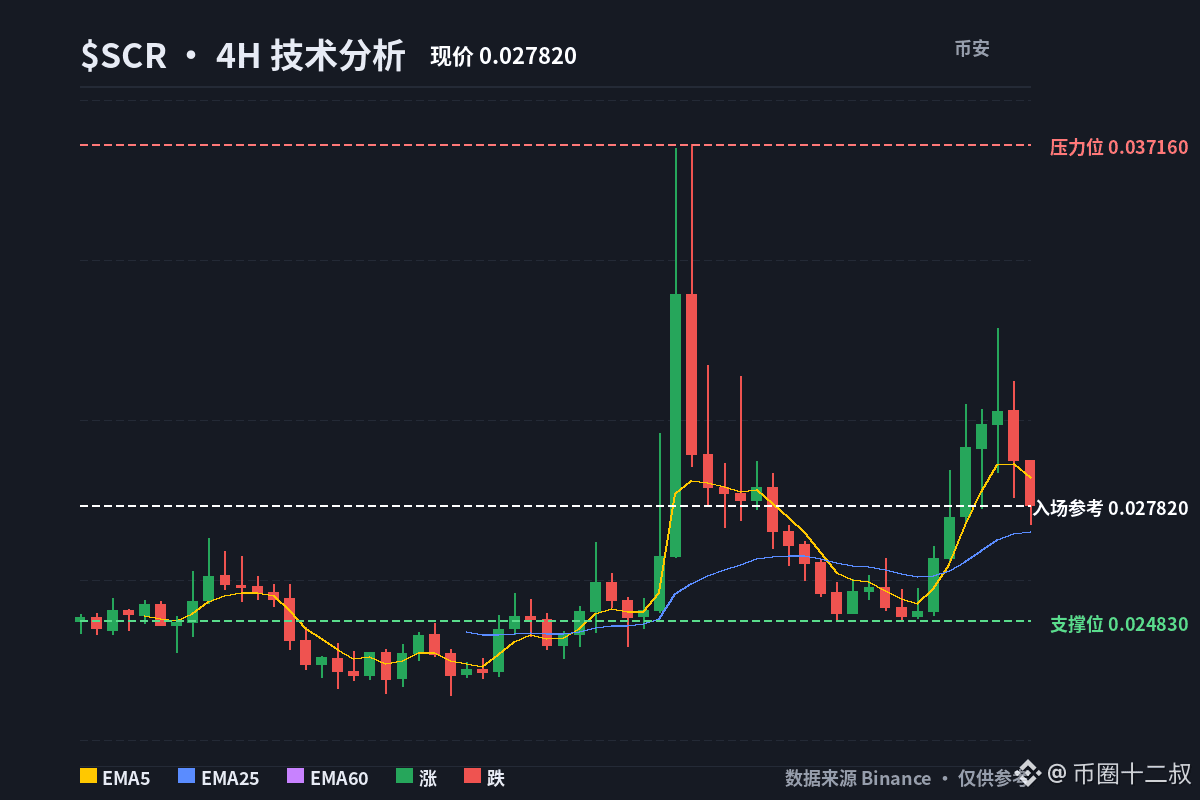
I've been keeping an eye on $SCR lately; the setup looks pretty interesting.
If momentum really picks up, I think there could be a big move ahead.
I'll keep it on my watchlist for now—no need to jump to conclusions. This one might surprise us.
I've been keeping an eye on $SCR lately; the setup looks pretty interesting.
If momentum really picks up, I think there could be a big move ahead.
I'll keep it on my watchlist for now—no need to jump to conclusions. This one might surprise us.
If momentum really picks up, I think there could be a big move ahead.
I'll keep it on my watchlist for now—no need to jump to conclusions. This one might surprise us.
21
·
--
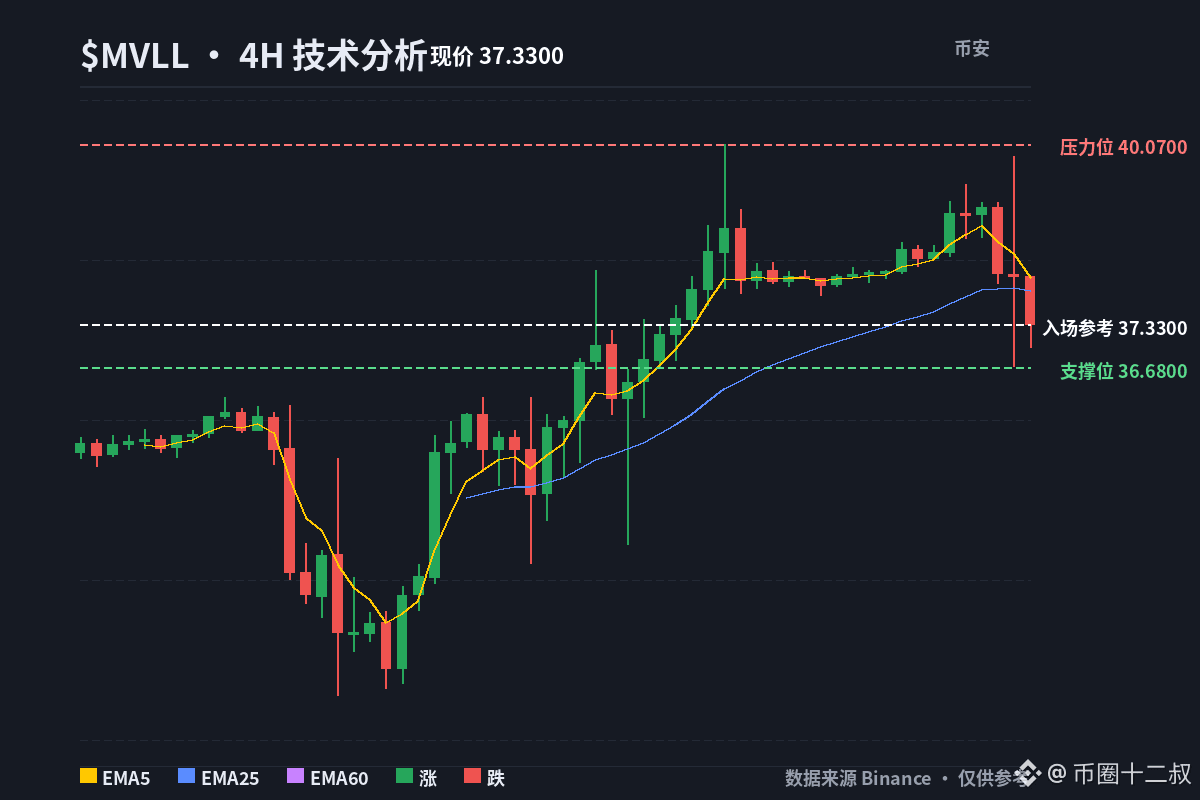
I checked $MVLL: it dropped 4% in just 15 minutes, while volume surged to 4x. This kind of sharp selloff actually makes me cautiously bullish.
My read is that this looks more like a liquidity sweep into a strong demand zone than a selloff trap designed to shake out holders.
So I’m leaning bullish here, rather than letting this 15-minute bearish candle scare me out.
I checked $MVLL : it dropped 4% in just 15 minutes, while volume surged to 4x. This kind of sharp selloff actually makes me cautiously bullish.
My read is that this looks more like a liquidity sweep into a strong demand zone than a selloff trap designed to shake out holders.
So I’m leaning bullish here, rather than letting this 15-minute bearish candle scare me out.
My read is that this looks more like a liquidity sweep into a strong demand zone than a selloff trap designed to shake out holders.
So I’m leaning bullish here, rather than letting this 15-minute bearish candle scare me out.
9
·
--
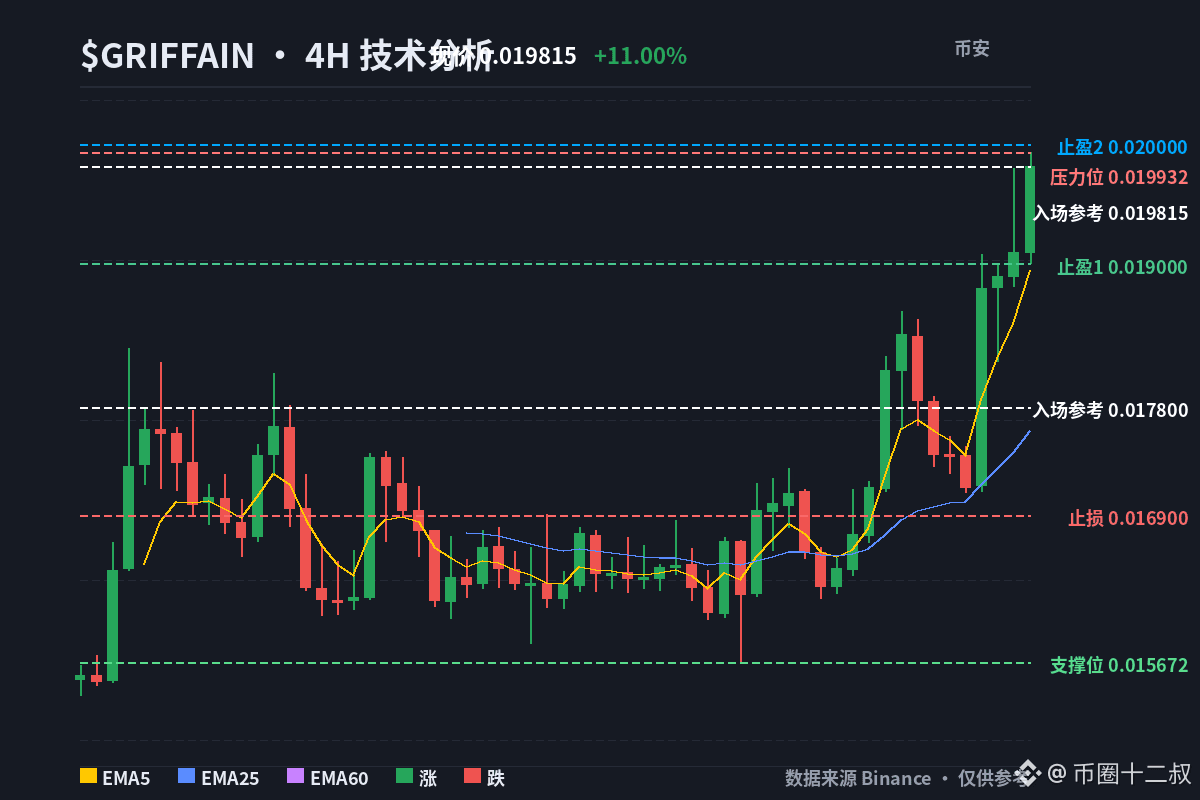
$GRIFFAIN Retail account long/short ratio: 2.66; large-holder position ratio: 1.92. Both sides are leaning long, but retail traders are even more eager to chase the rally than the big players—so at this level, I’d rather not chase. I’ll wait to buy near 0.0178 on a pullback. If it breaks below 0.0169, I’ll admit defeat and get out.
First, let’s see whether this rally is just a fake pump. The last 3 daily candles gained 18.43%, with volatility at 10.63%. Trading volume is also substantial: the latest 4-hour candle saw $719,000 in volume, and the daily total was $3.83 million. The volume is real; this isn’t a low-volume pump. That much is clear. But the current price of 0.018407 has already slipped below the 4-hour EMA5 at 0.018941. The candlestick snapshot shows 0.02 because it’s rounded; I’m using the live price to assess the risk/reward. After spiking higher, price is starting to weaken, so the short-term setup isn’t at its strongest.
The trend is still intact. The 4-hour EMA 5/25/60 values are 0.018941/0.01761/0.016915, and the daily EMA5/25 values are 0.017886/0.015307. The bullish alignment is still in place. The problem is the RSI: 79.6 on the 4-hour chart and 80.7 on the daily chart. Both timeframes are overbought, making the risk/reward too poor to chase.
What really makes me hold back is positioning. The account long/short ratio is 2.66 versus 1.92 for large holders, so retail is even more aggressive than the big players. The funding rate is +0.1324%, meaning longs are paying a premium to stay in. If there’s a pullback, it won’t be the big players who bail first—it’ll be these highly leveraged retail traders. OI is 16M against a market cap of 19M, so leverage accounts for 84%. If the market turns against them, things could reverse very quickly.
BTC is only up +0.31%, while the overall market is down -1.53%. $GRIFFAIN is up +11% on its own, ranking 10th among gainers. The independent price action deserves respect, but the broader market isn’t providing support. When the tide goes out, no one will be there to catch you.
So I’m not chasing at 0.0184. I’ll wait for support near 0.0178, and if it breaks below 0.0169, I’m out.
📊 Direction: Wait for a pullback to go long
💰 Entry reference: Near 0.0178 (between the daily EMA5 at 0.017886 and the 4-hour EMA25 at 0.01761); enter only after the pullback finds support
🛑 Stop-loss: 0.0169 (below the 4-hour EMA60 at 0.016915; if it breaks, admit defeat and exit)
🎯 Take-profit 1: 0.0190 (first target after reclaiming the 4-hour EMA5)
🎯 Take-profit 2: 0.0200 (the previous high and a round-number level)
Would you wait to buy the pullback at 0.0178, or say the bulls are wrong if it breaks below 0.0169? Pick one.
$GRIFFAIN #技术分析 #UncleTwelve
$GRIFFAIN Retail account long/short ratio: 2.66; large-holder position ratio: 1.92. Both sides are leaning long, but retail traders are even more eager to chase the rally than the big players—so at this level, I’d rather not chase. I’ll wait to buy near 0.0178 on a pullback. If it breaks below 0.0169, I’ll admit defeat and get out.
First, let’s see whether this rally is just a fake pump. The last 3 daily candles gained 18.43%, with volatility at 10.63%. Trading volume is also substantial: the latest 4-hour candle saw $719,000 in volume, and the daily total was $3.83 million. The volume is real; this isn’t a low-volume pump. That much is clear. But the current price of 0.018407 has already slipped below the 4-hour EMA5 at 0.018941. The candlestick snapshot shows 0.02 because it’s rounded; I’m using the live price to assess the risk/reward. After spiking higher, price is starting to weaken, so the short-term setup isn’t at its strongest.
The trend is still intact. The 4-hour EMA 5/25/60 values are 0.018941/0.01761/0.016915, and the daily EMA5/25 values are 0.017886/0.015307. The bullish alignment is still in place. The problem is the RSI: 79.6 on the 4-hour chart and 80.7 on the daily chart. Both timeframes are overbought, making the risk/reward too poor to chase.
What really makes me hold back is positioning. The account long/short ratio is 2.66 versus 1.92 for large holders, so retail is even more aggressive than the big players. The funding rate is +0.1324%, meaning longs are paying a premium to stay in. If there’s a pullback, it won’t be the big players who bail first—it’ll be these highly leveraged retail traders. OI is 16M against a market cap of 19M, so leverage accounts for 84%. If the market turns against them, things could reverse very quickly.
BTC is only up +0.31%, while the overall market is down -1.53%. $GRIFFAIN is up +11% on its own, ranking 10th among gainers. The independent price action deserves respect, but the broader market isn’t providing support. When the tide goes out, no one will be there to catch you.
So I’m not chasing at 0.0184. I’ll wait for support near 0.0178, and if it breaks below 0.0169, I’m out.
📊 Direction: Wait for a pullback to go long
💰 Entry reference: Near 0.0178 (between the daily EMA5 at 0.017886 and the 4-hour EMA25 at 0.01761); enter only after the pullback finds support
🛑 Stop-loss: 0.0169 (below the 4-hour EMA60 at 0.016915; if it breaks, admit defeat and exit)
🎯 Take-profit 1: 0.0190 (first target after reclaiming the 4-hour EMA5)
🎯 Take-profit 2: 0.0200 (the previous high and a round-number level)
Would you wait to buy the pullback at 0.0178, or say the bulls are wrong if it breaks below 0.0169? Pick one.
$GRIFFAIN #技术分析 #UncleTwelve
First, let’s see whether this rally is just a fake pump. The last 3 daily candles gained 18.43%, with volatility at 10.63%. Trading volume is also substantial: the latest 4-hour candle saw $719,000 in volume, and the daily total was $3.83 million. The volume is real; this isn’t a low-volume pump. That much is clear. But the current price of 0.018407 has already slipped below the 4-hour EMA5 at 0.018941. The candlestick snapshot shows 0.02 because it’s rounded; I’m using the live price to assess the risk/reward. After spiking higher, price is starting to weaken, so the short-term setup isn’t at its strongest.
The trend is still intact. The 4-hour EMA 5/25/60 values are 0.018941/0.01761/0.016915, and the daily EMA5/25 values are 0.017886/0.015307. The bullish alignment is still in place. The problem is the RSI: 79.6 on the 4-hour chart and 80.7 on the daily chart. Both timeframes are overbought, making the risk/reward too poor to chase.
What really makes me hold back is positioning. The account long/short ratio is 2.66 versus 1.92 for large holders, so retail is even more aggressive than the big players. The funding rate is +0.1324%, meaning longs are paying a premium to stay in. If there’s a pullback, it won’t be the big players who bail first—it’ll be these highly leveraged retail traders. OI is 16M against a market cap of 19M, so leverage accounts for 84%. If the market turns against them, things could reverse very quickly.
BTC is only up +0.31%, while the overall market is down -1.53%. $GRIFFAIN is up +11% on its own, ranking 10th among gainers. The independent price action deserves respect, but the broader market isn’t providing support. When the tide goes out, no one will be there to catch you.
So I’m not chasing at 0.0184. I’ll wait for support near 0.0178, and if it breaks below 0.0169, I’m out.
📊 Direction: Wait for a pullback to go long
💰 Entry reference: Near 0.0178 (between the daily EMA5 at 0.017886 and the 4-hour EMA25 at 0.01761); enter only after the pullback finds support
🛑 Stop-loss: 0.0169 (below the 4-hour EMA60 at 0.016915; if it breaks, admit defeat and exit)
🎯 Take-profit 1: 0.0190 (first target after reclaiming the 4-hour EMA5)
🎯 Take-profit 2: 0.0200 (the previous high and a round-number level)
Would you wait to buy the pullback at 0.0178, or say the bulls are wrong if it breaks below 0.0169? Pick one.
$GRIFFAIN #技术分析 #UncleTwelve
3
·
--
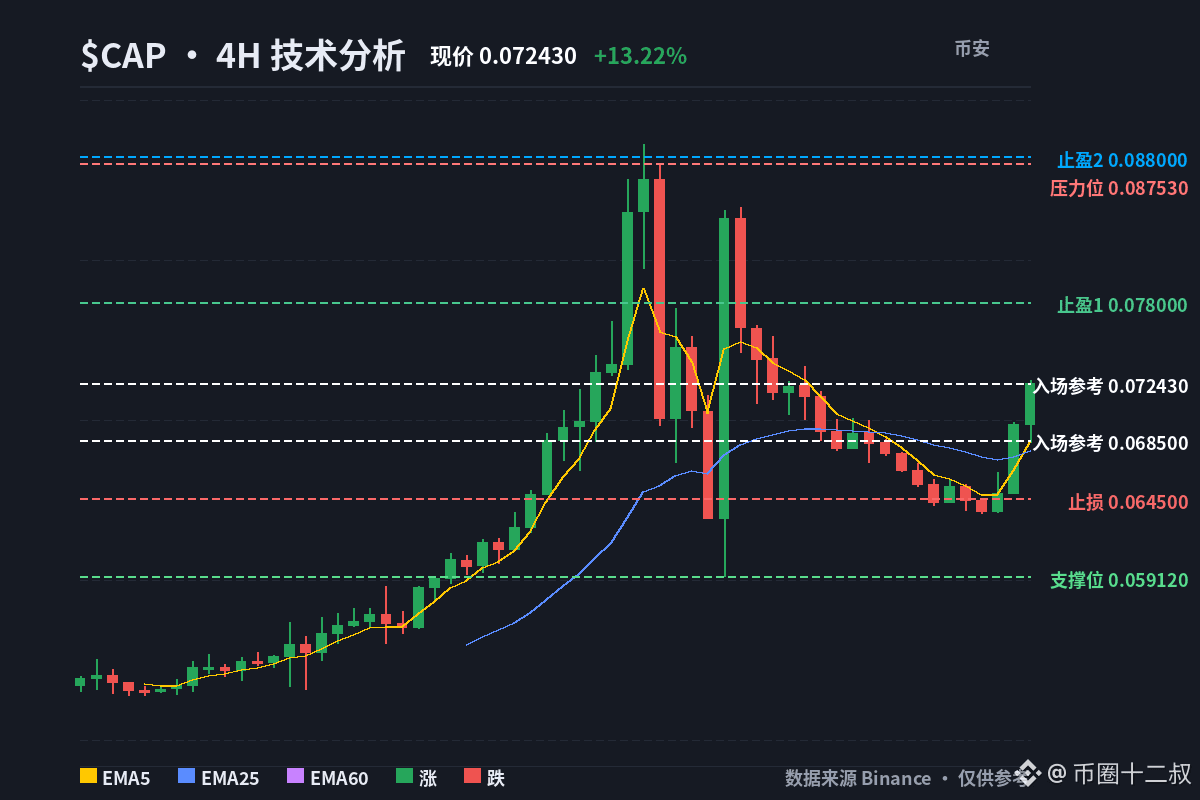
$CAP 24h is up 13.22%, ranking 7th on the gainers list, but I’m not chasing it. I’ll wait for a pullback near 0.0685 to go long; if it breaks below 0.0645, I’ll admit I’m wrong and exit.
First, sentiment: what’s most crowded here isn’t the price—it’s the positioning. The 24h funding rate is +0.03%, meaning it’s positive: longs are paying shorts a protection fee, charged by the second. The account long/short ratio is 1.60, and the top trader position ratio is 1.83. Retail traders and whales are rarely on the same side, but this time they’re all long. OI is 29M against a market cap of 112M, a ratio close to 26%—there’s plenty of leverage piled in. Put simply: who’ll be the first to let go? The short-term longs who chased the gainers list. They have a high cost basis and little patience; any pullback and they’ll run. With this setup, the risk/reward for chasing a long at the current price has already deteriorated.
Now the technicals. The 4h EMA5 at 0.0684 is above the EMA25 at 0.0678, and the EMA25 is above the EMA60 at 0.0634. On the daily chart, EMA5 at 0.0687 is above EMA25 at 0.0577. The bullish alignment is intact, and the trend is genuinely strong. But the 4h RSI 7 is already 67.9, and the daily RSI 7 is 68.5—hot, and not cheap. Volatility over the last 3 4h candles is 5.68%, and daily volatility is 10.97%. This contract has only been listed for 99 days, and this coin is naturally volatile. The latest 4h candle traded $2.92 million, while the daily volume was $7.87 million. Real money is coming in; this isn’t a low-volume fake rally.
Meanwhile, BTC is up just 0.11% over 24h, while ALL is down 1.40%. $CAP is moving independently. That strength deserves respect, but if the tide turns, there’ll be no support underneath.
One more thing: the order book shows 0.07149, which doesn’t match the 0.07 candlestick snapshot. I’m calculating the risk/reward using the live price, not chasing based on a rounded price.
Plan: bullish bias, but only buying a pullback.
📊 Entry near 0.0685 (around the 4h EMA5; I want to see buyers step in)
🛑 Stop loss at 0.0645. If it breaks, I’m out—no excuses.
🎯 Take profit 1: 0.0780
🎯 Take profit 2: 0.0880 (leaving some room below the 4h high near 0.09)
Whoever’s paying the protection fee is the first to fear a pullback.
Are you betting on support holding on a pullback to 0.0685, or on the bulls admitting they’re wrong if 0.0645 breaks? Pick one.
$CAP #技术分析 #UncleTwelve
$CAP 24h is up 13.22%, ranking 7th on the gainers list, but I’m not chasing it. I’ll wait for a pullback near 0.0685 to go long; if it breaks below 0.0645, I’ll admit I’m wrong and exit.
First, sentiment: what’s most crowded here isn’t the price—it’s the positioning. The 24h funding rate is +0.03%, meaning it’s positive: longs are paying shorts a protection fee, charged by the second. The account long/short ratio is 1.60, and the top trader position ratio is 1.83. Retail traders and whales are rarely on the same side, but this time they’re all long. OI is 29M against a market cap of 112M, a ratio close to 26%—there’s plenty of leverage piled in. Put simply: who’ll be the first to let go? The short-term longs who chased the gainers list. They have a high cost basis and little patience; any pullback and they’ll run. With this setup, the risk/reward for chasing a long at the current price has already deteriorated.
Now the technicals. The 4h EMA5 at 0.0684 is above the EMA25 at 0.0678, and the EMA25 is above the EMA60 at 0.0634. On the daily chart, EMA5 at 0.0687 is above EMA25 at 0.0577. The bullish alignment is intact, and the trend is genuinely strong. But the 4h RSI 7 is already 67.9, and the daily RSI 7 is 68.5—hot, and not cheap. Volatility over the last 3 4h candles is 5.68%, and daily volatility is 10.97%. This contract has only been listed for 99 days, and this coin is naturally volatile. The latest 4h candle traded $2.92 million, while the daily volume was $7.87 million. Real money is coming in; this isn’t a low-volume fake rally.
Meanwhile, BTC is up just 0.11% over 24h, while ALL is down 1.40%. $CAP is moving independently. That strength deserves respect, but if the tide turns, there’ll be no support underneath.
One more thing: the order book shows 0.07149, which doesn’t match the 0.07 candlestick snapshot. I’m calculating the risk/reward using the live price, not chasing based on a rounded price.
Plan: bullish bias, but only buying a pullback.
📊 Entry near 0.0685 (around the 4h EMA5; I want to see buyers step in)
🛑 Stop loss at 0.0645. If it breaks, I’m out—no excuses.
🎯 Take profit 1: 0.0780
🎯 Take profit 2: 0.0880 (leaving some room below the 4h high near 0.09)
Whoever’s paying the protection fee is the first to fear a pullback.
Are you betting on support holding on a pullback to 0.0685, or on the bulls admitting they’re wrong if 0.0645 breaks? Pick one.
$CAP #技术分析 #UncleTwelve
First, sentiment: what’s most crowded here isn’t the price—it’s the positioning. The 24h funding rate is +0.03%, meaning it’s positive: longs are paying shorts a protection fee, charged by the second. The account long/short ratio is 1.60, and the top trader position ratio is 1.83. Retail traders and whales are rarely on the same side, but this time they’re all long. OI is 29M against a market cap of 112M, a ratio close to 26%—there’s plenty of leverage piled in. Put simply: who’ll be the first to let go? The short-term longs who chased the gainers list. They have a high cost basis and little patience; any pullback and they’ll run. With this setup, the risk/reward for chasing a long at the current price has already deteriorated.
Now the technicals. The 4h EMA5 at 0.0684 is above the EMA25 at 0.0678, and the EMA25 is above the EMA60 at 0.0634. On the daily chart, EMA5 at 0.0687 is above EMA25 at 0.0577. The bullish alignment is intact, and the trend is genuinely strong. But the 4h RSI 7 is already 67.9, and the daily RSI 7 is 68.5—hot, and not cheap. Volatility over the last 3 4h candles is 5.68%, and daily volatility is 10.97%. This contract has only been listed for 99 days, and this coin is naturally volatile. The latest 4h candle traded $2.92 million, while the daily volume was $7.87 million. Real money is coming in; this isn’t a low-volume fake rally.
Meanwhile, BTC is up just 0.11% over 24h, while ALL is down 1.40%. $CAP is moving independently. That strength deserves respect, but if the tide turns, there’ll be no support underneath.
One more thing: the order book shows 0.07149, which doesn’t match the 0.07 candlestick snapshot. I’m calculating the risk/reward using the live price, not chasing based on a rounded price.
Plan: bullish bias, but only buying a pullback.
📊 Entry near 0.0685 (around the 4h EMA5; I want to see buyers step in)
🛑 Stop loss at 0.0645. If it breaks, I’m out—no excuses.
🎯 Take profit 1: 0.0780
🎯 Take profit 2: 0.0880 (leaving some room below the 4h high near 0.09)
Whoever’s paying the protection fee is the first to fear a pullback.
Are you betting on support holding on a pullback to 0.0685, or on the bulls admitting they’re wrong if 0.0645 breaks? Pick one.
$CAP #技术分析 #UncleTwelve
24
·
--
I just took a quick look at the market over the past six hours.
$BTC is now at $84,704, down just 0.13% over six hours—basically moving sideways. You can treat it as the broader backdrop for everything below.
Of the batch of trades I opened earlier, three of the nine are still following the original thesis, and their direction hasn’t gone off course.
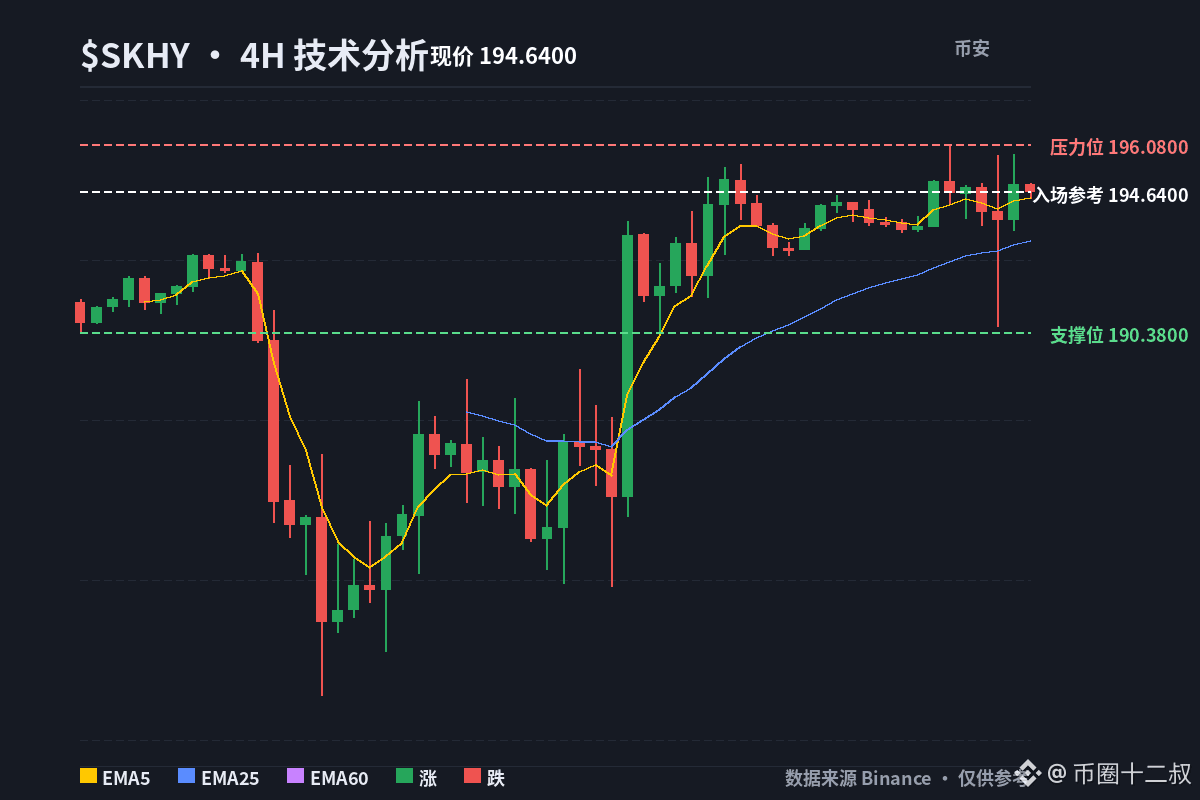
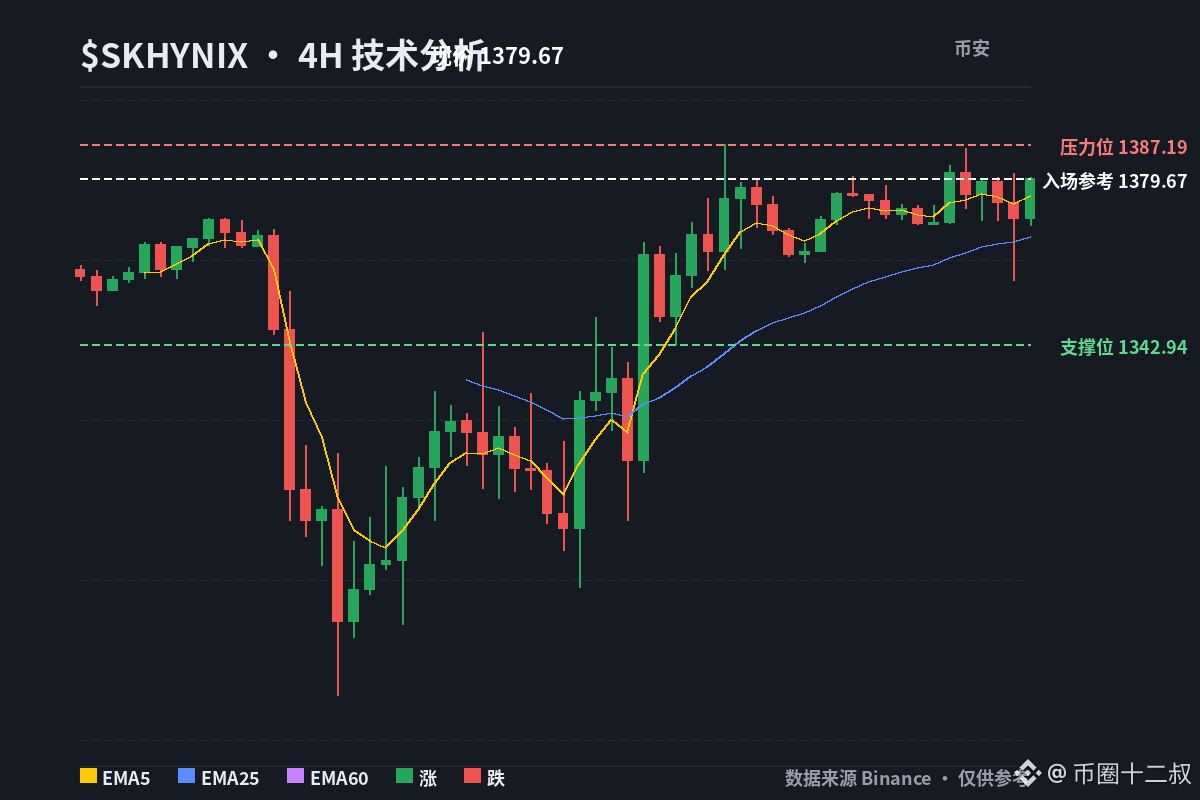
The long on $SKHYNIX was entered at 1290.75 and is now at 1372.15, up 6.31%—it’s been the smoothest performer during this period.
I just took a quick look at the market over the past six hours.
$BTC is now at $84,704, down just 0.13% over six hours—basically moving sideways. You can treat it as the broader backdrop for everything below.
Of the batch of trades I opened earlier, three of the nine are still following the original thesis, and their direction hasn’t gone off course.
The long on $SKHYNIX was entered at 1290.75 and is now at 1372.15, up 6.31%—it’s been the smoothest performer during this period.
$BTC is now at $84,704, down just 0.13% over six hours—basically moving sideways. You can treat it as the broader backdrop for everything below.
Of the batch of trades I opened earlier, three of the nine are still following the original thesis, and their direction hasn’t gone off course.
The long on $SKHYNIX was entered at 1290.75 and is now at 1372.15, up 6.31%—it’s been the smoothest performer during this period.
7
·
--
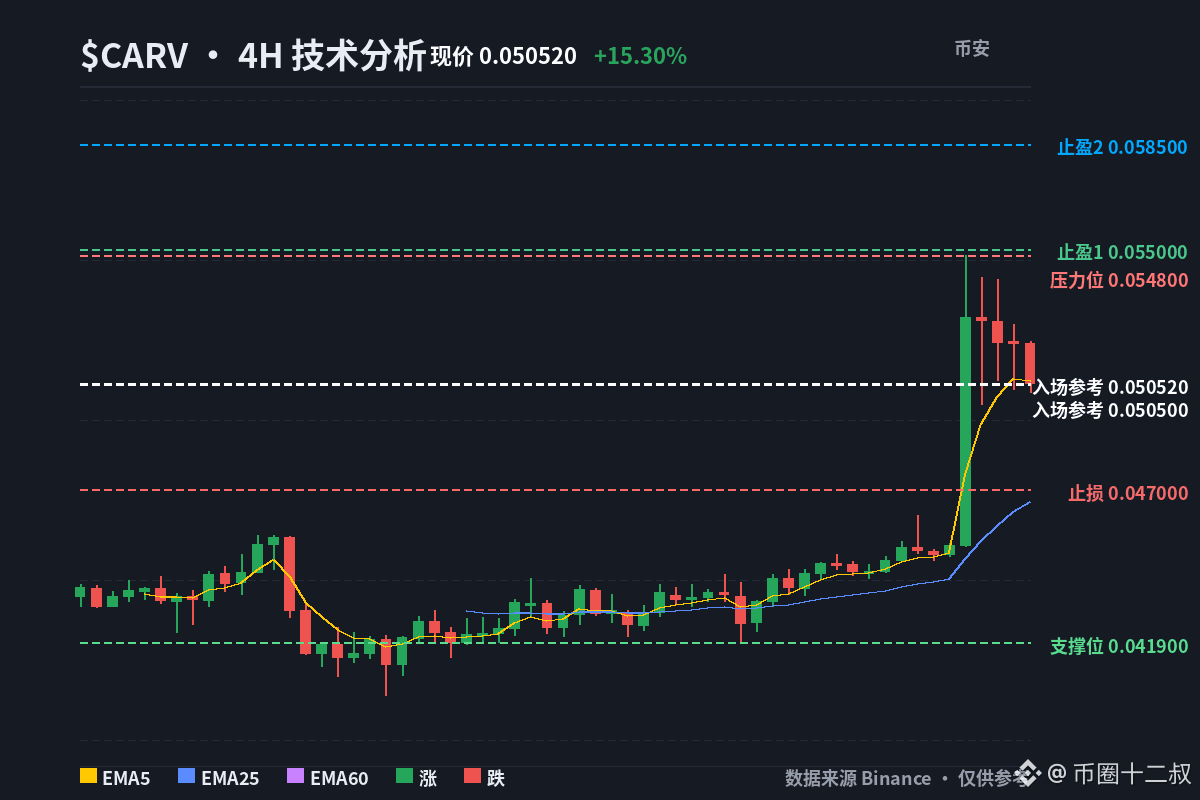
$CARV 's daily RSI7 is already at 82, and it's also up +15.3% in 24h. I won't chase at this overbought level. Overbought isn't a reason to short, but chasing longs at the current price has already lost its edge—I’ll only look to buy near 0.0505 on a pullback. If it breaks below 0.047, I’ll admit I’m wrong and get out.
First, look at volume—that’s what determines whether this is a genuine breakout or a fake pump. The latest daily candle saw $46.03 million in trading volume, while $CARV has a market cap of just $35 million. A single candle’s turnover is more than its market cap, so this doesn’t look like a low-volume fake pump; real money is changing hands. But the last 3 candles on the 4h chart are already down 2.68%—the first buyers are starting to take profits after the spike. Volatility over the last 3 daily candles is 9.27%, versus 4.69% on the 4h chart. Set your stop too tight and you’ll get shaken out.
What really stands out is the positioning split. The account long/short ratio is 2.1706, with retail longs crowded together; the top traders’ position ratio is 0.8292, meaning the big players are leaning the other way, toward shorts. At the same time, the funding rate is -2.6437%, so shorts are still paying a fee to hold their positions. So the question isn’t whether it goes up—it’s who gives in first: if retail longs can’t stomach this pullback, they’ll exit first and the price could head straight to test EMA25. But shorts are paying a hefty fee every day too. As long as it holds above 0.0505, they’re the ones at risk of a short squeeze. Uncle Twelve’s position is only above 0.0505; if it’s not above that level, I’m not catching the last leg.
The trend itself is still intact. On the 4h chart, EMA5 is 0.0506, EMA25 is 0.0466, and EMA60 is 0.0440—a full bullish alignment. On the daily chart, EMA5 at 0.0462 is above EMA25 at 0.0412, so the structure is holding. RSI at 82 only means chasing has poor risk/reward; it doesn’t mean an immediate reversal. BTC is only up +0.01%, the overall market is down -1.70%, while $CARV is up +15.3%. Its independent move deserves respect, but there’s no floor beneath it if the broader market retreats.
One more thing: the candlestick snapshot shows 0.05, while the live price is 0.05186. The figures don’t line up, so I’m calculating risk/reward using the live price, not chasing based on the rounded figure.
📊 Direction: Long (wait for a pullback)
💰 Entry: Near 0.0505; pull the trigger only after it holds above 4h EMA5
🛑 Stop-loss: 0.047; if it breaks below 4h EMA25 at 0.0466, admit the trade is wrong and exit
🎯 Take profit 1: 0.055
🎯 Take profit 2: 0.0585
A high RSI isn’t a reason to short, and negative funding isn’t a reason to buy the dip. Key levels are the trigger.
Are you betting it holds the 0.0505 pullback and keeps squeezing shorts, or that it breaks below 0.047 and longs collectively admit they’re wrong? Pick one.
$CARV #技术分析 #UncleTwelve
$CARV 's daily RSI7 is already at 82, and it's also up +15.3% in 24h. I won't chase at this overbought level. Overbought isn't a reason to short, but chasing longs at the current price has already lost its edge—I’ll only look to buy near 0.0505 on a pullback. If it breaks below 0.047, I’ll admit I’m wrong and get out.
First, look at volume—that’s what determines whether this is a genuine breakout or a fake pump. The latest daily candle saw $46.03 million in trading volume, while $CARV has a market cap of just $35 million. A single candle’s turnover is more than its market cap, so this doesn’t look like a low-volume fake pump; real money is changing hands. But the last 3 candles on the 4h chart are already down 2.68%—the first buyers are starting to take profits after the spike. Volatility over the last 3 daily candles is 9.27%, versus 4.69% on the 4h chart. Set your stop too tight and you’ll get shaken out.
What really stands out is the positioning split. The account long/short ratio is 2.1706, with retail longs crowded together; the top traders’ position ratio is 0.8292, meaning the big players are leaning the other way, toward shorts. At the same time, the funding rate is -2.6437%, so shorts are still paying a fee to hold their positions. So the question isn’t whether it goes up—it’s who gives in first: if retail longs can’t stomach this pullback, they’ll exit first and the price could head straight to test EMA25. But shorts are paying a hefty fee every day too. As long as it holds above 0.0505, they’re the ones at risk of a short squeeze. Uncle Twelve’s position is only above 0.0505; if it’s not above that level, I’m not catching the last leg.
The trend itself is still intact. On the 4h chart, EMA5 is 0.0506, EMA25 is 0.0466, and EMA60 is 0.0440—a full bullish alignment. On the daily chart, EMA5 at 0.0462 is above EMA25 at 0.0412, so the structure is holding. RSI at 82 only means chasing has poor risk/reward; it doesn’t mean an immediate reversal. BTC is only up +0.01%, the overall market is down -1.70%, while $CARV is up +15.3%. Its independent move deserves respect, but there’s no floor beneath it if the broader market retreats.
One more thing: the candlestick snapshot shows 0.05, while the live price is 0.05186. The figures don’t line up, so I’m calculating risk/reward using the live price, not chasing based on the rounded figure.
📊 Direction: Long (wait for a pullback)
💰 Entry: Near 0.0505; pull the trigger only after it holds above 4h EMA5
🛑 Stop-loss: 0.047; if it breaks below 4h EMA25 at 0.0466, admit the trade is wrong and exit
🎯 Take profit 1: 0.055
🎯 Take profit 2: 0.0585
A high RSI isn’t a reason to short, and negative funding isn’t a reason to buy the dip. Key levels are the trigger.
Are you betting it holds the 0.0505 pullback and keeps squeezing shorts, or that it breaks below 0.047 and longs collectively admit they’re wrong? Pick one.
$CARV #技术分析 #UncleTwelve
First, look at volume—that’s what determines whether this is a genuine breakout or a fake pump. The latest daily candle saw $46.03 million in trading volume, while $CARV has a market cap of just $35 million. A single candle’s turnover is more than its market cap, so this doesn’t look like a low-volume fake pump; real money is changing hands. But the last 3 candles on the 4h chart are already down 2.68%—the first buyers are starting to take profits after the spike. Volatility over the last 3 daily candles is 9.27%, versus 4.69% on the 4h chart. Set your stop too tight and you’ll get shaken out.
What really stands out is the positioning split. The account long/short ratio is 2.1706, with retail longs crowded together; the top traders’ position ratio is 0.8292, meaning the big players are leaning the other way, toward shorts. At the same time, the funding rate is -2.6437%, so shorts are still paying a fee to hold their positions. So the question isn’t whether it goes up—it’s who gives in first: if retail longs can’t stomach this pullback, they’ll exit first and the price could head straight to test EMA25. But shorts are paying a hefty fee every day too. As long as it holds above 0.0505, they’re the ones at risk of a short squeeze. Uncle Twelve’s position is only above 0.0505; if it’s not above that level, I’m not catching the last leg.
The trend itself is still intact. On the 4h chart, EMA5 is 0.0506, EMA25 is 0.0466, and EMA60 is 0.0440—a full bullish alignment. On the daily chart, EMA5 at 0.0462 is above EMA25 at 0.0412, so the structure is holding. RSI at 82 only means chasing has poor risk/reward; it doesn’t mean an immediate reversal. BTC is only up +0.01%, the overall market is down -1.70%, while $CARV is up +15.3%. Its independent move deserves respect, but there’s no floor beneath it if the broader market retreats.
One more thing: the candlestick snapshot shows 0.05, while the live price is 0.05186. The figures don’t line up, so I’m calculating risk/reward using the live price, not chasing based on the rounded figure.
📊 Direction: Long (wait for a pullback)
💰 Entry: Near 0.0505; pull the trigger only after it holds above 4h EMA5
🛑 Stop-loss: 0.047; if it breaks below 4h EMA25 at 0.0466, admit the trade is wrong and exit
🎯 Take profit 1: 0.055
🎯 Take profit 2: 0.0585
A high RSI isn’t a reason to short, and negative funding isn’t a reason to buy the dip. Key levels are the trigger.
Are you betting it holds the 0.0505 pullback and keeps squeezing shorts, or that it breaks below 0.047 and longs collectively admit they’re wrong? Pick one.
$CARV #技术分析 #UncleTwelve
5
·
--
Just took a quick look at the market. Over the past six hours, $BTC has been hovering around $84,757, up about 0.19%. Bitcoin still looks pretty subdued, and all the other assets are taking their cues from it.
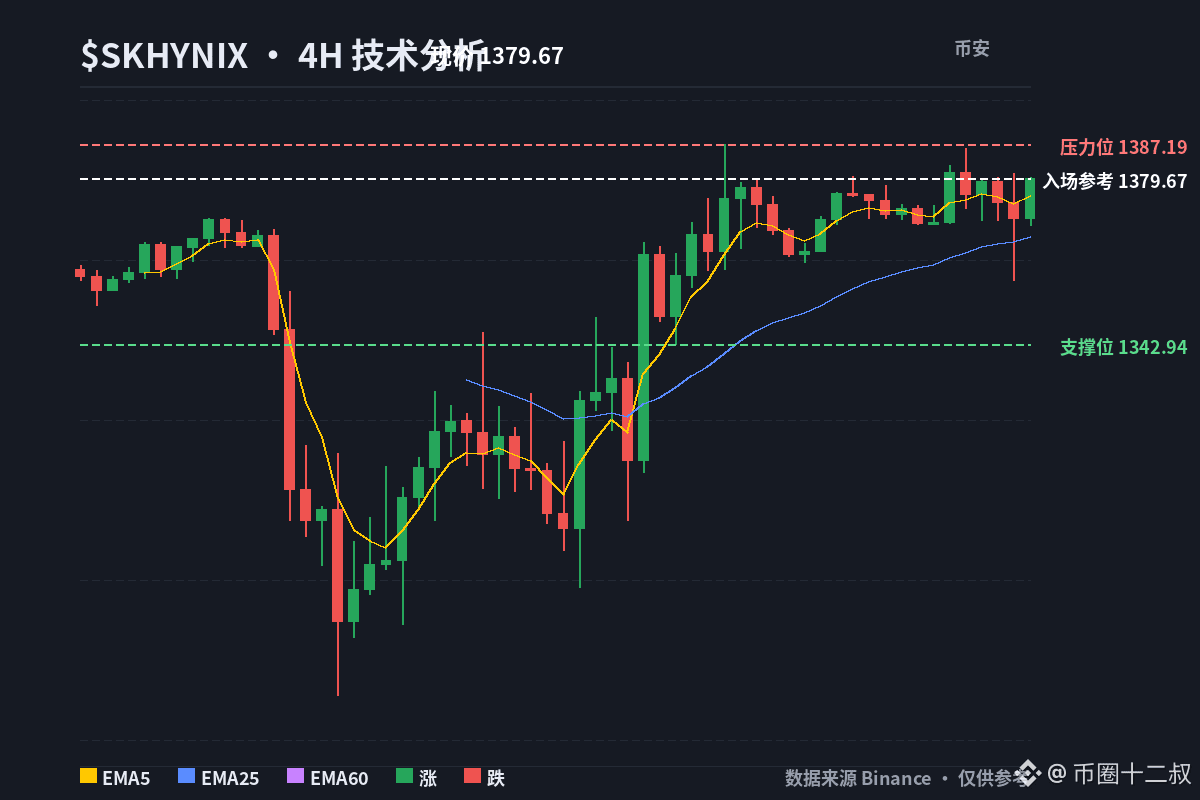
$SKHYNIX The position I was bullish on is still moving along. I entered at 1,290.75, and it’s now at 1,372.65, for an unrealized gain of 6.35%. The trend hasn’t broken down, so I’ll hold for now and see what happens next.
Just took a quick look at the market. Over the past six hours, $BTC has been hovering around $84,757, up about 0.19%. Bitcoin still looks pretty subdued, and all the other assets are taking their cues from it.
$SKHYNIX The position I was bullish on is still moving along. I entered at 1,290.75, and it’s now at 1,372.65, for an unrealized gain of 6.35%. The trend hasn’t broken down, so I’ll hold for now and see what happens next.
$SKHYNIX The position I was bullish on is still moving along. I entered at 1,290.75, and it’s now at 1,372.65, for an unrealized gain of 6.35%. The trend hasn’t broken down, so I’ll hold for now and see what happens next.
100
·
--
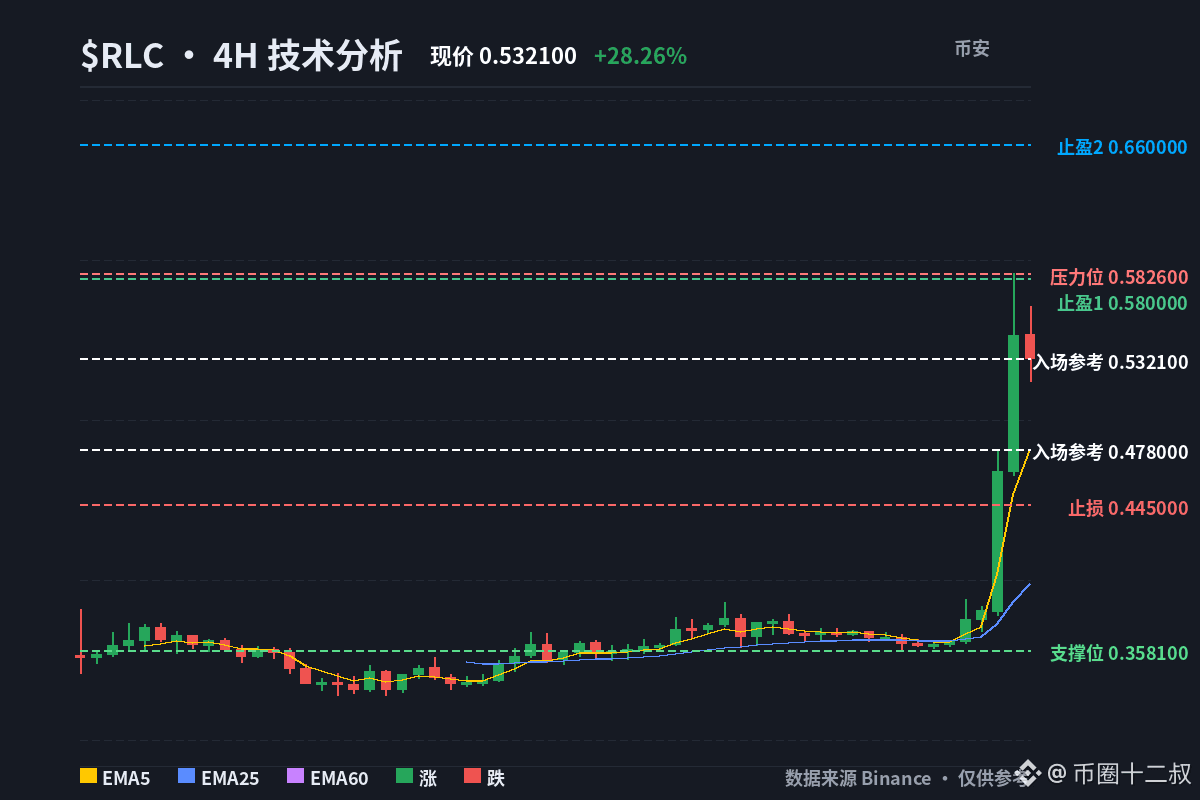
$RLC 24h is up +28.26%, ranking 3rd on the gainers list, with 25M OI against a 48M market cap—at a 52% ratio, I’d rather not chase.
First, a note on the figures: the snapshot price of $0.4648 doesn’t match the current K-line price of $0.53. I’m using the live price of $0.53 to calculate the risk/reward, not chasing based on a rounded price. I wouldn’t touch it at the current price; I’ll only look to go long on a pullback around 0.478. If it breaks below 0.445, I’ll admit I’m wrong and get out—conviction is no substitute for a stop-loss.
The main tension here is the split in positioning. The 24h funding rate is -12%: shorts are paying longs a protection fee, which in theory is all short-squeeze fuel. But the account long/short ratio is 2.10 and the top-trader position ratio is 1.99, with both sides crowded into longs. Who lets go first? Shorts are hurting now, but once the squeeze is over, longs who chased at the top will be the ones left holding the bag. OI/market cap is 52%, so if sentiment flips, it’ll happen fast.
I’m not denying the trend technically. The 4h EMA5 is 0.478, EMA25 is 0.398, and EMA60 is 0.366; the daily EMA5 is 0.4197 and EMA25 is 0.3443. They’re all aligned bullishly, and the structure hasn’t broken. But the 4h RSI-7 is 88.9 and the daily RSI is 89.7. Volatility over the last 3 candles is 17.21%, and daily turnover is 217M on rising volume. Rising volume plus overbought conditions signals distribution, not a fresh takeoff—the risk/reward for chasing has deteriorated.
BTC is only down -0.09%, while ALL is down -1.82%. $RLC is moving independently, and that deserves respect. But it didn’t provide support as the broader market pulled back. If BTC takes another leg down, a token leveraged at 52% like this could retrace faster than you expect.
I’m not chasing the current price, but that doesn’t mean I’m bearish. I’ll wait for buyers to step in around 0.478 and pull the trigger only if it holds. If it really breaks below 0.445, that’s not a pullback—it’s a reversal, and I’ll admit I’m wrong and exit.
📊 Direction: Long (wait for a pullback)
💰 Entry reference: Around 0.478 (4h EMA5); wait for a low-volume pullback to stabilize before entering
🛑 Stop-loss: 0.445; if it breaks below, admit you’re wrong and exit immediately
🎯 Take-profit 1: 0.58 (previous range high)
🎯 Take-profit 2: 0.66 (extension above the previous high)
Negative funding is short-squeeze fuel, but with leverage piled up to 52%, wait for a pullback before pulling the trigger.
Would you go long on a pullback to 0.478, or say the bulls are wrong if it breaks below 0.445? Pick one.
$RLC #技术分析 #UncleTwelve
$RLC 24h is up +28.26%, ranking 3rd on the gainers list, with 25M OI against a 48M market cap—at a 52% ratio, I’d rather not chase.
First, a note on the figures: the snapshot price of $0.4648 doesn’t match the current K-line price of $0.53. I’m using the live price of $0.53 to calculate the risk/reward, not chasing based on a rounded price. I wouldn’t touch it at the current price; I’ll only look to go long on a pullback around 0.478. If it breaks below 0.445, I’ll admit I’m wrong and get out—conviction is no substitute for a stop-loss.
The main tension here is the split in positioning. The 24h funding rate is -12%: shorts are paying longs a protection fee, which in theory is all short-squeeze fuel. But the account long/short ratio is 2.10 and the top-trader position ratio is 1.99, with both sides crowded into longs. Who lets go first? Shorts are hurting now, but once the squeeze is over, longs who chased at the top will be the ones left holding the bag. OI/market cap is 52%, so if sentiment flips, it’ll happen fast.
I’m not denying the trend technically. The 4h EMA5 is 0.478, EMA25 is 0.398, and EMA60 is 0.366; the daily EMA5 is 0.4197 and EMA25 is 0.3443. They’re all aligned bullishly, and the structure hasn’t broken. But the 4h RSI-7 is 88.9 and the daily RSI is 89.7. Volatility over the last 3 candles is 17.21%, and daily turnover is 217M on rising volume. Rising volume plus overbought conditions signals distribution, not a fresh takeoff—the risk/reward for chasing has deteriorated.
BTC is only down -0.09%, while ALL is down -1.82%. $RLC is moving independently, and that deserves respect. But it didn’t provide support as the broader market pulled back. If BTC takes another leg down, a token leveraged at 52% like this could retrace faster than you expect.
I’m not chasing the current price, but that doesn’t mean I’m bearish. I’ll wait for buyers to step in around 0.478 and pull the trigger only if it holds. If it really breaks below 0.445, that’s not a pullback—it’s a reversal, and I’ll admit I’m wrong and exit.
📊 Direction: Long (wait for a pullback)
💰 Entry reference: Around 0.478 (4h EMA5); wait for a low-volume pullback to stabilize before entering
🛑 Stop-loss: 0.445; if it breaks below, admit you’re wrong and exit immediately
🎯 Take-profit 1: 0.58 (previous range high)
🎯 Take-profit 2: 0.66 (extension above the previous high)
Negative funding is short-squeeze fuel, but with leverage piled up to 52%, wait for a pullback before pulling the trigger.
Would you go long on a pullback to 0.478, or say the bulls are wrong if it breaks below 0.445? Pick one.
$RLC #技术分析 #UncleTwelve
First, a note on the figures: the snapshot price of $0.4648 doesn’t match the current K-line price of $0.53. I’m using the live price of $0.53 to calculate the risk/reward, not chasing based on a rounded price. I wouldn’t touch it at the current price; I’ll only look to go long on a pullback around 0.478. If it breaks below 0.445, I’ll admit I’m wrong and get out—conviction is no substitute for a stop-loss.
The main tension here is the split in positioning. The 24h funding rate is -12%: shorts are paying longs a protection fee, which in theory is all short-squeeze fuel. But the account long/short ratio is 2.10 and the top-trader position ratio is 1.99, with both sides crowded into longs. Who lets go first? Shorts are hurting now, but once the squeeze is over, longs who chased at the top will be the ones left holding the bag. OI/market cap is 52%, so if sentiment flips, it’ll happen fast.
I’m not denying the trend technically. The 4h EMA5 is 0.478, EMA25 is 0.398, and EMA60 is 0.366; the daily EMA5 is 0.4197 and EMA25 is 0.3443. They’re all aligned bullishly, and the structure hasn’t broken. But the 4h RSI-7 is 88.9 and the daily RSI is 89.7. Volatility over the last 3 candles is 17.21%, and daily turnover is 217M on rising volume. Rising volume plus overbought conditions signals distribution, not a fresh takeoff—the risk/reward for chasing has deteriorated.
BTC is only down -0.09%, while ALL is down -1.82%. $RLC is moving independently, and that deserves respect. But it didn’t provide support as the broader market pulled back. If BTC takes another leg down, a token leveraged at 52% like this could retrace faster than you expect.
I’m not chasing the current price, but that doesn’t mean I’m bearish. I’ll wait for buyers to step in around 0.478 and pull the trigger only if it holds. If it really breaks below 0.445, that’s not a pullback—it’s a reversal, and I’ll admit I’m wrong and exit.
📊 Direction: Long (wait for a pullback)
💰 Entry reference: Around 0.478 (4h EMA5); wait for a low-volume pullback to stabilize before entering
🛑 Stop-loss: 0.445; if it breaks below, admit you’re wrong and exit immediately
🎯 Take-profit 1: 0.58 (previous range high)
🎯 Take-profit 2: 0.66 (extension above the previous high)
Negative funding is short-squeeze fuel, but with leverage piled up to 52%, wait for a pullback before pulling the trigger.
Would you go long on a pullback to 0.478, or say the bulls are wrong if it breaks below 0.445? Pick one.
$RLC #技术分析 #UncleTwelve
119
Log in to explore more content
Join global crypto users on Binance Square
⚡️ Get latest and useful information about crypto.
💬 Trusted by the world’s largest crypto exchange.
👍 Discover real insights from verified creators.
Email / Phone number
Trending Topics
ADAGains10%Above$0.27
15,337 views
181 Discussing
$ADA is making a strong move today jumping over 10 percent to around 027 and breaking into a new 90 day high
Trading volume has also surged above 1 billion showing strong market activity
The move comes as $ADA continues its recovery from the June lows while its recent technical structure has turned more bullish
The 027 to 028 zone is now the key area to watch A sustained breakout could open the door toward higher resistance levels
But after such a sharp daily move volatility could remain high
#ADAGains10%Above$0.27 #crypto #ADA #Cardano #crypto #Write2Earn
AbdullahAbid_7
·0 Likes
·381 views
ETHUp70%InQ3ButLiquidityFalls
167,049 views
1,074 Discussing
EthStakingExitQueueHits2026High
57,741 views
767 Discussing