

JamesS9781
37 Posts

JamesS9781
Report
Block User
Quem busca o saber encontra o caminho para a liberdade.
Open Trade

BTC Holder
Occasional Trader
5 Years
4 Following
58 Followers
168 Liked
Posts
Portfolio
PINNED
·
--
Article
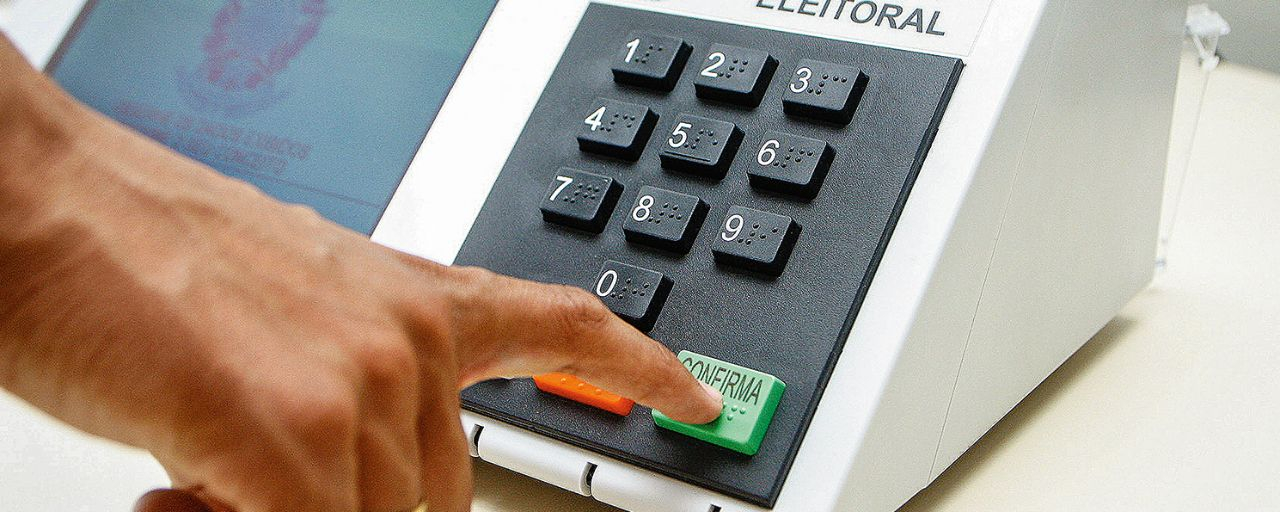
Lula’s comeback in the runoff: where did the millions of votes come from?The result of the 2026 presidential election runoff raises a question worth examining carefully: how did Lula go from trailing by approximately 2.22 million votes in the first round to winning by about 4.43 million votes over Flávio Bolsonaro?
The official figures show a significant shift in the electoral balance. In the first round, Flávio received 56.10 million votes, compared with Lula’s 53.88 million. In the second round, Lula reached 64.26 million, while Flávio finished with 59.83 million.
Lula’s comeback in the runoff: where did the millions of votes come from?
The result of the 2026 presidential election runoff raises a question worth examining carefully: how did Lula go from trailing by approximately 2.22 million votes in the first round to winning by about 4.43 million votes over Flávio Bolsonaro?
The official figures show a significant shift in the electoral balance. In the first round, Flávio received 56.10 million votes, compared with Lula’s 53.88 million. In the second round, Lula reached 64.26 million, while Flávio finished with 59.83 million.
The official figures show a significant shift in the electoral balance. In the first round, Flávio received 56.10 million votes, compared with Lula’s 53.88 million. In the second round, Lula reached 64.26 million, while Flávio finished with 59.83 million.
51
1
35
19.1k
PINNED
·
--

Article
Payroll loans against FGTS are absurd: Understand whyThe government launched in March 2025 the so-called "Worker's Credit", a line of payroll loans that uses up to 10% of the FGTS balance as collateral and deducts installments directly from the payroll via e-Social. In theory, it is sold as "cheap credit" for CLT workers, with interest around 2% per month (about 23-25% per year). In practice, it is an absurd that only benefits banks and puts the worker in a financial trap. Let's break this down.
The FGTS is your money, earned with sweat, but the government has always held it, yielding a miserable 3% a year plus TR – a return that loses badly to inflation, projected above 4% in 2025. Now, with this new modality, they offer you the chance to use your own money as collateral for a loan with much higher interest than the fund’s earnings. It’s like renting your house to yourself and still paying a lot for it. Who profits? The banks, of course.
Payroll loans against FGTS are absurd: Understand why
The government launched in March 2025 the so-called "Worker's Credit", a line of payroll loans that uses up to 10% of the FGTS balance as collateral and deducts installments directly from the payroll via e-Social. In theory, it is sold as "cheap credit" for CLT workers, with interest around 2% per month (about 23-25% per year). In practice, it is an absurd that only benefits banks and puts the worker in a financial trap. Let's break this down.
The FGTS is your money, earned with sweat, but the government has always held it, yielding a miserable 3% a year plus TR – a return that loses badly to inflation, projected above 4% in 2025. Now, with this new modality, they offer you the chance to use your own money as collateral for a loan with much higher interest than the fund’s earnings. It’s like renting your house to yourself and still paying a lot for it. Who profits? The banks, of course.
The FGTS is your money, earned with sweat, but the government has always held it, yielding a miserable 3% a year plus TR – a return that loses badly to inflation, projected above 4% in 2025. Now, with this new modality, they offer you the chance to use your own money as collateral for a loan with much higher interest than the fund’s earnings. It’s like renting your house to yourself and still paying a lot for it. Who profits? The banks, of course.
46
13
14
9k
·
--

Article
The bitter medicine for inflation: why stabilizing an economy can make the population poorerImagine working all month, getting paid, and discovering that your money has already lost a significant part of its purchasing power. Food prices rise, rent goes up, fuel becomes more expensive, and what you could afford today costs much more the following week.
Now imagine that this goes on for months, or even years. People stop trusting the currency, businesses struggle to calculate their costs, and workers try to spend their wages as soon as they receive them, before they lose even more value.
The bitter medicine for inflation: why stabilizing an economy can make the population poorer
Imagine working all month, getting paid, and discovering that your money has already lost a significant part of its purchasing power. Food prices rise, rent goes up, fuel becomes more expensive, and what you could afford today costs much more the following week.
Now imagine that this goes on for months, or even years. People stop trusting the currency, businesses struggle to calculate their costs, and workers try to spend their wages as soon as they receive them, before they lose even more value.
Now imagine that this goes on for months, or even years. People stop trusting the currency, businesses struggle to calculate their costs, and workers try to spend their wages as soon as they receive them, before they lose even more value.
1
1
1.1k
·
--

Article
How many headlines like this do you need to start questioning your own security?Imagine stepping out of your pad and realizing that the real power players in your hood aren't the government, but a criminal syndicate. Picture living in a complex built with public funds and needing the go-ahead from dealers just to come and go or chill there. Think about how merchants are shelling out illegal fees, residents are getting kicked out of their digs, and witnesses are living under constant pressure.
Now ask yourself a simple question: if an armed crew controls turf, enforces their own rules, uses violence to scare the locals, and directly challenges state authority, how does that differ from a terrorist organization?
How many headlines like this do you need to start questioning your own security?
Imagine stepping out of your pad and realizing that the real power players in your hood aren't the government, but a criminal syndicate. Picture living in a complex built with public funds and needing the go-ahead from dealers just to come and go or chill there. Think about how merchants are shelling out illegal fees, residents are getting kicked out of their digs, and witnesses are living under constant pressure.
Now ask yourself a simple question: if an armed crew controls turf, enforces their own rules, uses violence to scare the locals, and directly challenges state authority, how does that differ from a terrorist organization?
Now ask yourself a simple question: if an armed crew controls turf, enforces their own rules, uses violence to scare the locals, and directly challenges state authority, how does that differ from a terrorist organization?
5
6
626
·
--
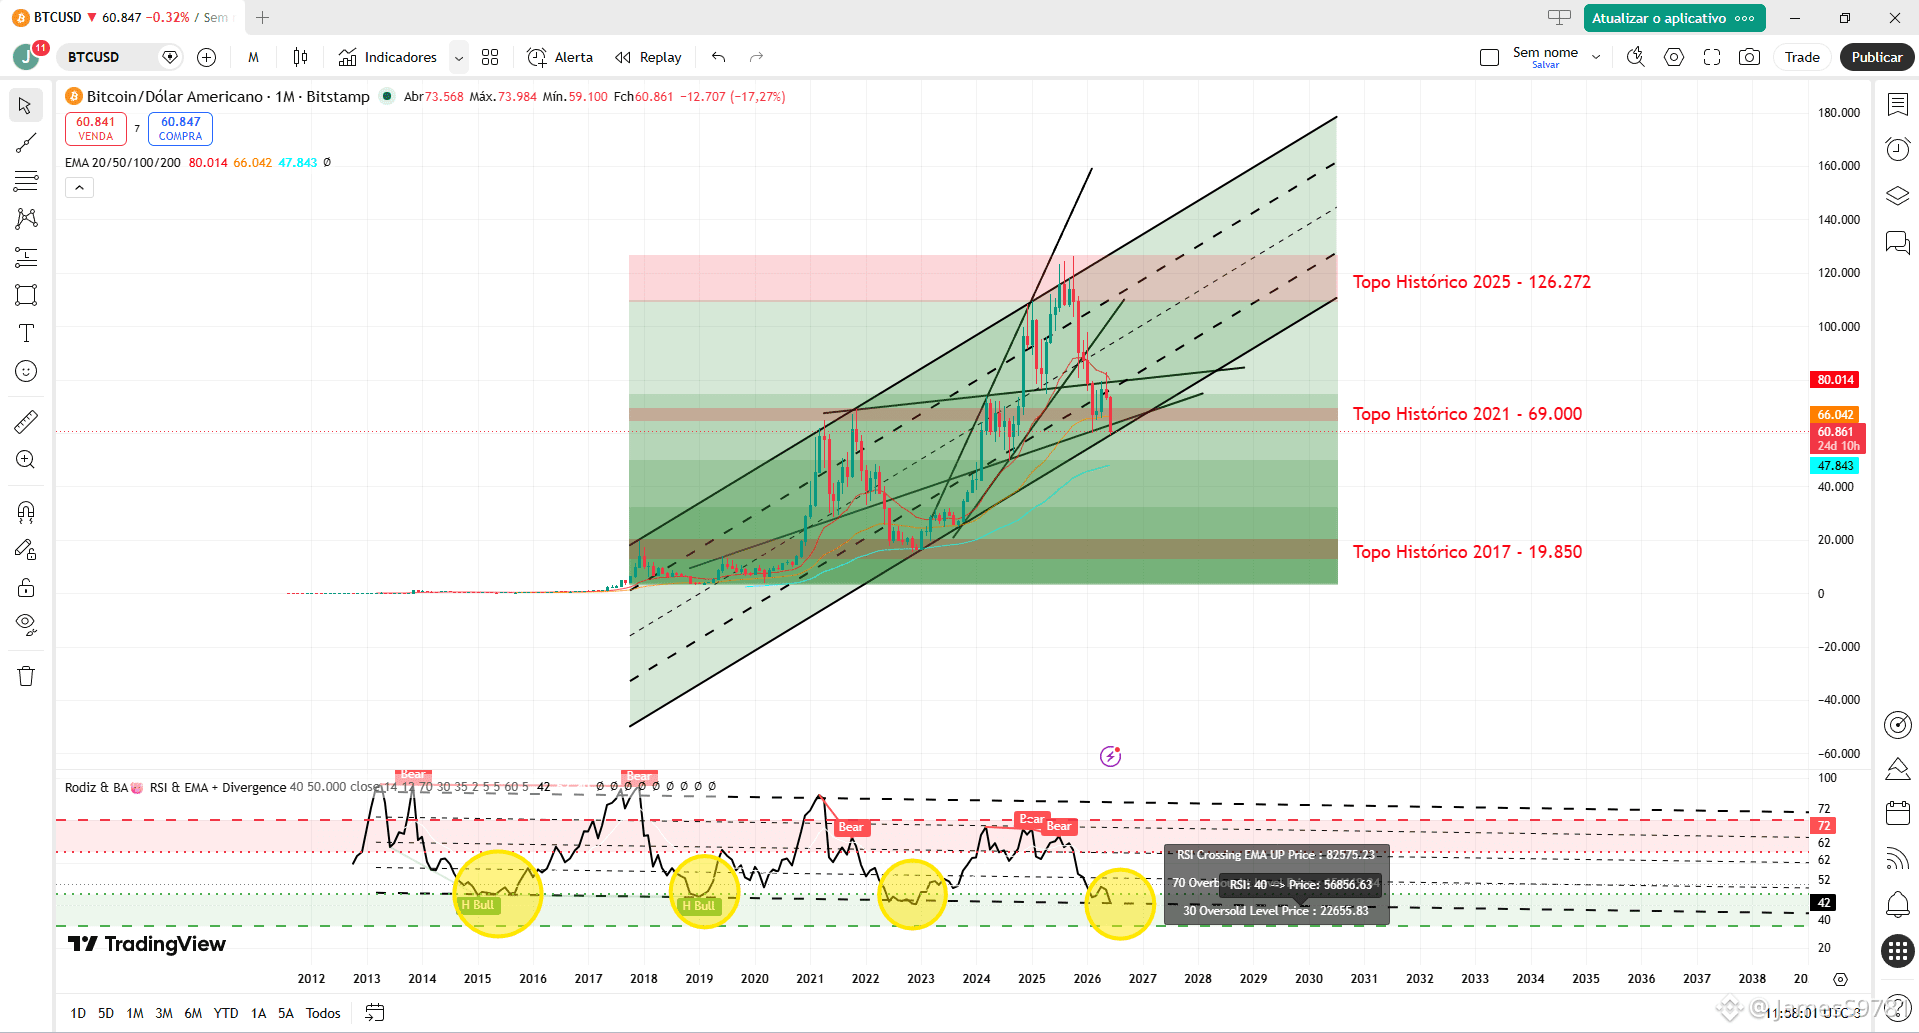
Bitcoin is sitting at the base of an uptrend channel, while the RSI indicates an oversold region. The upcoming weeks will be crucial in determining the market direction. If the price continues to range and loses key supports, there's a high probability we'll see a correction towards US$ 50 million. On the flip side, if BTC resumes its uptrend from the current levels, this could be one of the last buying opportunities in this price range before a new bull cycle, making a revisit to these levels unlikely in the coming years.
Bitcoin is sitting at the base of an uptrend channel, while the RSI indicates an oversold region. The upcoming weeks will be crucial in determining the market direction. If the price continues to range and loses key supports, there's a high probability we'll see a correction towards US$ 50 million. On the flip side, if BTC resumes its uptrend from the current levels, this could be one of the last buying opportunities in this price range before a new bull cycle, making a revisit to these levels unlikely in the coming years.
207
·
--
Article
Bitcoin at $59,000: One of the Best Accumulation Regions of the Cycle?Bitcoin is trading close to $59,000 again, having corrected over 50% since the all-time high hit in 2025. Even though market sentiment is extremely bearish, key on-chain indicators suggest BTC is entering a zone historically associated with long-term accumulation opportunities.
Extreme Fear in the Market
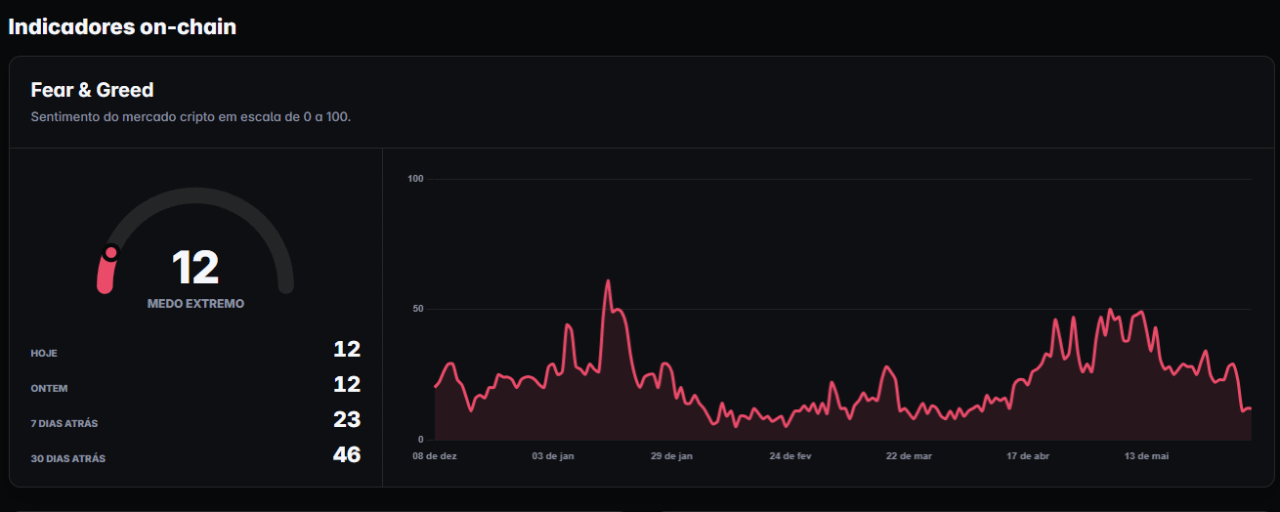
The Fear & Greed index is sitting at 12 points, indicating Extreme Fear.
Historically, the best times to buy Bitcoin have been when the prevailing sentiment was pure panic. During the lows of 2015, 2018, 2020, and 2022, the market showed similar levels of pessimism.
Bitcoin at $59,000: One of the Best Accumulation Regions of the Cycle?
Bitcoin is trading close to $59,000 again, having corrected over 50% since the all-time high hit in 2025. Even though market sentiment is extremely bearish, key on-chain indicators suggest BTC is entering a zone historically associated with long-term accumulation opportunities.
Extreme Fear in the Market
The Fear & Greed index is sitting at 12 points, indicating Extreme Fear.
Historically, the best times to buy Bitcoin have been when the prevailing sentiment was pure panic. During the lows of 2015, 2018, 2020, and 2022, the market showed similar levels of pessimism.
Extreme Fear in the Market
The Fear & Greed index is sitting at 12 points, indicating Extreme Fear.
Historically, the best times to buy Bitcoin have been when the prevailing sentiment was pure panic. During the lows of 2015, 2018, 2020, and 2022, the market showed similar levels of pessimism.
179
·
--
Verified
Article
Bitcoin: The Start of a New CycleBitcoin in 2026: Technical, Macroeconomic, and Cycle Analysis with Mayer Multiple
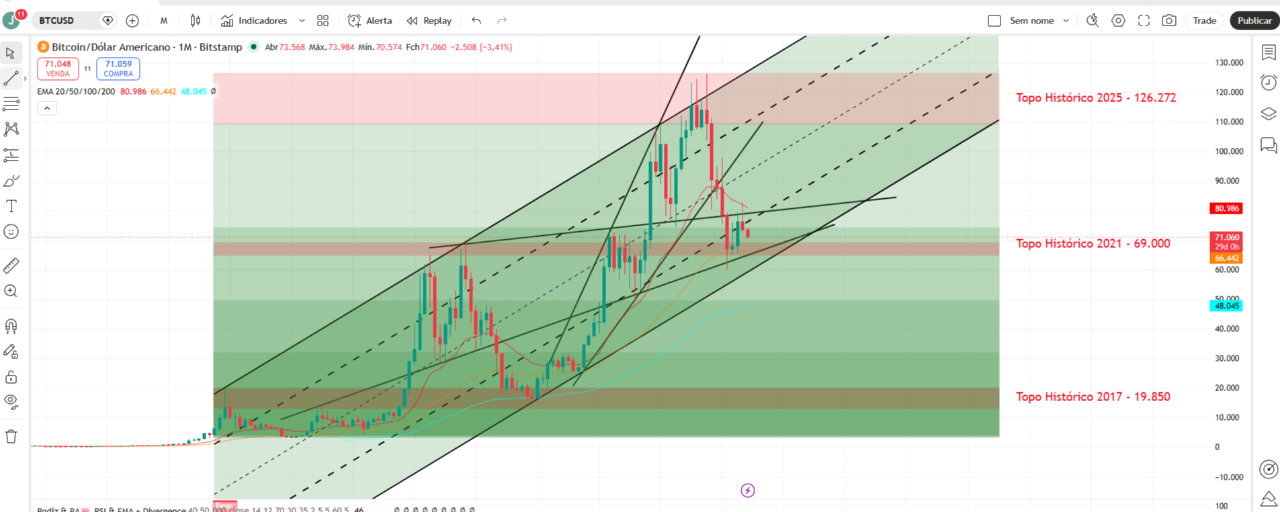
After hitting a historical peak near $126,000 in 2025, Bitcoin has entered a correction and consolidation phase that's raising eyebrows among traders. The big question right now is: are we at the start of a new bear market or just a healthy pullback within a larger bull cycle?
To answer this question, we need to analyze not just the candlestick chart, but also Bitcoin's historical indicators, the global macroeconomic context, and valuation metrics like the Mayer Multiple.
Bitcoin: The Start of a New Cycle
Bitcoin in 2026: Technical, Macroeconomic, and Cycle Analysis with Mayer Multiple
After hitting a historical peak near $126,000 in 2025, Bitcoin has entered a correction and consolidation phase that's raising eyebrows among traders. The big question right now is: are we at the start of a new bear market or just a healthy pullback within a larger bull cycle?
To answer this question, we need to analyze not just the candlestick chart, but also Bitcoin's historical indicators, the global macroeconomic context, and valuation metrics like the Mayer Multiple.
3
1.7k
·
--
131
·
--
2
2
1
3.7k
·
--
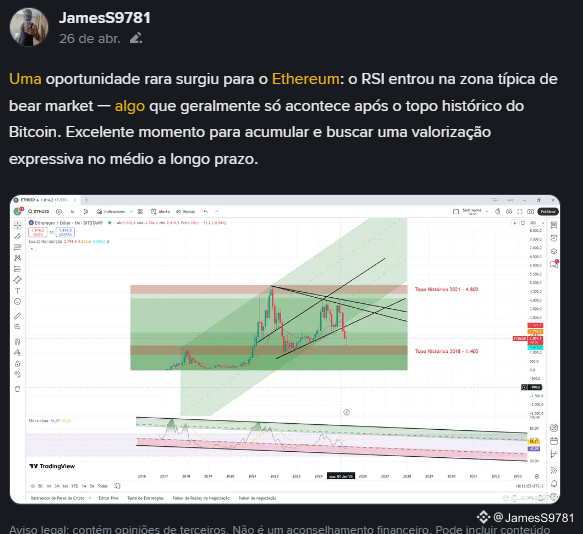
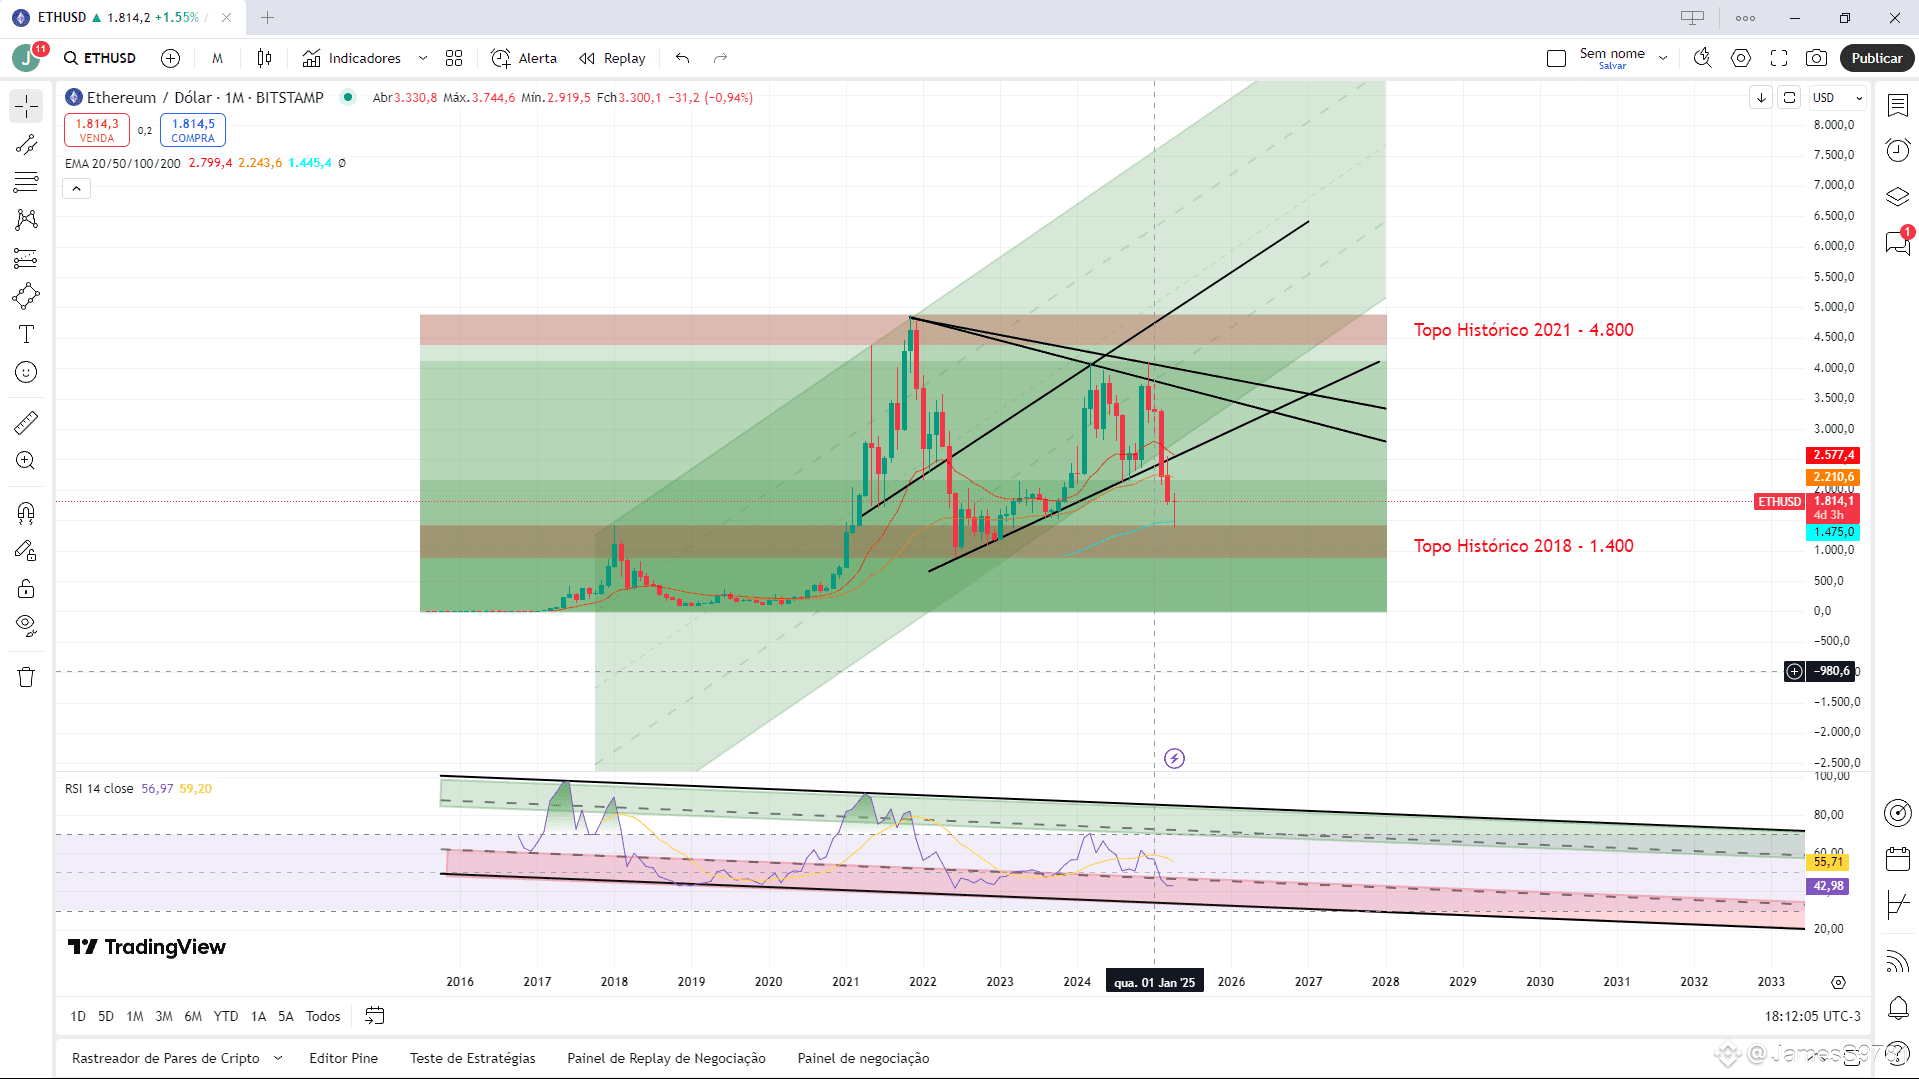
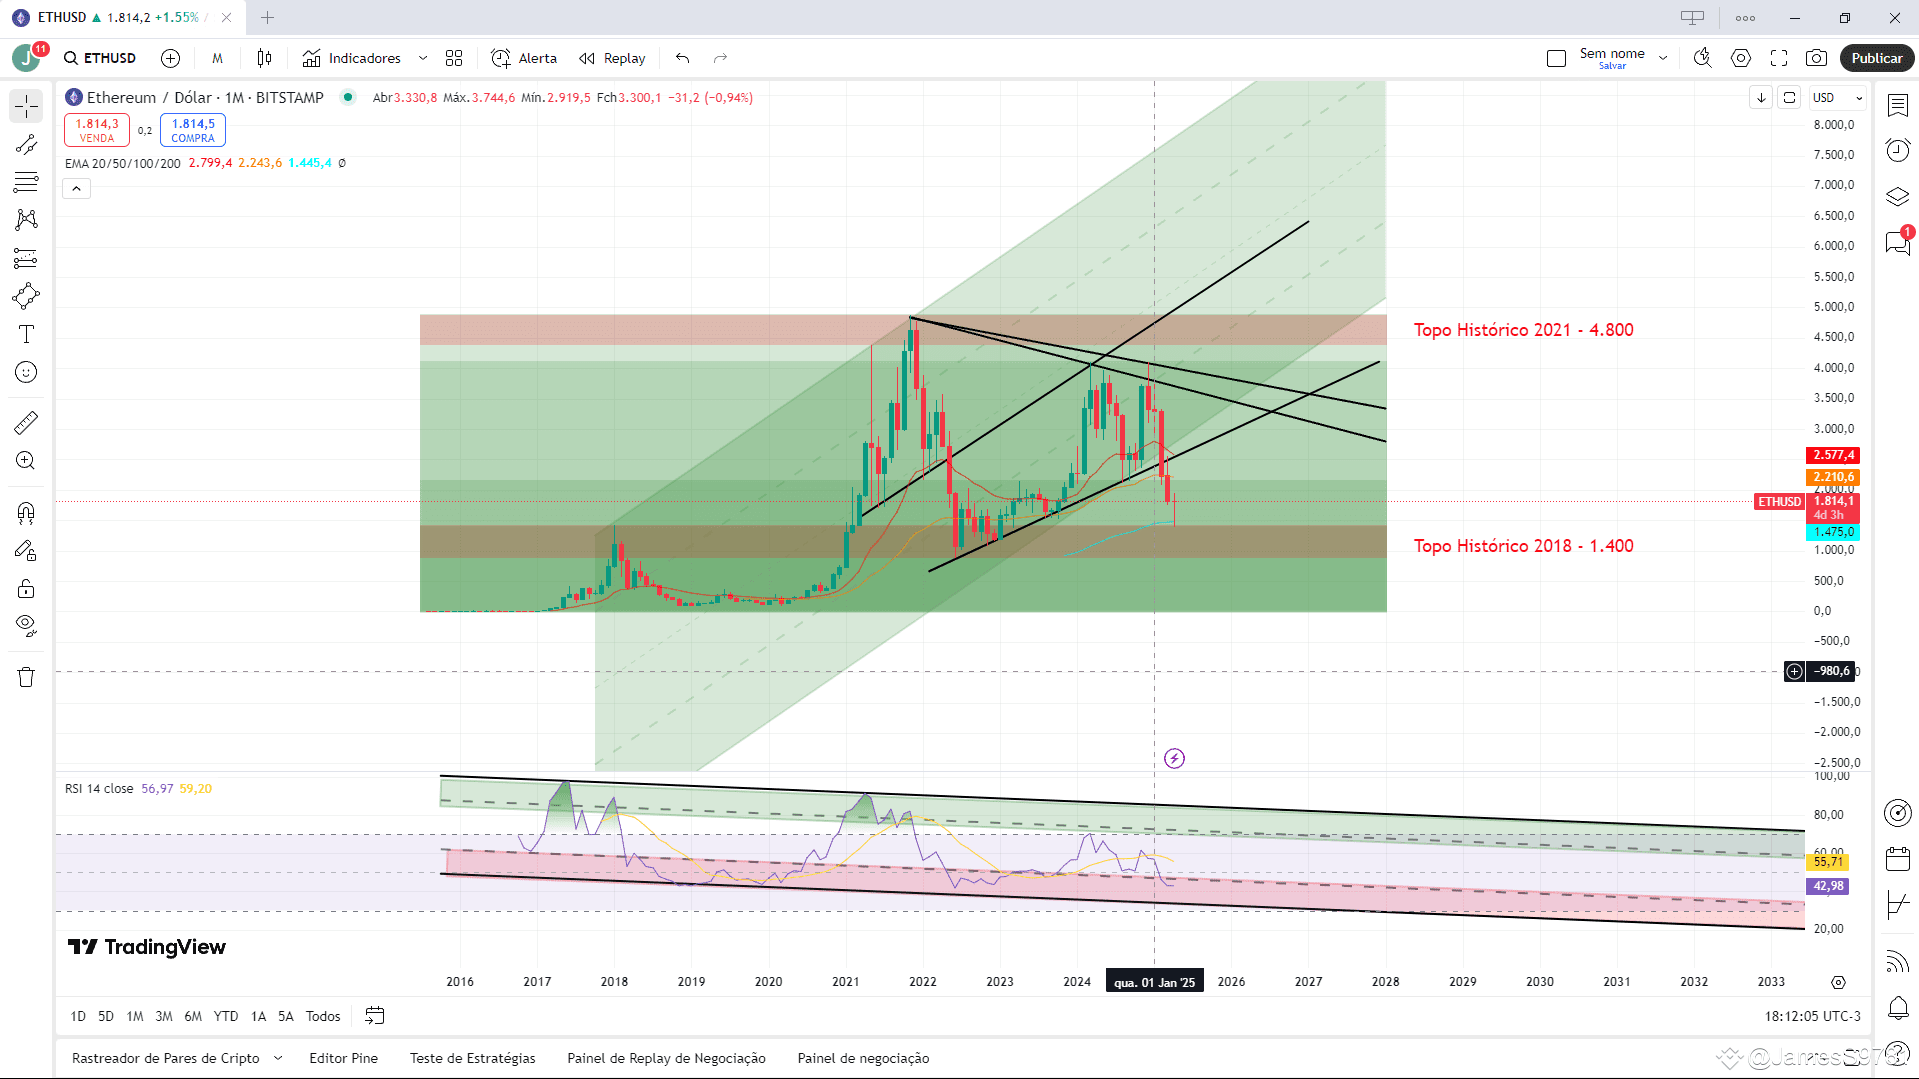
A rare opportunity has arisen for Ethereum: the RSI has entered the typical bear market zone — something that usually only happens after Bitcoin’s all-time high. An excellent time to accumulate and seek significant appreciation in the medium to long term.
A rare opportunity has arisen for Ethereum: the RSI has entered the typical bear market zone — something that usually only happens after Bitcoin’s all-time high. An excellent time to accumulate and seek significant appreciation in the medium to long term.
213
·
--
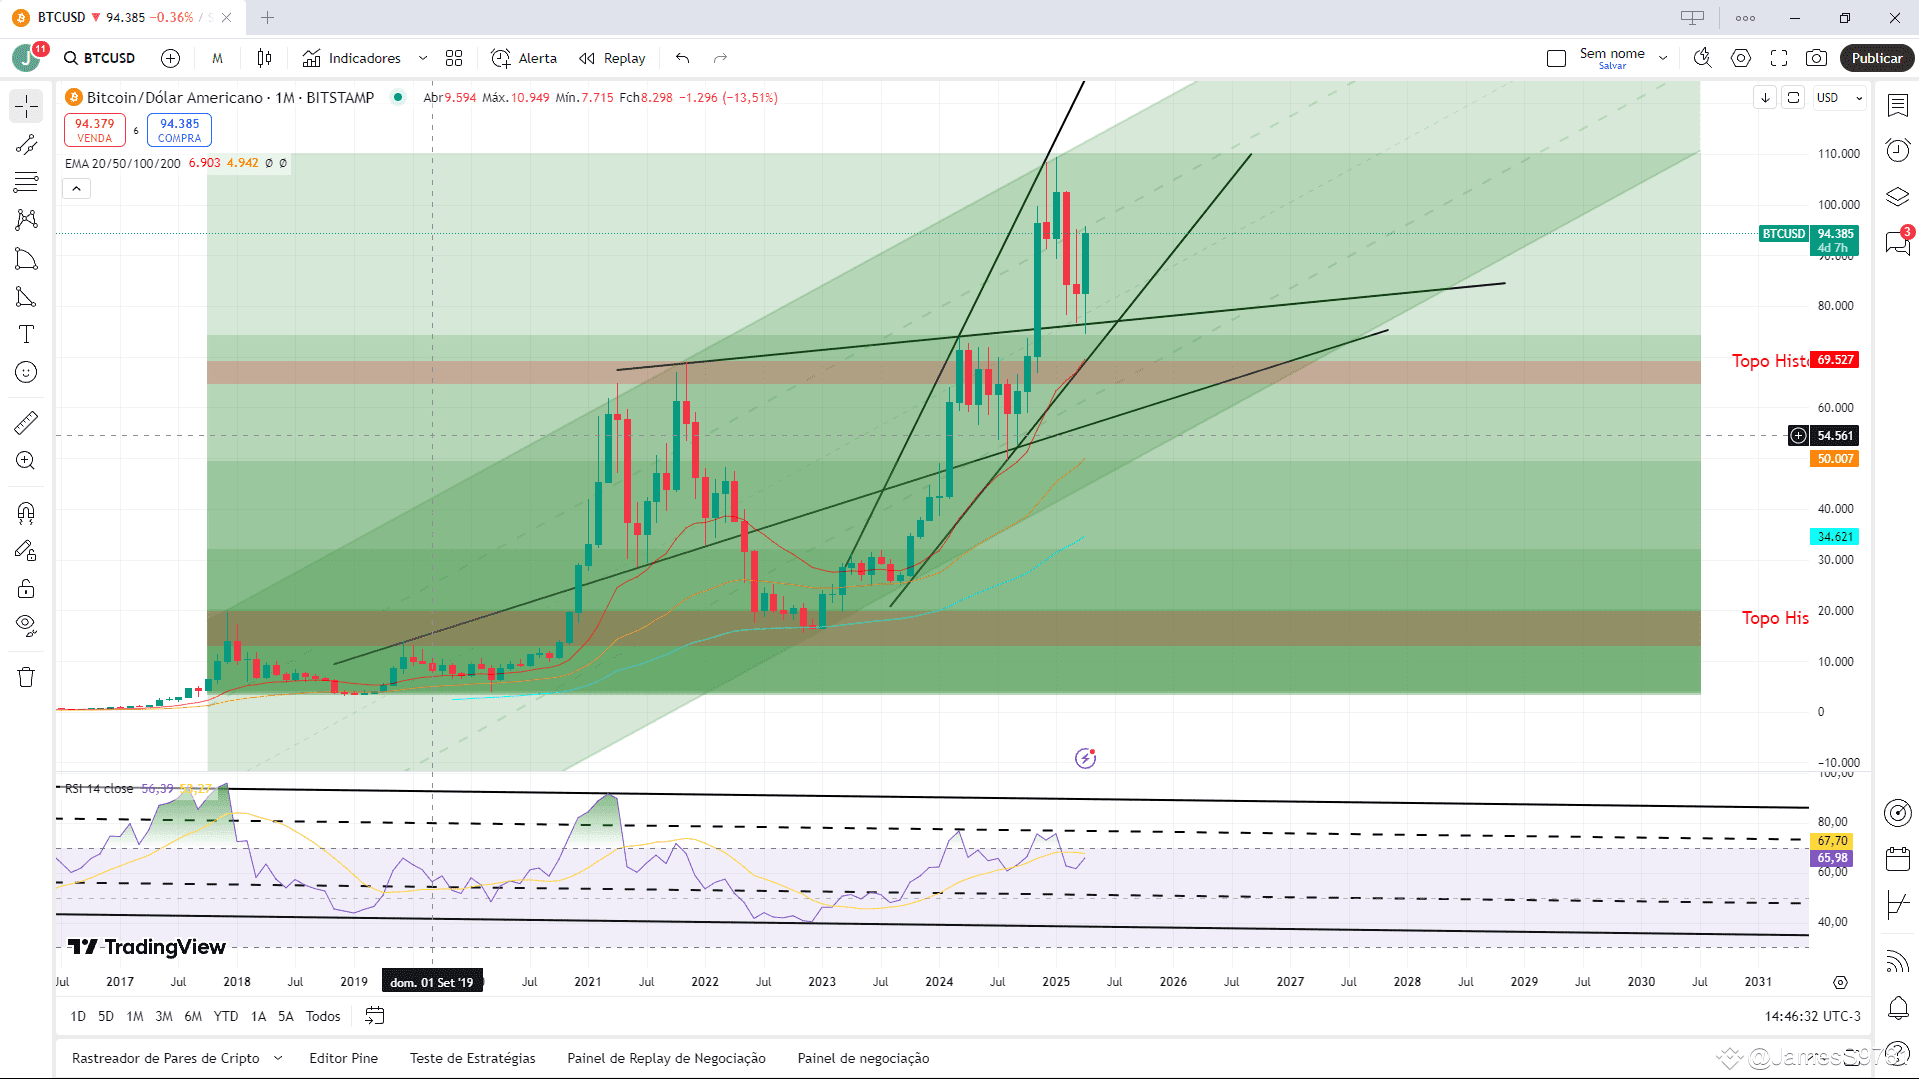
If we observe the history of Bitcoin, after breaking a previous high and reaching a new all-time high, it usually does not fall back below that level. This would indicate that, even in a future Bear Market, the price would not drop below the support that exists between 69 thousand dollars and 65 thousand dollars, which was the peak recorded in 2021.
If we observe the history of Bitcoin, after breaking a previous high and reaching a new all-time high, it usually does not fall back below that level. This would indicate that, even in a future Bear Market, the price would not drop below the support that exists between 69 thousand dollars and 65 thousand dollars, which was the peak recorded in 2021.
285
·
--
Study the BTC cycle, do DCA, move to a cold wallet, and be patient.
Study the BTC cycle, do DCA, move to a cold wallet, and be patient.
542
·
--
Bullish
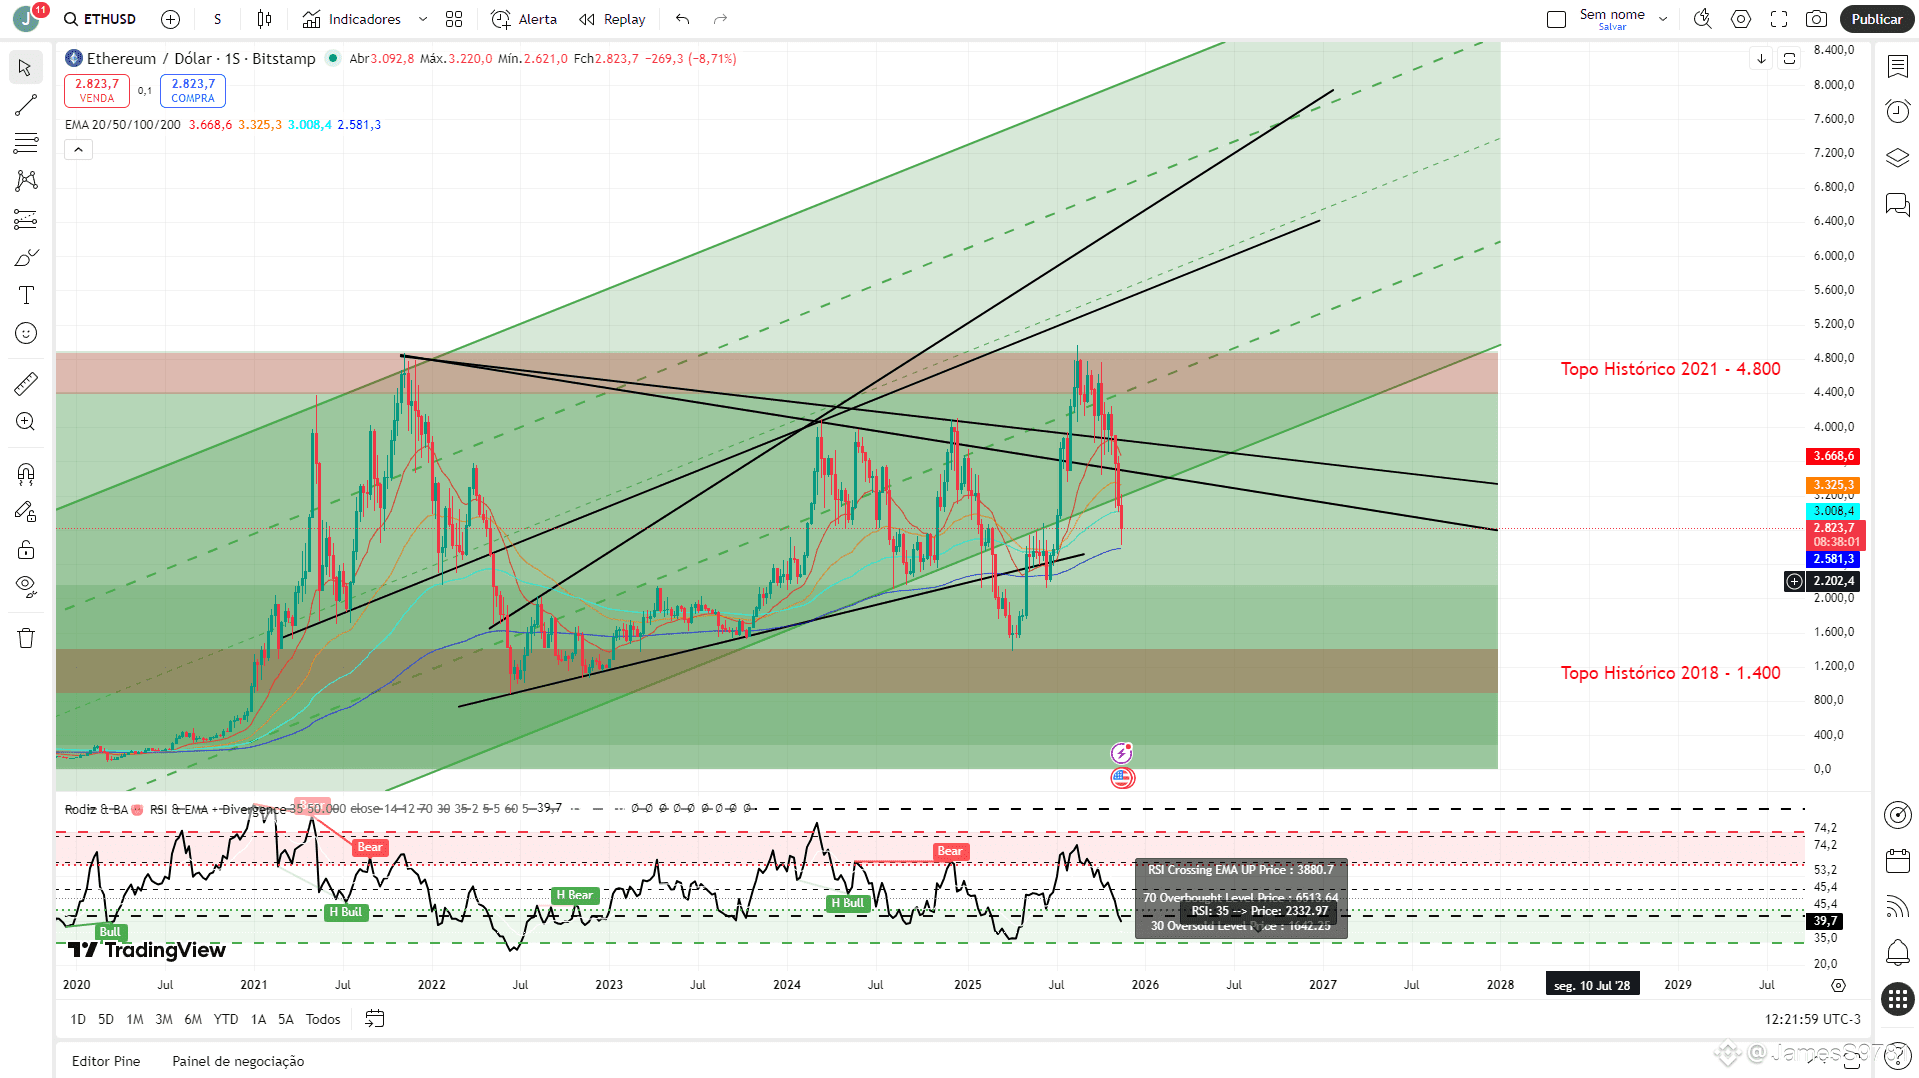
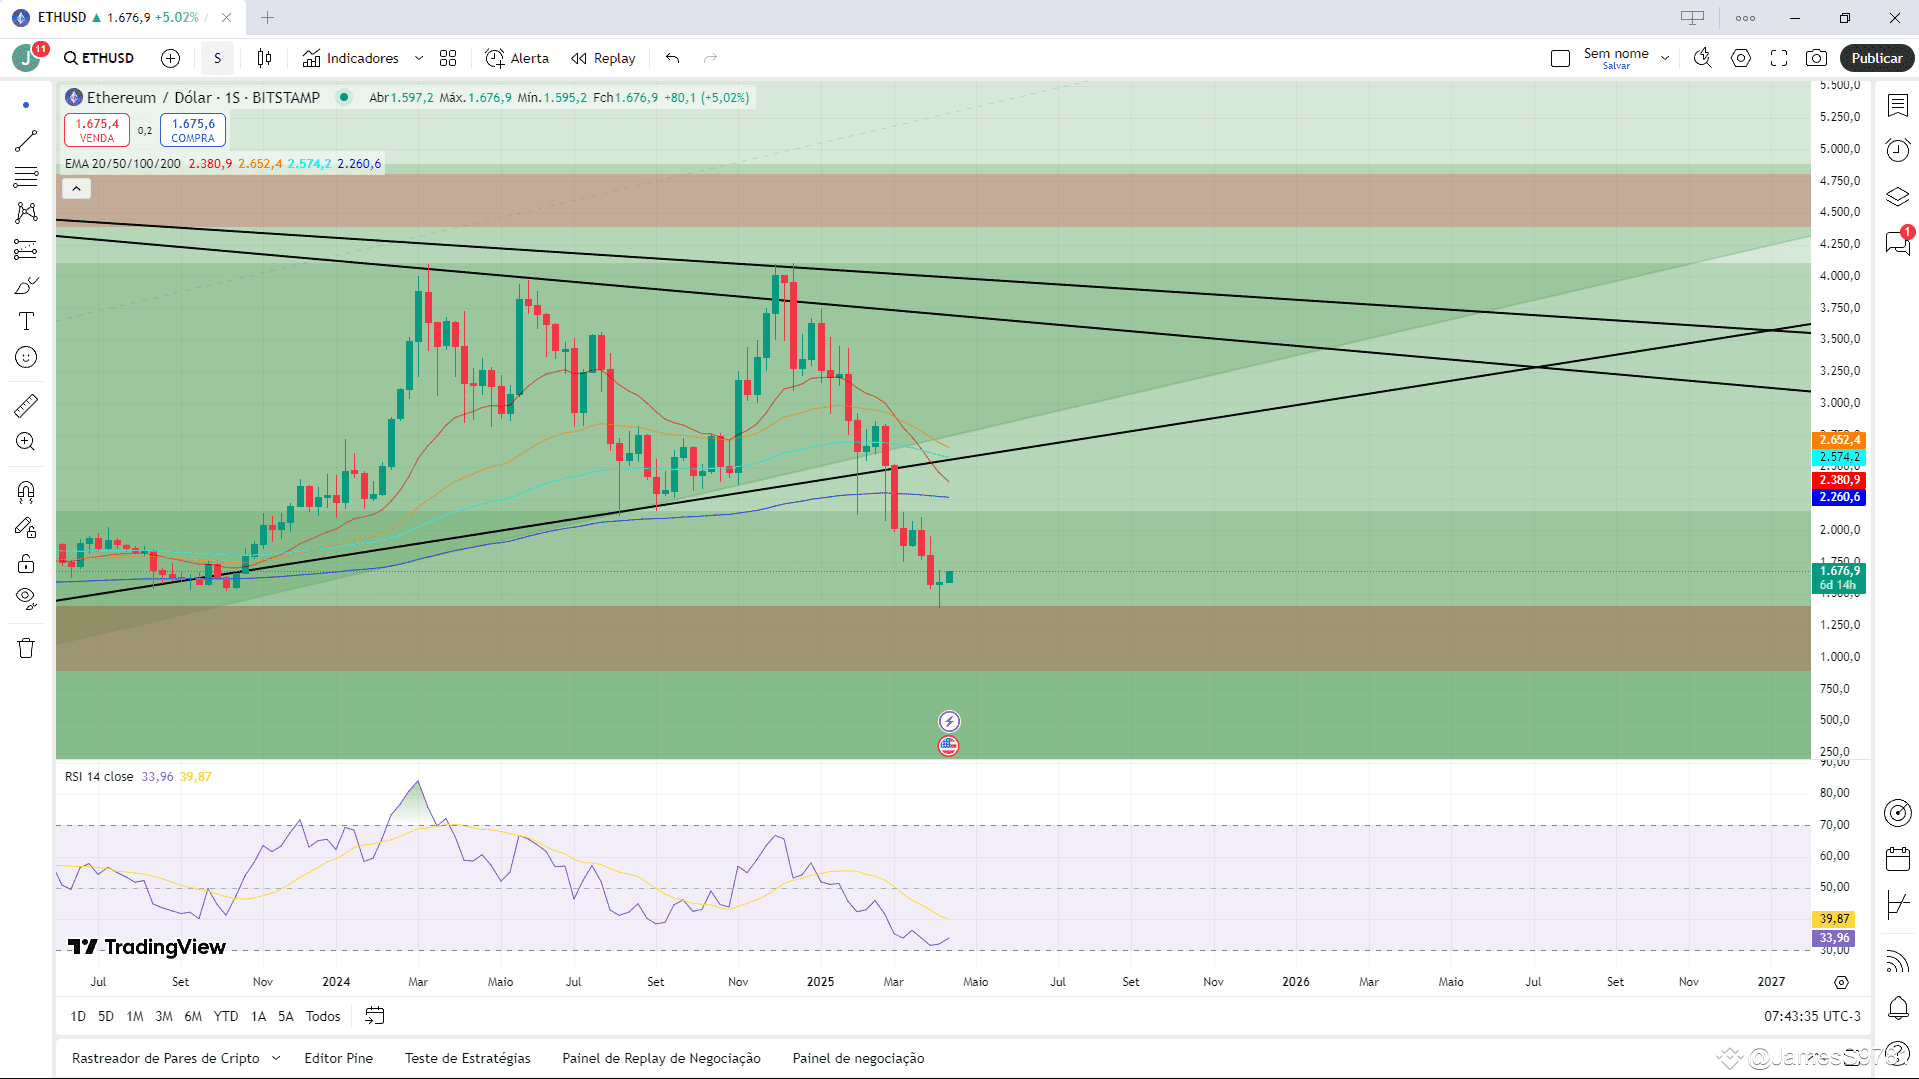
Ethereum at an interesting technical point: the RSI is in the oversold zone, the 2018 high is being respected as support, and a possible reversal pattern is starting to form. Additionally, the price of ETH has fallen below the realized price — a sign that most investors are at a loss, but historically this is an area where whales usually start accumulating. We will closely monitor the closing of the next week.
Ethereum at an interesting technical point: the RSI is in the oversold zone, the 2018 high is being respected as support, and a possible reversal pattern is starting to form. Additionally, the price of ETH has fallen below the realized price — a sign that most investors are at a loss, but historically this is an area where whales usually start accumulating. We will closely monitor the closing of the next week.
2
1
887
·
--

Article
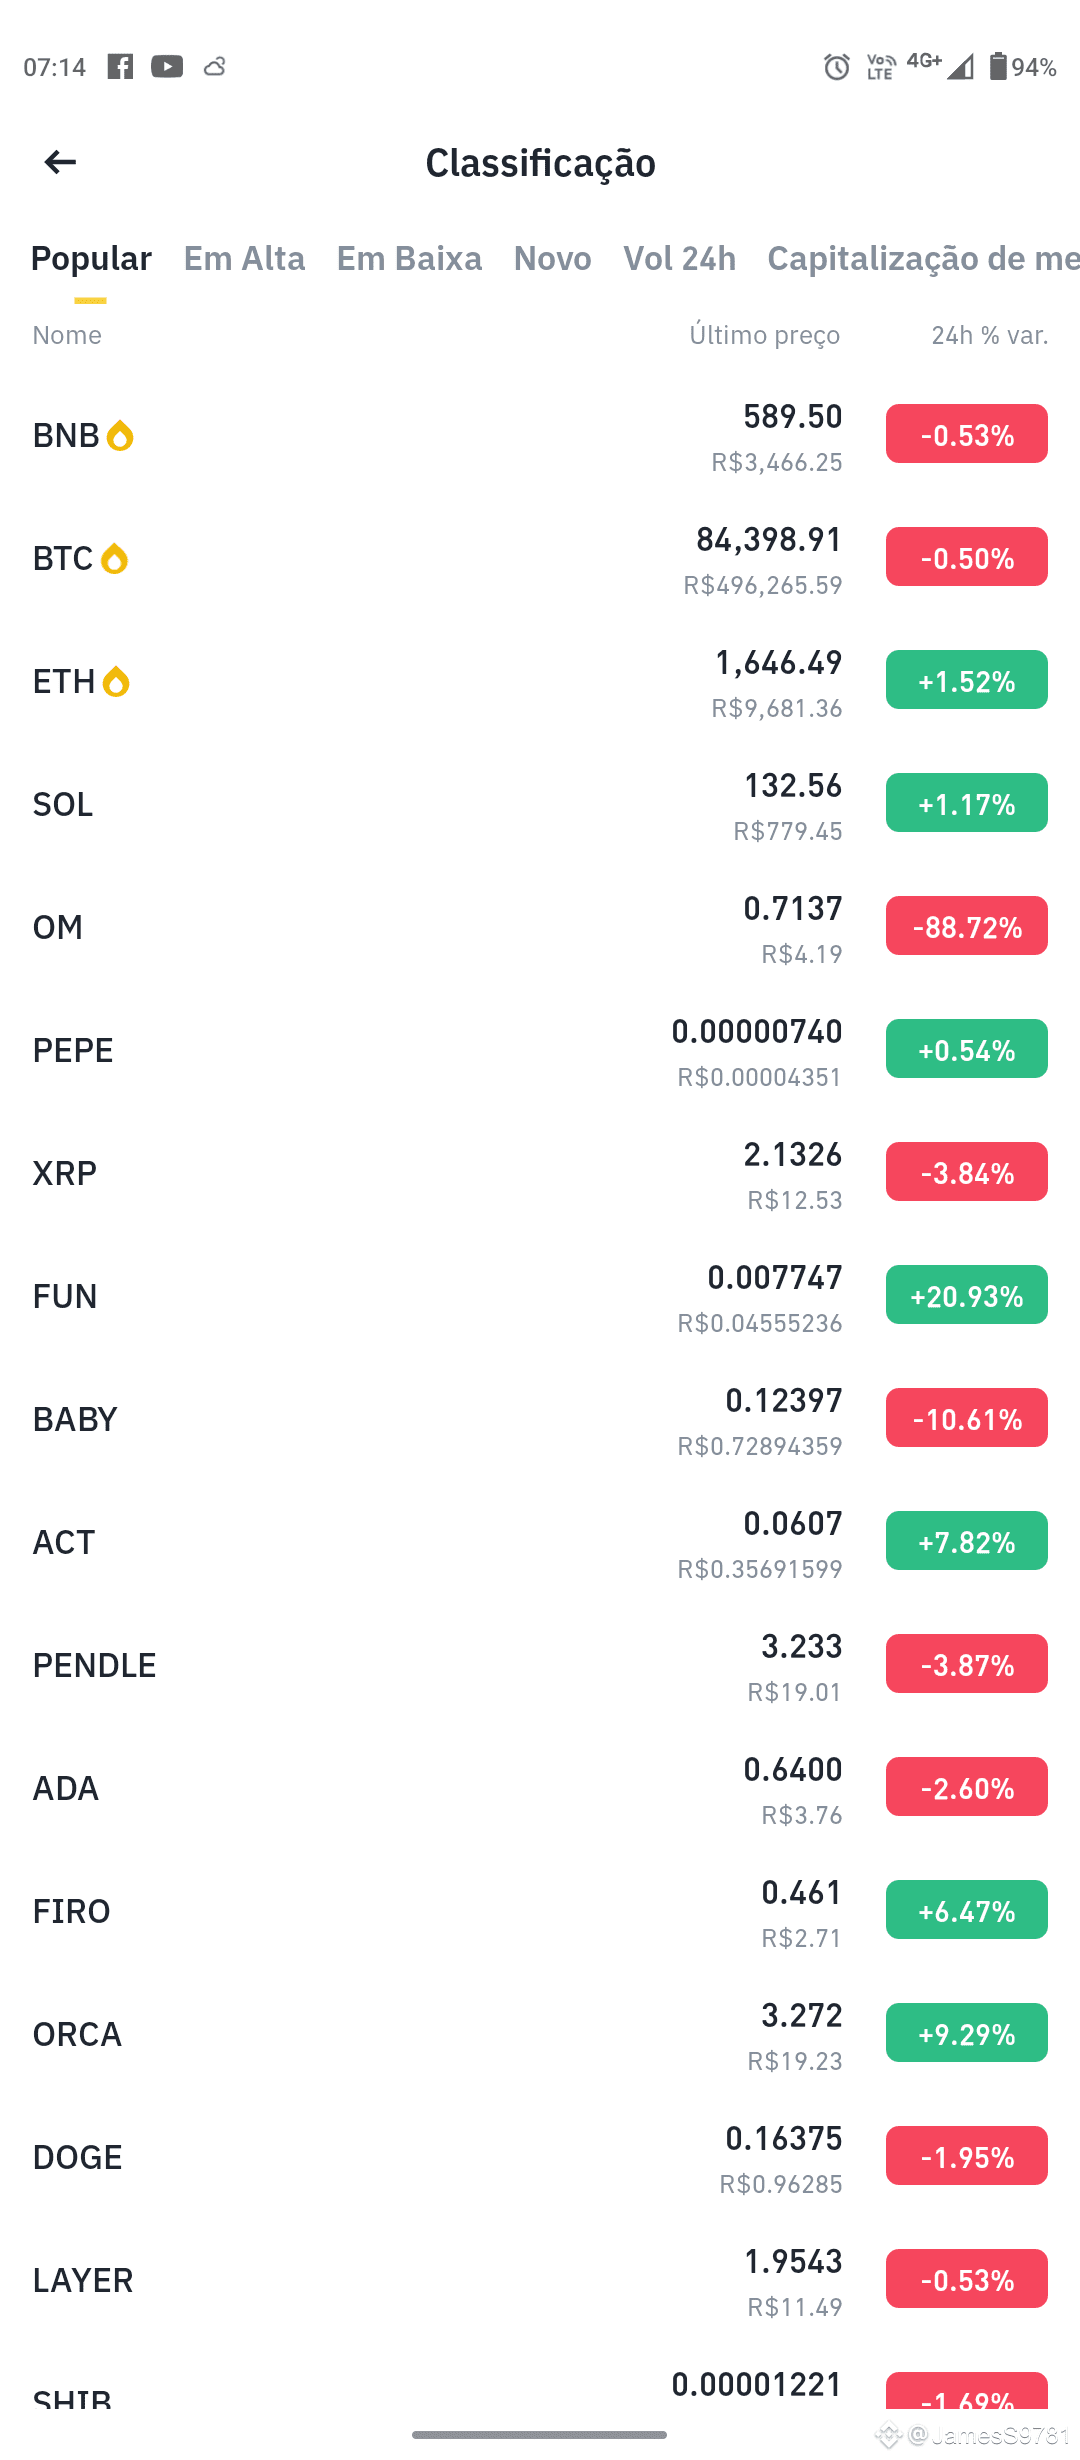
OM Token Plummets 90% in Hours: Manipulation or Inevitable Collapse?The OM token (MANTRA) fell nearly 90% in a few hours on April 13, 2025, plummeting from a peak of $6.33 to $0.58. This sudden collapse wiped out between $3.5 and $4.5 billion in market capitalization, leaving investors shocked and seeking explanations. Below, I detail what happened, the possible causes, and the impact of this event.
What happened?
The drop was abrupt, occurring in less than an hour, according to reports. The token, which was among the most valued in the market, lost most of its value in a short period, generating panic among investors. Furthermore, the project's team deleted the official Telegram group of Mantra, cutting off communication with the community during the crisis.
OM Token Plummets 90% in Hours: Manipulation or Inevitable Collapse?
The OM token (MANTRA) fell nearly 90% in a few hours on April 13, 2025, plummeting from a peak of $6.33 to $0.58. This sudden collapse wiped out between $3.5 and $4.5 billion in market capitalization, leaving investors shocked and seeking explanations. Below, I detail what happened, the possible causes, and the impact of this event.
What happened?
The drop was abrupt, occurring in less than an hour, according to reports. The token, which was among the most valued in the market, lost most of its value in a short period, generating panic among investors. Furthermore, the project's team deleted the official Telegram group of Mantra, cutting off communication with the community during the crisis.
1
291
·
--
Bullish
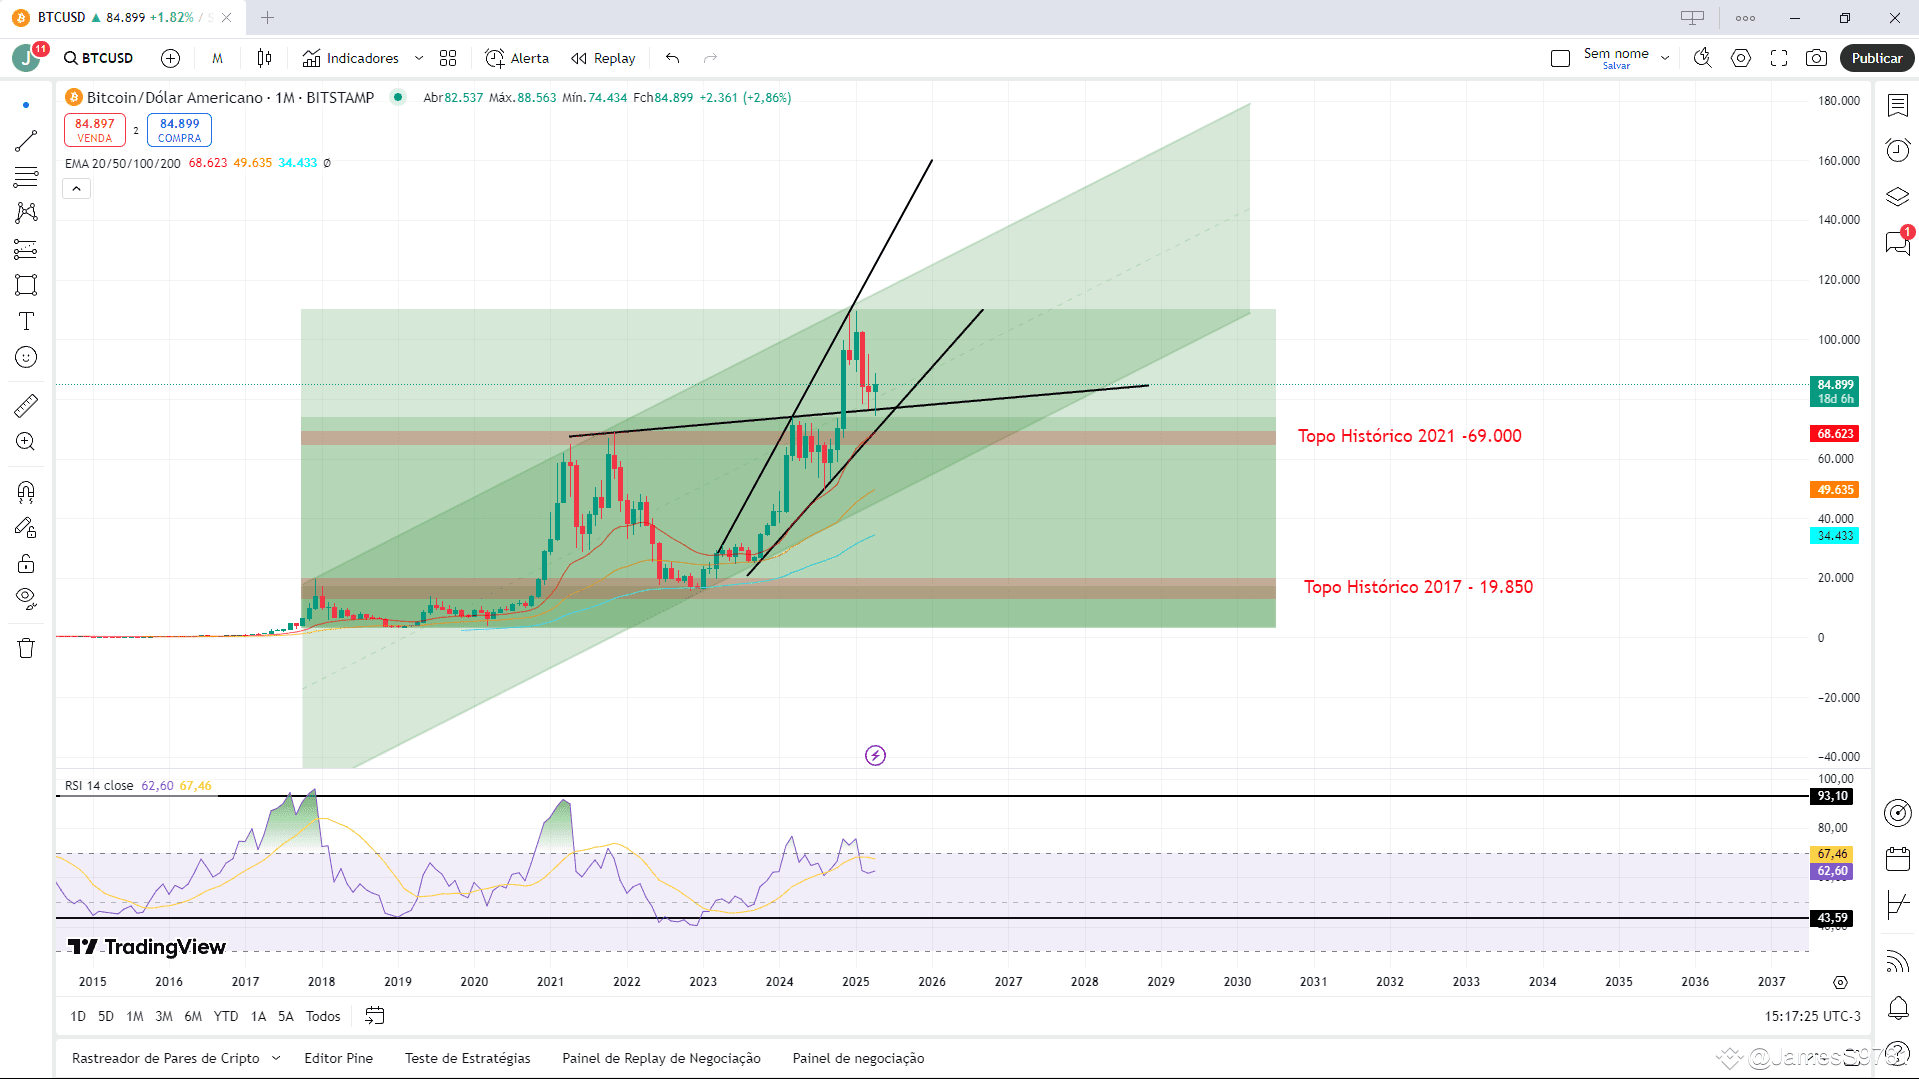
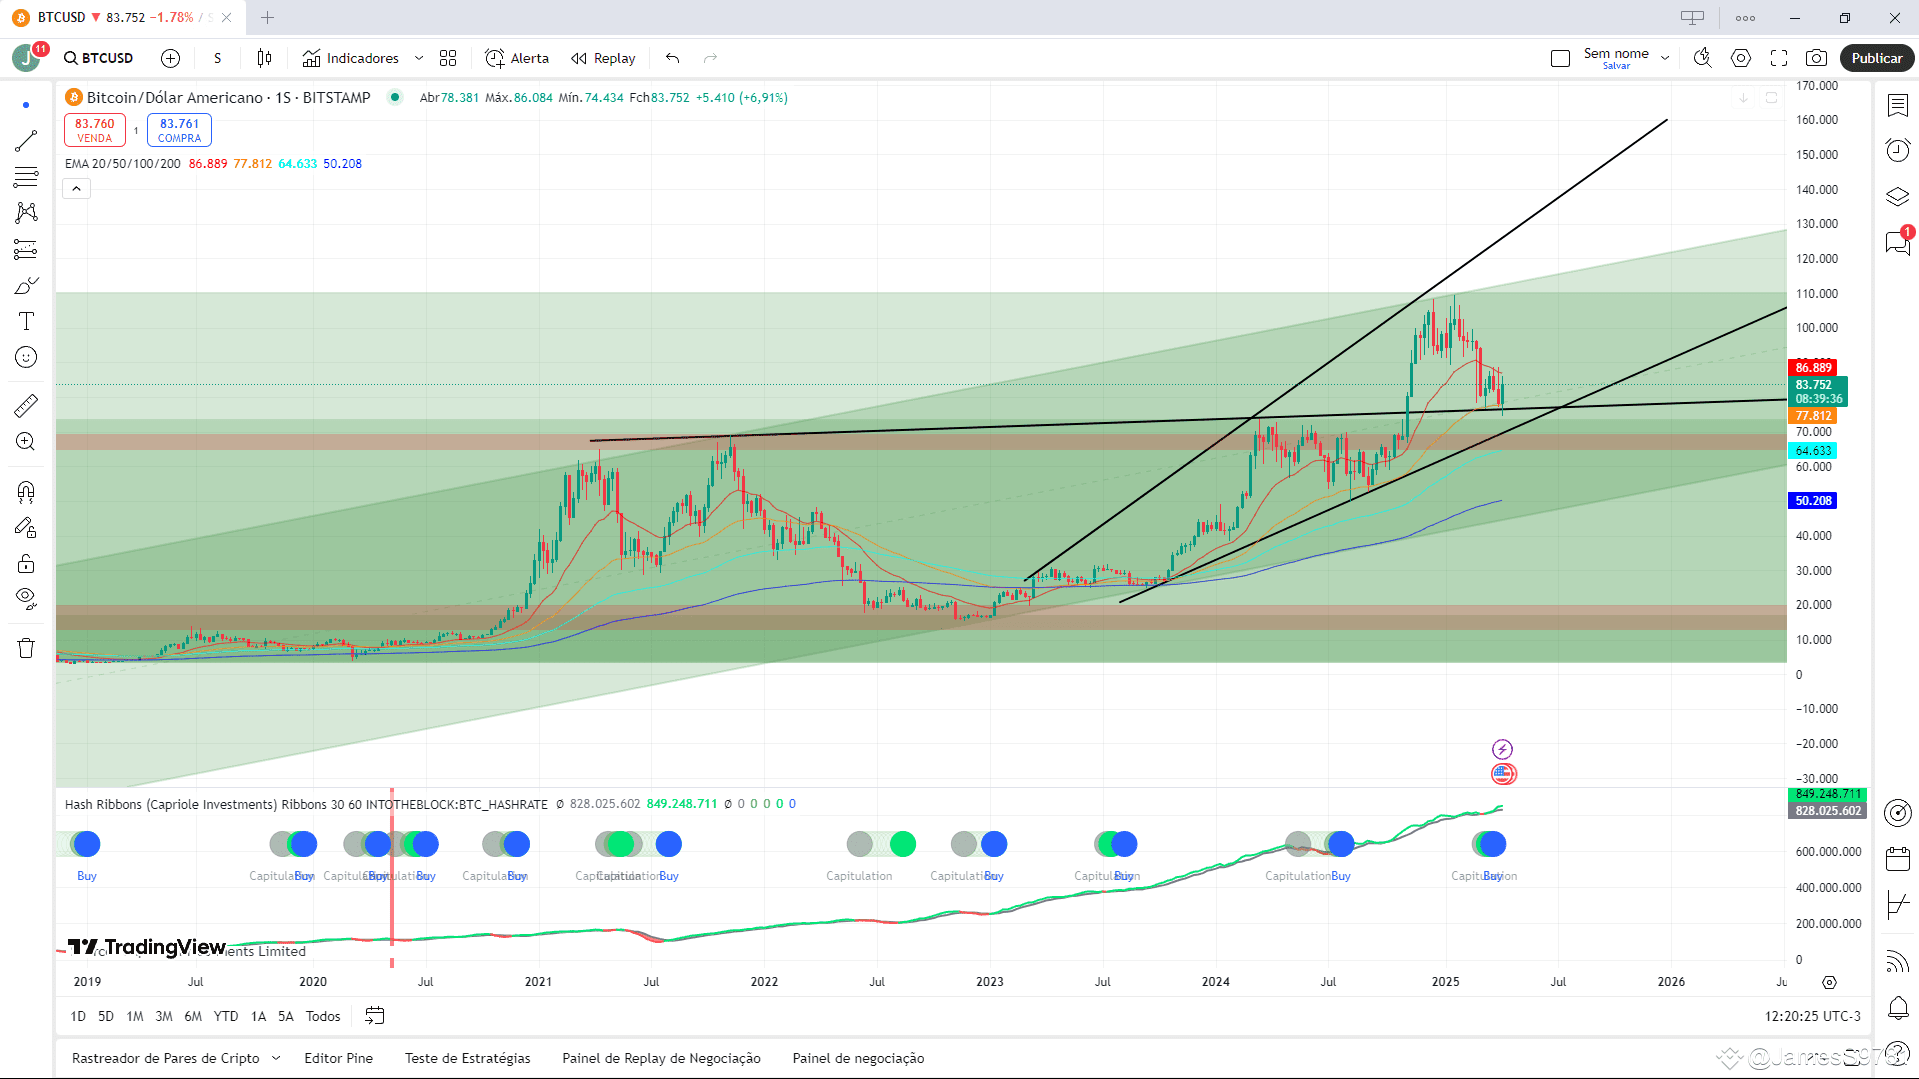
BTC is above the previous peak, testing the trend line (TL) and still within an ascending widening wedge. On the monthly chart, the price remains above the 20, 50, and 100 period moving averages, reinforcing the bullish trend. The RSI is in neutral territory, not indicating overbought or oversold conditions. Additionally, the Hash Ribbons indicator recently signaled a buy on the weekly chart, which strengthens the optimistic outlook. A 'Morning Star' reversal pattern is also beginning to form on the monthly chart. In the medium and long term, the trend is clearly bullish.
BTC is above the previous peak, testing the trend line (TL) and still within an ascending widening wedge. On the monthly chart, the price remains above the 20, 50, and 100 period moving averages, reinforcing the bullish trend. The RSI is in neutral territory, not indicating overbought or oversold conditions. Additionally, the Hash Ribbons indicator recently signaled a buy on the weekly chart, which strengthens the optimistic outlook. A 'Morning Star' reversal pattern is also beginning to form on the monthly chart. In the medium and long term, the trend is clearly bullish.
829
·
--
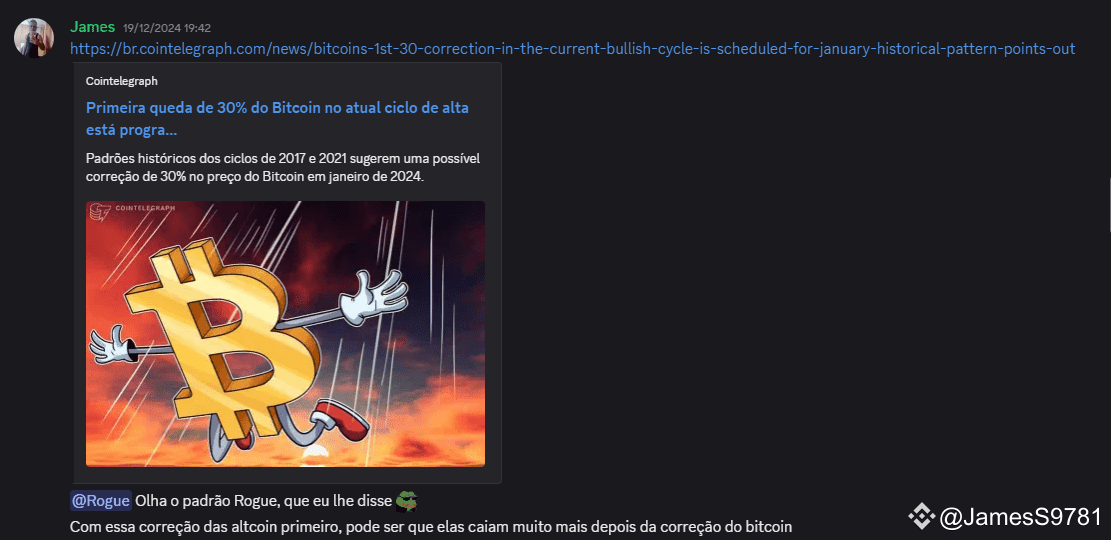
Funny how everyone is waiting for the correction but when it comes, everyone panics, and I keep buying strongly.
Funny how everyone is waiting for the correction but when it comes, everyone panics, and I keep buying strongly.
23
5
37
16.4k
·
--

Article
Why is self-custody advantageous?Keeping your bitcoins under your own custody means using a wallet that you control, such as a software wallet (e.g., Electrum) or a hardware wallet (e.g., Trezor). This avoids relying on third parties, like exchanges, which can go bankrupt or be hacked. You have full control, privacy, and security, without risks of freezes or losses in case of problems with the platform.
The FTX case as an example
In November 2022, the FTX exchange collapsed after revealing poor financial management, with users unable to withdraw their bitcoins. Investigations showed that customer funds were misused, and although there are reimbursement plans, the process is slow and uncertain. This highlights how leaving bitcoins on exchanges can be risky.
Why is self-custody advantageous?
Keeping your bitcoins under your own custody means using a wallet that you control, such as a software wallet (e.g., Electrum) or a hardware wallet (e.g., Trezor). This avoids relying on third parties, like exchanges, which can go bankrupt or be hacked. You have full control, privacy, and security, without risks of freezes or losses in case of problems with the platform.
The FTX case as an example
In November 2022, the FTX exchange collapsed after revealing poor financial management, with users unable to withdraw their bitcoins. Investigations showed that customer funds were misused, and although there are reimbursement plans, the process is slow and uncertain. This highlights how leaving bitcoins on exchanges can be risky.
277
·
--
Article
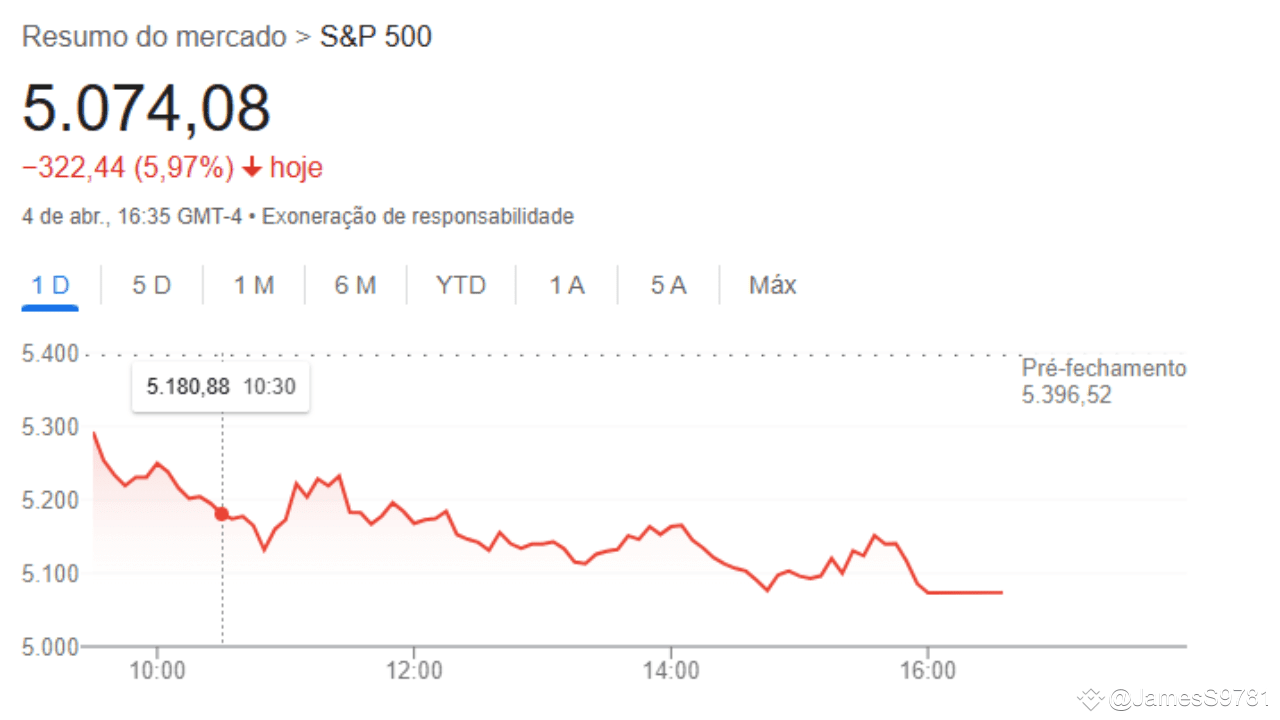
S&P 500 Drops Nearly 6% with Trump's Tariffs, but Bitcoin Rises 1%: Understand the Possible CausesToday, the financial market witnessed an intriguing event: the S&P 500 plummeted nearly 6% after the announcement of tariffs imposed by the Trump administration, while Bitcoin (BTC) defied the trend and recorded a 1% increase. This contrast challenges the common expectation that negative events in the stock market would also affect risky assets like cryptocurrencies. In this article, we explore the possible causes of this divergence, analyzing what might be behind Bitcoin's resilience on a day of economic turmoil.
S&P 500 Drops Nearly 6% with Trump's Tariffs, but Bitcoin Rises 1%: Understand the Possible Causes
Today, the financial market witnessed an intriguing event: the S&P 500 plummeted nearly 6% after the announcement of tariffs imposed by the Trump administration, while Bitcoin (BTC) defied the trend and recorded a 1% increase. This contrast challenges the common expectation that negative events in the stock market would also affect risky assets like cryptocurrencies. In this article, we explore the possible causes of this divergence, analyzing what might be behind Bitcoin's resilience on a day of economic turmoil.
377
Log in to explore more content
Join global crypto users on Binance Square
⚡️ Get latest and useful information about crypto.
💬 Trusted by the world’s largest crypto exchange.
👍 Discover real insights from verified creators.
Email / Phone number