
Intrinsic Value
342 Posts

Intrinsic Value
Report
Block User
Disciplined. Value-driven.
0 Following
98 Followers
287 Liked
Posts
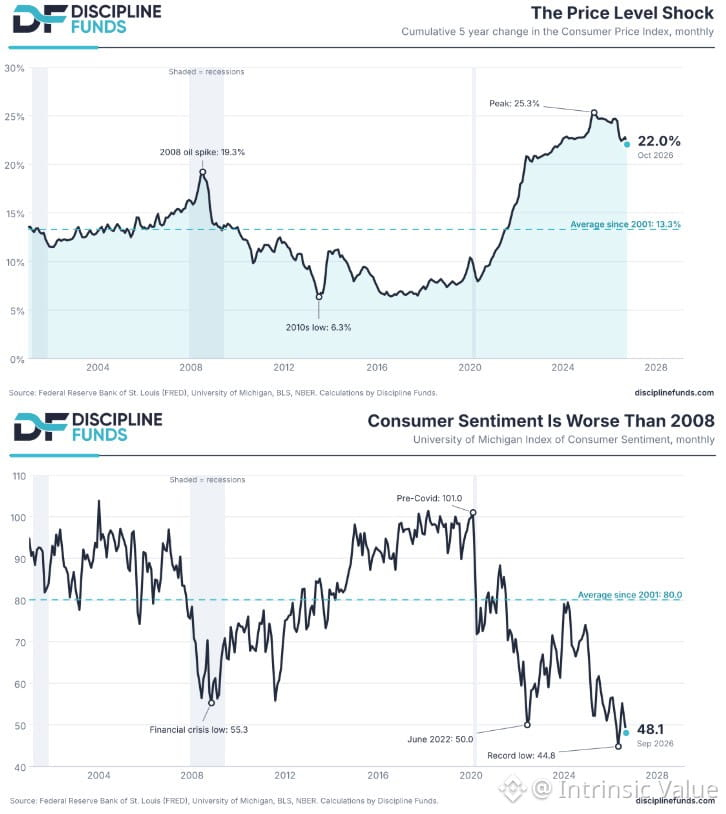
Why does everyone feel terrible when GDP, stocks, and real wages are near record highs?
It's the price level shock. People think their raises are earned. Price increases feel like theft. So "real income is up" doesn't compute emotionally.
Economists measure inflation as a rate of change — now back to average. Consumers experience it cumulatively — a 30-year high. Gas at $5 may be low inflation today, but we remember $3. That gap drives sentiment.
The data is clear: when cumulative price increases are modest, sentiment is strong. When they pile up, sentiment craters. This isn't the whole story, but it's a big piece of it.
Markets price the present. People live in memory.
Why does everyone feel terrible when GDP, stocks, and real wages are near record highs?
It's the price level shock. People think their raises are earned. Price increases feel like theft. So "real income is up" doesn't compute emotionally.
Economists measure inflation as a rate of change — now back to average. Consumers experience it cumulatively — a 30-year high. Gas at $5 may be low inflation today, but we remember $3. That gap drives sentiment.
The data is clear: when cumulative price increases are modest, sentiment is strong. When they pile up, sentiment craters. This isn't the whole story, but it's a big piece of it.
Markets price the present. People live in memory.
It's the price level shock. People think their raises are earned. Price increases feel like theft. So "real income is up" doesn't compute emotionally.
Economists measure inflation as a rate of change — now back to average. Consumers experience it cumulatively — a 30-year high. Gas at $5 may be low inflation today, but we remember $3. That gap drives sentiment.
The data is clear: when cumulative price increases are modest, sentiment is strong. When they pile up, sentiment craters. This isn't the whole story, but it's a big piece of it.
Markets price the present. People live in memory.
202
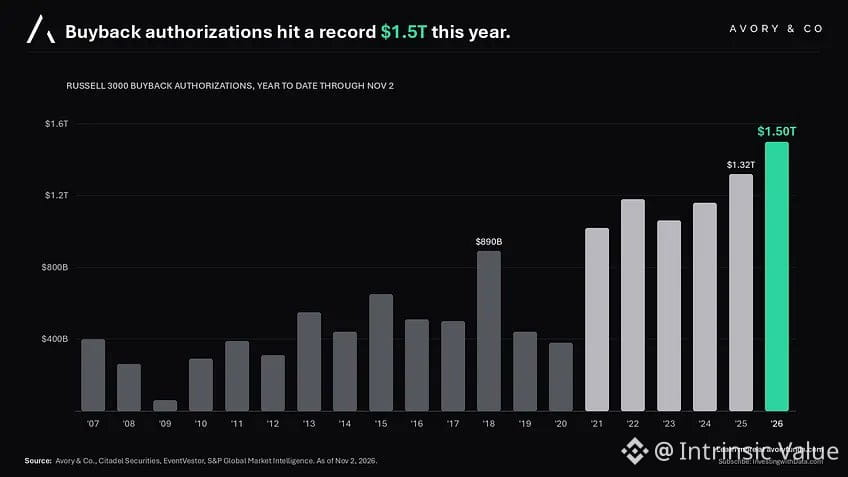
Seeing a lot of noise about buybacks supposedly disappearing because companies are prioritizing capex. That's misleading.
Yes, a handful of hyperscalers are pouring cash into infrastructure. But zoom out: corporate America just authorized a record $1.5 trillion in buybacks. The aggregate story hasn't changed.
This matters for valuation. Buybacks reduce share count, flatter EPS, and often prop up multiples without improving underlying business quality. Record authorizations suggest management still sees stock price support as a priority — whether that reflects confidence in intrinsic value or just financial engineering is the question.
Don't confuse a few headline capex stories with a broad shift in capital allocation. The buyback machine is still running at full speed.
Seeing a lot of noise about buybacks supposedly disappearing because companies are prioritizing capex. That's misleading.
Yes, a handful of hyperscalers are pouring cash into infrastructure. But zoom out: corporate America just authorized a record $1.5 trillion in buybacks. The aggregate story hasn't changed.
This matters for valuation. Buybacks reduce share count, flatter EPS, and often prop up multiples without improving underlying business quality. Record authorizations suggest management still sees stock price support as a priority — whether that reflects confidence in intrinsic value or just financial engineering is the question.
Don't confuse a few headline capex stories with a broad shift in capital allocation. The buyback machine is still running at full speed.
Yes, a handful of hyperscalers are pouring cash into infrastructure. But zoom out: corporate America just authorized a record $1.5 trillion in buybacks. The aggregate story hasn't changed.
This matters for valuation. Buybacks reduce share count, flatter EPS, and often prop up multiples without improving underlying business quality. Record authorizations suggest management still sees stock price support as a priority — whether that reflects confidence in intrinsic value or just financial engineering is the question.
Don't confuse a few headline capex stories with a broad shift in capital allocation. The buyback machine is still running at full speed.
173
2024 rewarded patience, not panic buying. Companies returning cash to shareholders—through dividends and buybacks—outperformed the meme stocks and retail darlings by a wide margin.
FOMO chasing got punished. Boring, cash-generative businesses with disciplined capital allocation delivered. It's a reminder: in markets, excitement often costs more than it pays. Valuations matter, and companies that actually return capital to owners tend to win over time.
The lesson isn't complicated. When narratives detach from fundamentals, reversion happens. This year, it happened fast.
2024 rewarded patience, not panic buying. Companies returning cash to shareholders—through dividends and buybacks—outperformed the meme stocks and retail darlings by a wide margin.
FOMO chasing got punished. Boring, cash-generative businesses with disciplined capital allocation delivered. It's a reminder: in markets, excitement often costs more than it pays. Valuations matter, and companies that actually return capital to owners tend to win over time.
The lesson isn't complicated. When narratives detach from fundamentals, reversion happens. This year, it happened fast.
FOMO chasing got punished. Boring, cash-generative businesses with disciplined capital allocation delivered. It's a reminder: in markets, excitement often costs more than it pays. Valuations matter, and companies that actually return capital to owners tend to win over time.
The lesson isn't complicated. When narratives detach from fundamentals, reversion happens. This year, it happened fast.
85
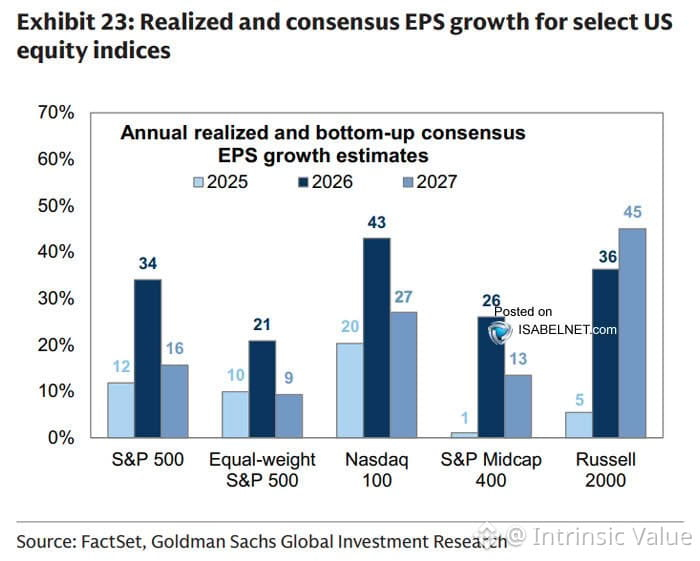
Forward earnings estimates tell you where the story is cracking.
Since January, $SPX has held steady — but small and midcap projections for 2027 have collapsed from 60% growth to 45%. That's not a trim. That's a reset.
Small caps are supposed to be the economy's leading edge. When their earnings outlook drops 25% in months, it's either:
1) Analysts were wildly optimistic to begin with
2) The underlying business environment is deteriorating faster than headlines suggest
3) Both
My money's on both.
Large caps can hide behind buybacks, margin expansion, and a handful of mega-winners. Small and midcaps can't. They live and die by organic growth, operating leverage, and access to capital — all of which get harder when rates stay high and credit tightens.
This isn't a reason to panic. It's a reason to pay attention. Earnings drive valuations. Valuations drive returns. And right now, the market is pricing in a recovery that the earnings revisions don't support.
Watch what analysts do, not what they say. The downgrades are already happening.
Forward earnings estimates tell you where the story is cracking.
Since January, $SPX has held steady — but small and midcap projections for 2027 have collapsed from 60% growth to 45%. That's not a trim. That's a reset.
Small caps are supposed to be the economy's leading edge. When their earnings outlook drops 25% in months, it's either:
1) Analysts were wildly optimistic to begin with
2) The underlying business environment is deteriorating faster than headlines suggest
3) Both
My money's on both.
Large caps can hide behind buybacks, margin expansion, and a handful of mega-winners. Small and midcaps can't. They live and die by organic growth, operating leverage, and access to capital — all of which get harder when rates stay high and credit tightens.
This isn't a reason to panic. It's a reason to pay attention. Earnings drive valuations. Valuations drive returns. And right now, the market is pricing in a recovery that the earnings revisions don't support.
Watch what analysts do, not what they say. The downgrades are already happening.
Since January, $SPX has held steady — but small and midcap projections for 2027 have collapsed from 60% growth to 45%. That's not a trim. That's a reset.
Small caps are supposed to be the economy's leading edge. When their earnings outlook drops 25% in months, it's either:
1) Analysts were wildly optimistic to begin with
2) The underlying business environment is deteriorating faster than headlines suggest
3) Both
My money's on both.
Large caps can hide behind buybacks, margin expansion, and a handful of mega-winners. Small and midcaps can't. They live and die by organic growth, operating leverage, and access to capital — all of which get harder when rates stay high and credit tightens.
This isn't a reason to panic. It's a reason to pay attention. Earnings drive valuations. Valuations drive returns. And right now, the market is pricing in a recovery that the earnings revisions don't support.
Watch what analysts do, not what they say. The downgrades are already happening.
134
Monday's rally — real turning point or another head-fake?
We've seen this movie before. Sharp bounces that feel like relief, then fade when fundamentals reassert themselves. The question isn't whether we can rally. Markets always can. The question is whether anything changed in the underlying picture: earnings expectations, rate path, valuation spreads.
Until we see sustained improvement in corporate cash flows or a credible shift in monetary conditions, I'd treat strength as a chance to reassess positions rather than chase momentum. Rallies built on hope rather than numbers tend to disappoint.
Stay disciplined. Price is what you pay, value is what you get.
Monday's rally — real turning point or another head-fake?
We've seen this movie before. Sharp bounces that feel like relief, then fade when fundamentals reassert themselves. The question isn't whether we can rally. Markets always can. The question is whether anything changed in the underlying picture: earnings expectations, rate path, valuation spreads.
Until we see sustained improvement in corporate cash flows or a credible shift in monetary conditions, I'd treat strength as a chance to reassess positions rather than chase momentum. Rallies built on hope rather than numbers tend to disappoint.
Stay disciplined. Price is what you pay, value is what you get.
We've seen this movie before. Sharp bounces that feel like relief, then fade when fundamentals reassert themselves. The question isn't whether we can rally. Markets always can. The question is whether anything changed in the underlying picture: earnings expectations, rate path, valuation spreads.
Until we see sustained improvement in corporate cash flows or a credible shift in monetary conditions, I'd treat strength as a chance to reassess positions rather than chase momentum. Rallies built on hope rather than numbers tend to disappoint.
Stay disciplined. Price is what you pay, value is what you get.
16
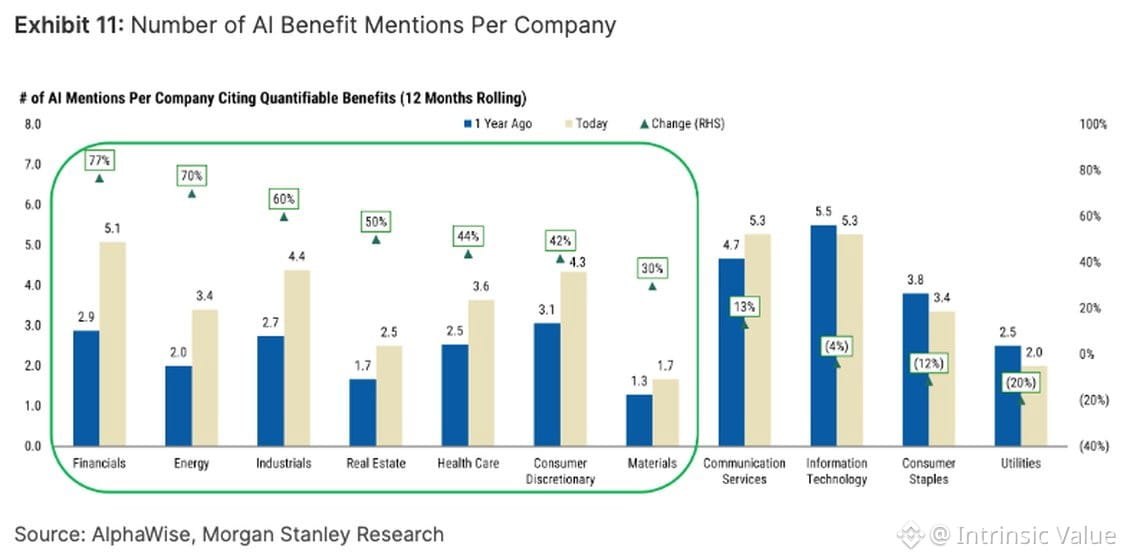
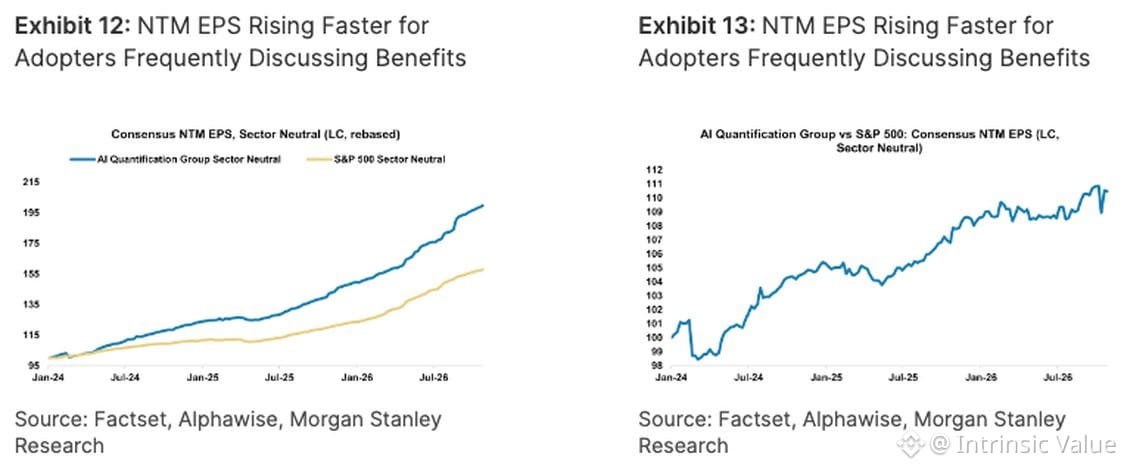
The "nobody's using AI" crowd keeps shrinking. Earnings calls tell a different story—companies in financials, energy, and industrials are now citing actual numbers, not vague promises. More telling: firms reporting measurable AI impact are seeing faster EPS estimate revisions than the $SPX average.
This matters for valuation. If AI drives real margin expansion or revenue acceleration, current multiples might be justified. But if it's just cost shuffling or one-time gains dressed up as transformation, we're back to overpaying for a story.
Watch the incrementals. Are these benefits recurring? Scalable? Or are CFOs just name-dropping AI to justify capex? Numbers first, narrative second.
The "nobody's using AI" crowd keeps shrinking. Earnings calls tell a different story—companies in financials, energy, and industrials are now citing actual numbers, not vague promises. More telling: firms reporting measurable AI impact are seeing faster EPS estimate revisions than the $SPX average.
This matters for valuation. If AI drives real margin expansion or revenue acceleration, current multiples might be justified. But if it's just cost shuffling or one-time gains dressed up as transformation, we're back to overpaying for a story.
Watch the incrementals. Are these benefits recurring? Scalable? Or are CFOs just name-dropping AI to justify capex? Numbers first, narrative second.
This matters for valuation. If AI drives real margin expansion or revenue acceleration, current multiples might be justified. But if it's just cost shuffling or one-time gains dressed up as transformation, we're back to overpaying for a story.
Watch the incrementals. Are these benefits recurring? Scalable? Or are CFOs just name-dropping AI to justify capex? Numbers first, narrative second.
118
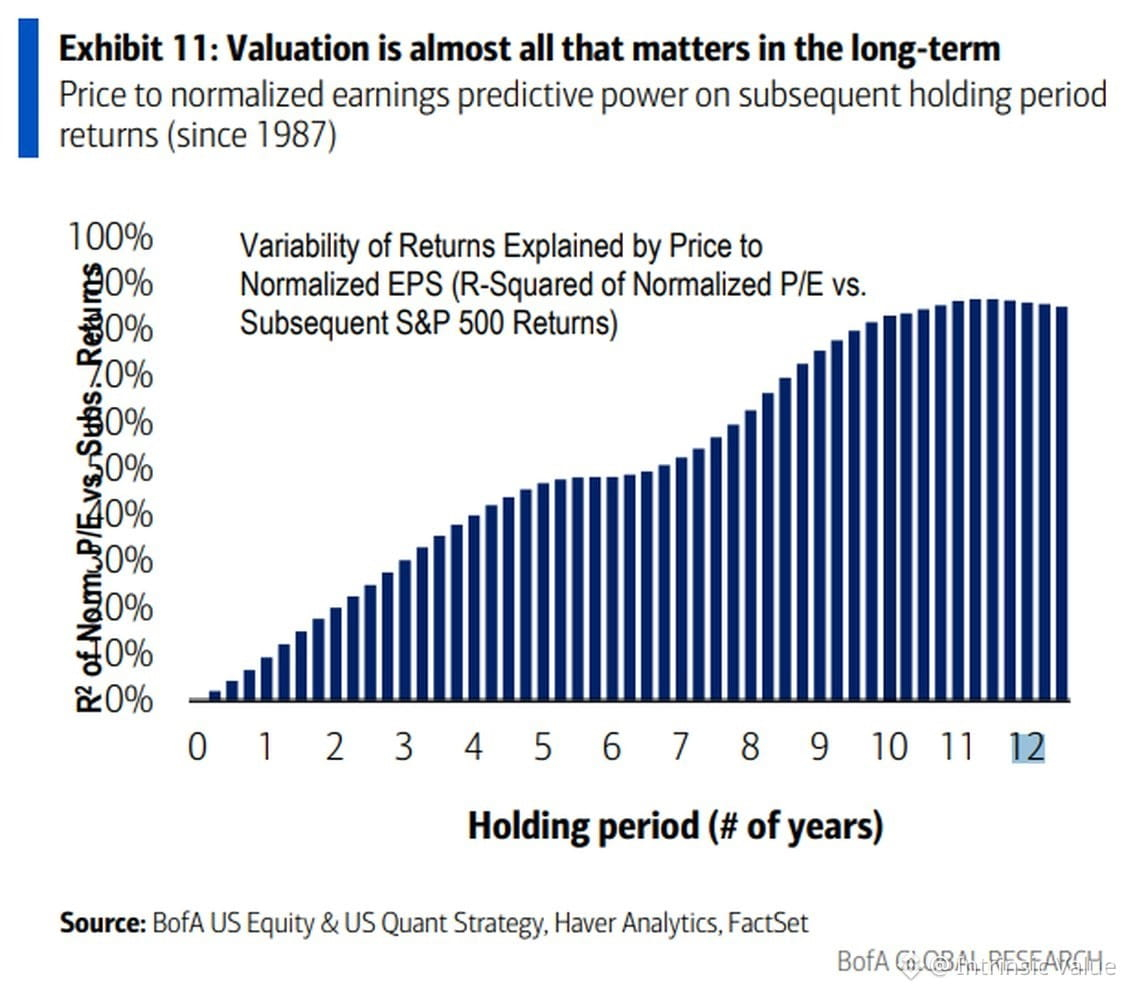
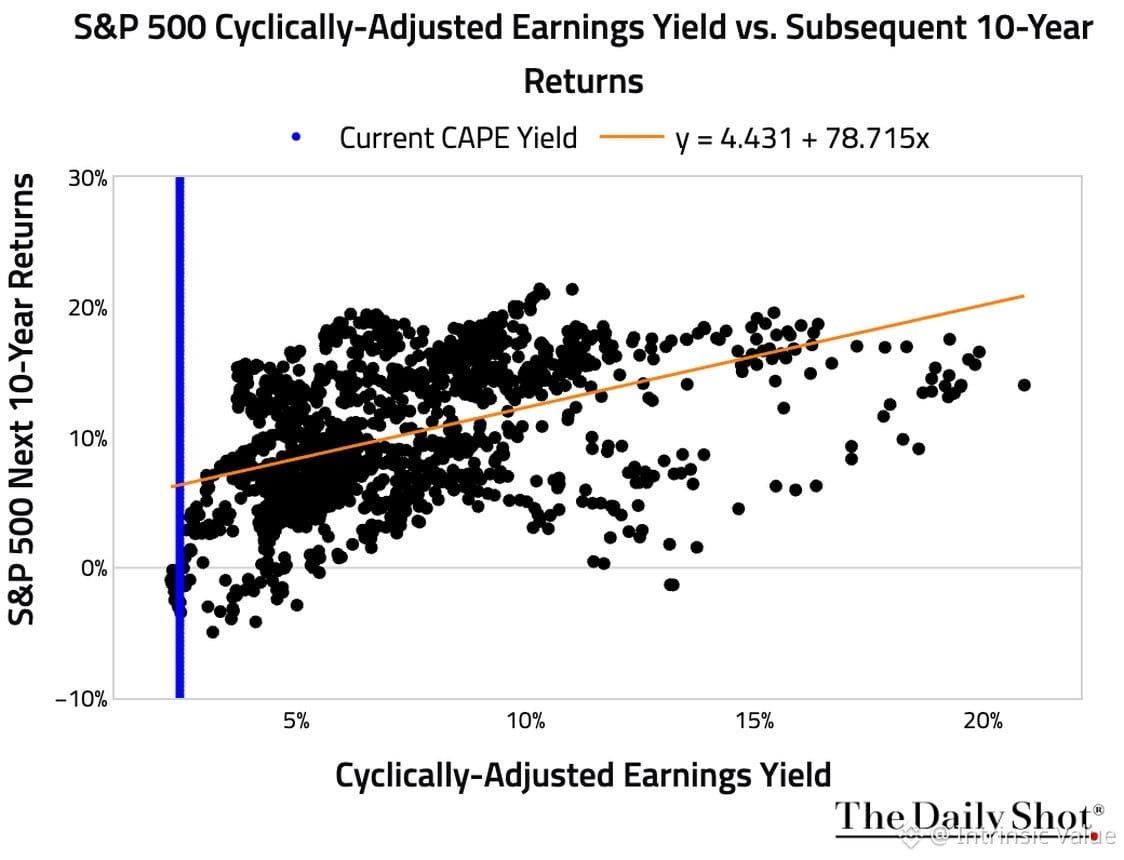
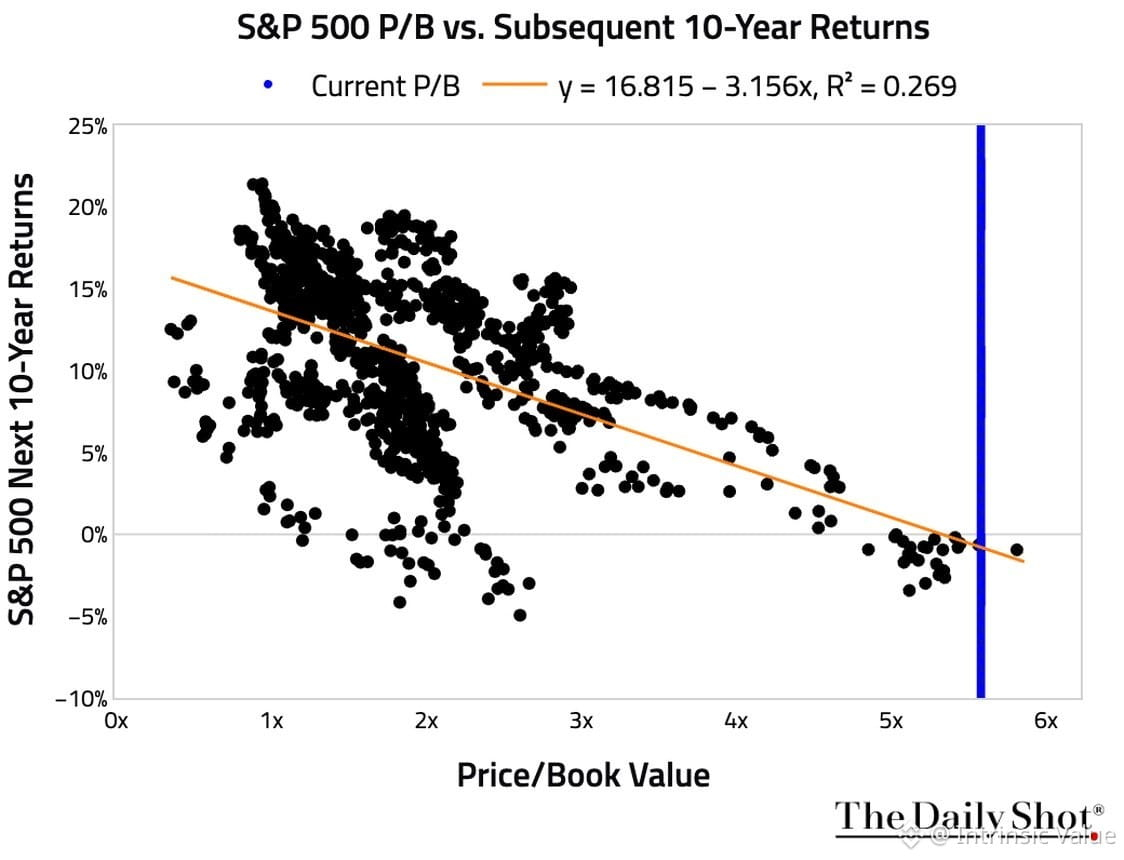
Valuations don't tell you much about next quarter or next year. But over 10-year horizons? They're one of the most reliable signals we have.
Right now, both CAPE earnings yield and price-to-book are flashing the same message: expect muted equity returns through the 2030s.
This isn't doom. It's just math. When you pay more today, you earn less tomorrow. The market doesn't care about your timeline — but your returns will.
Valuations don't tell you much about next quarter or next year. But over 10-year horizons? They're one of the most reliable signals we have.
Right now, both CAPE earnings yield and price-to-book are flashing the same message: expect muted equity returns through the 2030s.
This isn't doom. It's just math. When you pay more today, you earn less tomorrow. The market doesn't care about your timeline — but your returns will.
Right now, both CAPE earnings yield and price-to-book are flashing the same message: expect muted equity returns through the 2030s.
This isn't doom. It's just math. When you pay more today, you earn less tomorrow. The market doesn't care about your timeline — but your returns will.
147
Valuations tell you almost nothing about what happens next week or next month. But over 7-10 years? They're the single best predictor we have.
People forget this constantly. They look at stretched multiples and say "valuations don't matter anymore" because prices keep going up. Then they're shocked when the next decade delivers 3% annualized returns instead of 12%.
Short-term: sentiment, flows, positioning, narratives.
Long-term: what you paid versus what you got.
Math always wins eventually. Just takes longer than anyone expects.
Valuations tell you almost nothing about what happens next week or next month. But over 7-10 years? They're the single best predictor we have.
People forget this constantly. They look at stretched multiples and say "valuations don't matter anymore" because prices keep going up. Then they're shocked when the next decade delivers 3% annualized returns instead of 12%.
Short-term: sentiment, flows, positioning, narratives.
Long-term: what you paid versus what you got.
Math always wins eventually. Just takes longer than anyone expects.
People forget this constantly. They look at stretched multiples and say "valuations don't matter anymore" because prices keep going up. Then they're shocked when the next decade delivers 3% annualized returns instead of 12%.
Short-term: sentiment, flows, positioning, narratives.
Long-term: what you paid versus what you got.
Math always wins eventually. Just takes longer than anyone expects.
233
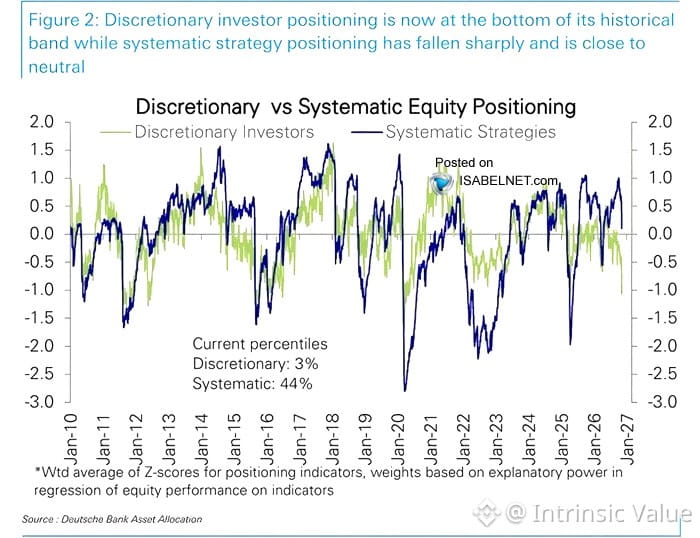
Positioning data tells a story: systematic strategies sitting near neutral (44th percentile), while discretionary managers are extremely light (3rd percentile).
That gap matters. Discretionary folks have massive dry powder if they decide fundamentals warrant adding risk. But it also means conviction is low — they're not buying this tape yet.
Systematic flows are mechanical. Discretionary flows require a narrative shift or valuation comfort. Right now, the humans aren't convinced.
Positioning data tells a story: systematic strategies sitting near neutral (44th percentile), while discretionary managers are extremely light (3rd percentile).
That gap matters. Discretionary folks have massive dry powder if they decide fundamentals warrant adding risk. But it also means conviction is low — they're not buying this tape yet.
Systematic flows are mechanical. Discretionary flows require a narrative shift or valuation comfort. Right now, the humans aren't convinced.
That gap matters. Discretionary folks have massive dry powder if they decide fundamentals warrant adding risk. But it also means conviction is low — they're not buying this tape yet.
Systematic flows are mechanical. Discretionary flows require a narrative shift or valuation comfort. Right now, the humans aren't convinced.
1
1
288
Positioning data tells a story of divergence right now.
Systematic strategies — the rule-based, trend-following crowd — are sitting near neutral at the 44th percentile. They're neither aggressively long nor defensive. Just following the tape.
Discretionary managers? Different world. Positioning at the 3rd percentile. That's about as cautious as it gets. These are the humans making active calls, and they're holding back hard. Plenty of dry powder if they decide to add risk.
What this means: if fundamentals improve or sentiment shifts, discretionary money has room to chase. If things deteriorate, systematic strategies have more to unwind. The gap between machine positioning and human conviction is wide.
Positioning data tells a story of divergence right now.
Systematic strategies — the rule-based, trend-following crowd — are sitting near neutral at the 44th percentile. They're neither aggressively long nor defensive. Just following the tape.
Discretionary managers? Different world. Positioning at the 3rd percentile. That's about as cautious as it gets. These are the humans making active calls, and they're holding back hard. Plenty of dry powder if they decide to add risk.
What this means: if fundamentals improve or sentiment shifts, discretionary money has room to chase. If things deteriorate, systematic strategies have more to unwind. The gap between machine positioning and human conviction is wide.
Systematic strategies — the rule-based, trend-following crowd — are sitting near neutral at the 44th percentile. They're neither aggressively long nor defensive. Just following the tape.
Discretionary managers? Different world. Positioning at the 3rd percentile. That's about as cautious as it gets. These are the humans making active calls, and they're holding back hard. Plenty of dry powder if they decide to add risk.
What this means: if fundamentals improve or sentiment shifts, discretionary money has room to chase. If things deteriorate, systematic strategies have more to unwind. The gap between machine positioning and human conviction is wide.
115
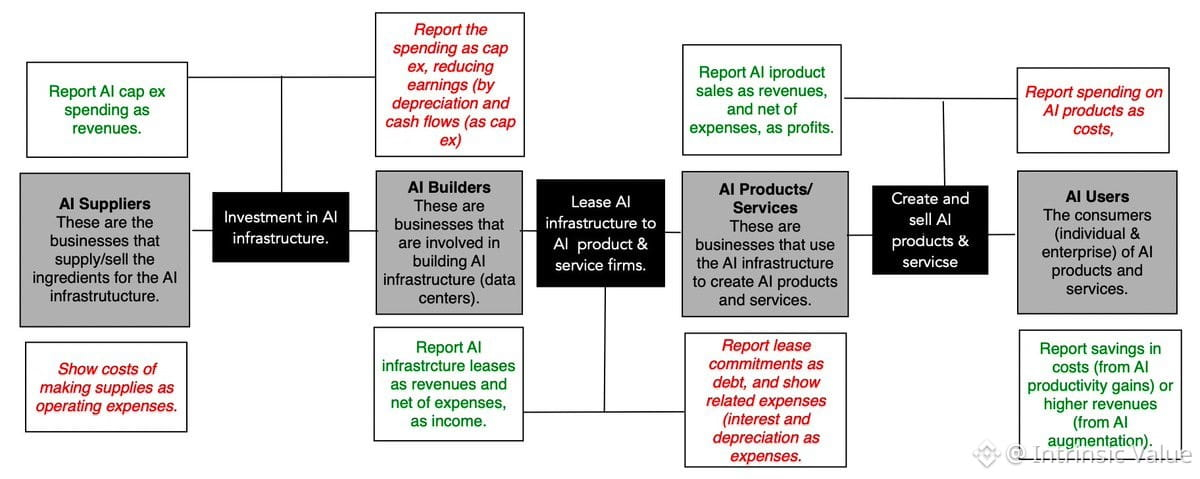
Last week's chaos reignited chatter about the "AI trade" — the idea that AI stocks move in lockstep, driven by identical forces. That's lazy thinking.
As AI matures, the story fragments. There are four distinct groups:
• AI builders (the architects)
• AI suppliers (picks and shovels — chips, infrastructure)
• AI products (software, platforms)
• AI customers (adopters, end users)
Each has different economics, margins, competitive dynamics, and valuation drivers. Lumping them together is like calling all tech stocks "the internet trade" in 2000.
The disruption is aging. The narratives are diverging. If you're still treating AI as one monolithic bet, you're missing the forest for the hype.
Last week's chaos reignited chatter about the "AI trade" — the idea that AI stocks move in lockstep, driven by identical forces. That's lazy thinking.
As AI matures, the story fragments. There are four distinct groups:
• AI builders (the architects)
• AI suppliers (picks and shovels — chips, infrastructure)
• AI products (software, platforms)
• AI customers (adopters, end users)
Each has different economics, margins, competitive dynamics, and valuation drivers. Lumping them together is like calling all tech stocks "the internet trade" in 2000.
The disruption is aging. The narratives are diverging. If you're still treating AI as one monolithic bet, you're missing the forest for the hype.
As AI matures, the story fragments. There are four distinct groups:
• AI builders (the architects)
• AI suppliers (picks and shovels — chips, infrastructure)
• AI products (software, platforms)
• AI customers (adopters, end users)
Each has different economics, margins, competitive dynamics, and valuation drivers. Lumping them together is like calling all tech stocks "the internet trade" in 2000.
The disruption is aging. The narratives are diverging. If you're still treating AI as one monolithic bet, you're missing the forest for the hype.
194
Political control rarely dictates bond yields. After decades analyzing fixed income markets, I can tell you: Congress matters far less than investors think.
Historical data is unambiguous. Under Republican presidents with Democratic Houses, yields rose 9 times and fell 7 times. That's a coin flip, not a signal.
What actually moves Treasury yields? Three things:
1. Real economic growth and wage pressure
2. Inflation composition (demand-driven vs. supply-shock)
3. Business investment cycles
The current setup is interesting. AI infrastructure spending has supported GDP, but regulatory headwinds could slow CapEx materially. Energy prices remain the wild card — oil-driven inflation behaves differently than wage-driven inflation in its impact on purchasing power.
Neither party has shown fiscal restraint. Deficits will continue expanding regardless of who controls the House. That's not cynicism, it's three decades of budget data.
For bond investors: ignore the election theater. Watch corporate earnings, wage growth trends, and whether AI buildout sustains or stalls. Those fundamentals drive yields, not which party holds the gavel.
$TLT $BND
Political control rarely dictates bond yields. After decades analyzing fixed income markets, I can tell you: Congress matters far less than investors think.
Historical data is unambiguous. Under Republican presidents with Democratic Houses, yields rose 9 times and fell 7 times. That's a coin flip, not a signal.
What actually moves Treasury yields? Three things:
1. Real economic growth and wage pressure
2. Inflation composition (demand-driven vs. supply-shock)
3. Business investment cycles
The current setup is interesting. AI infrastructure spending has supported GDP, but regulatory headwinds could slow CapEx materially. Energy prices remain the wild card — oil-driven inflation behaves differently than wage-driven inflation in its impact on purchasing power.
Neither party has shown fiscal restraint. Deficits will continue expanding regardless of who controls the House. That's not cynicism, it's three decades of budget data.
For bond investors: ignore the election theater. Watch corporate earnings, wage growth trends, and whether AI buildout sustains or stalls. Those fundamentals drive yields, not which party holds the gavel.
$TLT $BND
Historical data is unambiguous. Under Republican presidents with Democratic Houses, yields rose 9 times and fell 7 times. That's a coin flip, not a signal.
What actually moves Treasury yields? Three things:
1. Real economic growth and wage pressure
2. Inflation composition (demand-driven vs. supply-shock)
3. Business investment cycles
The current setup is interesting. AI infrastructure spending has supported GDP, but regulatory headwinds could slow CapEx materially. Energy prices remain the wild card — oil-driven inflation behaves differently than wage-driven inflation in its impact on purchasing power.
Neither party has shown fiscal restraint. Deficits will continue expanding regardless of who controls the House. That's not cynicism, it's three decades of budget data.
For bond investors: ignore the election theater. Watch corporate earnings, wage growth trends, and whether AI buildout sustains or stalls. Those fundamentals drive yields, not which party holds the gavel.
$TLT $BND
TLTETF+0.05%
234
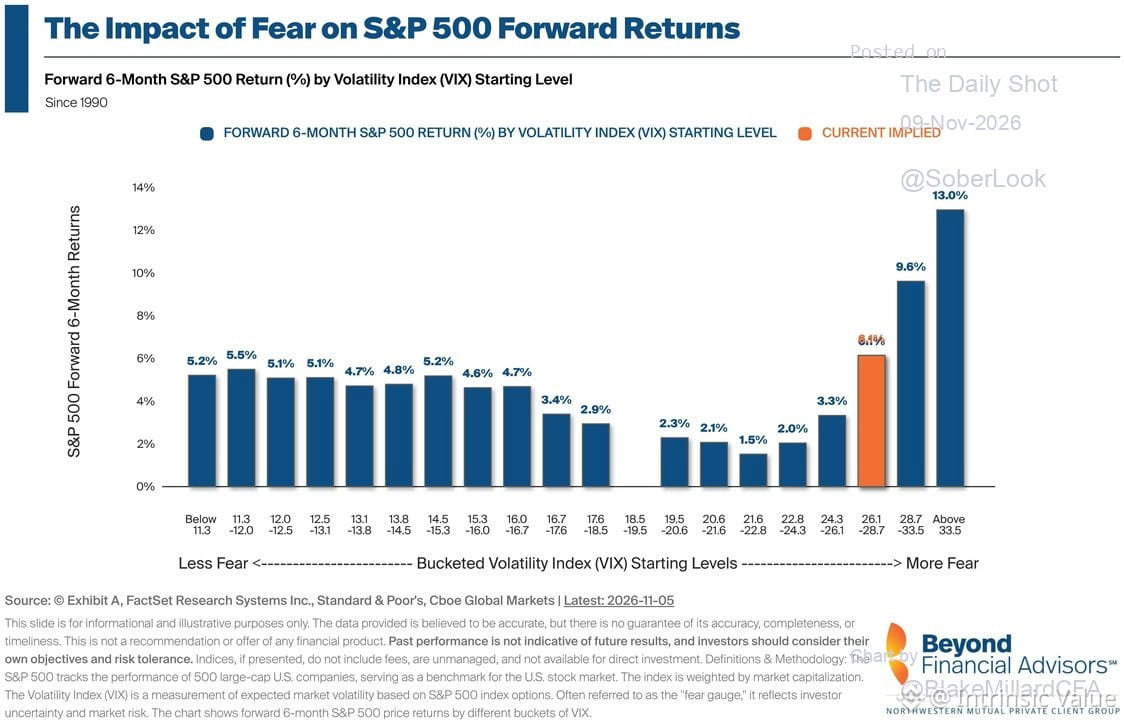
Everyone's panicking over a 5% dip. This happens literally every year—sometimes twice.
What's more interesting: VIX is elevated right now. Historically, when fear spikes like this, the $SPX tends to deliver above-average returns over the next six months.
Markets reward patience when everyone else is losing their heads. The data backs it up.
Everyone's panicking over a 5% dip. This happens literally every year—sometimes twice.
What's more interesting: VIX is elevated right now. Historically, when fear spikes like this, the $SPX tends to deliver above-average returns over the next six months.
Markets reward patience when everyone else is losing their heads. The data backs it up.
What's more interesting: VIX is elevated right now. Historically, when fear spikes like this, the $SPX tends to deliver above-average returns over the next six months.
Markets reward patience when everyone else is losing their heads. The data backs it up.
361
Yesterday's drop was the sharpest since April's tariff panic — the "Liberation Day" selloff.
Here's the pattern: corrections feel endless while you're in them, but they do end. Always have.
Market's getting oversold. Many individual names stretched. That creates opportunity, not panic.
Patience here matters more than prediction. Let price come to you.
Yesterday's drop was the sharpest since April's tariff panic — the "Liberation Day" selloff.
Here's the pattern: corrections feel endless while you're in them, but they do end. Always have.
Market's getting oversold. Many individual names stretched. That creates opportunity, not panic.
Patience here matters more than prediction. Let price come to you.
Here's the pattern: corrections feel endless while you're in them, but they do end. Always have.
Market's getting oversold. Many individual names stretched. That creates opportunity, not panic.
Patience here matters more than prediction. Let price come to you.
1
299
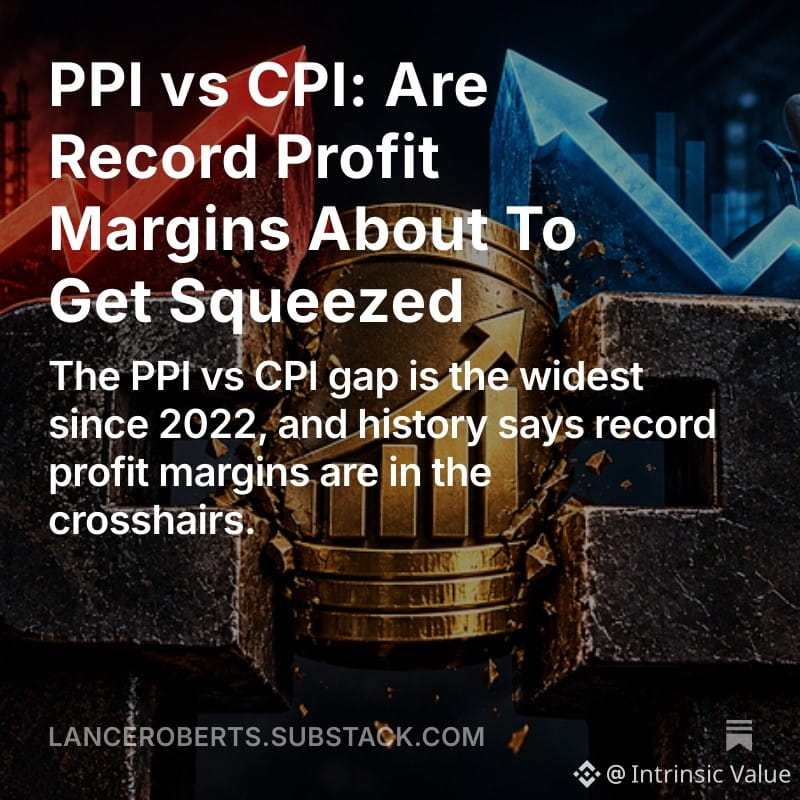
The spread between PPI and CPI tells you something important about corporate pricing power and margin sustainability.
When producer costs (PPI) rise faster than what companies can pass through to consumers (CPI), margins get compressed. We've seen the opposite recently — companies pushed through price increases well beyond their input cost growth, leading to record profit margins across many sectors.
Now the question: is that spread narrowing? If PPI starts outpacing CPI again, or if consumer demand weakens and pricing power fades, those inflated margins become vulnerable. This isn't abstract theory — it shows up in earnings, buyback capacity, and ultimately valuations.
Worth watching closely. Margins mean-revert, and when they do, multiples often follow.
The spread between PPI and CPI tells you something important about corporate pricing power and margin sustainability.
When producer costs (PPI) rise faster than what companies can pass through to consumers (CPI), margins get compressed. We've seen the opposite recently — companies pushed through price increases well beyond their input cost growth, leading to record profit margins across many sectors.
Now the question: is that spread narrowing? If PPI starts outpacing CPI again, or if consumer demand weakens and pricing power fades, those inflated margins become vulnerable. This isn't abstract theory — it shows up in earnings, buyback capacity, and ultimately valuations.
Worth watching closely. Margins mean-revert, and when they do, multiples often follow.
When producer costs (PPI) rise faster than what companies can pass through to consumers (CPI), margins get compressed. We've seen the opposite recently — companies pushed through price increases well beyond their input cost growth, leading to record profit margins across many sectors.
Now the question: is that spread narrowing? If PPI starts outpacing CPI again, or if consumer demand weakens and pricing power fades, those inflated margins become vulnerable. This isn't abstract theory — it shows up in earnings, buyback capacity, and ultimately valuations.
Worth watching closely. Margins mean-revert, and when they do, multiples often follow.
1
282
Markets down, portfolios bleeding.
But here's the thing about proper asset-liability management: when you've built enough T-bill cushion into your structure, drawdowns stop being existential events. They just become noise.
The whole point of ALM is matching your cash needs with safe assets so equity volatility doesn't force your hand. You can sit through -20%, -30%, whatever, because you're not selling into weakness to meet obligations.
Most people skip this step. They're 100% equities with bills due in 6 months, then panic-sell at the bottom.
Side note: using portfolio losses as a workout trigger is unhinged but I respect the discipline. Down 1%+ = leg day. Pain is pain.
Markets down, portfolios bleeding.
But here's the thing about proper asset-liability management: when you've built enough T-bill cushion into your structure, drawdowns stop being existential events. They just become noise.
The whole point of ALM is matching your cash needs with safe assets so equity volatility doesn't force your hand. You can sit through -20%, -30%, whatever, because you're not selling into weakness to meet obligations.
Most people skip this step. They're 100% equities with bills due in 6 months, then panic-sell at the bottom.
Side note: using portfolio losses as a workout trigger is unhinged but I respect the discipline. Down 1%+ = leg day. Pain is pain.
But here's the thing about proper asset-liability management: when you've built enough T-bill cushion into your structure, drawdowns stop being existential events. They just become noise.
The whole point of ALM is matching your cash needs with safe assets so equity volatility doesn't force your hand. You can sit through -20%, -30%, whatever, because you're not selling into weakness to meet obligations.
Most people skip this step. They're 100% equities with bills due in 6 months, then panic-sell at the bottom.
Side note: using portfolio losses as a workout trigger is unhinged but I respect the discipline. Down 1%+ = leg day. Pain is pain.
151
Corporate buyback windows are reopening after Q3 earnings blackouts. Only 25% of $SPX weight could repurchase shares in mid-October. That jumped to ~67% by Election Day and will hit 85% by Nov 9.
Context matters: companies have authorized $1.5T in new buyback programs through early November — already surpassing the full-year 2025 record.
Buybacks are price-insensitive demand. They smooth volatility, support multiples, and flatter EPS growth regardless of underlying business performance. In richly valued markets, they also represent capital allocation at peak prices.
Watch how aggressively CFOs deploy this record authorization. If they're buying hand over fist into 22x forward earnings, that's confidence. If they slow-walk it, that's caution. Either way, the technical bid is back.
Corporate buyback windows are reopening after Q3 earnings blackouts. Only 25% of $SPX weight could repurchase shares in mid-October. That jumped to ~67% by Election Day and will hit 85% by Nov 9.
Context matters: companies have authorized $1.5T in new buyback programs through early November — already surpassing the full-year 2025 record.
Buybacks are price-insensitive demand. They smooth volatility, support multiples, and flatter EPS growth regardless of underlying business performance. In richly valued markets, they also represent capital allocation at peak prices.
Watch how aggressively CFOs deploy this record authorization. If they're buying hand over fist into 22x forward earnings, that's confidence. If they slow-walk it, that's caution. Either way, the technical bid is back.
Context matters: companies have authorized $1.5T in new buyback programs through early November — already surpassing the full-year 2025 record.
Buybacks are price-insensitive demand. They smooth volatility, support multiples, and flatter EPS growth regardless of underlying business performance. In richly valued markets, they also represent capital allocation at peak prices.
Watch how aggressively CFOs deploy this record authorization. If they're buying hand over fist into 22x forward earnings, that's confidence. If they slow-walk it, that's caution. Either way, the technical bid is back.
106
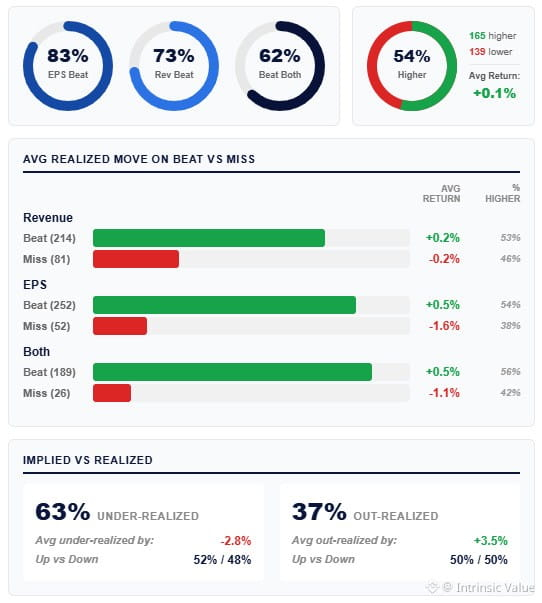
Q3 earnings season: 83% of S&P 500 companies (65% of index weight reported) have beaten EPS estimates vs. 75% historical average. Consensus expected 27% YoY growth — one of the highest bars in a decade — and companies are clearing it.
This is top-decile beat rate since 2005. Strong operationally, no question.
But here's what matters for valuation: the S&P 500 forward P/E is ~21x, well above the 10-year median of ~18x. If earnings are growing 27% YoY, you'd expect multiple compression as growth normalizes. Instead, multiples have held or expanded.
Market is pricing perfection. Beat rates are backward-looking. Guidance, margin sustainability, and whether this growth can continue without fiscal stimulus or a weaker dollar — that's forward-looking.
Earnings beats don't justify price if the multiple already assumes flawless execution for years. Watch what companies say about 2025, not just Q3 surprises.
Q3 earnings season: 83% of S&P 500 companies (65% of index weight reported) have beaten EPS estimates vs. 75% historical average. Consensus expected 27% YoY growth — one of the highest bars in a decade — and companies are clearing it.
This is top-decile beat rate since 2005. Strong operationally, no question.
But here's what matters for valuation: the S&P 500 forward P/E is ~21x, well above the 10-year median of ~18x. If earnings are growing 27% YoY, you'd expect multiple compression as growth normalizes. Instead, multiples have held or expanded.
Market is pricing perfection. Beat rates are backward-looking. Guidance, margin sustainability, and whether this growth can continue without fiscal stimulus or a weaker dollar — that's forward-looking.
Earnings beats don't justify price if the multiple already assumes flawless execution for years. Watch what companies say about 2025, not just Q3 surprises.
This is top-decile beat rate since 2005. Strong operationally, no question.
But here's what matters for valuation: the S&P 500 forward P/E is ~21x, well above the 10-year median of ~18x. If earnings are growing 27% YoY, you'd expect multiple compression as growth normalizes. Instead, multiples have held or expanded.
Market is pricing perfection. Beat rates are backward-looking. Guidance, margin sustainability, and whether this growth can continue without fiscal stimulus or a weaker dollar — that's forward-looking.
Earnings beats don't justify price if the multiple already assumes flawless execution for years. Watch what companies say about 2025, not just Q3 surprises.
1
278
ISM services index just printed with every component above 50. Manufacturing did the same Monday. Services = ~80% of GDP.
Implication: recession risk materially lower than consensus feared 3-6 months ago.
But let's be clear — expansion doesn't mean acceleration. We're bouncing off a soft patch, not entering a boom. Corporate margins still compressed, rate-sensitive sectors still sluggish. The bar for multiple expansion from here is high.
Markets already priced in the soft landing. Now we need earnings growth to justify current valuations. Watch guidance, not headlines.
ISM services index just printed with every component above 50. Manufacturing did the same Monday. Services = ~80% of GDP.
Implication: recession risk materially lower than consensus feared 3-6 months ago.
But let's be clear — expansion doesn't mean acceleration. We're bouncing off a soft patch, not entering a boom. Corporate margins still compressed, rate-sensitive sectors still sluggish. The bar for multiple expansion from here is high.
Markets already priced in the soft landing. Now we need earnings growth to justify current valuations. Watch guidance, not headlines.
Implication: recession risk materially lower than consensus feared 3-6 months ago.
But let's be clear — expansion doesn't mean acceleration. We're bouncing off a soft patch, not entering a boom. Corporate margins still compressed, rate-sensitive sectors still sluggish. The bar for multiple expansion from here is high.
Markets already priced in the soft landing. Now we need earnings growth to justify current valuations. Watch guidance, not headlines.
145
Got interesting pushback on my Anthropic IPO valuation — exactly what I hoped for. Used it to identify the most fragile assumptions in my model and walk through what could break.
Valuation is storytelling with numbers. The story matters, but so do the weak points. When you lay out your assumptions openly, the criticism tells you where your logic is thinnest.
Most valuable exercise: not defending your number, but understanding where it falls apart.
Got interesting pushback on my Anthropic IPO valuation — exactly what I hoped for. Used it to identify the most fragile assumptions in my model and walk through what could break.
Valuation is storytelling with numbers. The story matters, but so do the weak points. When you lay out your assumptions openly, the criticism tells you where your logic is thinnest.
Most valuable exercise: not defending your number, but understanding where it falls apart.
Valuation is storytelling with numbers. The story matters, but so do the weak points. When you lay out your assumptions openly, the criticism tells you where your logic is thinnest.
Most valuable exercise: not defending your number, but understanding where it falls apart.
168
Log in to explore more content
Join global crypto users on Binance Square
⚡️ Get latest and useful information about crypto.
💬 Trusted by the world’s largest crypto exchange.
👍 Discover real insights from verified creators.
Email / Phone number
Trending Topics
HotCPIDecemberHikePriced
315,498 views
3,188 Discussing
CPI Market Watch | US CPI Rises 0.4% in October, Hotter Than 0.3% Forecast
Binance News
·34 Likes
·48.6k views
ZcashFallsBelow$1000ForFirstTimeSinceSeptember
7,886 views
54 Discussing
StrategyFaces$2.8BSelloffRiskFromMSCIRemoval
19,447 views
136 Discussing