

IamKo
5.5k Posts

IamKo
Report
Block User
• TRUE MARKET LOGIC •
Frequent Trader
4.6 Years
67 Following
390 Followers
2.1K+ Liked
Posts
All
Quotes
Videos
·
--
210
·
--
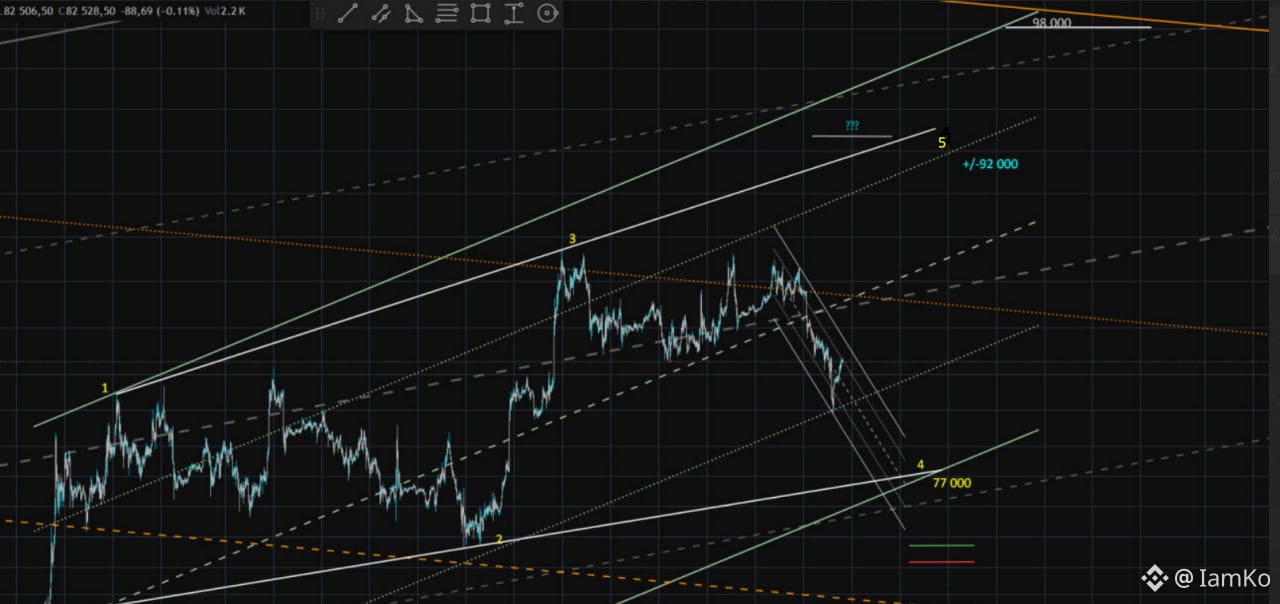
Below, wave 4 could intersect with wave 1… They’ll ruin all the fun.
Below, wave 4 could intersect with wave 1… They’ll ruin all the fun.
116
·
--
🇺🇸#фрс #сша #трамп
Trump said that Jerome Powell should be forced to resign IMMEDIATELY! If he does not resign, the US government should bring legal action against him at the highest level, accusing him either of corruption or of incompetence—for destroying the splendor of the Federal Reserve building.
🇺🇸#фрс #сша #трамп
Trump said that Jerome Powell should be forced to resign IMMEDIATELY! If he does not resign, the US government should bring legal action against him at the highest level, accusing him either of corruption or of incompetence—for destroying the splendor of the Federal Reserve building.
Trump said that Jerome Powell should be forced to resign IMMEDIATELY! If he does not resign, the US government should bring legal action against him at the highest level, accusing him either of corruption or of incompetence—for destroying the splendor of the Federal Reserve building.
216
·
--
Article
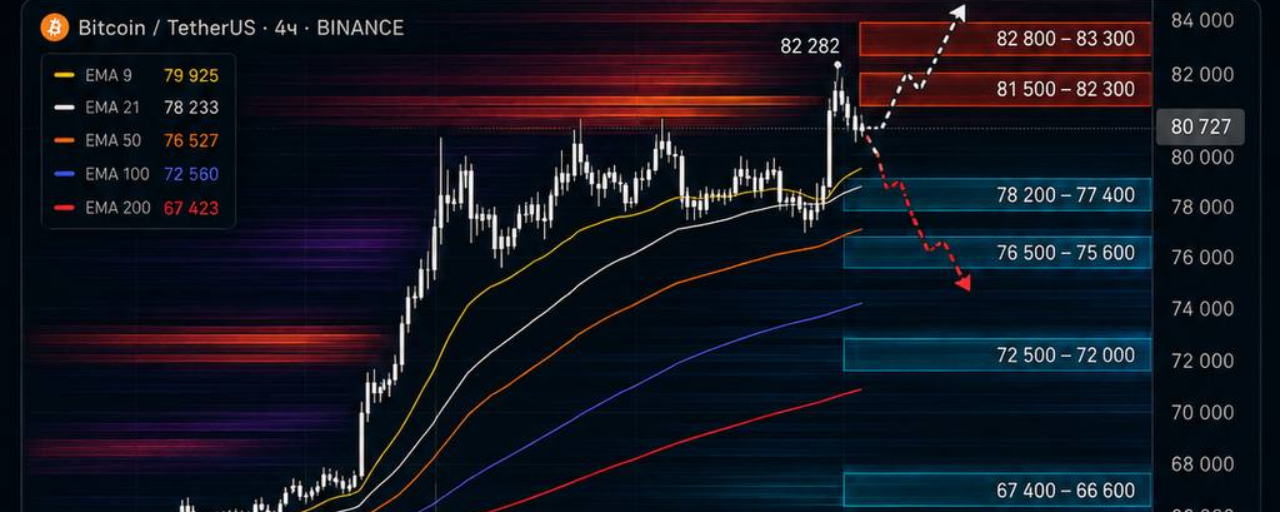
THE MARKET IS AT A CRITICAL POINTBitcoin after a strong impulse reached $82 282, took out the top liquidity, and returned to the $80 700 area.
On the 4H timeframe, the structure is still bullish for now. The price is still holding above the main moving averages, so it’s too early to talk about a full reversal down. But a seller’s reaction has already appeared on top, and now the market needs to show whether it can hold above, or whether it will start a deeper correction.
THE MARKET IS AT A CRITICAL POINT
Bitcoin after a strong impulse reached $82 282, took out the top liquidity, and returned to the $80 700 area.
On the 4H timeframe, the structure is still bullish for now. The price is still holding above the main moving averages, so it’s too early to talk about a full reversal down. But a seller’s reaction has already appeared on top, and now the market needs to show whether it can hold above, or whether it will start a deeper correction.
On the 4H timeframe, the structure is still bullish for now. The price is still holding above the main moving averages, so it’s too early to talk about a full reversal down. But a seller’s reaction has already appeared on top, and now the market needs to show whether it can hold above, or whether it will start a deeper correction.
133
·
--

Article
WHAT TO EXPECT TODAY?On
a neighborhood worth $77,000-$78,000 is now interesting.
At night the price was already pushed down to $76,952 and quickly brought back above. If the buyer continues to hold this zone, a return to $78,800-$79,400 is possible.
A consolidation above $79,400 will open the way again to $80,000-$81,400.
If
loses $76,900, the next downside zones will be:
$75,500-$76,000;
WHAT TO EXPECT TODAY?
On
a neighborhood worth $77,000-$78,000 is now interesting.
At night the price was already pushed down to $76,952 and quickly brought back above. If the buyer continues to hold this zone, a return to $78,800-$79,400 is possible.
A consolidation above $79,400 will open the way again to $80,000-$81,400.
If
loses $76,900, the next downside zones will be:
$75,500-$76,000;
a neighborhood worth $77,000-$78,000 is now interesting.
At night the price was already pushed down to $76,952 and quickly brought back above. If the buyer continues to hold this zone, a return to $78,800-$79,400 is possible.
A consolidation above $79,400 will open the way again to $80,000-$81,400.
If
loses $76,900, the next downside zones will be:
$75,500-$76,000;
142
·
--

Article
WHY DID A CORRECTION HIT DURING THE NIGHT?There is no single magical reason here. Just several factors coincided at the same time.
First. After a strong rally, $BTC reached $81,400, but couldn't hold above it. In the $80,000–81,500 area, there was substantial liquidity; after it was removed, profit-taking began.
Second. On Friday, the head of the Fed, Kevin Warsh, again emphasized high inflation and readiness to tighten policy. The probability of a rate hike as early as September rose to about 57%, and the yield on two-year Treasuries climbed to 4.34%.
WHY DID A CORRECTION HIT DURING THE NIGHT?
There is no single magical reason here. Just several factors coincided at the same time.
First. After a strong rally, $BTC reached $81,400, but couldn't hold above it. In the $80,000–81,500 area, there was substantial liquidity; after it was removed, profit-taking began.
Second. On Friday, the head of the Fed, Kevin Warsh, again emphasized high inflation and readiness to tighten policy. The probability of a rate hike as early as September rose to about 57%, and the yield on two-year Treasuries climbed to 4.34%.
First. After a strong rally, $BTC reached $81,400, but couldn't hold above it. In the $80,000–81,500 area, there was substantial liquidity; after it was removed, profit-taking began.
Second. On Friday, the head of the Fed, Kevin Warsh, again emphasized high inflation and readiness to tighten policy. The probability of a rate hike as early as September rose to about 57%, and the yield on two-year Treasuries climbed to 4.34%.
118
·
--

Article
MARKETS IN THE MORNING OF AUGUST 31Good morning.
The weekend ended in a fairly predictable way: first, the market tried to continue higher, then it gathered liquidity from above, and overnight it adjusted normally.
$BTC - $77 903, over the day -0.34%;
$ETH - $2 437.66, over the day -0.76%;
$SOL - $102.48, over the day -2.34%.
Overnight, $BTC fell to $76 952, $ETH to $2 386, and $SOL tested $100.30. A reaction from the lows has appeared, but a full return of the buyer is still not there.
MARKETS IN THE MORNING OF AUGUST 31
Good morning.
The weekend ended in a fairly predictable way: first, the market tried to continue higher, then it gathered liquidity from above, and overnight it adjusted normally.
$BTC - $77 903, over the day -0.34%;
$ETH - $2 437.66, over the day -0.76%;
$SOL - $102.48, over the day -2.34%.
Overnight, $BTC fell to $76 952, $ETH to $2 386, and $SOL tested $100.30. A reaction from the lows has appeared, but a full return of the buyer is still not there.
The weekend ended in a fairly predictable way: first, the market tried to continue higher, then it gathered liquidity from above, and overnight it adjusted normally.
$BTC - $77 903, over the day -0.34%;
$ETH - $2 437.66, over the day -0.76%;
$SOL - $102.48, over the day -2.34%.
Overnight, $BTC fell to $76 952, $ETH to $2 386, and $SOL tested $100.30. A reaction from the lows has appeared, but a full return of the buyer is still not there.
146
·
--

Article
SQUEEZING FUEL RUNS OUT?$BTC
The latest Bitcoin rally is looking more and more like a move that was strongly fueled by short liquidations.
When the market is rising on genuine aggressive demand, you usually can clearly see an advantage of market buys. There wasn’t such a steady edge here.
17–18 August the share of purchases was about 51–54%.
SQUEEZING FUEL RUNS OUT?
$BTC
The latest Bitcoin rally is looking more and more like a move that was strongly fueled by short liquidations.
When the market is rising on genuine aggressive demand, you usually can clearly see an advantage of market buys. There wasn’t such a steady edge here.
17–18 August the share of purchases was about 51–54%.
The latest Bitcoin rally is looking more and more like a move that was strongly fueled by short liquidations.
When the market is rising on genuine aggressive demand, you usually can clearly see an advantage of market buys. There wasn’t such a steady edge here.
17–18 August the share of purchases was about 51–54%.
123
·
--

Article
RETAIL IS BACK IN THE GAMEDemand from retail investors for $BTC has increased noticeably.
The 30-day change in demand among small market participants has risen to about +16%. This is the highest level since December 2024.
And there’s an interesting point here.
Historically, such retail activity surges have quite often appeared already after a strong $BTC move and near local maxima.
RETAIL IS BACK IN THE GAME
Demand from retail investors for $BTC has increased noticeably.
The 30-day change in demand among small market participants has risen to about +16%. This is the highest level since December 2024.
And there’s an interesting point here.
Historically, such retail activity surges have quite often appeared already after a strong $BTC move and near local maxima.
The 30-day change in demand among small market participants has risen to about +16%. This is the highest level since December 2024.
And there’s an interesting point here.
Historically, such retail activity surges have quite often appeared already after a strong $BTC move and near local maxima.
59
·
--

Article
WHAT TO EXPECT TODAY?14:30 GMT+3 - the ECB’s last meeting protocol.
15:30 GMT+3 - initial jobless claims in the United States.
Forecast: 208 thousand.
Previous value: 206 thousand.
If applications come in above the forecast, it will indicate some easing in the labor market. Bond yields and the dollar may decline, which typically supports gold, cryptocurrencies, and the technology sector.
WHAT TO EXPECT TODAY?
14:30 GMT+3 - the ECB’s last meeting protocol.
15:30 GMT+3 - initial jobless claims in the United States.
Forecast: 208 thousand.
Previous value: 206 thousand.
If applications come in above the forecast, it will indicate some easing in the labor market. Bond yields and the dollar may decline, which typically supports gold, cryptocurrencies, and the technology sector.
15:30 GMT+3 - initial jobless claims in the United States.
Forecast: 208 thousand.
Previous value: 206 thousand.
If applications come in above the forecast, it will indicate some easing in the labor market. Bond yields and the dollar may decline, which typically supports gold, cryptocurrencies, and the technology sector.
48
·
--

Article
WHAT’S HAPPENING IN THE CRYPTO MARKET RIGHT NOW?Overnight, $BTC dropped to $77,602, then returned above $78,500. The buyer appeared in the right area, but there is still no confirmation of further upside.
Key levels for today:
• Holding $78,300 maintains the probability of a move toward $79,200–80,000;
• A close above $80,000 will open the way to the $82,000–85,000 area;
WHAT’S HAPPENING IN THE CRYPTO MARKET RIGHT NOW?
Overnight, $BTC dropped to $77,602, then returned above $78,500. The buyer appeared in the right area, but there is still no confirmation of further upside.
Key levels for today:
• Holding $78,300 maintains the probability of a move toward $79,200–80,000;
• A close above $80,000 will open the way to the $82,000–85,000 area;
Key levels for today:
• Holding $78,300 maintains the probability of a move toward $79,200–80,000;
• A close above $80,000 will open the way to the $82,000–85,000 area;
99
·
--

Article
MARKETS IN THE MORNING 27.08.2026Cryptocurrencies:
• $BTC — $78 756, per day −0,40%;
• $ETH — $2 491,62, per day +1,11%;
• $SOL — $101,62, per day +4,63%.
Stock market indices:
• Nasdaq 100 — 29 395,51, per day +0,73%;
• S&P 500 — 7 695,7, per day +0,34%.
Commodities and the dollar:
• gold — $4 610,19, per day −0,68%;
• Brent — $86,35, per day +0,49%;
• WTI — $81,63, per day +0,95%;
• U.S. Dollar Index — 98,88, per day +0,20%.
MARKETS IN THE MORNING 27.08.2026
Cryptocurrencies:
• $BTC — $78 756, per day −0,40%;
• $ETH — $2 491,62, per day +1,11%;
• $SOL — $101,62, per day +4,63%.
Stock market indices:
• Nasdaq 100 — 29 395,51, per day +0,73%;
• S&P 500 — 7 695,7, per day +0,34%.
Commodities and the dollar:
• gold — $4 610,19, per day −0,68%;
• Brent — $86,35, per day +0,49%;
• WTI — $81,63, per day +0,95%;
• U.S. Dollar Index — 98,88, per day +0,20%.
• $BTC — $78 756, per day −0,40%;
• $ETH — $2 491,62, per day +1,11%;
• $SOL — $101,62, per day +4,63%.
Stock market indices:
• Nasdaq 100 — 29 395,51, per day +0,73%;
• S&P 500 — 7 695,7, per day +0,34%.
Commodities and the dollar:
• gold — $4 610,19, per day −0,68%;
• Brent — $86,35, per day +0,49%;
• WTI — $81,63, per day +0,95%;
• U.S. Dollar Index — 98,88, per day +0,20%.
100
·
--

Article
WHAT HAPPENED OVERNIGHT?The US market finished the regular session with virtually no movement. PCE inflation proved persistent: the figure rose by 0.2% in July, so expectations for a quick easing of the Fed’s policy weakened slightly again.
After the market close, NVIDIA reported. The results and forecast came in above expectations; the company’s shares gained about 4.7% in after-hours trading, and US index futures moved higher.
WHAT HAPPENED OVERNIGHT?
The US market finished the regular session with virtually no movement. PCE inflation proved persistent: the figure rose by 0.2% in July, so expectations for a quick easing of the Fed’s policy weakened slightly again.
After the market close, NVIDIA reported. The results and forecast came in above expectations; the company’s shares gained about 4.7% in after-hours trading, and US index futures moved higher.
After the market close, NVIDIA reported. The results and forecast came in above expectations; the company’s shares gained about 4.7% in after-hours trading, and US index futures moved higher.
145
·
--
Bearish
Everywhere I see the same messages: “longs, the bear trend is over, we’re waiting for $90,000+.” Where did you even get this, you failed traders?))) I’m not even talking about the chart.
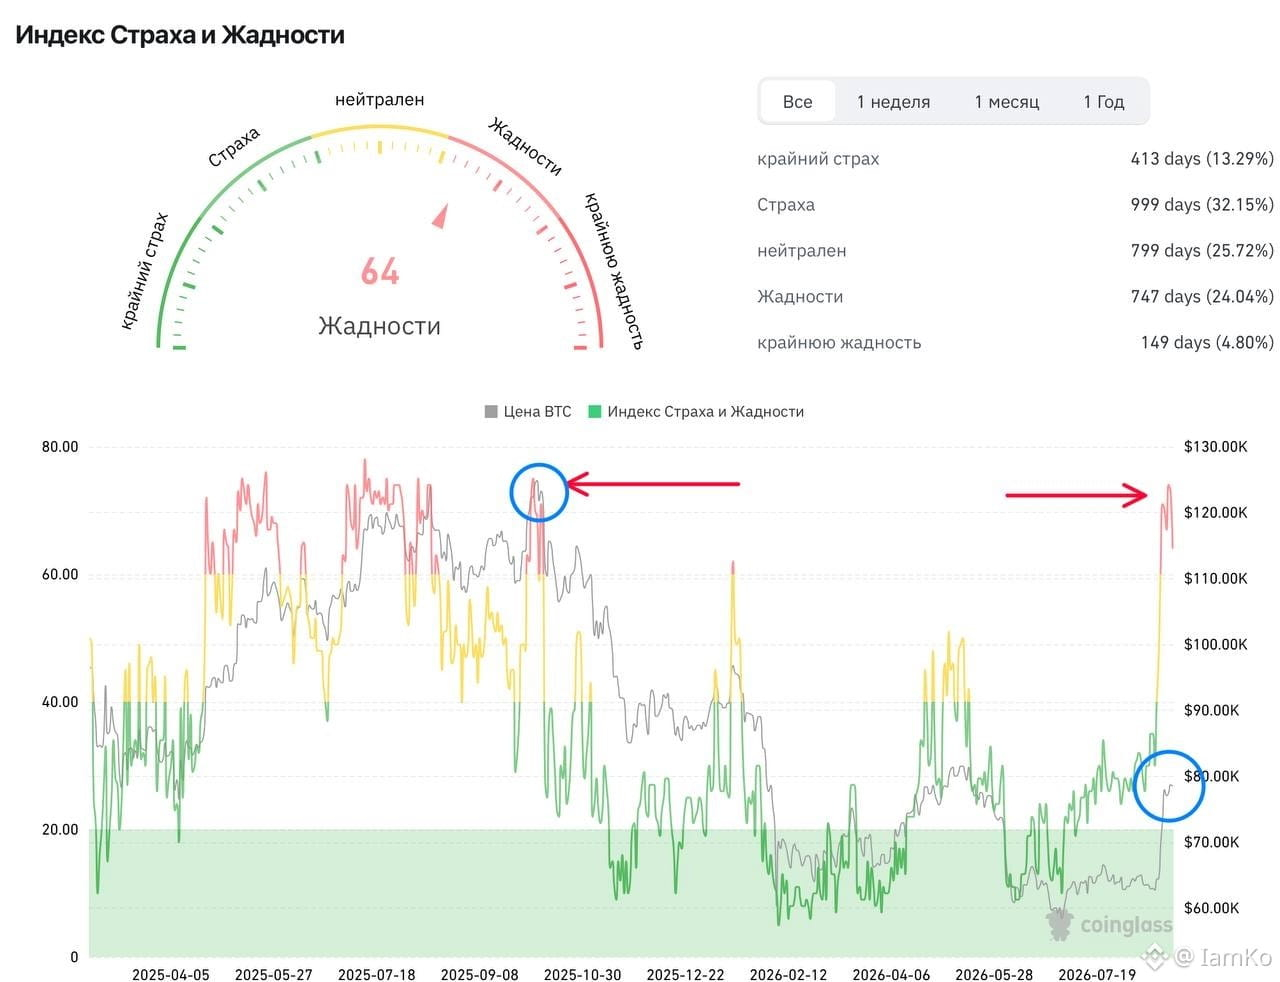
I went to check the main indicators, and the first thing that caught my eye was the Fear & Greed Index. Obviously, the indicator is very conditional, but it can be used when analyzing mass sentiment.
So: in 3–4 days, the index jumped from fear to strong greed, and pay attention to exactly where.
For several days, the index was at the same level as it was when the BTC price was $126 thousand. From the very bottom... And then right to this level... Well, and what happened to Bitcoin when it hit $126 thousand is obvious to everyone.
The hamsters want growth, they want capital to multiply on the spot market, they want it all here and now—so they open longs at the peaks.
So, what do you say?)) Will the market feed all these hamsters?))) I have doubts 😁
Everywhere I see the same messages: “longs, the bear trend is over, we’re waiting for $90,000+.” Where did you even get this, you failed traders?))) I’m not even talking about the chart.
I went to check the main indicators, and the first thing that caught my eye was the Fear & Greed Index. Obviously, the indicator is very conditional, but it can be used when analyzing mass sentiment.
So: in 3–4 days, the index jumped from fear to strong greed, and pay attention to exactly where.
For several days, the index was at the same level as it was when the BTC price was $126 thousand. From the very bottom... And then right to this level... Well, and what happened to Bitcoin when it hit $126 thousand is obvious to everyone.
The hamsters want growth, they want capital to multiply on the spot market, they want it all here and now—so they open longs at the peaks.
So, what do you say?)) Will the market feed all these hamsters?))) I have doubts 😁
I went to check the main indicators, and the first thing that caught my eye was the Fear & Greed Index. Obviously, the indicator is very conditional, but it can be used when analyzing mass sentiment.
So: in 3–4 days, the index jumped from fear to strong greed, and pay attention to exactly where.
For several days, the index was at the same level as it was when the BTC price was $126 thousand. From the very bottom... And then right to this level... Well, and what happened to Bitcoin when it hit $126 thousand is obvious to everyone.
The hamsters want growth, they want capital to multiply on the spot market, they want it all here and now—so they open longs at the peaks.
So, what do you say?)) Will the market feed all these hamsters?))) I have doubts 😁
8
5
6.7k
·
--

Article
WATCHLIST 24.08.2026Today, three areas are especially interesting at once: crypto after a strong weeklong rally, US stocks ahead of major reports, and commodities amid Iran, a weak dollar, and a shortage of supply.
CRYPTOCURRENCIES
$BTC
The main benchmark for the whole market. The price is around $77,000 within the $75,500–78,000 range.
WATCHLIST 24.08.2026
Today, three areas are especially interesting at once: crypto after a strong weeklong rally, US stocks ahead of major reports, and commodities amid Iran, a weak dollar, and a shortage of supply.
CRYPTOCURRENCIES
$BTC
The main benchmark for the whole market. The price is around $77,000 within the $75,500–78,000 range.
CRYPTOCURRENCIES
$BTC
The main benchmark for the whole market. The price is around $77,000 within the $75,500–78,000 range.
97
·
--

Article
MARKET OVERVIEW IN THE MORNING OF 24.08.2026Markets begin the new week cautiously. After a strong move in crypto and a not-so-easy Friday on the stock market, participants are in no rush to take on new positions ahead of the week’s main events.
CRYPTO MARKET
$BTC is trading at around $77,100. Over the weekend, the price held within the range of $75,850–78,000 and did not give back most of last week’s gains.
MARKET OVERVIEW IN THE MORNING OF 24.08.2026
Markets begin the new week cautiously. After a strong move in crypto and a not-so-easy Friday on the stock market, participants are in no rush to take on new positions ahead of the week’s main events.
CRYPTO MARKET
$BTC is trading at around $77,100. Over the weekend, the price held within the range of $75,850–78,000 and did not give back most of last week’s gains.
CRYPTO MARKET
$BTC is trading at around $77,100. Over the weekend, the price held within the range of $75,850–78,000 and did not give back most of last week’s gains.
119
·
--

Article
$BTC FINISHES ITS STRONGEST WEEK SINCE MARCH 2024In just a few days, Bitcoin moved from roughly $63,000 to $79,000 and added about 22% over the week.
At its peak, $BTC rose above $79,000 for the first time since May. After that, the market already received its first normal cooldown: the price was pushed down to $75,000, where a buyer showed up.
The increase wasn’t accidental. Several factors lined up at once:
$BTC FINISHES ITS STRONGEST WEEK SINCE MARCH 2024
In just a few days, Bitcoin moved from roughly $63,000 to $79,000 and added about 22% over the week.
At its peak, $BTC rose above $79,000 for the first time since May. After that, the market already received its first normal cooldown: the price was pushed down to $75,000, where a buyer showed up.
The increase wasn’t accidental. Several factors lined up at once:
At its peak, $BTC rose above $79,000 for the first time since May. After that, the market already received its first normal cooldown: the price was pushed down to $75,000, where a buyer showed up.
The increase wasn’t accidental. Several factors lined up at once:
123
·
--
Bullish
✴️#BTC #прогноз #крипто
A new consensus is starting to take shape in the crypto market:
In a bid not to let the market collapse and to rein in the sharp rise in yields ahead of the November midterm elections, the US Treasury will, out of sheer necessity, increase purchases of US government bonds.
This new liquidity will push BTC toward historically record-high levels.
#interventions #bonds #liquidity #usa #elections
✴️#BTC #прогноз #крипто
A new consensus is starting to take shape in the crypto market:
In a bid not to let the market collapse and to rein in the sharp rise in yields ahead of the November midterm elections, the US Treasury will, out of sheer necessity, increase purchases of US government bonds.
This new liquidity will push BTC toward historically record-high levels.
#interventions #bonds #liquidity #usa #elections
A new consensus is starting to take shape in the crypto market:
In a bid not to let the market collapse and to rein in the sharp rise in yields ahead of the November midterm elections, the US Treasury will, out of sheer necessity, increase purchases of US government bonds.
This new liquidity will push BTC toward historically record-high levels.
#interventions #bonds #liquidity #usa #elections
81
·
--

Article
THE U.S. AND CANADA DID NOT REACH AN AGREEMENT - NEW TARIFFS ENTERED INTO FORCEThe final round of trade negotiations between the United States and Canada ended without an agreement. After a three-day delay, Washington imposed tariffs of 50% on Canadian goods worth about $20 billion per year.
Hundreds of product categories were affected, including alcohol, cement, furniture, plywood, electrical equipment, dairy products, clothing, fishing supplies, and hockey gear.
THE U.S. AND CANADA DID NOT REACH AN AGREEMENT - NEW TARIFFS ENTERED INTO FORCE
The final round of trade negotiations between the United States and Canada ended without an agreement. After a three-day delay, Washington imposed tariffs of 50% on Canadian goods worth about $20 billion per year.
Hundreds of product categories were affected, including alcohol, cement, furniture, plywood, electrical equipment, dairy products, clothing, fishing supplies, and hockey gear.
Hundreds of product categories were affected, including alcohol, cement, furniture, plywood, electrical equipment, dairy products, clothing, fishing supplies, and hockey gear.
75
Log in to explore more content
Join global crypto users on Binance Square
⚡️ Get latest and useful information about crypto.
💬 Trusted by the world’s largest crypto exchange.
👍 Discover real insights from verified creators.
Email / Phone number