
0xDryas
42 Posts

0xDryas
Report
Block User
不做方向判断。收益来自三类结构性错配:跨所同资产价差、资金费率期限结构、机制崩溃后的清算残留......
确定性来自机制失败,不来自情绪
(非投资建议)
11 Following
60 Followers
16 Liked
Posts
All
Quotes
PINNED
·
--
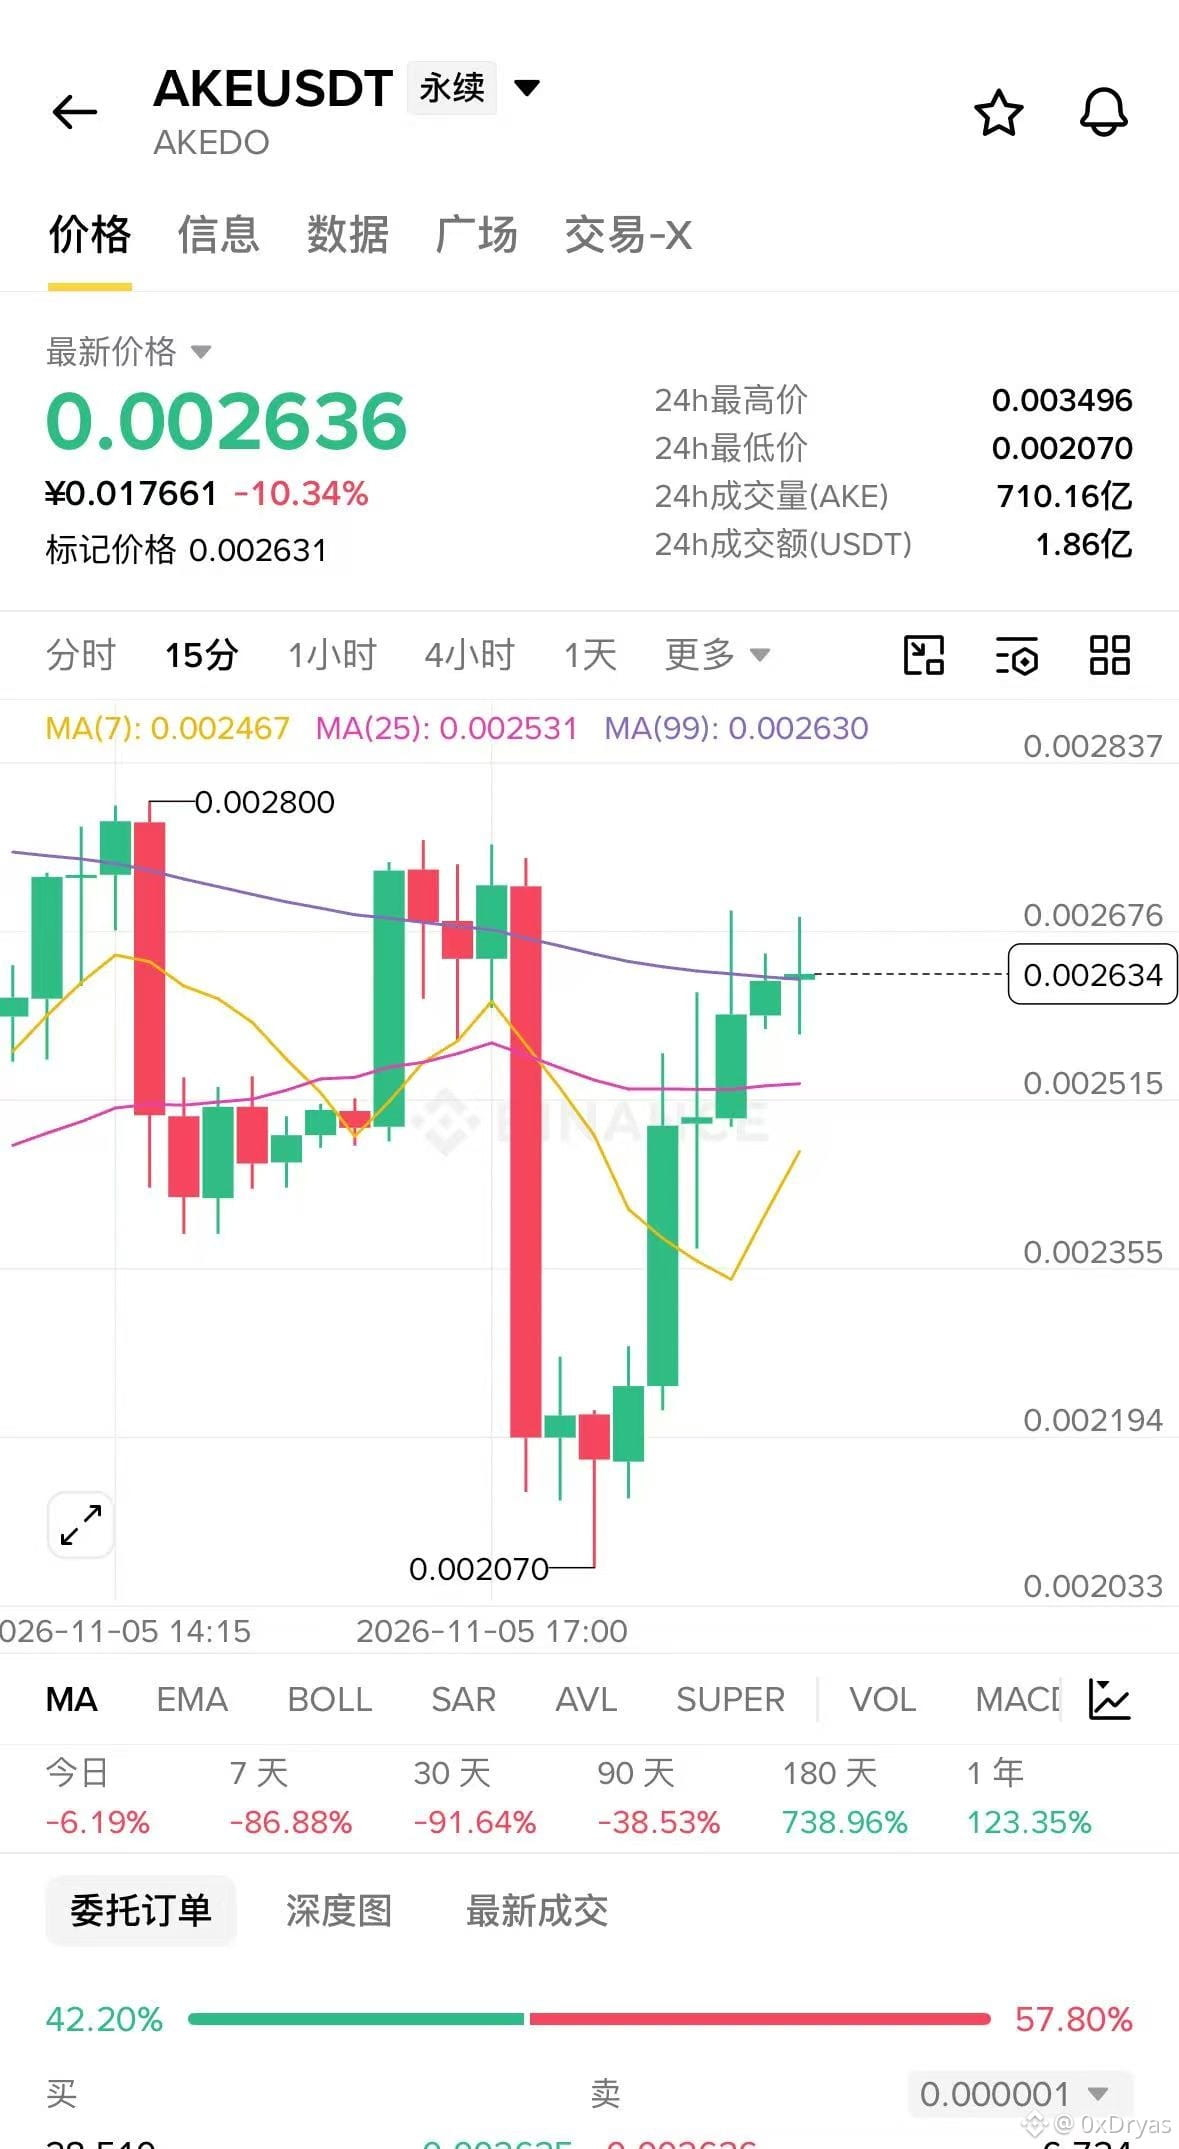
Holy shit, the market maker is manipulating things again. AKE fell 28% in a day, then bounced 23%, while funding got even more extreme
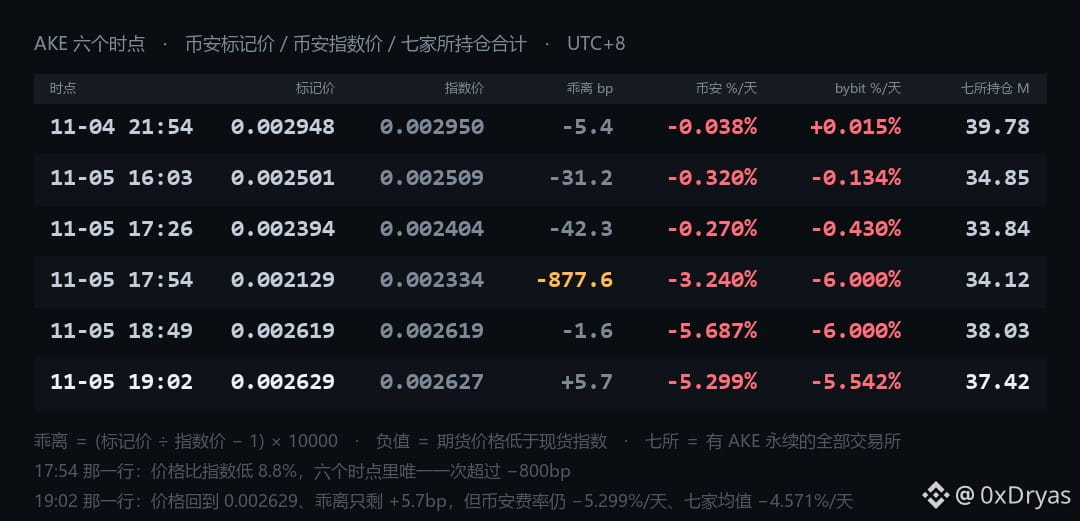
AKE completed a full cycle in a single day.
Binance mark price:
11-04 21:54 0.002948
11-05 16:03 0.002501 −15.2%
11-05 17:26 0.002394
11-05 17:54 0.002129 ← Bottom
11-05 18:49 0.002619 +23.0%
11-05 19:02 0.002629
From yesterday, it fell 27.8% to its low. From the low, it bounced 23.0% in a little over an hour.
It’s still 10.8% below yesterday’s price.
People trading futures usually look at this figure to judge whether anyone was forcibly liquidated. At the same time, across the entire market, among 2,311 contracts with open interest over $1 million, the median deviation was 6.3bp and the 99th percentile was 65bp.
AKE was at −877.6bp. The top six were all AKE—seven exchanges simultaneously drove its price 7% to 9% below the index.
This doesn’t mean “this coin is 8.8% cheaper.”
It means someone was forced to trade at a price 8.8% below what it “should be worth” during that minute. Liquidation orders don’t care about the price, only whether there’s enough margin.
Then there’s the funding rate
On Binance, AKE’s funding rate:
21:54 −0.038%/day
16:03 −0.320%
17:26 −0.270%
17:54 −3.240%
18:49 −5.687%
19:02 −5.299%
The price bottomed at 17:54; the funding rate peaked at 18:49.
Bybit was even more extreme: at 17:54, it hit −2.000000%/8 hours, three times a day—that’s −6.000%/day.
{future}(AKEUSDT)
Then it bounced 23%, and open interest rose from 34.12M to 38.03M, adding back 3.91M.
When the price rises and open interest rises, there’s only one explanation: new money has come in.
Holy shit, the market maker is manipulating things again. AKE fell 28% in a day, then bounced 23%, while funding got even more extreme
AKE completed a full cycle in a single day.
Binance mark price:
11-04 21:54 0.002948
11-05 16:03 0.002501 −15.2%
11-05 17:26 0.002394
11-05 17:54 0.002129 ← Bottom
11-05 18:49 0.002619 +23.0%
11-05 19:02 0.002629
From yesterday, it fell 27.8% to its low. From the low, it bounced 23.0% in a little over an hour.
It’s still 10.8% below yesterday’s price.
People trading futures usually look at this figure to judge whether anyone was forcibly liquidated. At the same time, across the entire market, among 2,311 contracts with open interest over $1 million, the median deviation was 6.3bp and the 99th percentile was 65bp.
AKE was at −877.6bp. The top six were all AKE—seven exchanges simultaneously drove its price 7% to 9% below the index.
This doesn’t mean “this coin is 8.8% cheaper.”
It means someone was forced to trade at a price 8.8% below what it “should be worth” during that minute. Liquidation orders don’t care about the price, only whether there’s enough margin.
Then there’s the funding rate
On Binance, AKE’s funding rate:
21:54 −0.038%/day
16:03 −0.320%
17:26 −0.270%
17:54 −3.240%
18:49 −5.687%
19:02 −5.299%
The price bottomed at 17:54; the funding rate peaked at 18:49.
Bybit was even more extreme: at 17:54, it hit −2.000000%/8 hours, three times a day—that’s −6.000%/day.
Then it bounced 23%, and open interest rose from 34.12M to 38.03M, adding back 3.91M.
When the price rises and open interest rises, there’s only one explanation: new money has come in.
AKE completed a full cycle in a single day.
Binance mark price:
11-04 21:54 0.002948
11-05 16:03 0.002501 −15.2%
11-05 17:26 0.002394
11-05 17:54 0.002129 ← Bottom
11-05 18:49 0.002619 +23.0%
11-05 19:02 0.002629
From yesterday, it fell 27.8% to its low. From the low, it bounced 23.0% in a little over an hour.
It’s still 10.8% below yesterday’s price.
People trading futures usually look at this figure to judge whether anyone was forcibly liquidated. At the same time, across the entire market, among 2,311 contracts with open interest over $1 million, the median deviation was 6.3bp and the 99th percentile was 65bp.
AKE was at −877.6bp. The top six were all AKE—seven exchanges simultaneously drove its price 7% to 9% below the index.
This doesn’t mean “this coin is 8.8% cheaper.”
It means someone was forced to trade at a price 8.8% below what it “should be worth” during that minute. Liquidation orders don’t care about the price, only whether there’s enough margin.
Then there’s the funding rate
On Binance, AKE’s funding rate:
21:54 −0.038%/day
16:03 −0.320%
17:26 −0.270%
17:54 −3.240%
18:49 −5.687%
19:02 −5.299%
The price bottomed at 17:54; the funding rate peaked at 18:49.
Bybit was even more extreme: at 17:54, it hit −2.000000%/8 hours, three times a day—that’s −6.000%/day.
Then it bounced 23%, and open interest rose from 34.12M to 38.03M, adding back 3.91M.
When the price rises and open interest rises, there’s only one explanation: new money has come in.
7
2
1.4k
·
--
Verified
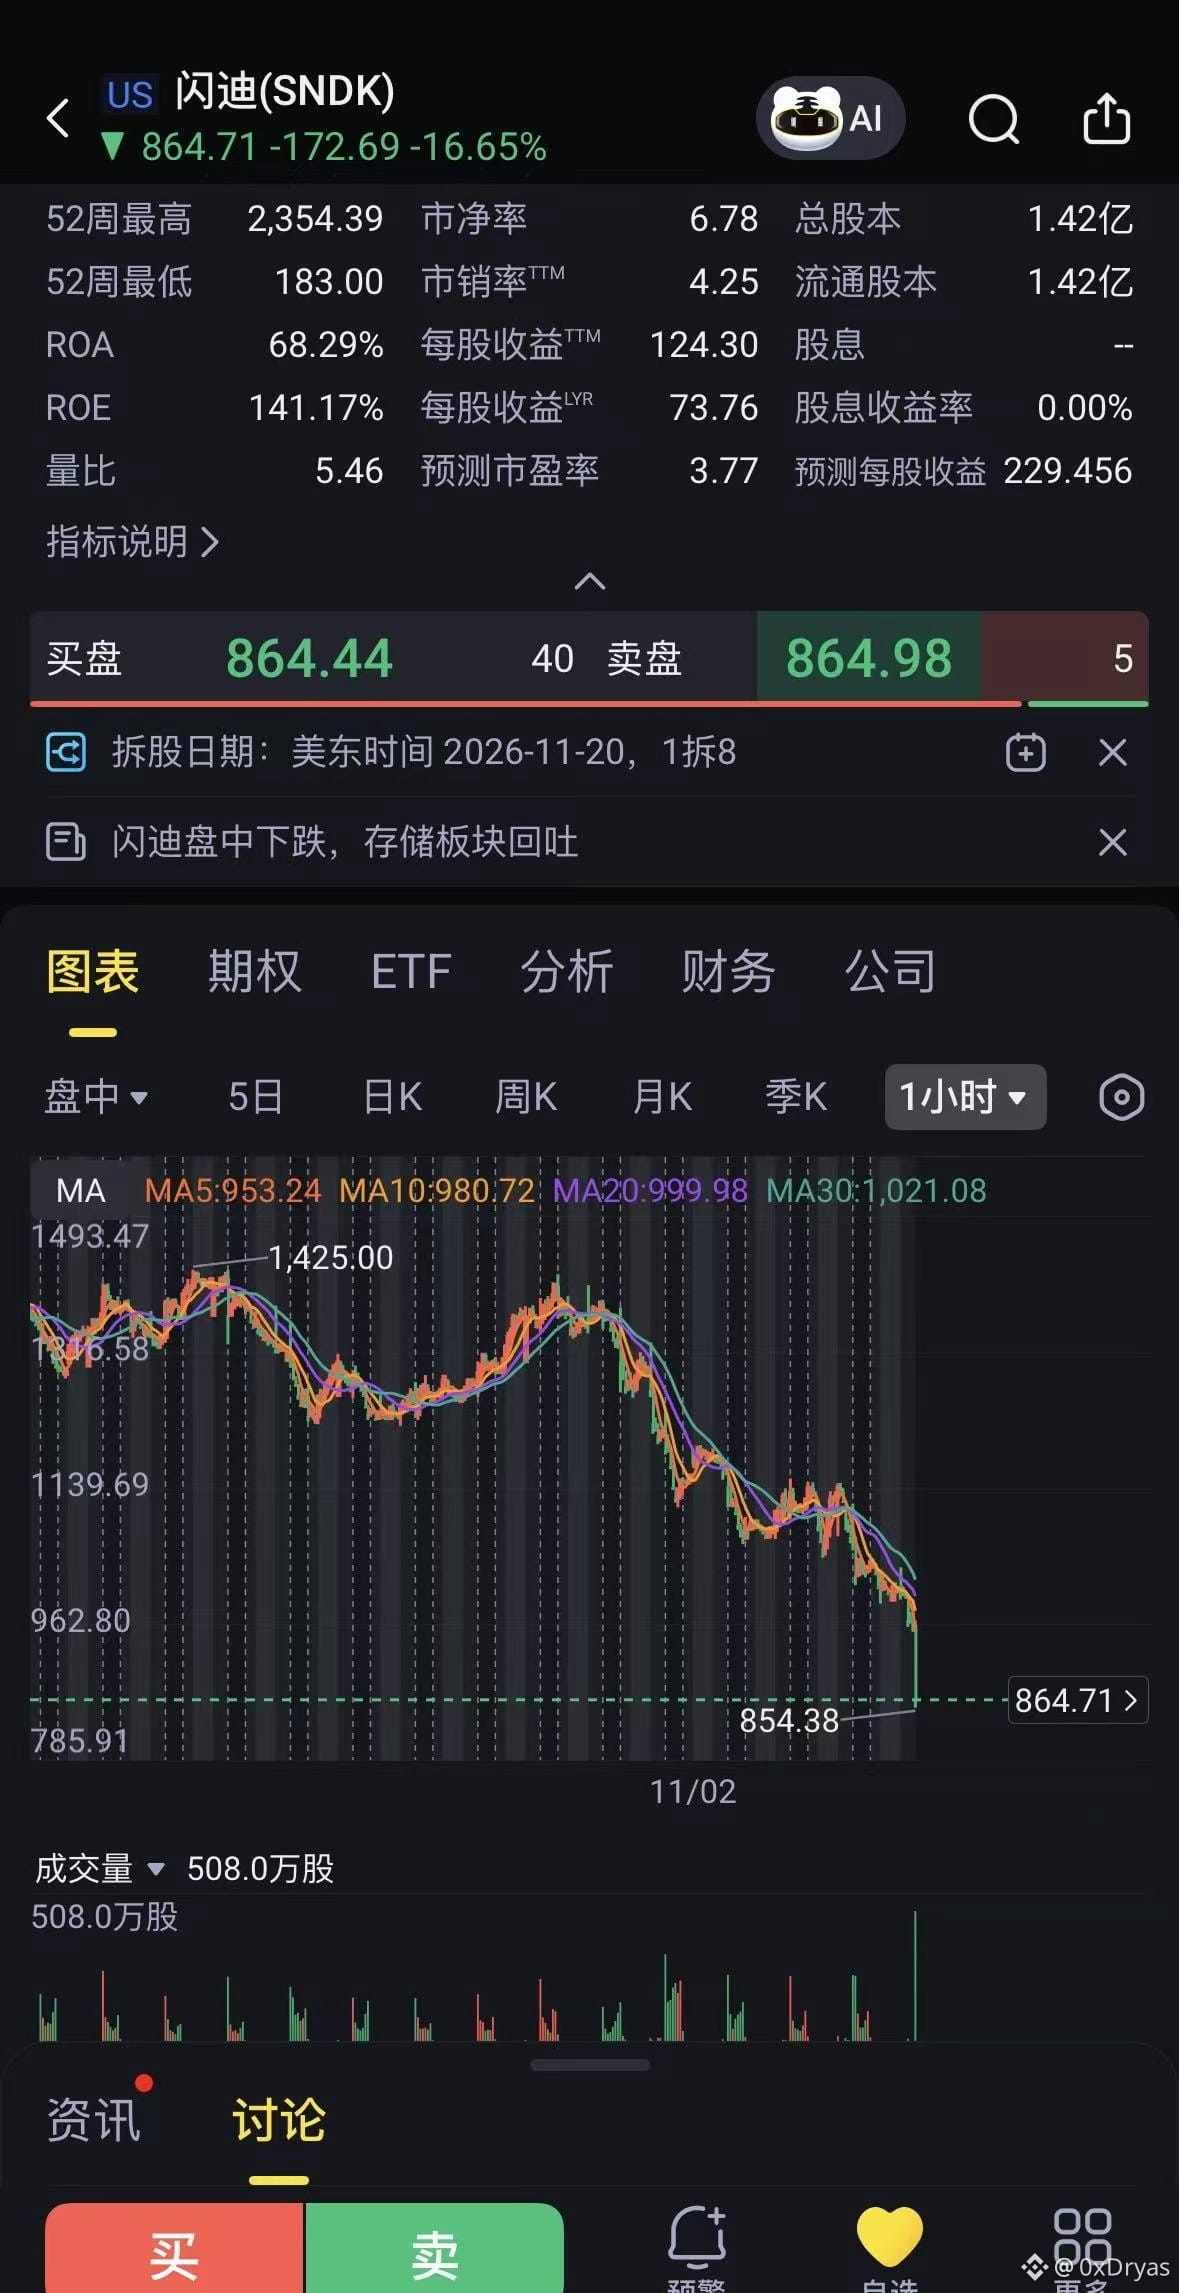
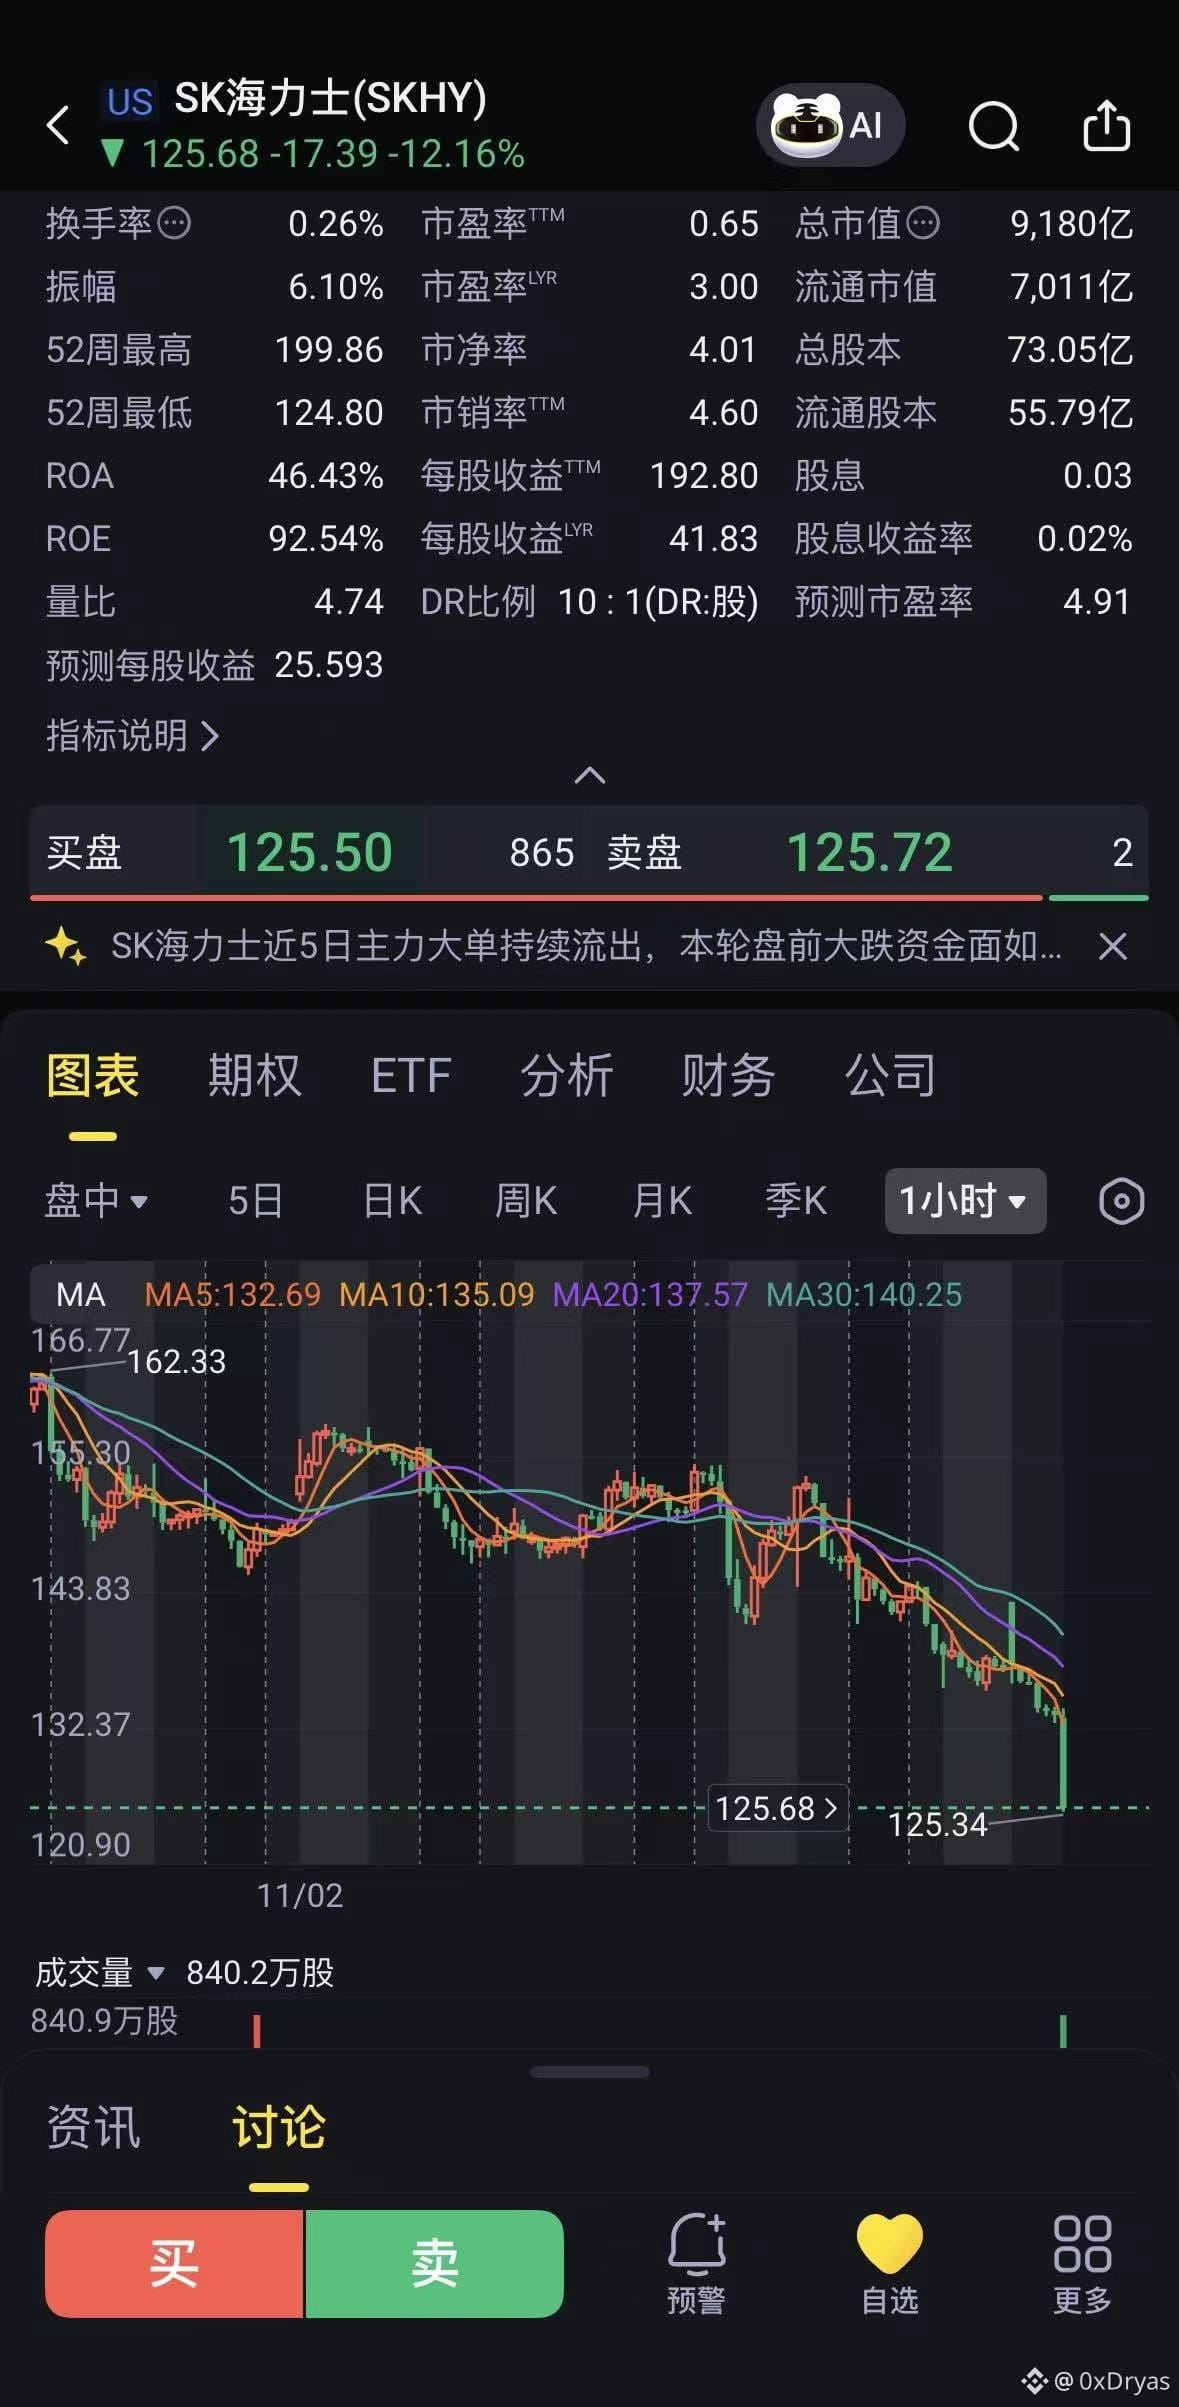
AI stocks plunged sharply tonight, especially SanDisk #SNDK and SK Hynix #SKHY , along with other AI infrastructure stocks, which fell by more than 10% across the board.
That was because the Democrats won a decisive victory in the U.S. midterm elections, acting as a catalyst that ignited long-standing market concerns and doubts about an AI investment bubble.
The Democrats' policy priorities lean toward clean energy subsidies and Medicaid, while AI data centers, power generation, defense, and finance—areas covered by Trump’s policies—face tighter regulation.
You may want to consider industries promoted by the Democrats, including solar energy, healthcare, and consumer goods.
{future}(SKHYUSDT)
{future}(SNDKUSDT)
(By contrast, the Republicans tend to favor expanding the development of defense, traditional energy such as oil and natural gas, and military technology.)
AI stocks plunged sharply tonight, especially SanDisk #SNDK and SK Hynix #SKHY , along with other AI infrastructure stocks, which fell by more than 10% across the board.
That was because the Democrats won a decisive victory in the U.S. midterm elections, acting as a catalyst that ignited long-standing market concerns and doubts about an AI investment bubble.
The Democrats' policy priorities lean toward clean energy subsidies and Medicaid, while AI data centers, power generation, defense, and finance—areas covered by Trump’s policies—face tighter regulation.
You may want to consider industries promoted by the Democrats, including solar energy, healthcare, and consumer goods.
(By contrast, the Republicans tend to favor expanding the development of defense, traditional energy such as oil and natural gas, and military technology.)
That was because the Democrats won a decisive victory in the U.S. midterm elections, acting as a catalyst that ignited long-standing market concerns and doubts about an AI investment bubble.
The Democrats' policy priorities lean toward clean energy subsidies and Medicaid, while AI data centers, power generation, defense, and finance—areas covered by Trump’s policies—face tighter regulation.
You may want to consider industries promoted by the Democrats, including solar energy, healthcare, and consumer goods.
(By contrast, the Republicans tend to favor expanding the development of defense, traditional energy such as oil and natural gas, and military technology.)
557
·
--
Partly True
Tencent and Xiaomi perpetuals are on Binance】
Hong Kong stocks trade for only five and a half hours a day. As perpetuals, they keep moving in the early hours of Beijing time, on weekends, and when the Hong Kong market is closed.
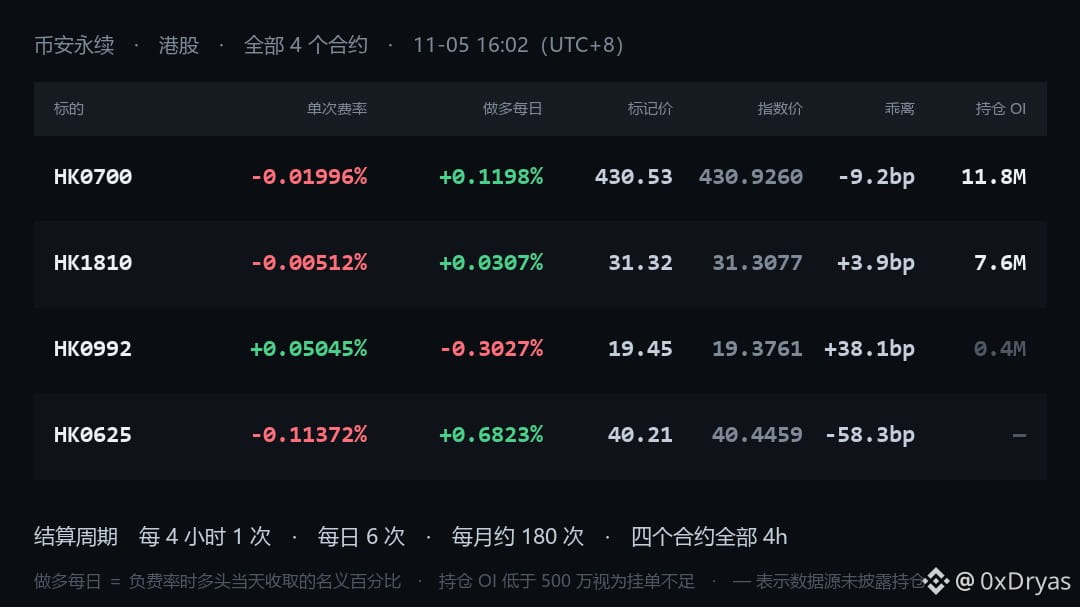
It’s 16:02 Beijing time now — two minutes after the Hong Kong Stock Exchange just closed. These four Hong Kong stock contracts on Binance have only made it through one morning of trading.
Same set of assets, one negative and one positive
Binance lists just four Hong Kong stock perpetuals, all here:
· Tencent HK0700: −0.01996% / 4 hours; going long earns 0.1198% a day, 44% annualized, with $11.85 million in open interest
· Xiaomi HK1810: −0.00512% / 4 hours; going long earns 0.0307% a day, 11% annualized, with $7.61 million in open interest
· Lenovo HK0992: +0.05045% / 4 hours; going long pays 0.3027% a day, −110% annualized, with $380,000 in open interest
· HK0625: −0.11372% / 4 hours; going long earns 0.6823% a day — but the data source doesn’t show its open interest. Daily trading volume is only 488,000, and there’s nobody to take the other side
The fourth one has the juiciest numbers, but it’s also the only one you can’t trade. No matter how high the rate is, if nobody takes your order, it’s worth zero.
On the same day, in the same market, one contract pays you, one is almost flat, one costs you, and one is impossible to trade. It’s not about whether the companies are good or bad; it’s about how many shorts there are in each contract.
Why such a big difference?
First, capacity. Tencent has $11.85 million in open interest, Xiaomi $7.61 million, and Lenovo $380,000. Lenovo’s figure is just a fraction of Tencent’s — even a high rate can’t make up for the lack of capacity.
Second, how many shorts there are. After the Hong Kong market closes, the perpetuals keep trading. During that time, there’s no spot market to take the other side, so the contract with more crowded positions is the one that pays.
Third, price. Tencent’s mark price is 9 basis points below the index, so it’s trading at a discount; Xiaomi is at a premium. A discount indicates that shorts are pushing the price down.
If you’re going to trade
For Tencent, going long earns 0.1198% a day, 44% annualized, with $11.85 million in open interest and $8.69 million in daily trading volume. Trading a few hundred thousand dollars’ worth is fine.
These contracts settle every 4 hours, six times a day; the U.S. stock contracts settle every 8 hours, three times a day. So always quote the rate per settlement — the annualized figure is what you get by extrapolating that rate.
{future}(HK0992USDT)
{future}(HK1810USDT)
{future}(HK0700USDT)
Tencent and Xiaomi perpetuals are on Binance】
Hong Kong stocks trade for only five and a half hours a day. As perpetuals, they keep moving in the early hours of Beijing time, on weekends, and when the Hong Kong market is closed.
It’s 16:02 Beijing time now — two minutes after the Hong Kong Stock Exchange just closed. These four Hong Kong stock contracts on Binance have only made it through one morning of trading.
Same set of assets, one negative and one positive
Binance lists just four Hong Kong stock perpetuals, all here:
· Tencent HK0700: −0.01996% / 4 hours; going long earns 0.1198% a day, 44% annualized, with $11.85 million in open interest
· Xiaomi HK1810: −0.00512% / 4 hours; going long earns 0.0307% a day, 11% annualized, with $7.61 million in open interest
· Lenovo HK0992: +0.05045% / 4 hours; going long pays 0.3027% a day, −110% annualized, with $380,000 in open interest
· HK0625: −0.11372% / 4 hours; going long earns 0.6823% a day — but the data source doesn’t show its open interest. Daily trading volume is only 488,000, and there’s nobody to take the other side
The fourth one has the juiciest numbers, but it’s also the only one you can’t trade. No matter how high the rate is, if nobody takes your order, it’s worth zero.
On the same day, in the same market, one contract pays you, one is almost flat, one costs you, and one is impossible to trade. It’s not about whether the companies are good or bad; it’s about how many shorts there are in each contract.
Why such a big difference?
First, capacity. Tencent has $11.85 million in open interest, Xiaomi $7.61 million, and Lenovo $380,000. Lenovo’s figure is just a fraction of Tencent’s — even a high rate can’t make up for the lack of capacity.
Second, how many shorts there are. After the Hong Kong market closes, the perpetuals keep trading. During that time, there’s no spot market to take the other side, so the contract with more crowded positions is the one that pays.
Third, price. Tencent’s mark price is 9 basis points below the index, so it’s trading at a discount; Xiaomi is at a premium. A discount indicates that shorts are pushing the price down.
If you’re going to trade
For Tencent, going long earns 0.1198% a day, 44% annualized, with $11.85 million in open interest and $8.69 million in daily trading volume. Trading a few hundred thousand dollars’ worth is fine.
These contracts settle every 4 hours, six times a day; the U.S. stock contracts settle every 8 hours, three times a day. So always quote the rate per settlement — the annualized figure is what you get by extrapolating that rate.
Hong Kong stocks trade for only five and a half hours a day. As perpetuals, they keep moving in the early hours of Beijing time, on weekends, and when the Hong Kong market is closed.
It’s 16:02 Beijing time now — two minutes after the Hong Kong Stock Exchange just closed. These four Hong Kong stock contracts on Binance have only made it through one morning of trading.
Same set of assets, one negative and one positive
Binance lists just four Hong Kong stock perpetuals, all here:
· Tencent HK0700: −0.01996% / 4 hours; going long earns 0.1198% a day, 44% annualized, with $11.85 million in open interest
· Xiaomi HK1810: −0.00512% / 4 hours; going long earns 0.0307% a day, 11% annualized, with $7.61 million in open interest
· Lenovo HK0992: +0.05045% / 4 hours; going long pays 0.3027% a day, −110% annualized, with $380,000 in open interest
· HK0625: −0.11372% / 4 hours; going long earns 0.6823% a day — but the data source doesn’t show its open interest. Daily trading volume is only 488,000, and there’s nobody to take the other side
The fourth one has the juiciest numbers, but it’s also the only one you can’t trade. No matter how high the rate is, if nobody takes your order, it’s worth zero.
On the same day, in the same market, one contract pays you, one is almost flat, one costs you, and one is impossible to trade. It’s not about whether the companies are good or bad; it’s about how many shorts there are in each contract.
Why such a big difference?
First, capacity. Tencent has $11.85 million in open interest, Xiaomi $7.61 million, and Lenovo $380,000. Lenovo’s figure is just a fraction of Tencent’s — even a high rate can’t make up for the lack of capacity.
Second, how many shorts there are. After the Hong Kong market closes, the perpetuals keep trading. During that time, there’s no spot market to take the other side, so the contract with more crowded positions is the one that pays.
Third, price. Tencent’s mark price is 9 basis points below the index, so it’s trading at a discount; Xiaomi is at a premium. A discount indicates that shorts are pushing the price down.
If you’re going to trade
For Tencent, going long earns 0.1198% a day, 44% annualized, with $11.85 million in open interest and $8.69 million in daily trading volume. Trading a few hundred thousand dollars’ worth is fine.
These contracts settle every 4 hours, six times a day; the U.S. stock contracts settle every 8 hours, three times a day. So always quote the rate per settlement — the annualized figure is what you get by extrapolating that rate.
1
595
·
--
Get paid for going long yesterday, get paid for going short today】
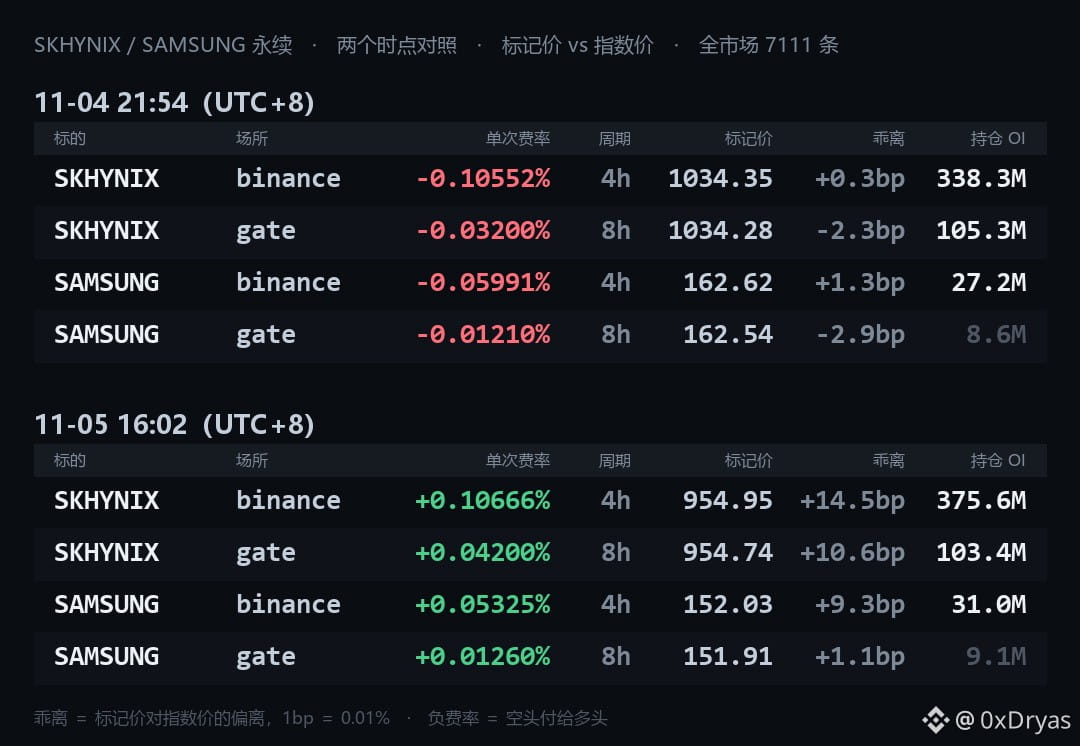
Yesterday at 21:54, SK Hynix’s perpetual funding rate was −231% annualized. Longs collected payments every 4 hours, paid by shorts.
Today at 16:02, it was +234%. The situation had reversed: shorts were collecting.
And it wasn’t just SK Hynix. Samsung Electronics was at −131% yesterday and +117% today. Two Korean stocks, two exchanges, four figures—all flipped.
The price fell 7.7% in a single day
SK Hynix fell from 1,034 to 955. The drop itself wasn’t unusual; what was unusual was the reaction in perpetuals.
Yesterday, its mark price and index price were almost identical, just 0.3 basis points apart. Today, it was trading at a 14.5-basis-point premium.
A premium means someone is willing to pay a little more than the spot price to buy during a downturn. When enough people do that, longs have to pay shorts—that’s how the rate flips from negative to positive.
Conversely, a discount means shorts are crowded together, paying longs. Whether the rate is positive or negative is essentially the price of this imbalance.
The direction completely reversed, but the spread barely changed
Yesterday: on Binance, longs collected 0.6331% per day; on Gate, shorts paid 0.0960% per day; net: 0.5371% per day.
Today: on Gate, longs paid 0.1260% per day; on Binance, shorts collected 0.6400% per day; net: 0.5140% per day.
The returns are almost the same, but the direction of all four legs has switched.
That’s the point I’m making: with this strategy, you don’t need to predict whether the rate will be positive or negative. You only need to judge whether the spread between the two exchanges is still there. The market decides the direction; your job is to collect the spread.
How much can you put on? The Gate side is the limiting factor: $103 million.
Three things to be clear about
First, with the same asset and opposite directions, price movements cancel each other out. What remains is the funding-rate spread and each side’s own liquidation threshold.
Second, margin on the two exchanges isn’t shared. For the same notional exposure, the actual capital required is twice that of a single leg.
Third, Korean stocks have price limits and market closures. Perpetuals keep trading during closures, so the spread can widen—and that’s also why this strategy can be profitable.
{future}(SKHYUSDT)
Get paid for going long yesterday, get paid for going short today】
Yesterday at 21:54, SK Hynix’s perpetual funding rate was −231% annualized. Longs collected payments every 4 hours, paid by shorts.
Today at 16:02, it was +234%. The situation had reversed: shorts were collecting.
And it wasn’t just SK Hynix. Samsung Electronics was at −131% yesterday and +117% today. Two Korean stocks, two exchanges, four figures—all flipped.
The price fell 7.7% in a single day
SK Hynix fell from 1,034 to 955. The drop itself wasn’t unusual; what was unusual was the reaction in perpetuals.
Yesterday, its mark price and index price were almost identical, just 0.3 basis points apart. Today, it was trading at a 14.5-basis-point premium.
A premium means someone is willing to pay a little more than the spot price to buy during a downturn. When enough people do that, longs have to pay shorts—that’s how the rate flips from negative to positive.
Conversely, a discount means shorts are crowded together, paying longs. Whether the rate is positive or negative is essentially the price of this imbalance.
The direction completely reversed, but the spread barely changed
Yesterday: on Binance, longs collected 0.6331% per day; on Gate, shorts paid 0.0960% per day; net: 0.5371% per day.
Today: on Gate, longs paid 0.1260% per day; on Binance, shorts collected 0.6400% per day; net: 0.5140% per day.
The returns are almost the same, but the direction of all four legs has switched.
That’s the point I’m making: with this strategy, you don’t need to predict whether the rate will be positive or negative. You only need to judge whether the spread between the two exchanges is still there. The market decides the direction; your job is to collect the spread.
How much can you put on? The Gate side is the limiting factor: $103 million.
Three things to be clear about
First, with the same asset and opposite directions, price movements cancel each other out. What remains is the funding-rate spread and each side’s own liquidation threshold.
Second, margin on the two exchanges isn’t shared. For the same notional exposure, the actual capital required is twice that of a single leg.
Third, Korean stocks have price limits and market closures. Perpetuals keep trading during closures, so the spread can widen—and that’s also why this strategy can be profitable.
Yesterday at 21:54, SK Hynix’s perpetual funding rate was −231% annualized. Longs collected payments every 4 hours, paid by shorts.
Today at 16:02, it was +234%. The situation had reversed: shorts were collecting.
And it wasn’t just SK Hynix. Samsung Electronics was at −131% yesterday and +117% today. Two Korean stocks, two exchanges, four figures—all flipped.
The price fell 7.7% in a single day
SK Hynix fell from 1,034 to 955. The drop itself wasn’t unusual; what was unusual was the reaction in perpetuals.
Yesterday, its mark price and index price were almost identical, just 0.3 basis points apart. Today, it was trading at a 14.5-basis-point premium.
A premium means someone is willing to pay a little more than the spot price to buy during a downturn. When enough people do that, longs have to pay shorts—that’s how the rate flips from negative to positive.
Conversely, a discount means shorts are crowded together, paying longs. Whether the rate is positive or negative is essentially the price of this imbalance.
The direction completely reversed, but the spread barely changed
Yesterday: on Binance, longs collected 0.6331% per day; on Gate, shorts paid 0.0960% per day; net: 0.5371% per day.
Today: on Gate, longs paid 0.1260% per day; on Binance, shorts collected 0.6400% per day; net: 0.5140% per day.
The returns are almost the same, but the direction of all four legs has switched.
That’s the point I’m making: with this strategy, you don’t need to predict whether the rate will be positive or negative. You only need to judge whether the spread between the two exchanges is still there. The market decides the direction; your job is to collect the spread.
How much can you put on? The Gate side is the limiting factor: $103 million.
Three things to be clear about
First, with the same asset and opposite directions, price movements cancel each other out. What remains is the funding-rate spread and each side’s own liquidation threshold.
Second, margin on the two exchanges isn’t shared. For the same notional exposure, the actual capital required is twice that of a single leg.
Third, Korean stocks have price limits and market closures. Perpetuals keep trading during closures, so the spread can widen—and that’s also why this strategy can be profitable.
230
·
--
The Binance contract with the most negative funding rate settles in two hours and fifty minutes.
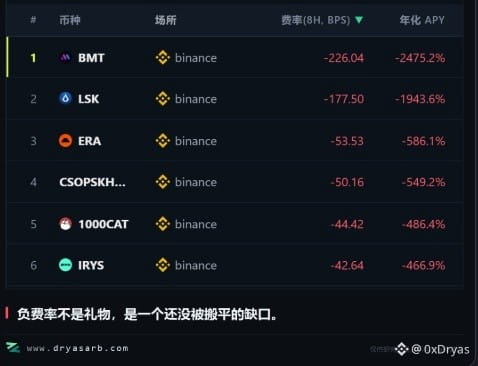
Sort Binance’s funding rate rankings in ascending order, and the first one is $BMT .
The current rate is −1.13% per 4 hours, equivalent to an annualized rate of −2475%.
The mechanism can be summed up in one sentence: when the rate is negative, shorts pay longs. If you go long on Binance, your account gets credited at settlement, with the money deducted from the shorts.
But check three things before you act:
First, the settlement time.
Second, why the rate is negative.
Third, positive rates are the default.
But that −2475% figure won’t last an hour. Anyone who treats it as a yield will lose. Its real purpose is to tell you just how imbalanced the long and short positions in this asset have become.
The funding rate is a thermometer for sentiment, not a guide to returns.
{future}(BMTUSDT)
The Binance contract with the most negative funding rate settles in two hours and fifty minutes.
Sort Binance’s funding rate rankings in ascending order, and the first one is $BMT .
The current rate is −1.13% per 4 hours, equivalent to an annualized rate of −2475%.
The mechanism can be summed up in one sentence: when the rate is negative, shorts pay longs. If you go long on Binance, your account gets credited at settlement, with the money deducted from the shorts.
But check three things before you act:
First, the settlement time.
Second, why the rate is negative.
Third, positive rates are the default.
But that −2475% figure won’t last an hour. Anyone who treats it as a yield will lose. Its real purpose is to tell you just how imbalanced the long and short positions in this asset have become.
The funding rate is a thermometer for sentiment, not a guide to returns.
Sort Binance’s funding rate rankings in ascending order, and the first one is $BMT .
The current rate is −1.13% per 4 hours, equivalent to an annualized rate of −2475%.
The mechanism can be summed up in one sentence: when the rate is negative, shorts pay longs. If you go long on Binance, your account gets credited at settlement, with the money deducted from the shorts.
But check three things before you act:
First, the settlement time.
Second, why the rate is negative.
Third, positive rates are the default.
But that −2475% figure won’t last an hour. Anyone who treats it as a yield will lose. Its real purpose is to tell you just how imbalanced the long and short positions in this asset have become.
The funding rate is a thermometer for sentiment, not a guide to returns.
248
·
--
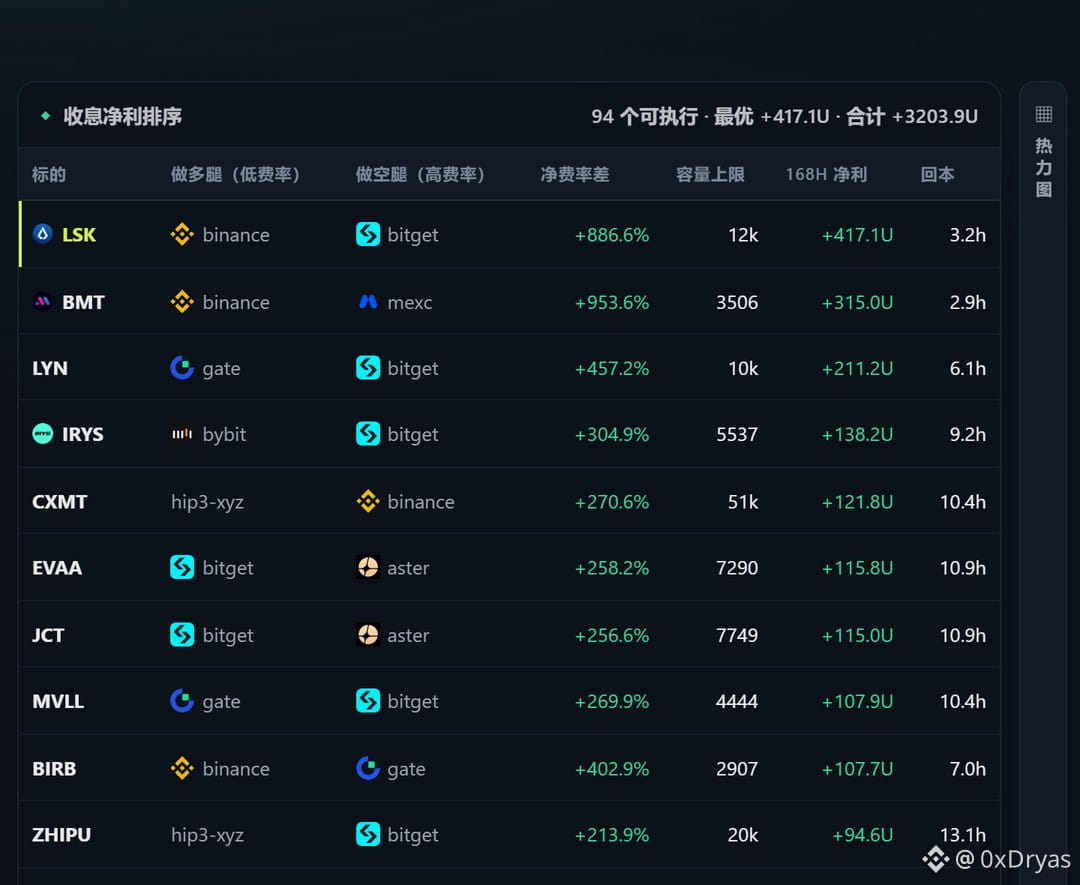
This page has 94 rows, and every row shows a way to get paid by going long or pay by going short.
LSK: Go long on Binance, short on Bitget—the net funding rate difference is 886% per year. BMT is even more extreme at 953%.
The mechanism is simple: when the funding rate is negative, shorts pay longs. If the rates are negative on one exchange and positive on another, go long where the rate is lower and short where it’s higher—the difference is yours.
But look at the right side: capacity limits of 12,000 and 3,506. You can’t put much in, and it earns just over $400 in 16 hours.
The funding rate difference is free money; the problem is how little you can put in.
#FundingRates #PerpetualContracts #CrossExchangeArbitrage #交易笔记
This page has 94 rows, and every row shows a way to get paid by going long or pay by going short.
LSK: Go long on Binance, short on Bitget—the net funding rate difference is 886% per year. BMT is even more extreme at 953%.
The mechanism is simple: when the funding rate is negative, shorts pay longs. If the rates are negative on one exchange and positive on another, go long where the rate is lower and short where it’s higher—the difference is yours.
But look at the right side: capacity limits of 12,000 and 3,506. You can’t put much in, and it earns just over $400 in 16 hours.
The funding rate difference is free money; the problem is how little you can put in.
#FundingRates #PerpetualContracts #CrossExchangeArbitrage #交易笔记
LSK: Go long on Binance, short on Bitget—the net funding rate difference is 886% per year. BMT is even more extreme at 953%.
The mechanism is simple: when the funding rate is negative, shorts pay longs. If the rates are negative on one exchange and positive on another, go long where the rate is lower and short where it’s higher—the difference is yours.
But look at the right side: capacity limits of 12,000 and 3,506. You can’t put much in, and it earns just over $400 in 16 hours.
The funding rate difference is free money; the problem is how little you can put in.
#FundingRates #PerpetualContracts #CrossExchangeArbitrage #交易笔记
677
·
--
Verified
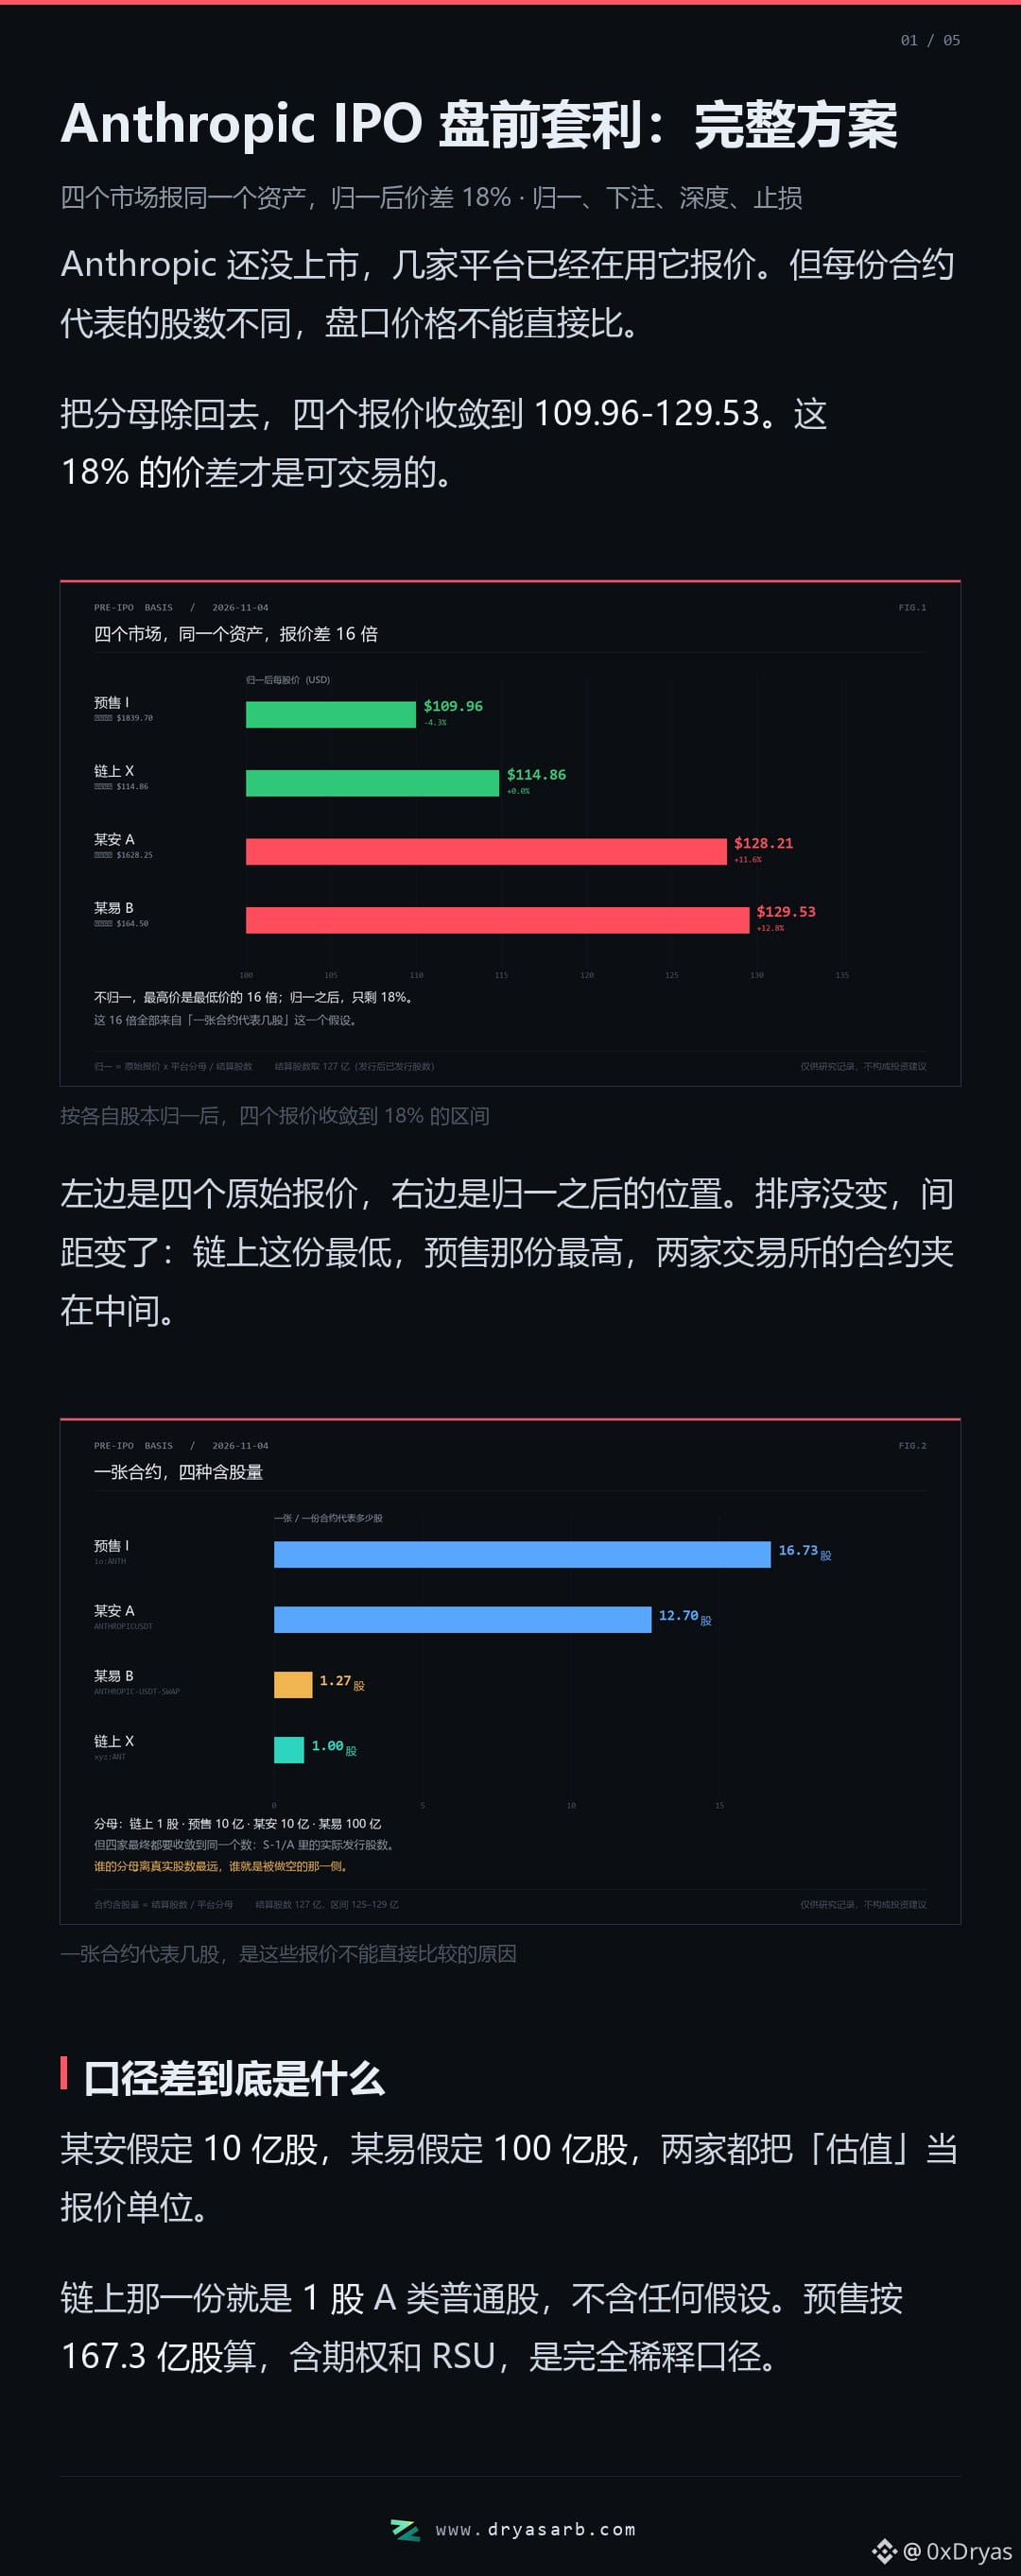
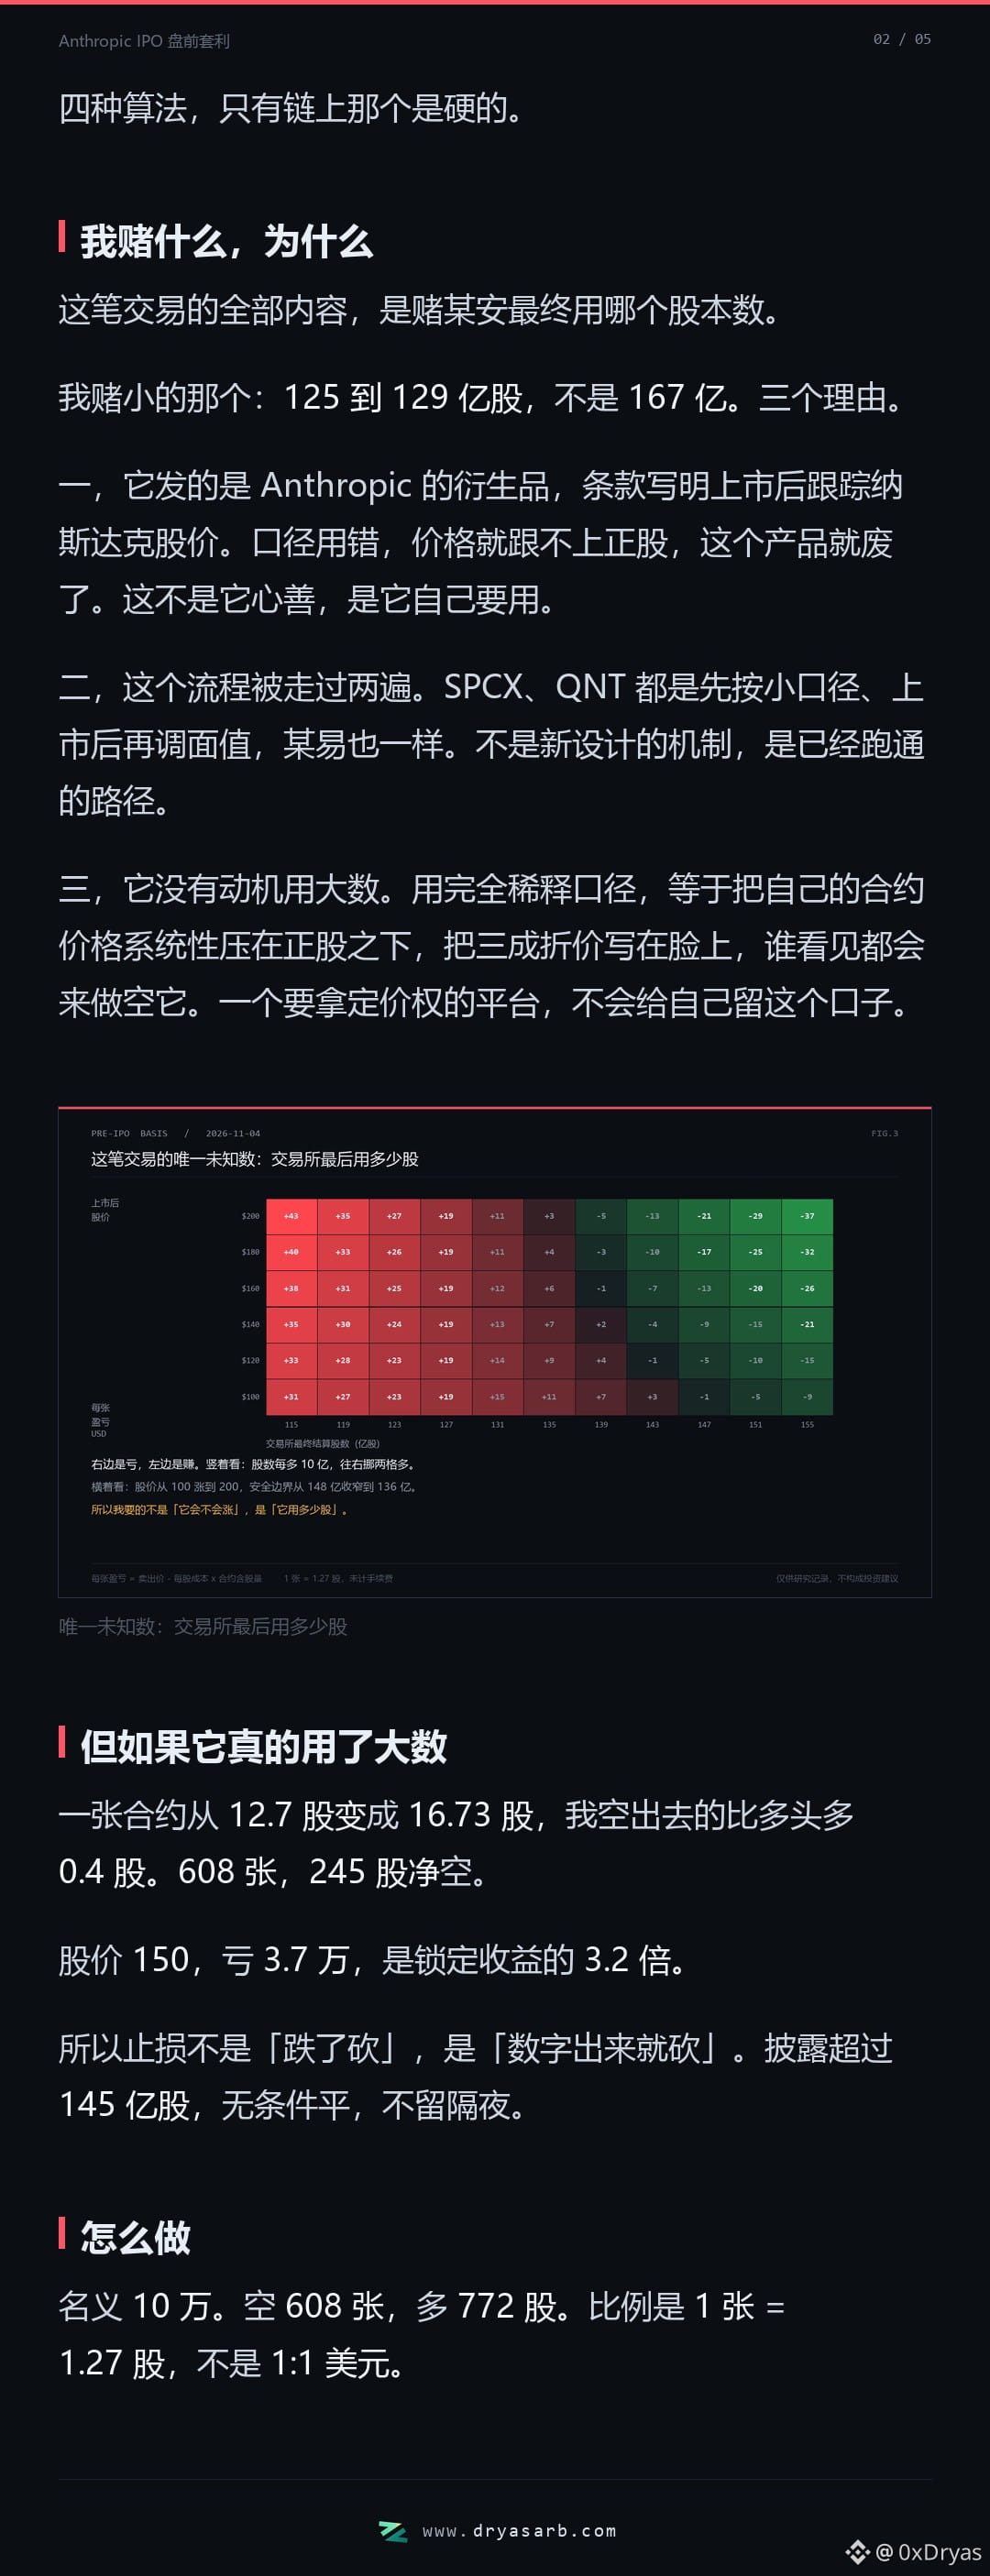
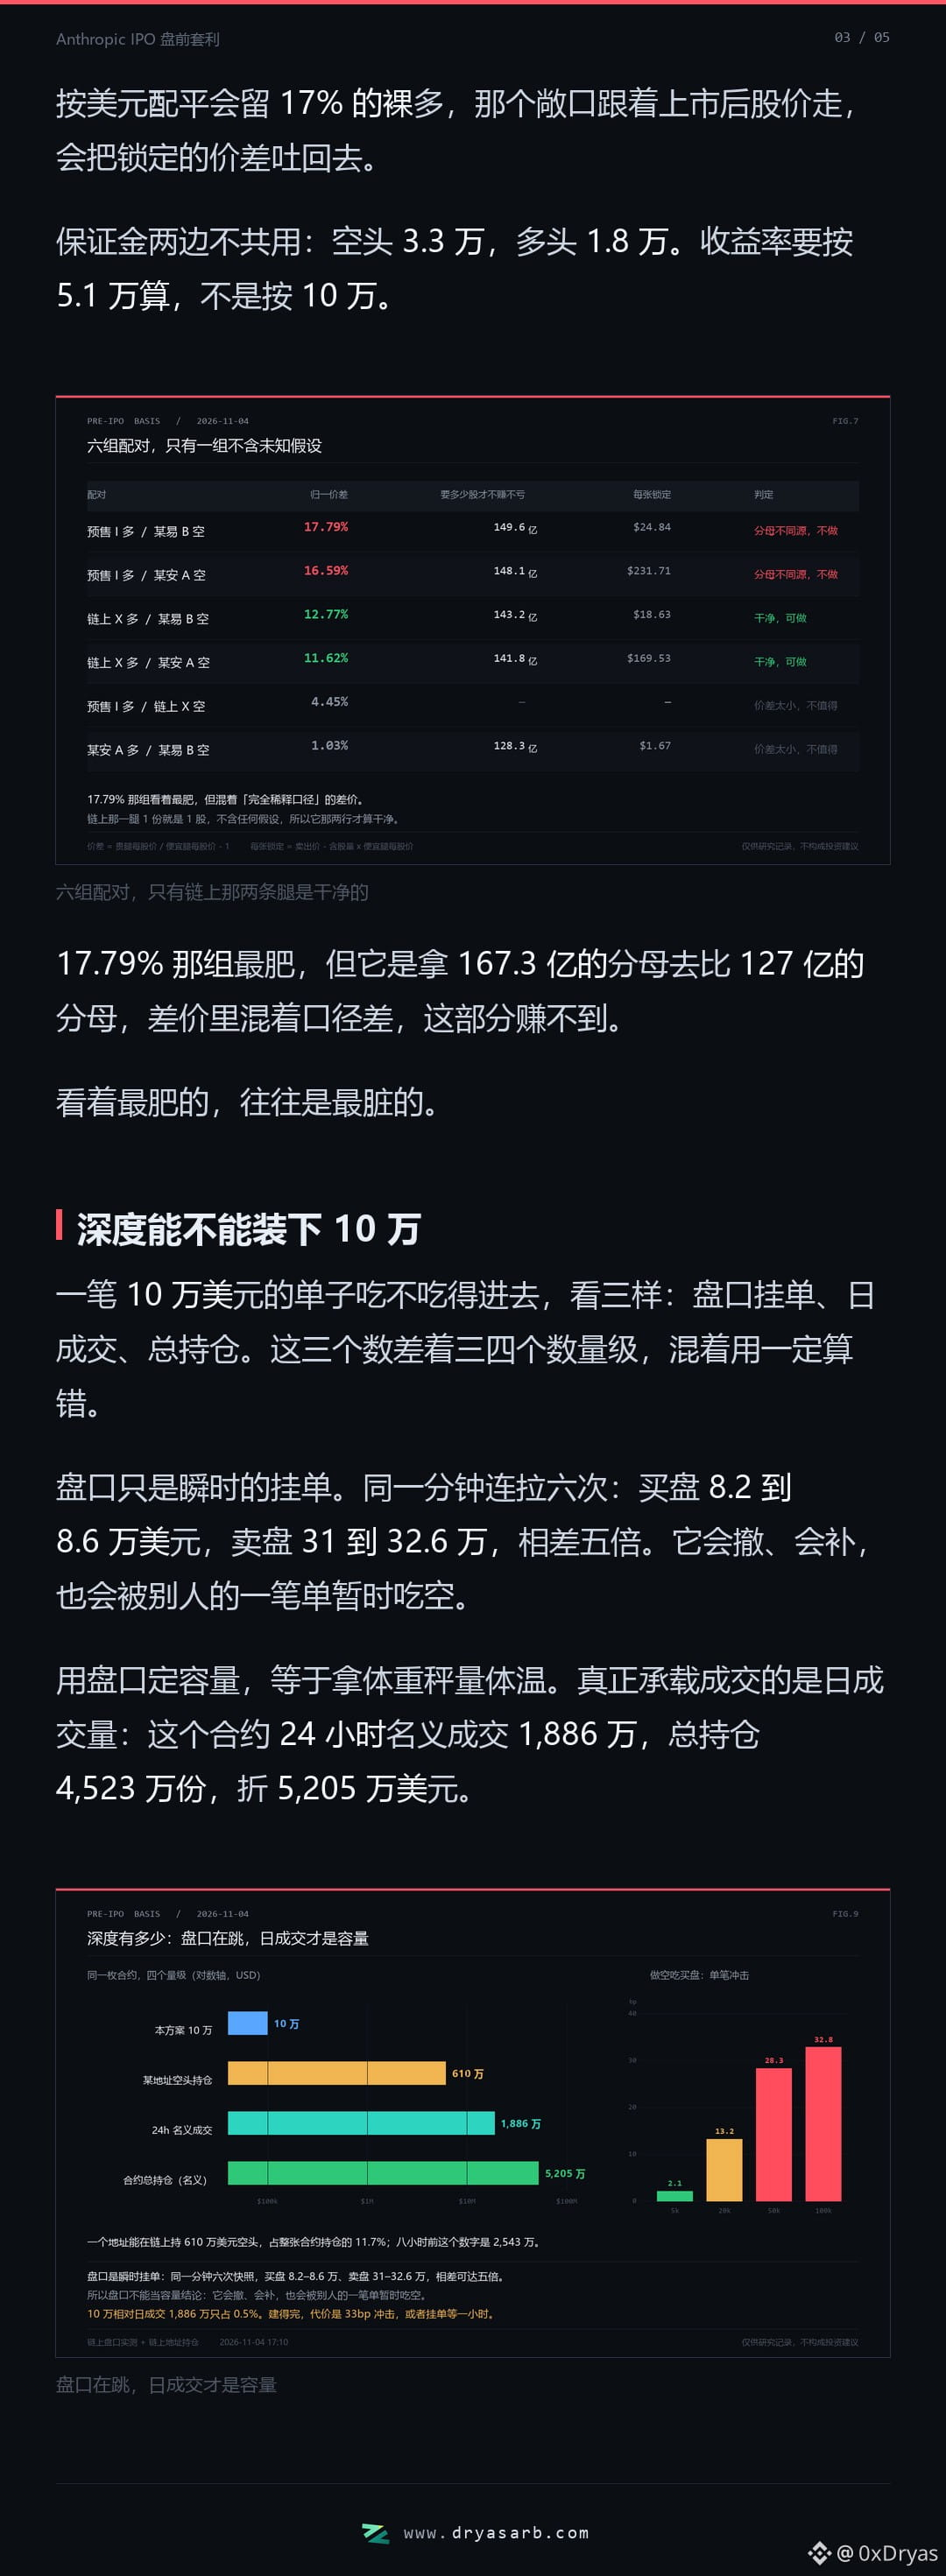
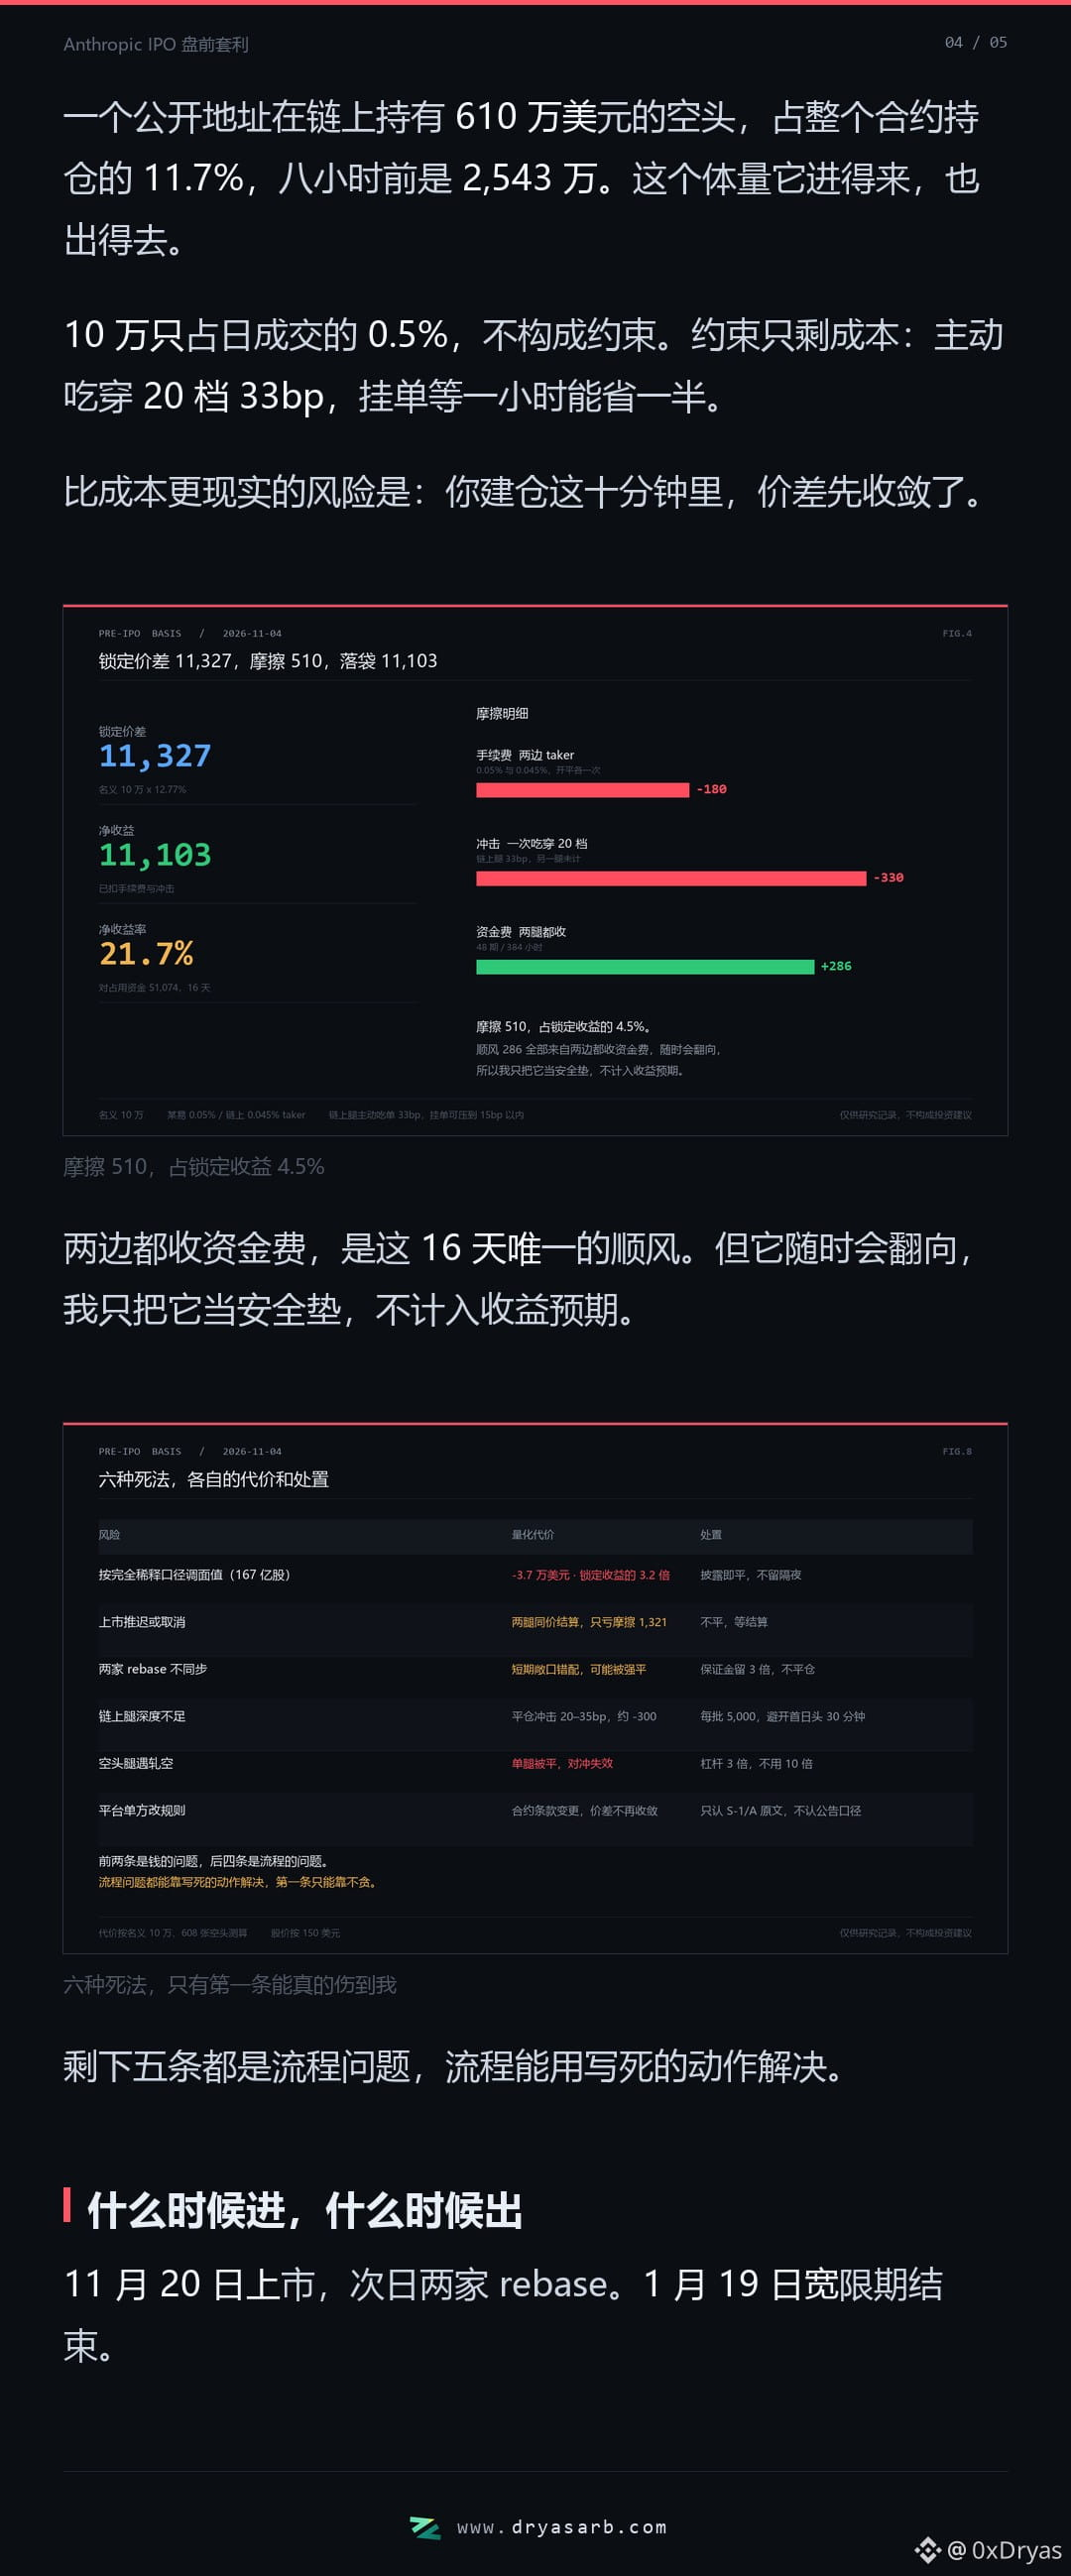
Anthropic IPO Pre-Market Arbitrage: A Complete Plan————
{future}(ANTHROPICUSDT)
Four markets quote the same asset, with an 18% spread after normalization · Normalize, bet, depth, stop-loss
Anthropic has not gone public yet, but several platforms are already quoting it. However, each contract represents a different number of shares, so order-book prices cannot be compared directly.
Adjust for the number of shares, and the four quotes converge to 109.96–129.53. That 18% spread is the tradable opportunity.
Anthropic IPO Pre-Market Arbitrage: A Complete Plan————
Four markets quote the same asset, with an 18% spread after normalization · Normalize, bet, depth, stop-loss
Anthropic has not gone public yet, but several platforms are already quoting it. However, each contract represents a different number of shares, so order-book prices cannot be compared directly.
Adjust for the number of shares, and the four quotes converge to 109.96–129.53. That 18% spread is the tradable opportunity.
Four markets quote the same asset, with an 18% spread after normalization · Normalize, bet, depth, stop-loss
Anthropic has not gone public yet, but several platforms are already quoting it. However, each contract represents a different number of shares, so order-book prices cannot be compared directly.
Adjust for the number of shares, and the four quotes converge to 109.96–129.53. That 18% spread is the tradable opportunity.
1
1.9k
·
--
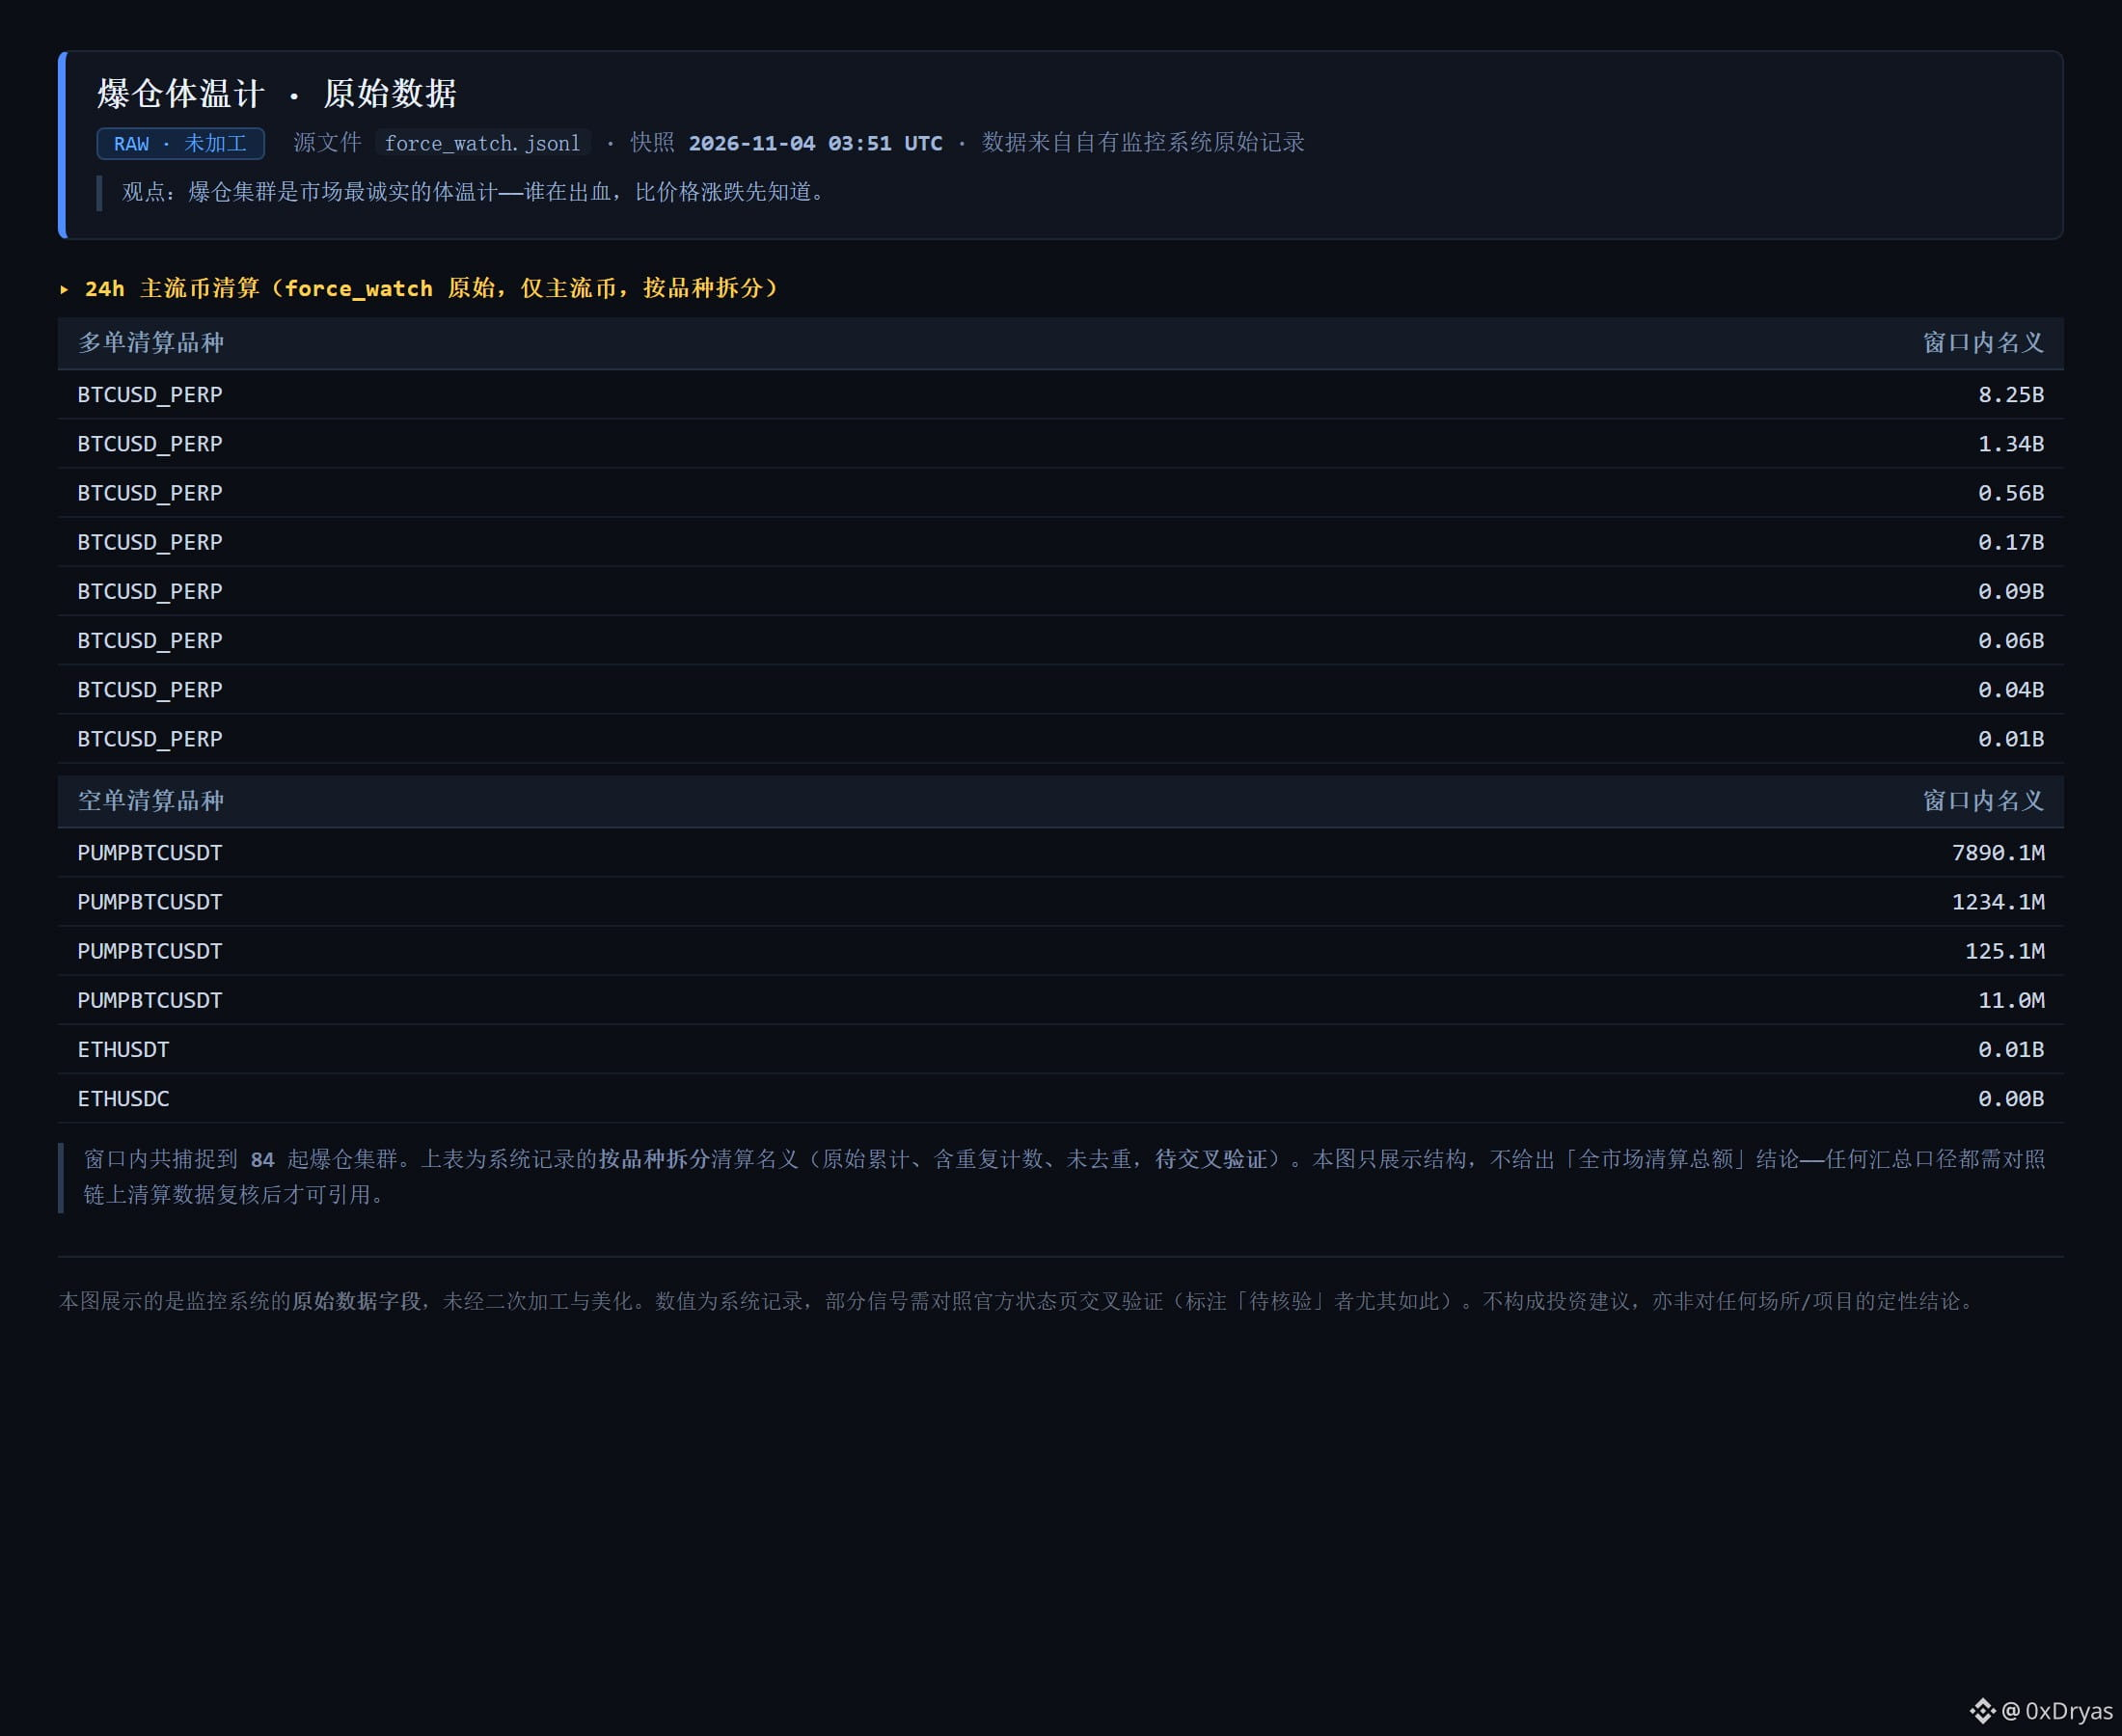
The system detected 84 liquidation clusters in a 24h window. Breakdown by instrument: BTCUSD_PERP had the highest notional value of long liquidations. The chart shows the raw structure broken down by instrument—these are the system’s raw cumulative figures, with duplicate counts and no deduplication, pending cross-validation. I’m not making claims like “total market liquidations.” But the structure itself says enough: you can tell who’s bleeding before you know whether prices are rising or falling.
The system detected 84 liquidation clusters in a 24h window. Breakdown by instrument: BTCUSD_PERP had the highest notional value of long liquidations. The chart shows the raw structure broken down by instrument—these are the system’s raw cumulative figures, with duplicate counts and no deduplication, pending cross-validation. I’m not making claims like “total market liquidations.” But the structure itself says enough: you can tell who’s bleeding before you know whether prices are rising or falling.
298
·
--
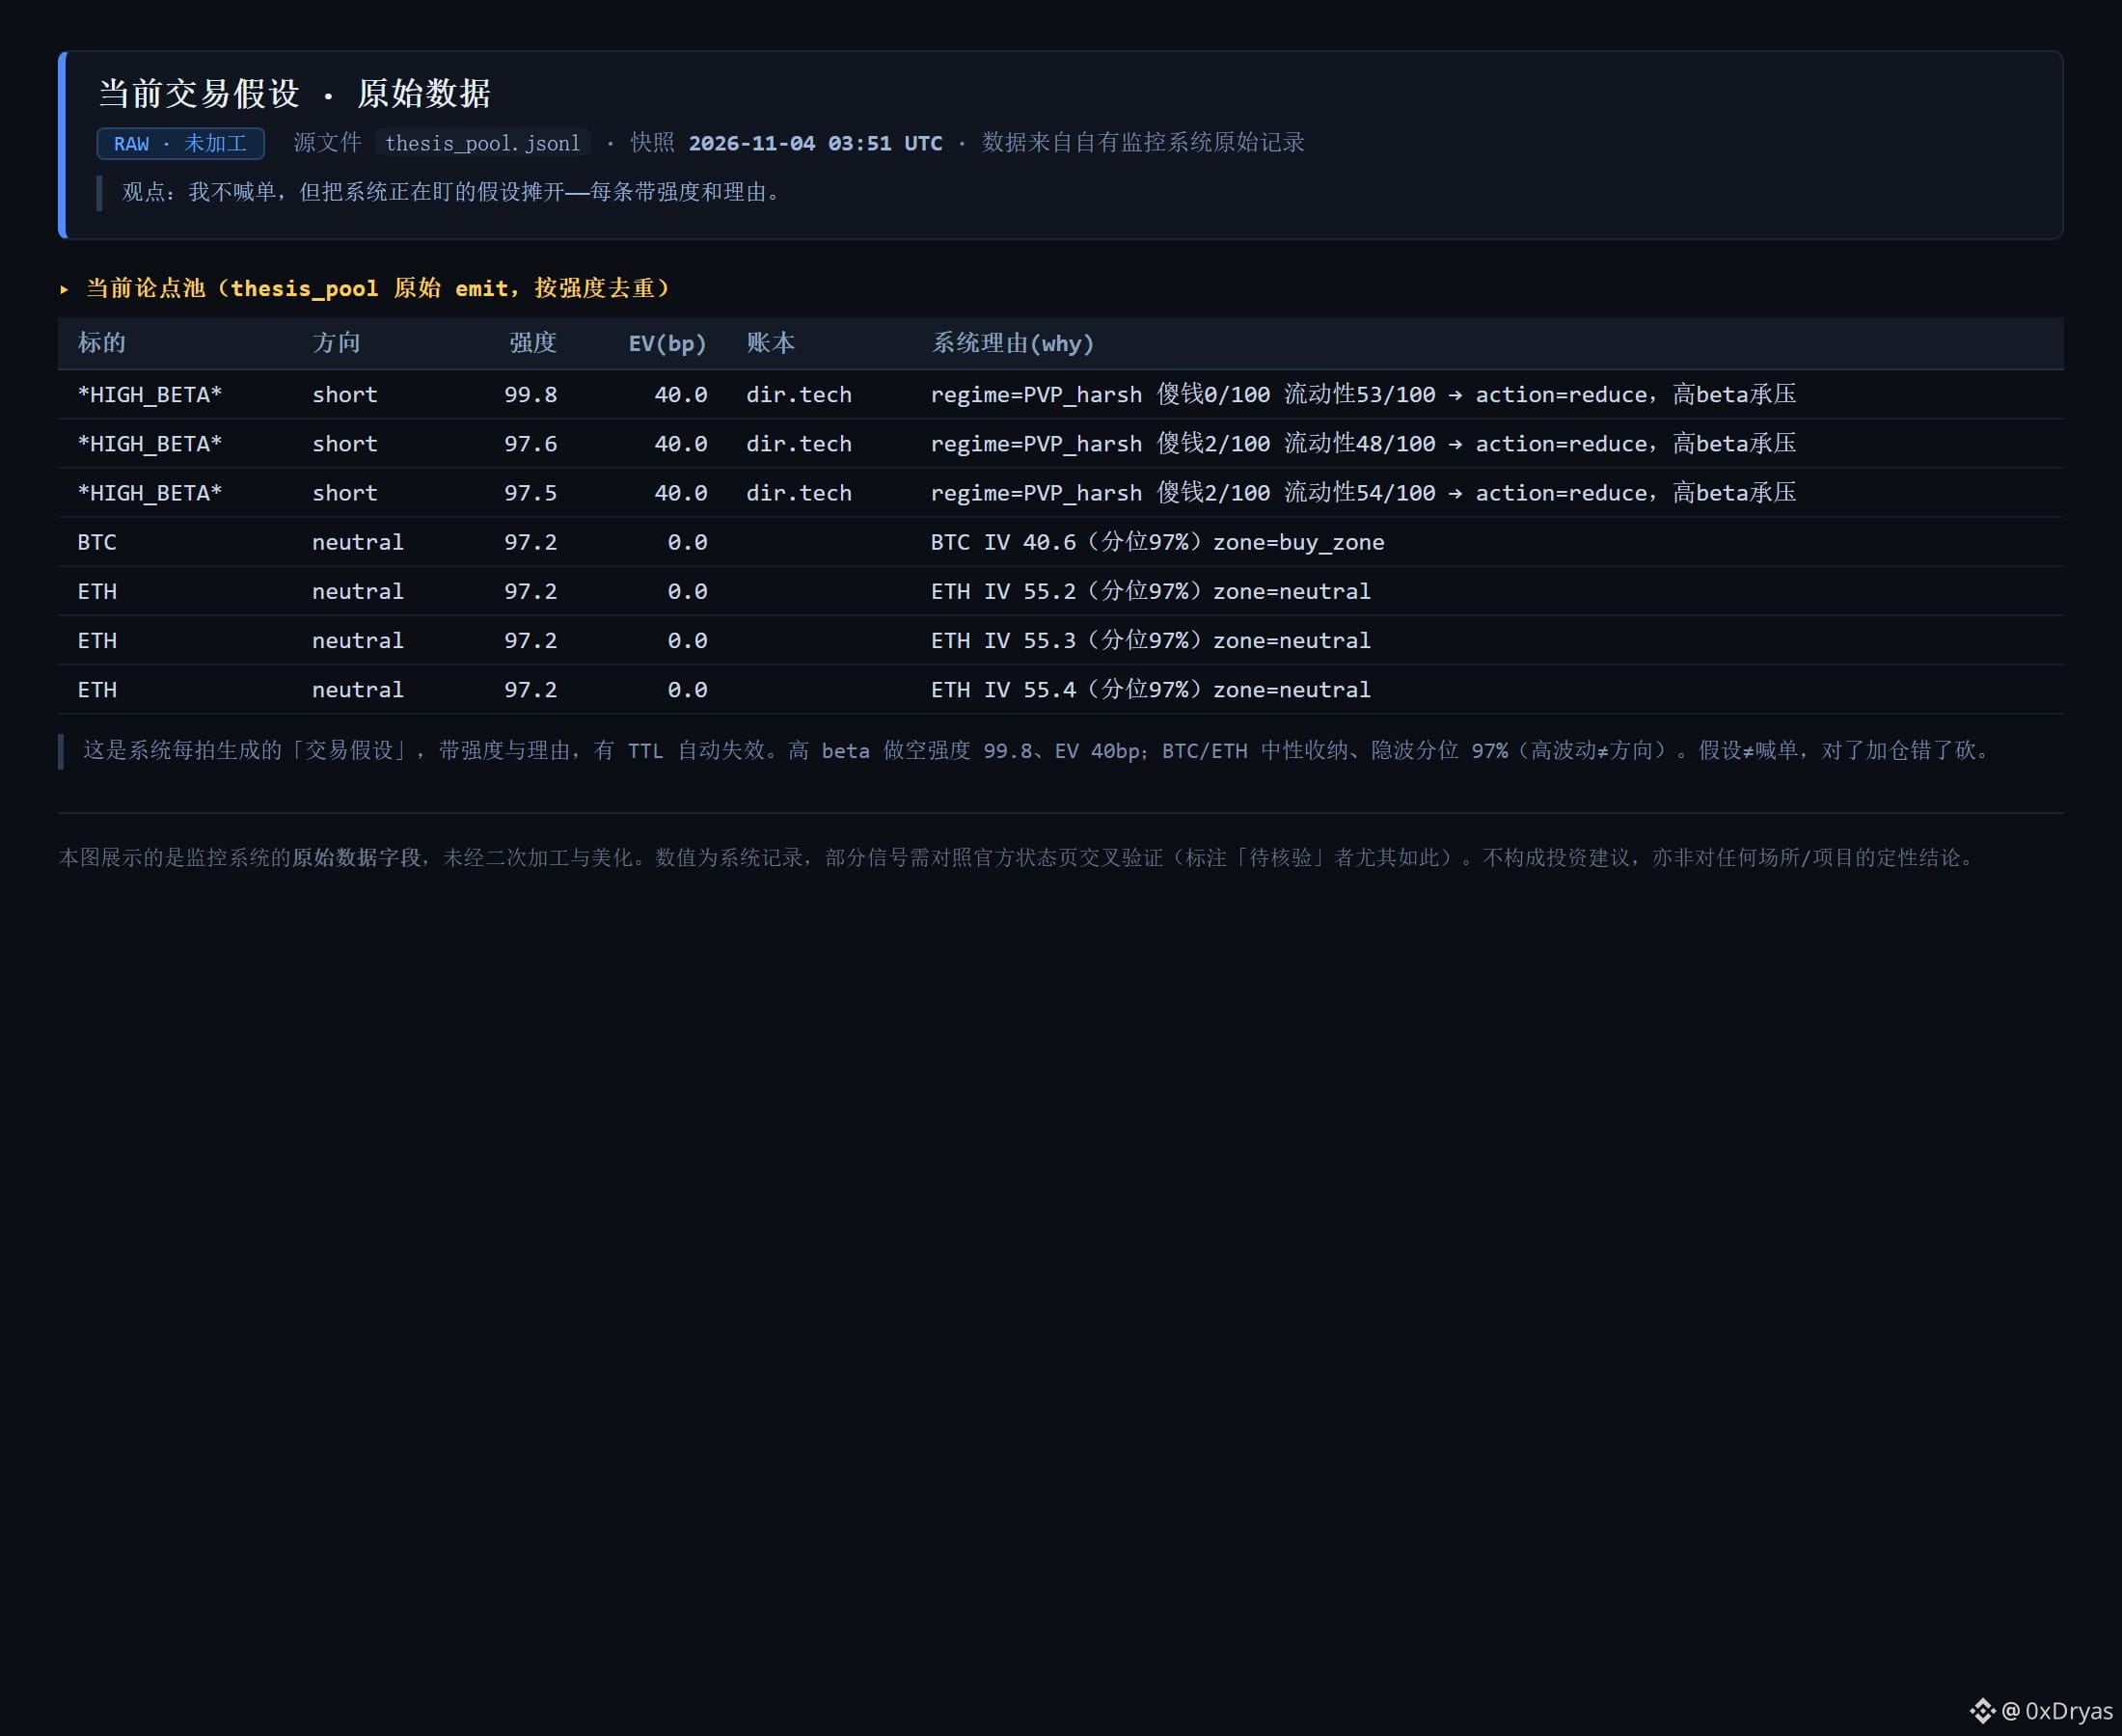
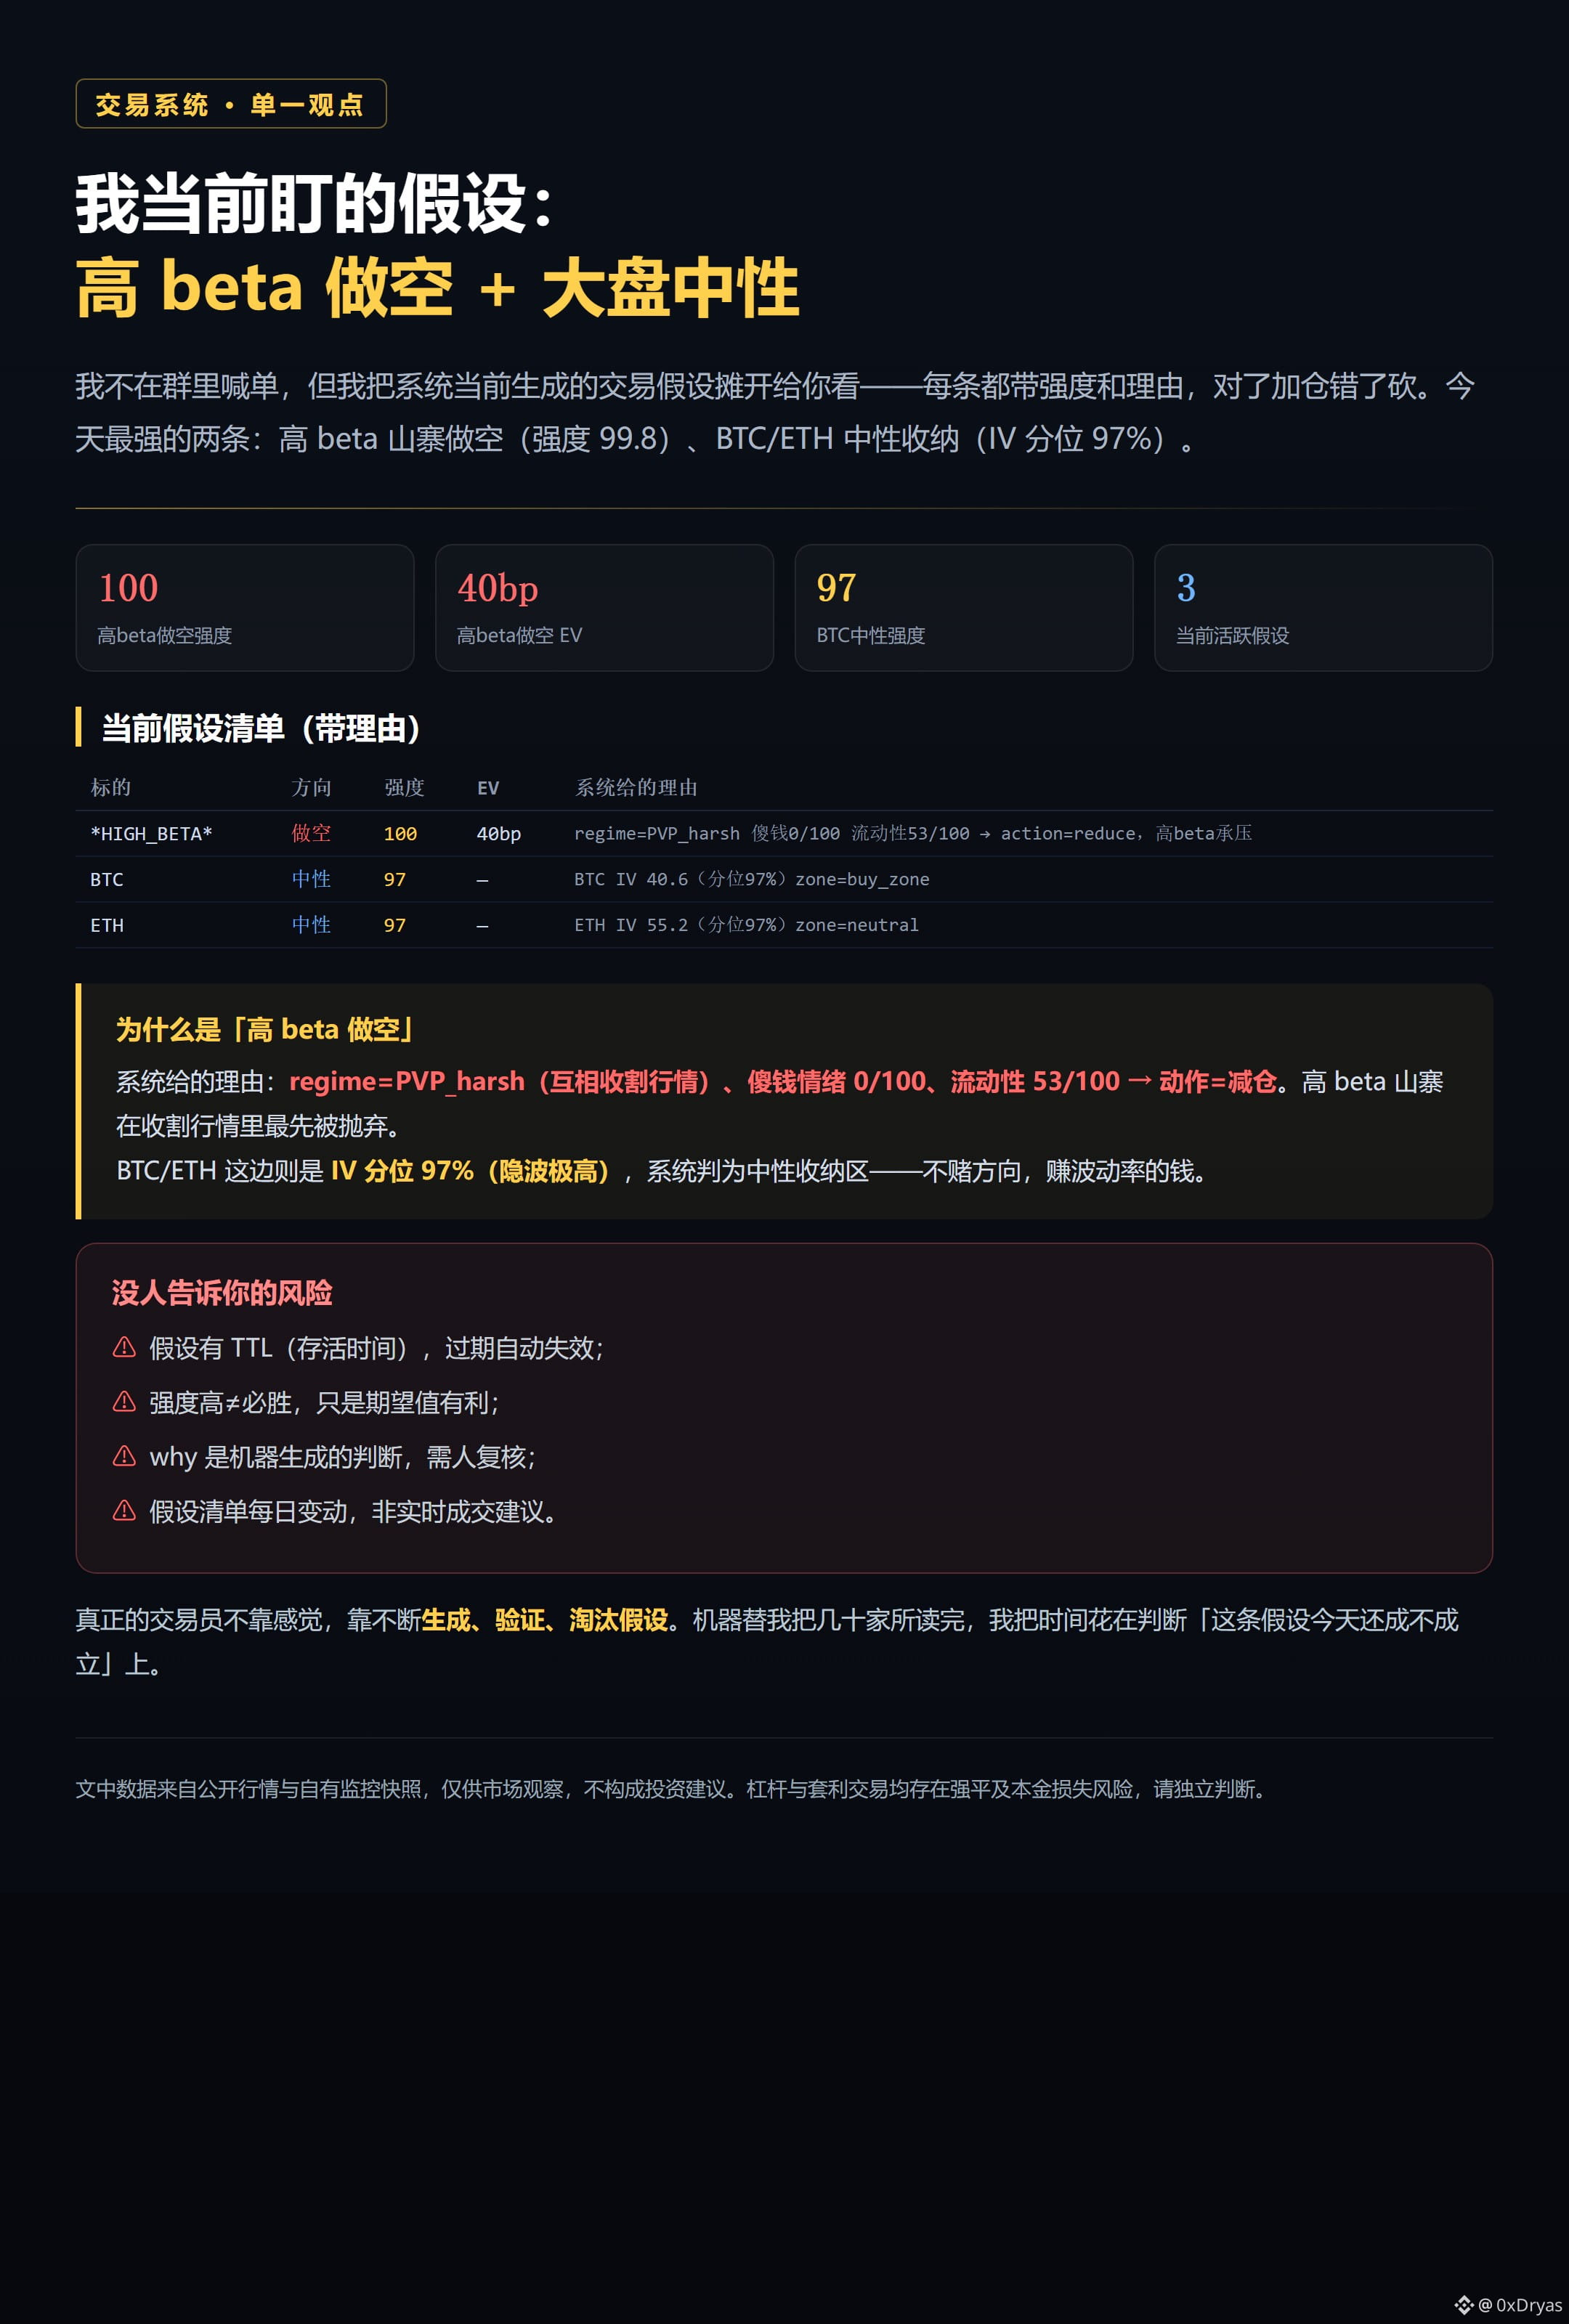
Lay out the assumptions the system is currently tracking: short high-beta altcoins (strength 99.8, EV 40bp, rationale: regime=mutual slaughter, dumb-money sentiment 0/100 → reduce position); neutral BTC/ETH positioning (implied volatility percentile 97%, don’t bet on direction—make money from volatility). Assumptions have TTLs and expire automatically: add when right, cut when wrong.
Lay out the assumptions the system is currently tracking: short high-beta altcoins (strength 99.8, EV 40bp, rationale: regime=mutual slaughter, dumb-money sentiment 0/100 → reduce position); neutral BTC/ETH positioning (implied volatility percentile 97%, don’t bet on direction—make money from volatility). Assumptions have TTLs and expire automatically: add when right, cut when wrong.
251
·
--
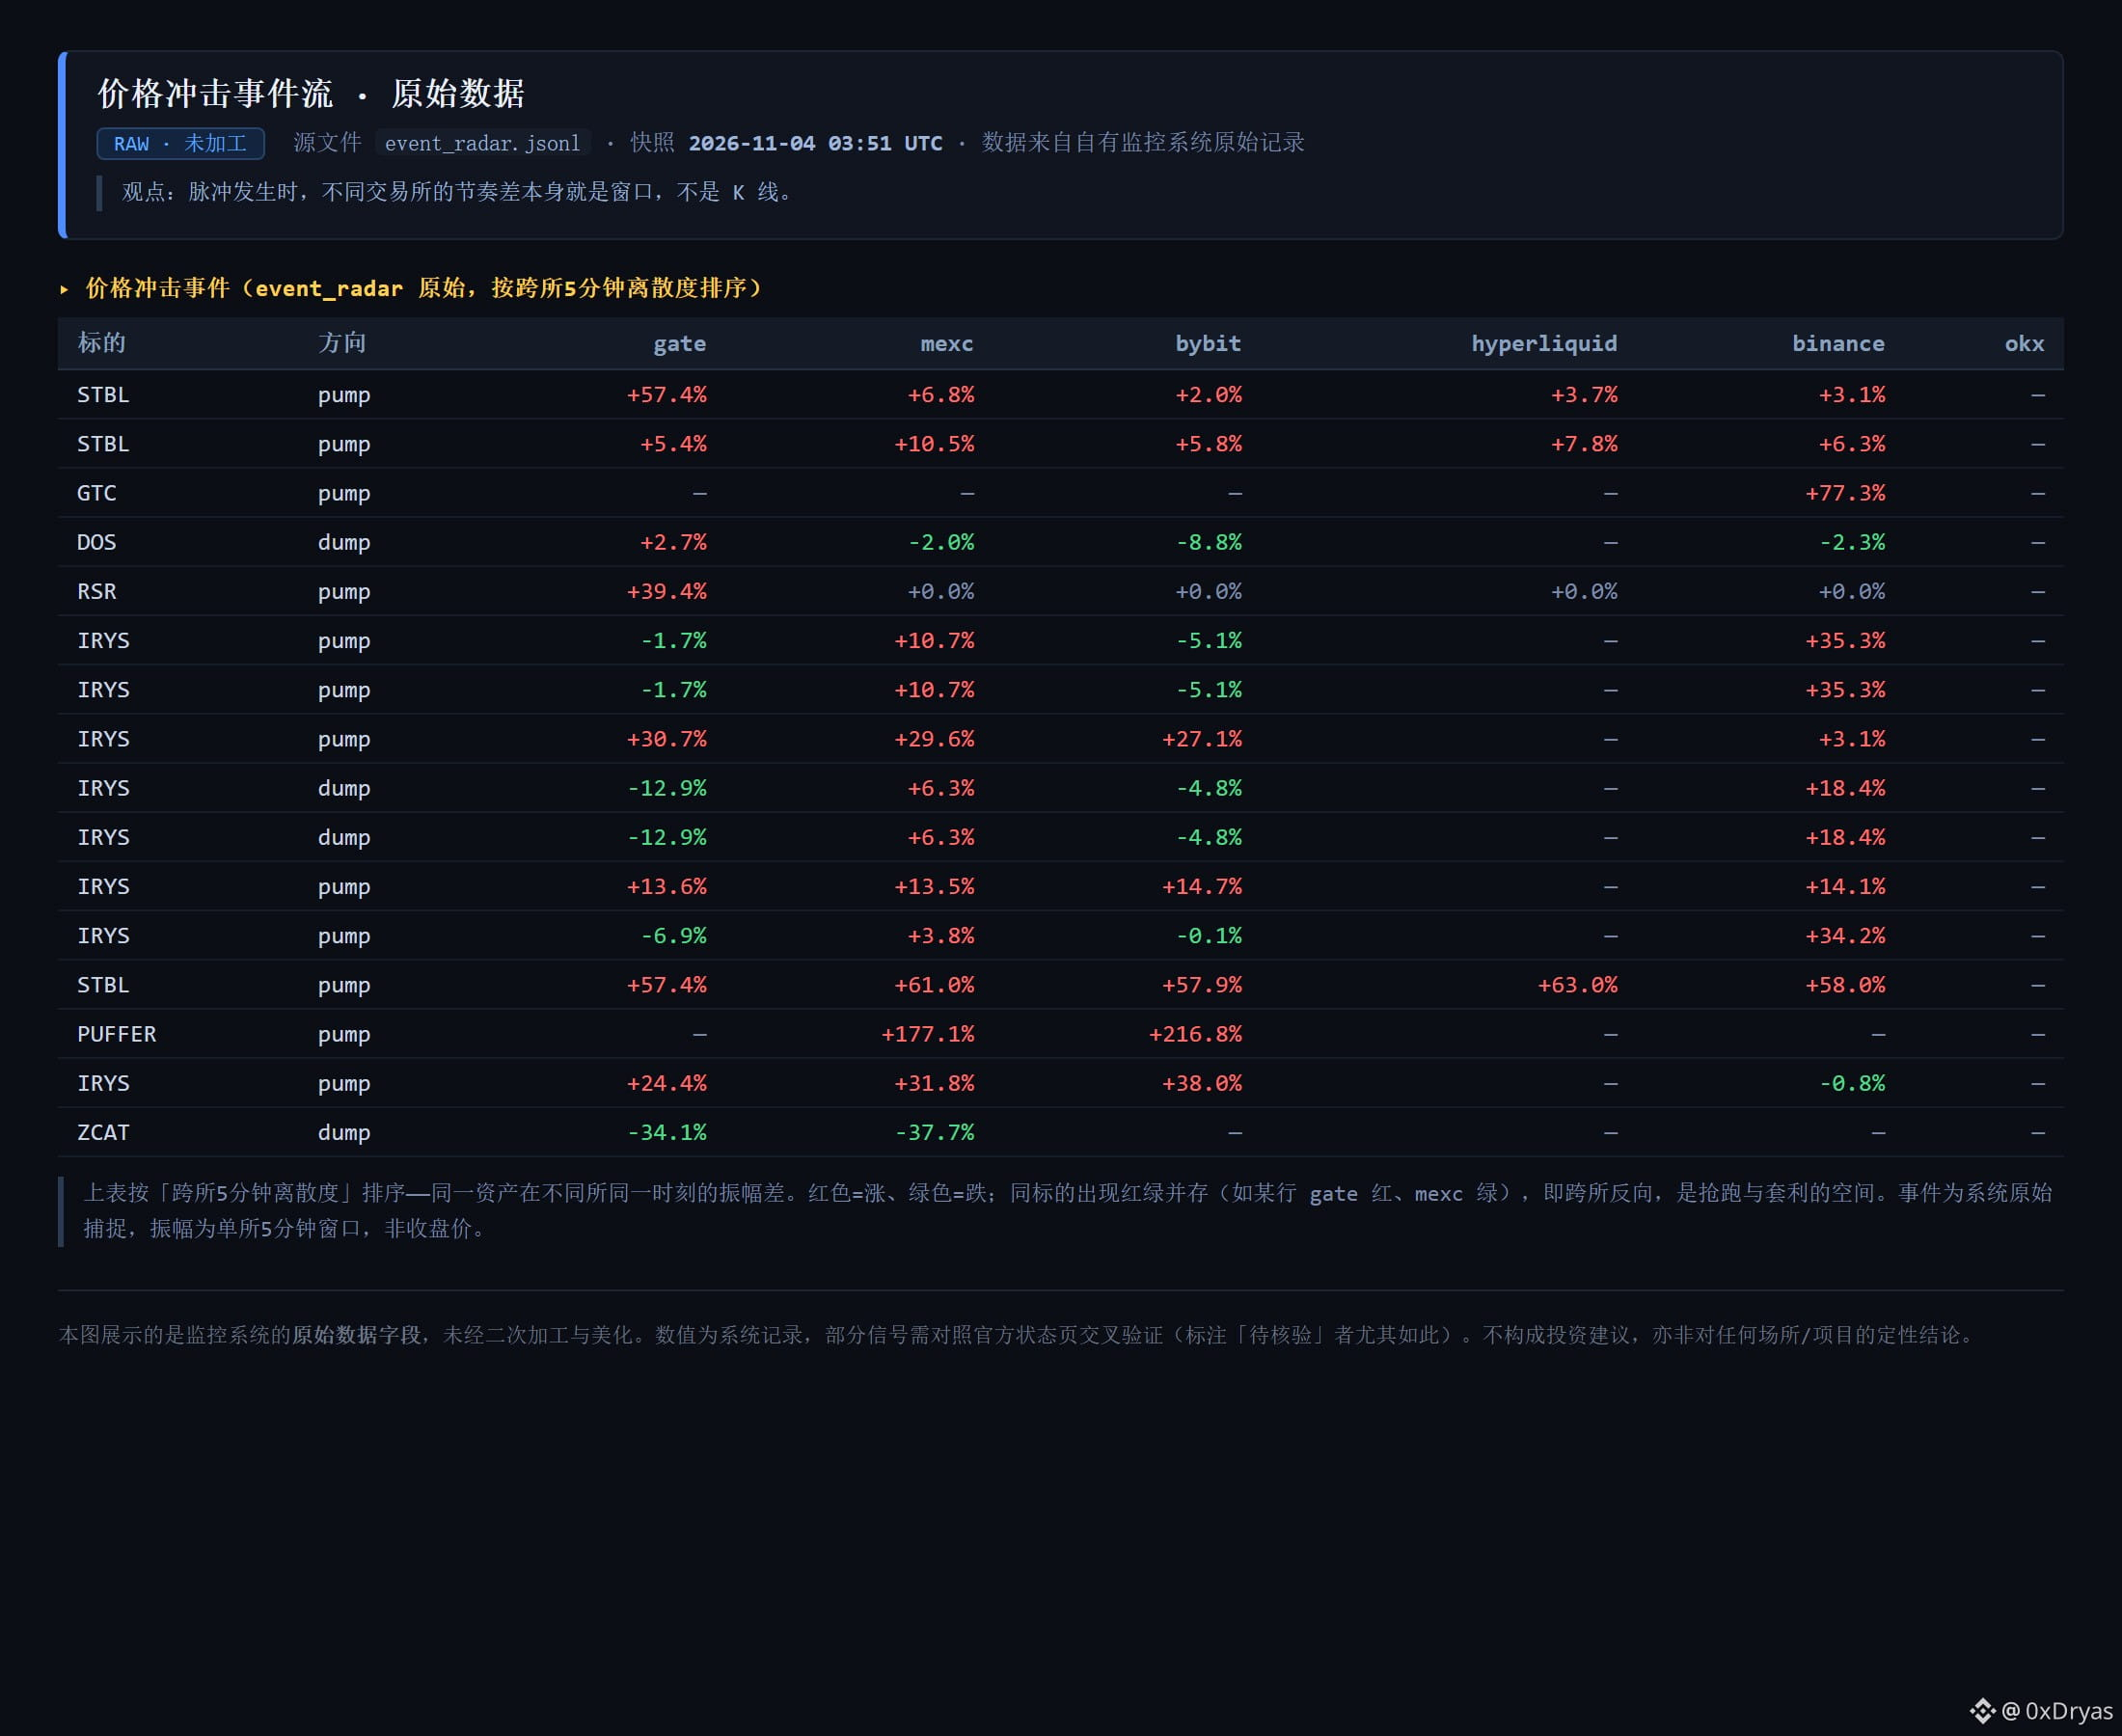
Many people chase pumps and dump on dips by watching candlestick charts; I pay more attention to differences in timing across exchanges. The system ranked them by “5-minute cross-exchange dispersion”: the same asset rising on gate while falling on mexc at the same time (for example, at one point IRYS was up 31.8% on mexc while down 0.8% on binance). This mix of red and green is where front-running and arbitrage opportunities arise.
Many people chase pumps and dump on dips by watching candlestick charts; I pay more attention to differences in timing across exchanges. The system ranked them by “5-minute cross-exchange dispersion”: the same asset rising on gate while falling on mexc at the same time (for example, at one point IRYS was up 31.8% on mexc while down 0.8% on binance). This mix of red and green is where front-running and arbitrage opportunities arise.
713
·
--
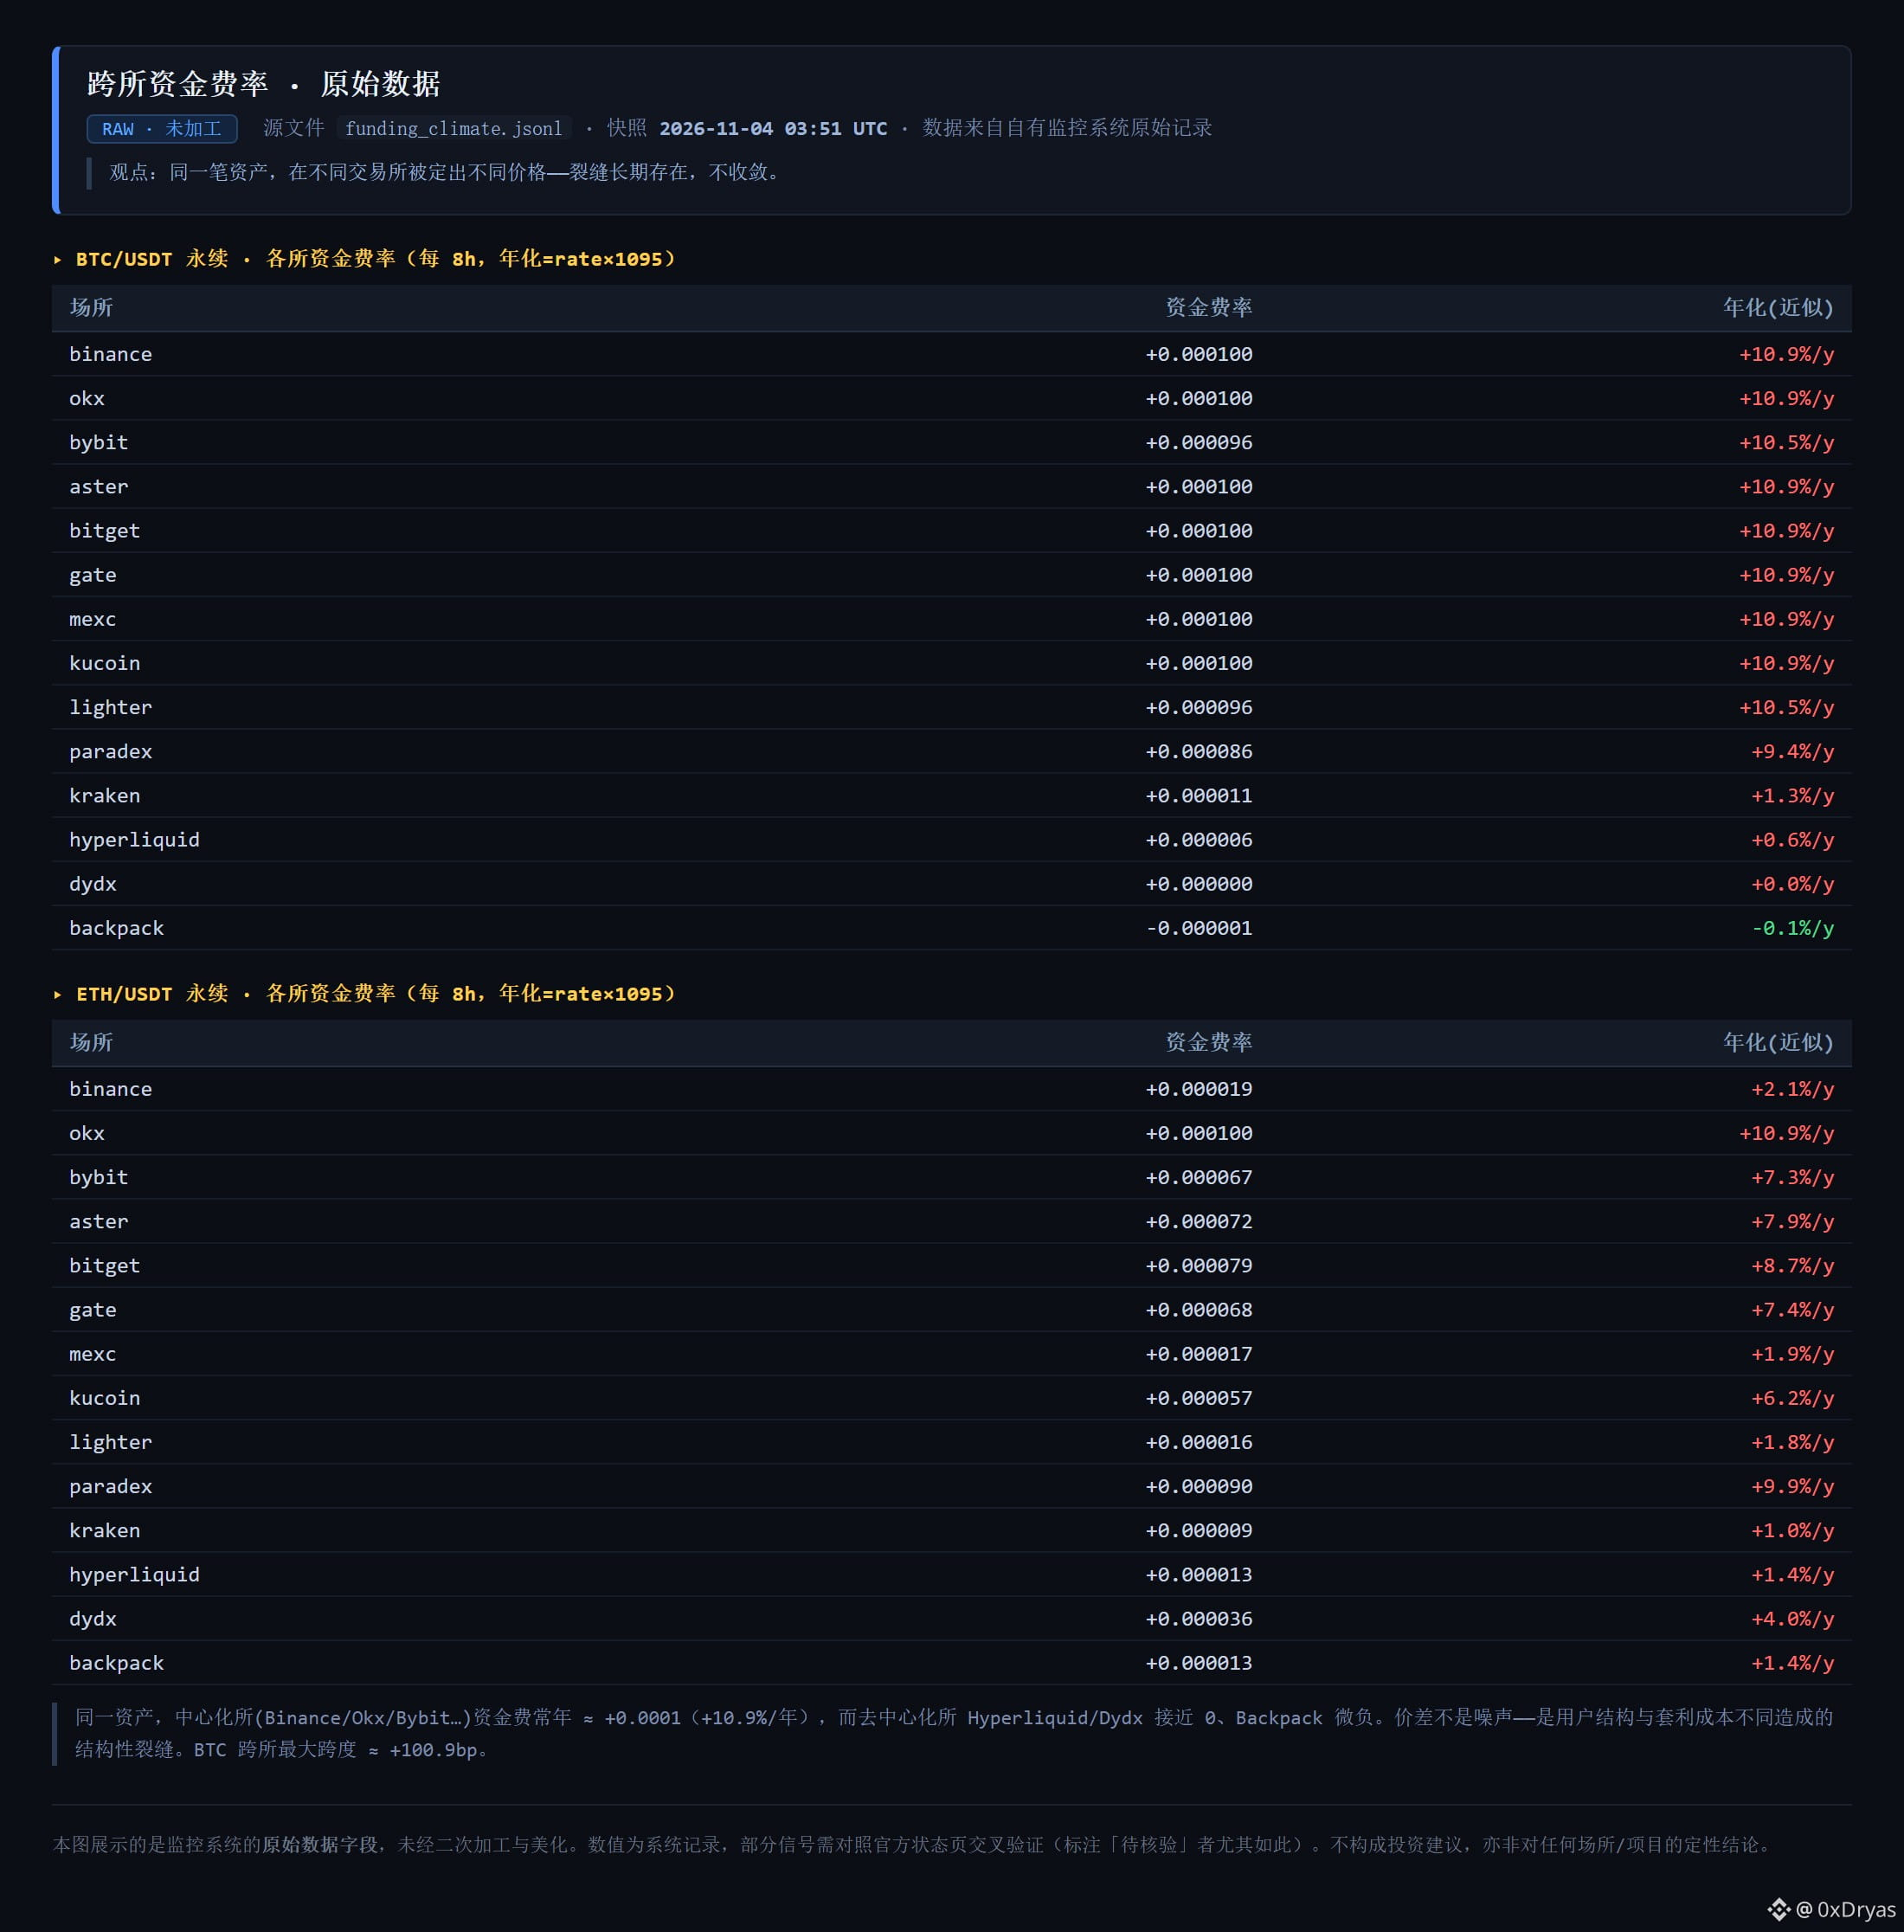
Compare BTC perpetual funding rates side by side: Binance/OKX/Bybit/Bitget/Gate/MEXC are all at +0.0001 (about +10.9% annualized), while Hyperliquid is at +0.000006, dYdX is near zero, and Backpack is slightly negative. The same asset, at the same moment, with a dozen different quotes. This isn’t noise—it’s a structural gap caused by differences in user composition and arbitrage costs. Cross-exchange positions can’t be rebalanced instantly, so the gap persists.
Compare BTC perpetual funding rates side by side: Binance/OKX/Bybit/Bitget/Gate/MEXC are all at +0.0001 (about +10.9% annualized), while Hyperliquid is at +0.000006, dYdX is near zero, and Backpack is slightly negative. The same asset, at the same moment, with a dozen different quotes. This isn’t noise—it’s a structural gap caused by differences in user composition and arbitrage costs. Cross-exchange positions can’t be rebalanced instantly, so the gap persists.
253
·
--
Today’s two strongest setups: ① Short high-beta altcoins, strength 99.8, EV 40 bp. System rationale: regime=PVP_harsh (a market where participants prey on each other), dumb-money sentiment 0/100, liquidity 53/100 → reduce position size;
② Neutral BTC/ETH positioning, IV percentile 97% (implied volatility is extremely high). Don’t bet on direction; profit from volatility.
(Assuming a TTL is in place, the setup expires automatically; high strength does not mean a guaranteed win.)
Today’s two strongest setups: ① Short high-beta altcoins, strength 99.8, EV 40 bp. System rationale: regime=PVP_harsh (a market where participants prey on each other), dumb-money sentiment 0/100, liquidity 53/100 → reduce position size;
② Neutral BTC/ETH positioning, IV percentile 97% (implied volatility is extremely high). Don’t bet on direction; profit from volatility.
(Assuming a TTL is in place, the setup expires automatically; high strength does not mean a guaranteed win.)
② Neutral BTC/ETH positioning, IV percentile 97% (implied volatility is extremely high). Don’t bet on direction; profit from volatility.
(Assuming a TTL is in place, the setup expires automatically; high strength does not mean a guaranteed win.)
284
·
--
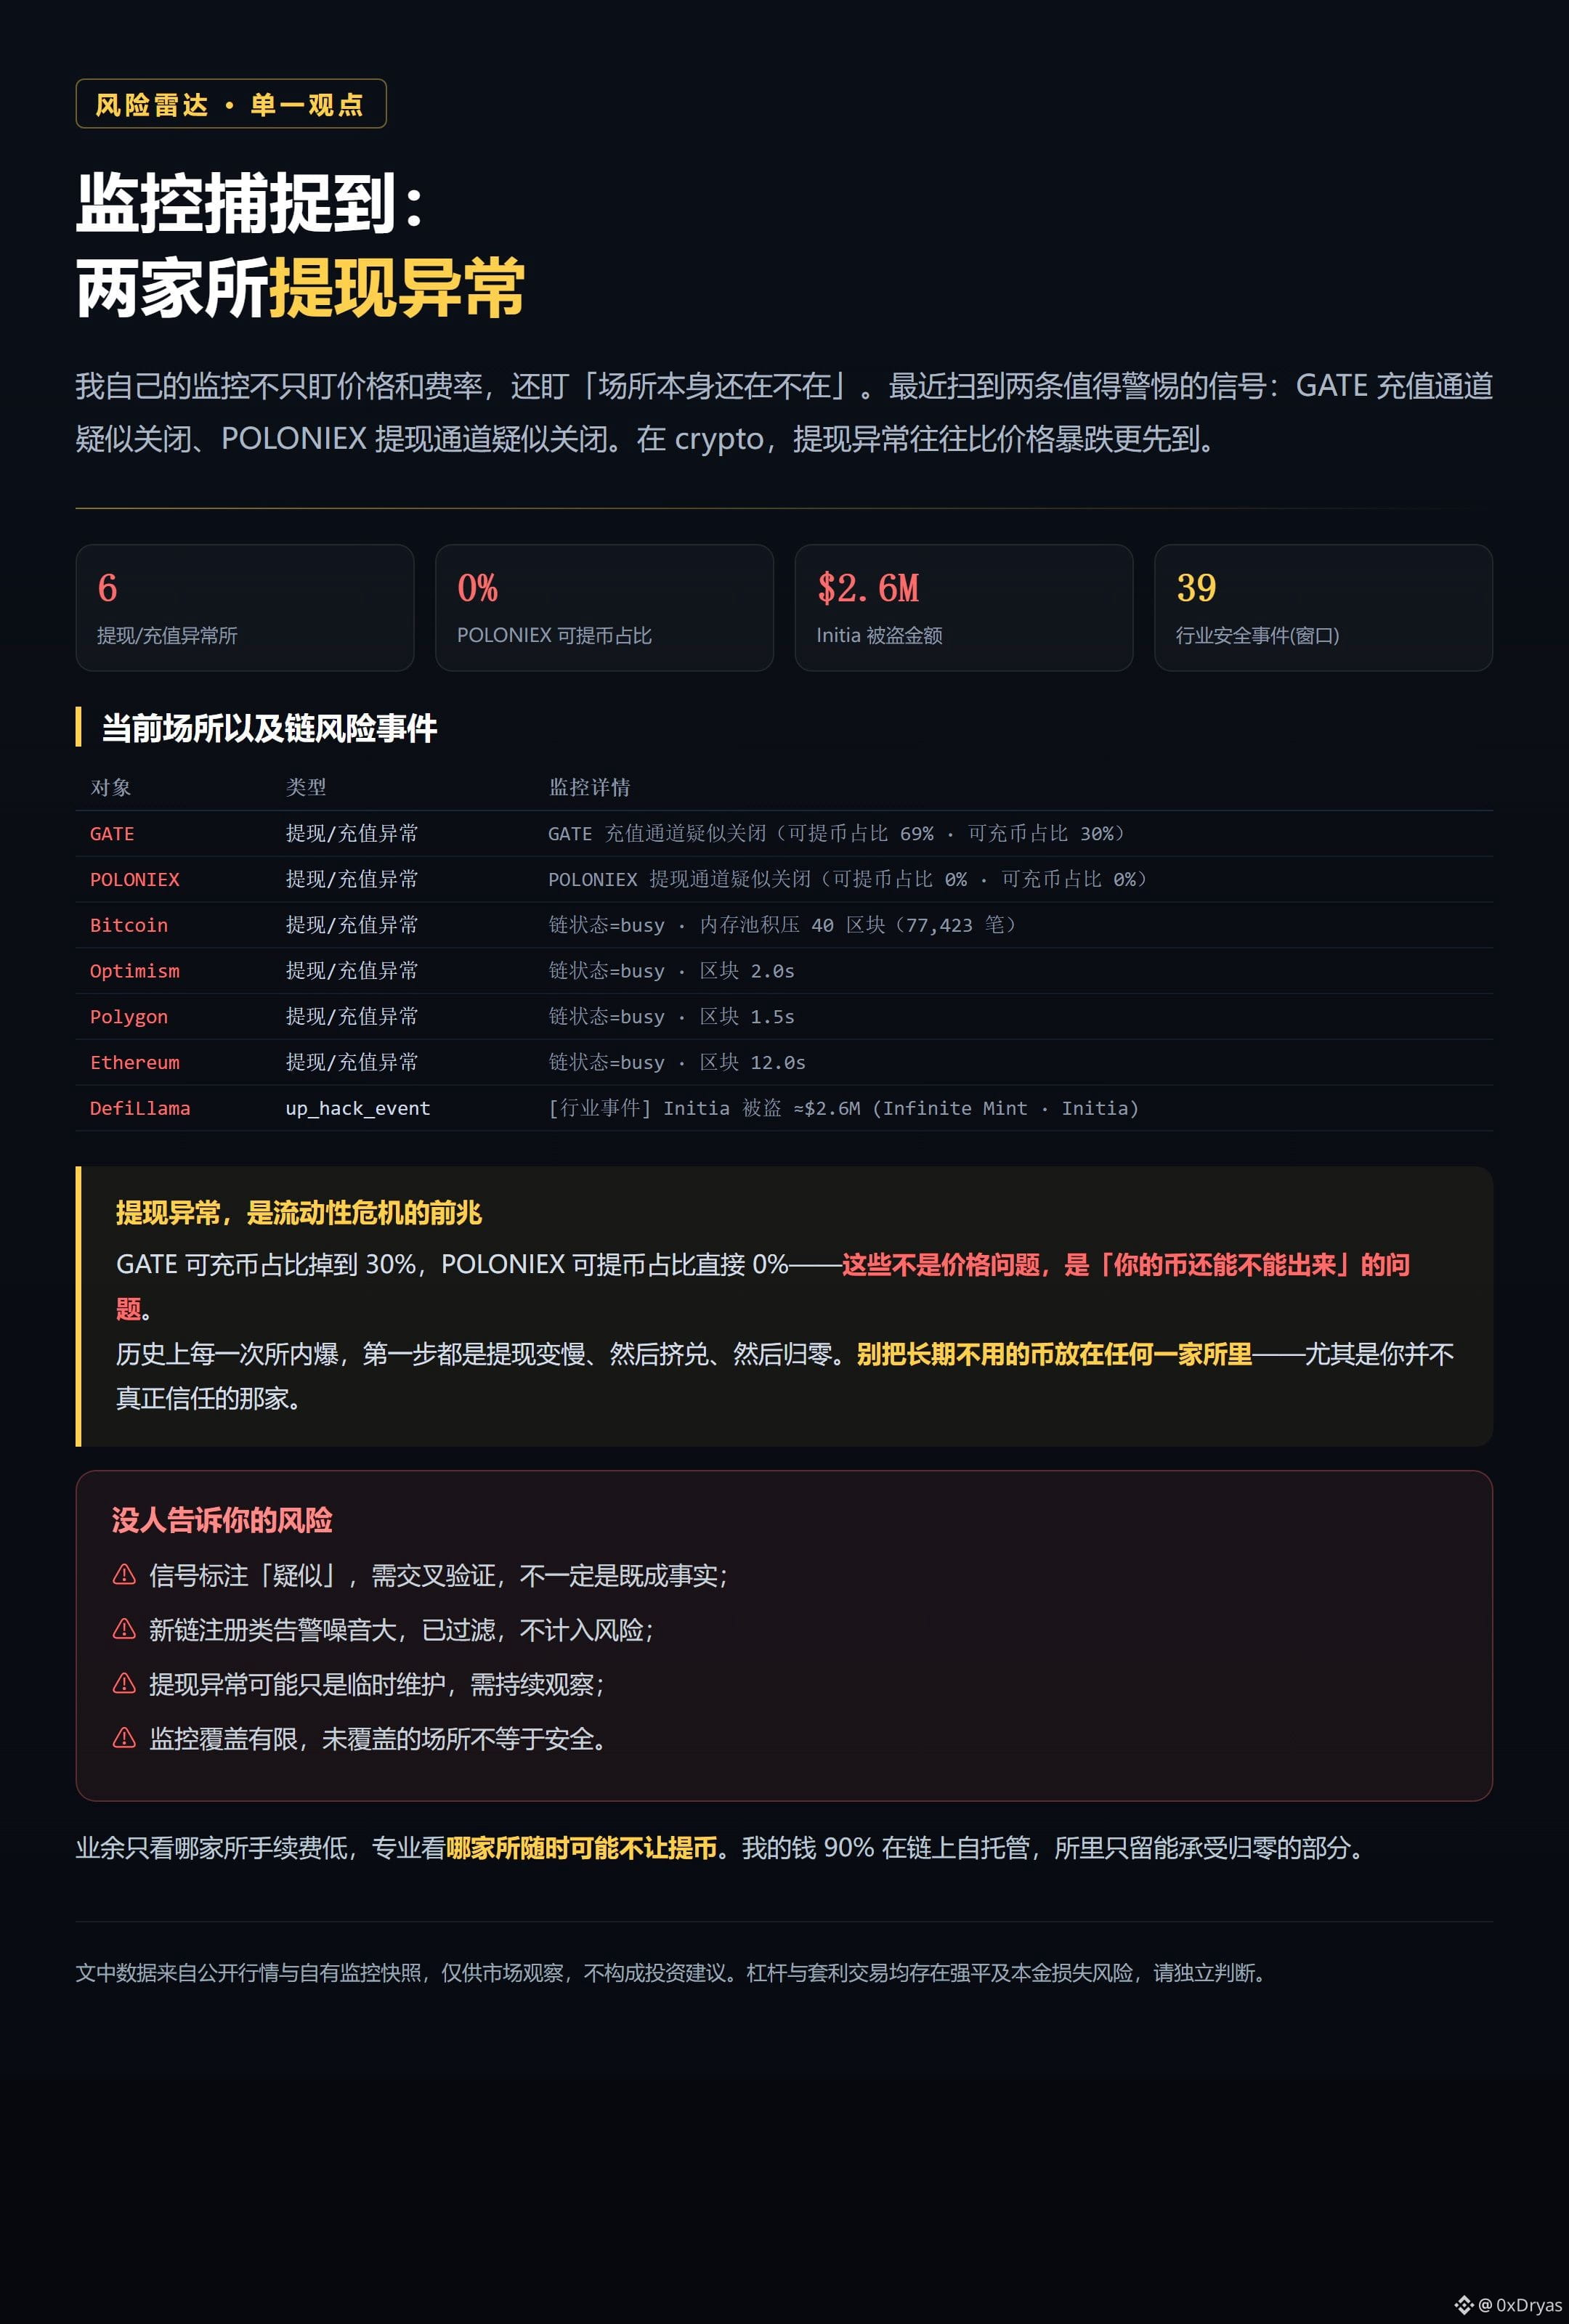
Two warning signs have emerged: GATE’s deposit channel may be closed (the share of coins available for deposit has fallen to 30%), and POLONIEX’s withdrawal channel may be closed (the share of coins available for withdrawal has dropped straight to 0%).
In the same period, around $2.6 million was stolen from Initia. In crypto, withdrawal problems often show up before a price crash—historically, every exchange collapse has followed the same pattern: withdrawals slow down, then a bank run begins, and then everything goes to zero.
Two warning signs have emerged: GATE’s deposit channel may be closed (the share of coins available for deposit has fallen to 30%), and POLONIEX’s withdrawal channel may be closed (the share of coins available for withdrawal has dropped straight to 0%).
In the same period, around $2.6 million was stolen from Initia. In crypto, withdrawal problems often show up before a price crash—historically, every exchange collapse has followed the same pattern: withdrawals slow down, then a bank run begins, and then everything goes to zero.
In the same period, around $2.6 million was stolen from Initia. In crypto, withdrawal problems often show up before a price crash—historically, every exchange collapse has followed the same pattern: withdrawals slow down, then a bank run begins, and then everything goes to zero.
3
2.4k
·
--
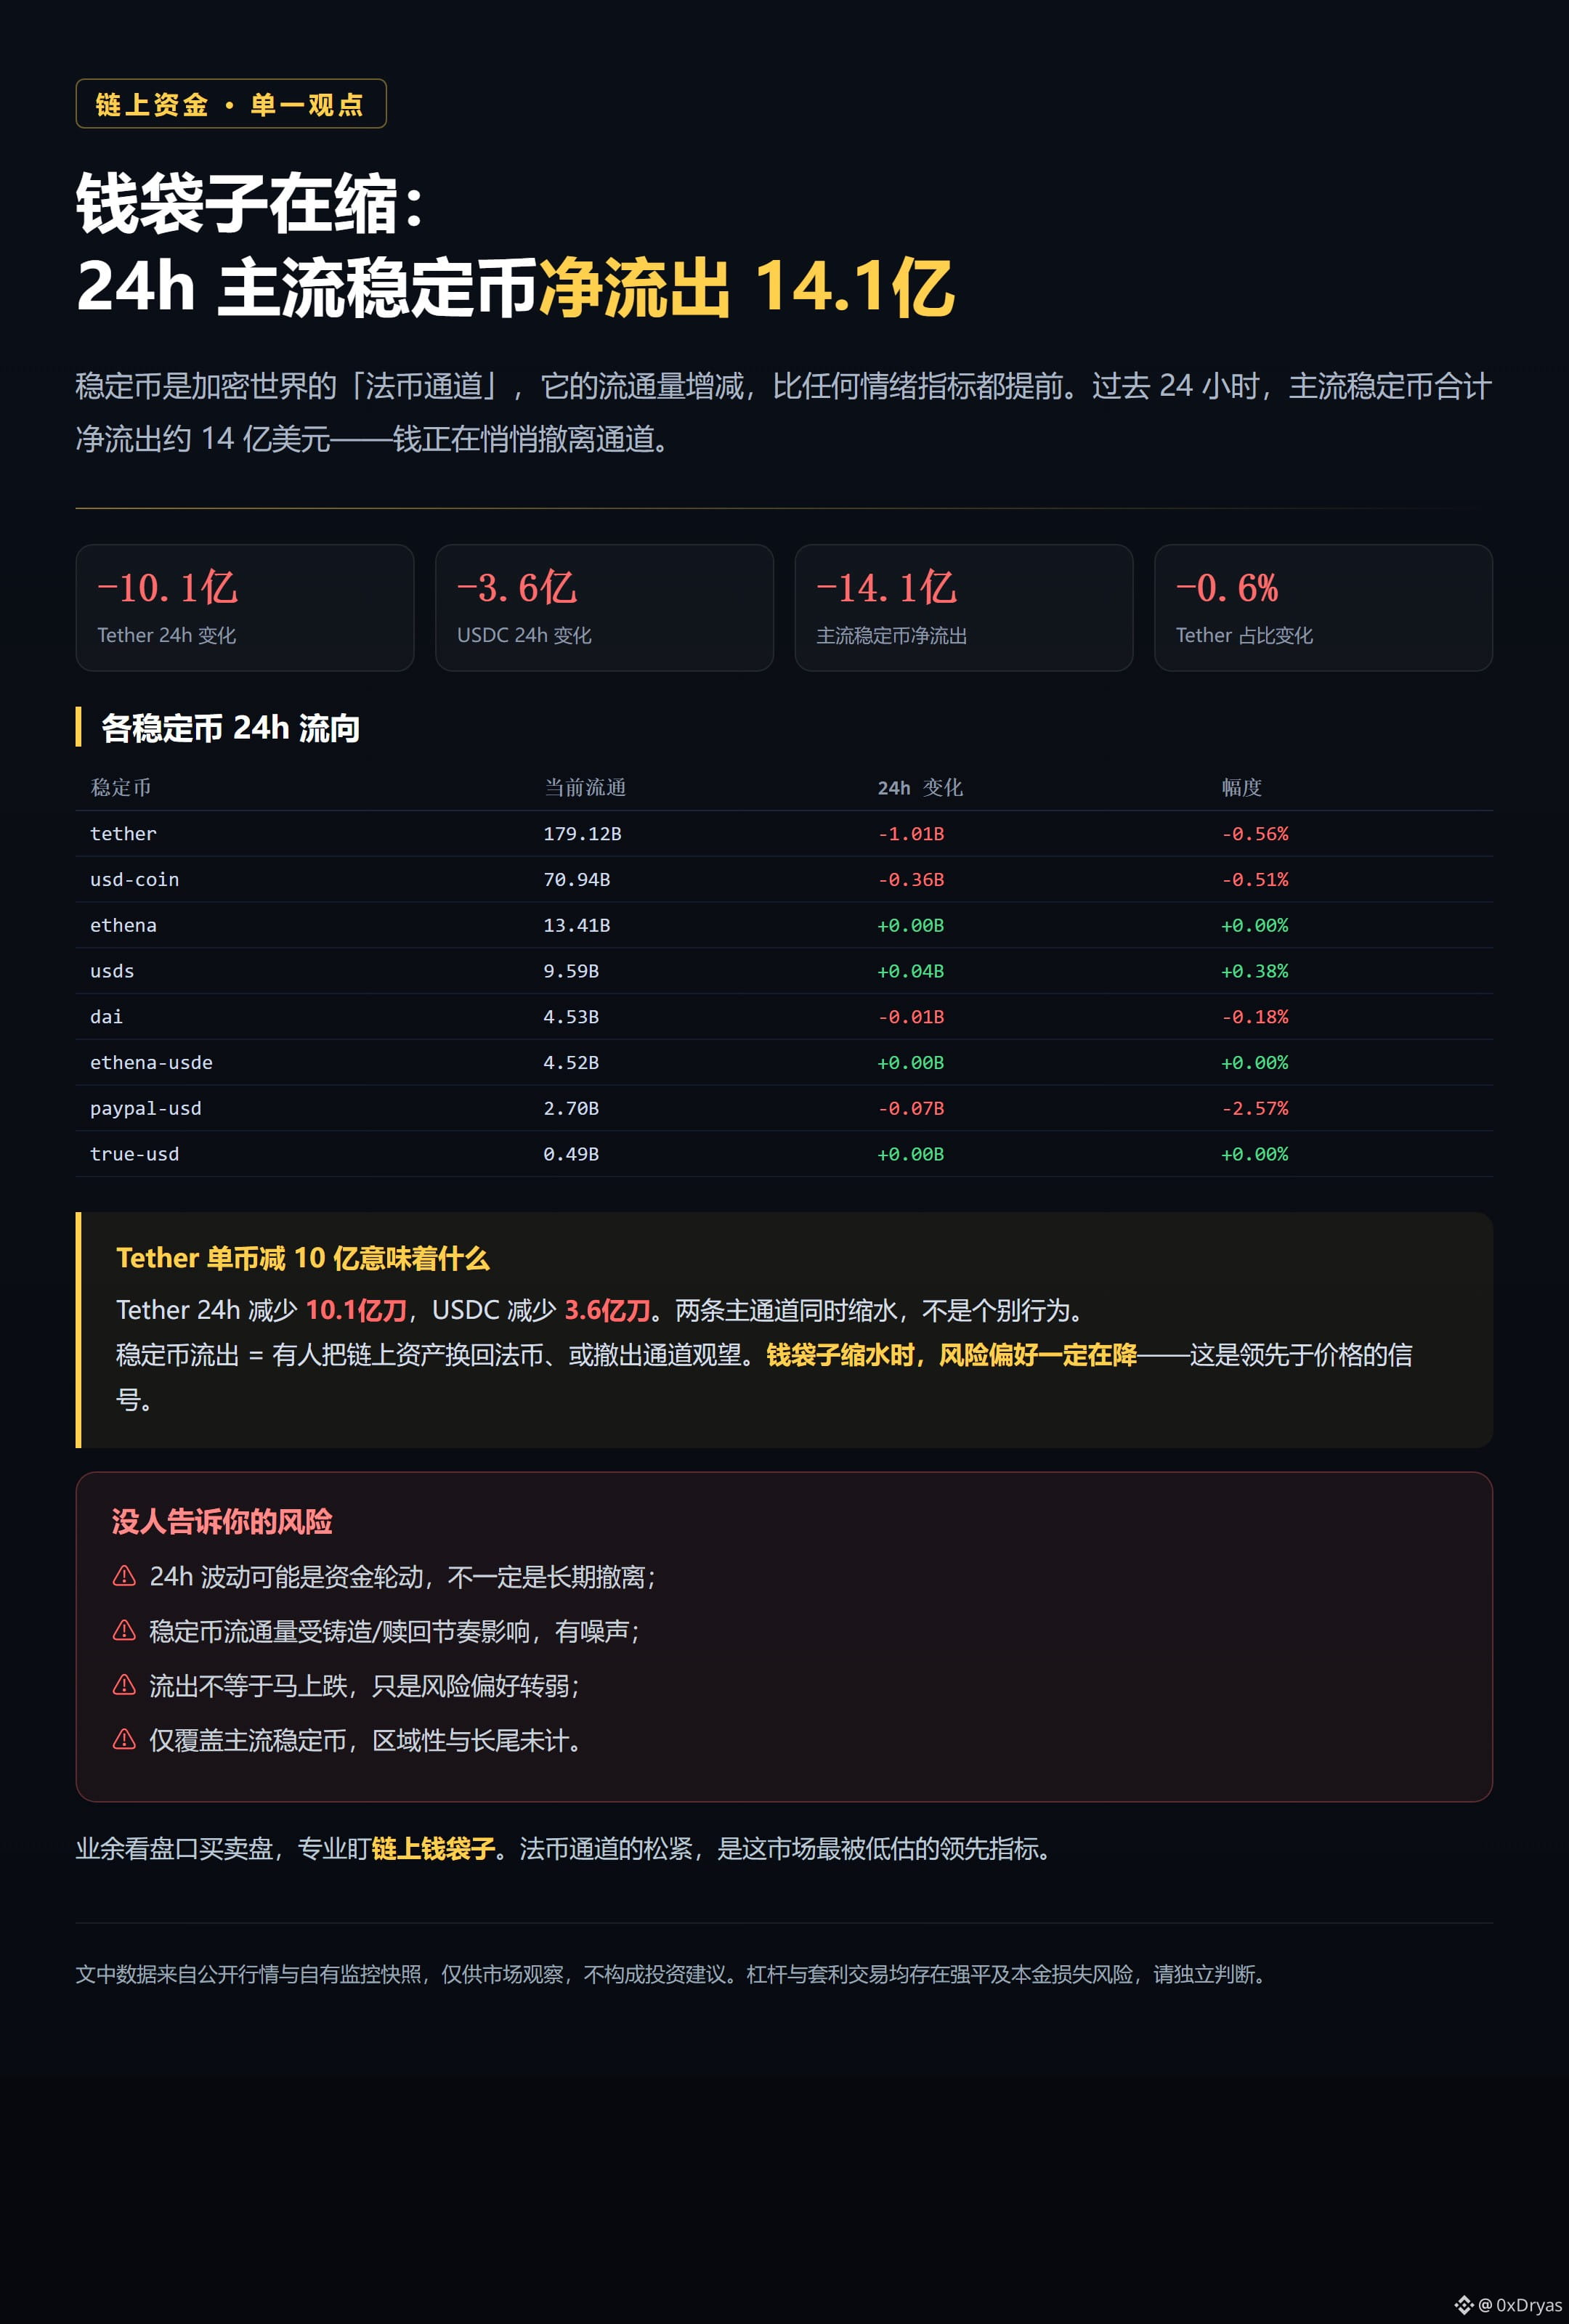
Stablecoins are the fiat on-ramps of the crypto world, and changes in their circulating supply move ahead of any sentiment indicator.
Over the past 24 hours, major stablecoins saw combined net outflows of about $1.4 billion: Tether was down $1 billion and USDC $360 million. The two main channels are shrinking at the same time—not as isolated events.
When wallets shrink, risk appetite is definitely falling—that’s a signal that leads price. Amateurs watch the bids and asks in the order book; professionals track on-chain wallets.
Stablecoins are the fiat on-ramps of the crypto world, and changes in their circulating supply move ahead of any sentiment indicator.
Over the past 24 hours, major stablecoins saw combined net outflows of about $1.4 billion: Tether was down $1 billion and USDC $360 million. The two main channels are shrinking at the same time—not as isolated events.
When wallets shrink, risk appetite is definitely falling—that’s a signal that leads price. Amateurs watch the bids and asks in the order book; professionals track on-chain wallets.
Over the past 24 hours, major stablecoins saw combined net outflows of about $1.4 billion: Tether was down $1 billion and USDC $360 million. The two main channels are shrinking at the same time—not as isolated events.
When wallets shrink, risk appetite is definitely falling—that’s a signal that leads price. Amateurs watch the bids and asks in the order book; professionals track on-chain wallets.
55
·
--
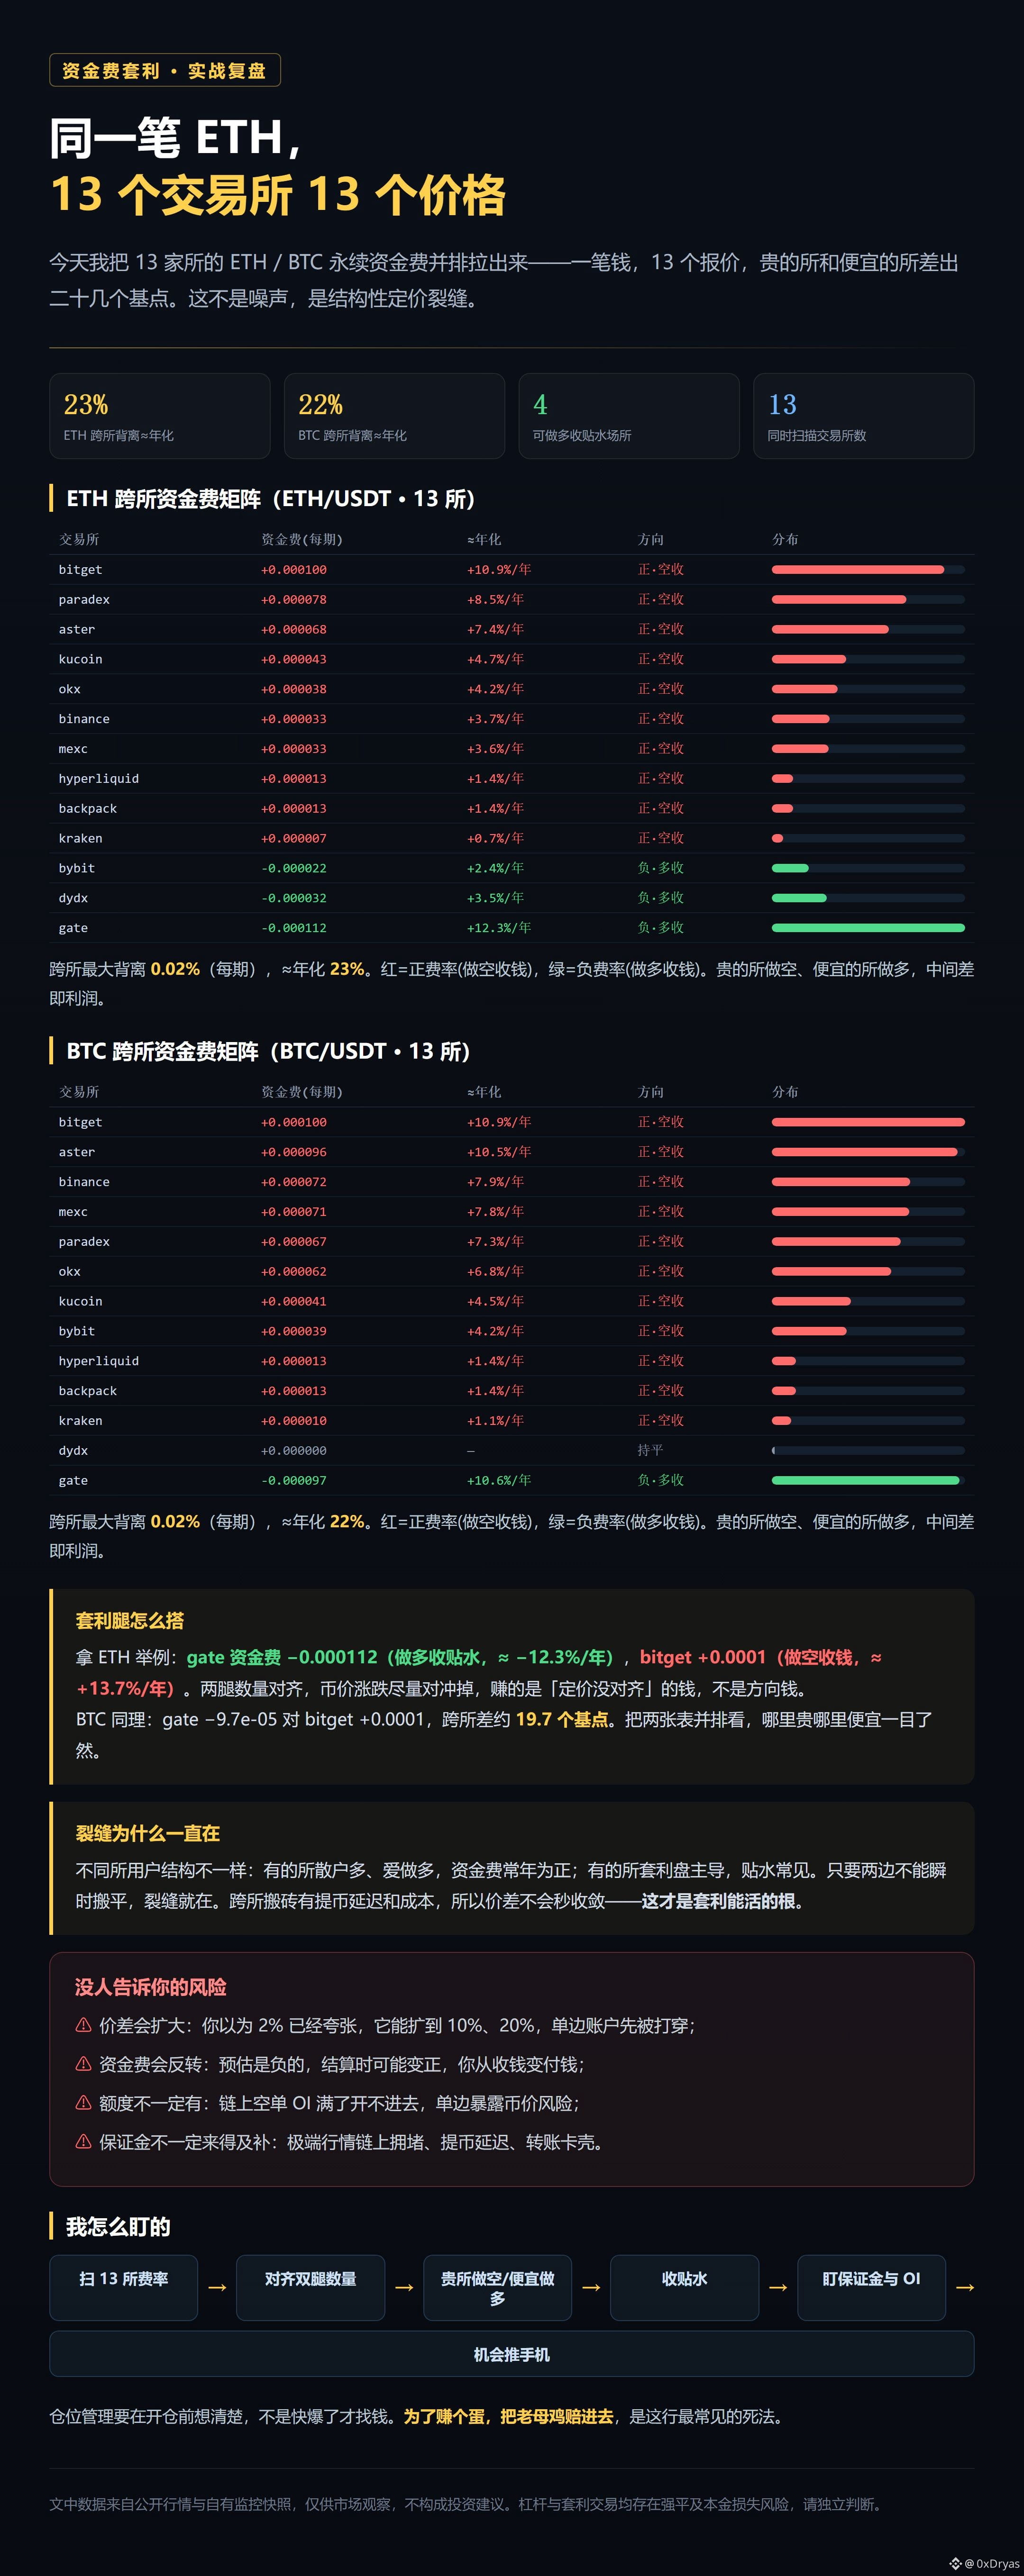
Today I lined up the ETH perpetual funding rates across 13 exchanges. One asset, 13 quotes—gate is −0.000112 (longs collect the discount, ≈−12.3%/year), while bitget is +0.0001 (shorts get paid, ≈+13.7%/year). The gap is more than twenty basis points. That’s not noise; it’s a structural crack.
What are funding rates? Perpetuals use them to keep the contract price close to spot. A positive rate means longs pay shorts; a negative rate means shorts pay longs. I focus on the latter: go long where the rate is persistently negative and collect, and go short where it’s positive and pay. Keep the two legs balanced and hedge out as much of the coin’s price movement as possible—you’re making money from “misaligned pricing,” not from betting on direction.
Why does the crack persist? User bases differ across exchanges: some have more retail traders who like going long, so rates are positive year-round; others are dominated by arbitrage traders, so discounts are common. As long as the gap can’t be closed instantly, it remains. Moving assets between exchanges takes time and costs money, so the spread won’t converge in a second—that’s exactly why this arbitrage can survive.
The most underestimated risks: the spread can widen (you think 2% is extreme, but it can reach 20%); funding rates can reverse (an expected negative settlement turns positive, so you go from collecting to paying); capacity may not be available (if short OI on the exchange is maxed out, you can’t open a position); and you may not be able to top up margin in time. Losing the hen that lays the eggs just to make a few pennies is one of the most common ways to die in this business.
This monitoring system runs on my own machine, scanning more than a dozen exchanges 24/7 and sending alerts straight to my phone when an opportunity appears. No need to watch the charts all day, but when an extreme divergence shows up, I’m a step ahead of most people.
Today I lined up the ETH perpetual funding rates across 13 exchanges. One asset, 13 quotes—gate is −0.000112 (longs collect the discount, ≈−12.3%/year), while bitget is +0.0001 (shorts get paid, ≈+13.7%/year). The gap is more than twenty basis points. That’s not noise; it’s a structural crack.
What are funding rates? Perpetuals use them to keep the contract price close to spot. A positive rate means longs pay shorts; a negative rate means shorts pay longs. I focus on the latter: go long where the rate is persistently negative and collect, and go short where it’s positive and pay. Keep the two legs balanced and hedge out as much of the coin’s price movement as possible—you’re making money from “misaligned pricing,” not from betting on direction.
Why does the crack persist? User bases differ across exchanges: some have more retail traders who like going long, so rates are positive year-round; others are dominated by arbitrage traders, so discounts are common. As long as the gap can’t be closed instantly, it remains. Moving assets between exchanges takes time and costs money, so the spread won’t converge in a second—that’s exactly why this arbitrage can survive.
The most underestimated risks: the spread can widen (you think 2% is extreme, but it can reach 20%); funding rates can reverse (an expected negative settlement turns positive, so you go from collecting to paying); capacity may not be available (if short OI on the exchange is maxed out, you can’t open a position); and you may not be able to top up margin in time. Losing the hen that lays the eggs just to make a few pennies is one of the most common ways to die in this business.
This monitoring system runs on my own machine, scanning more than a dozen exchanges 24/7 and sending alerts straight to my phone when an opportunity appears. No need to watch the charts all day, but when an extreme divergence shows up, I’m a step ahead of most people.
What are funding rates? Perpetuals use them to keep the contract price close to spot. A positive rate means longs pay shorts; a negative rate means shorts pay longs. I focus on the latter: go long where the rate is persistently negative and collect, and go short where it’s positive and pay. Keep the two legs balanced and hedge out as much of the coin’s price movement as possible—you’re making money from “misaligned pricing,” not from betting on direction.
Why does the crack persist? User bases differ across exchanges: some have more retail traders who like going long, so rates are positive year-round; others are dominated by arbitrage traders, so discounts are common. As long as the gap can’t be closed instantly, it remains. Moving assets between exchanges takes time and costs money, so the spread won’t converge in a second—that’s exactly why this arbitrage can survive.
The most underestimated risks: the spread can widen (you think 2% is extreme, but it can reach 20%); funding rates can reverse (an expected negative settlement turns positive, so you go from collecting to paying); capacity may not be available (if short OI on the exchange is maxed out, you can’t open a position); and you may not be able to top up margin in time. Losing the hen that lays the eggs just to make a few pennies is one of the most common ways to die in this business.
This monitoring system runs on my own machine, scanning more than a dozen exchanges 24/7 and sending alerts straight to my phone when an opportunity appears. No need to watch the charts all day, but when an extreme divergence shows up, I’m a step ahead of most people.
213
·
--
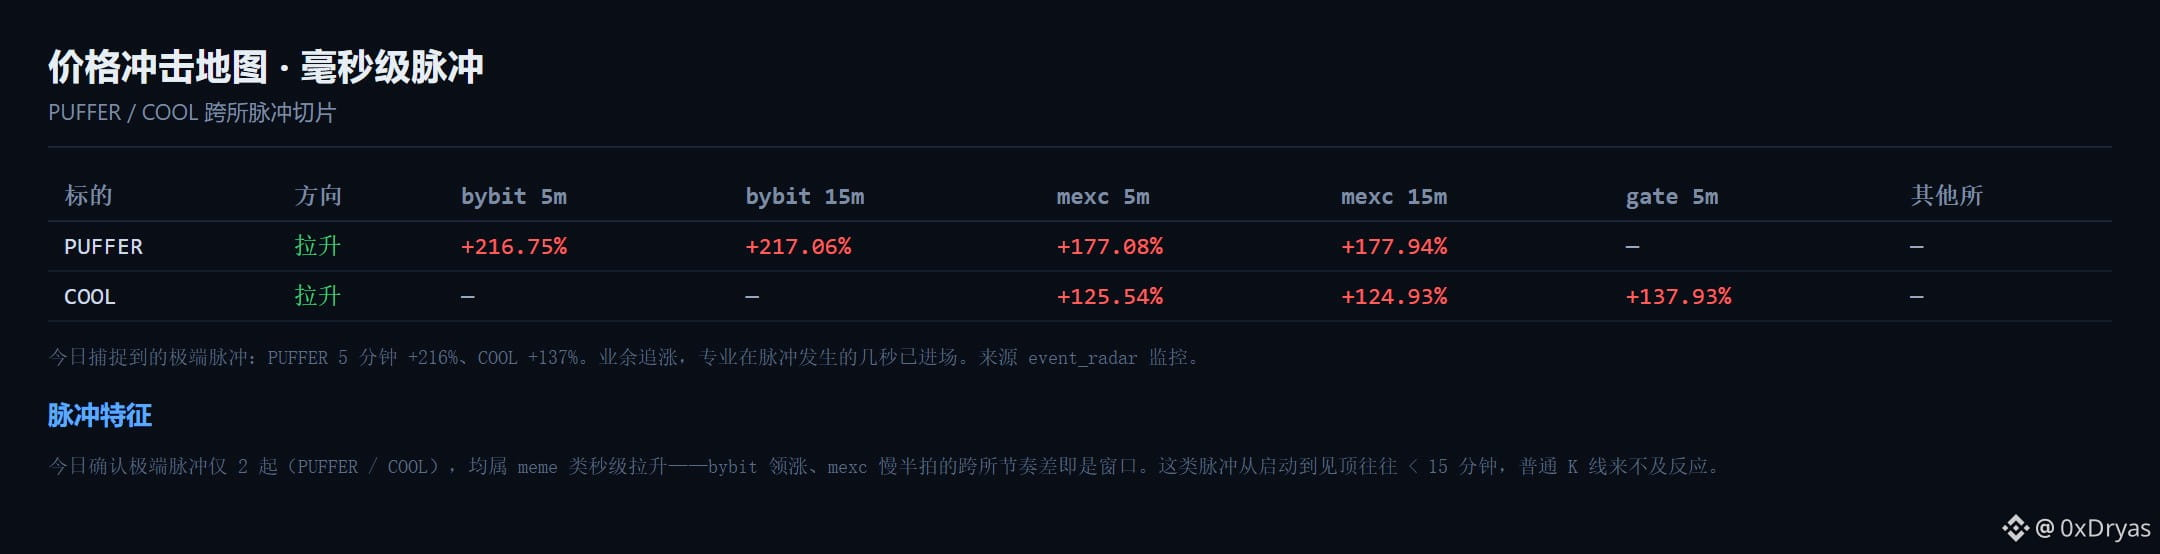
PUFFER surged 216% in 5 minutes today—not in a day, but in just 5 minutes. COOL followed with +137%.
With a surge like this, it’s over by the time you understand the candlestick chart. We capture the surge itself—Bybit moves first, MEXC lags by half a beat, and the window created by that difference in timing is the opportunity. The difference between professionals and amateurs: amateurs chase the rally; professionals are already in during the few seconds when the surge happens.
PUFFER surged 216% in 5 minutes today—not in a day, but in just 5 minutes. COOL followed with +137%.
With a surge like this, it’s over by the time you understand the candlestick chart. We capture the surge itself—Bybit moves first, MEXC lags by half a beat, and the window created by that difference in timing is the opportunity. The difference between professionals and amateurs: amateurs chase the rally; professionals are already in during the few seconds when the surge happens.
With a surge like this, it’s over by the time you understand the candlestick chart. We capture the surge itself—Bybit moves first, MEXC lags by half a beat, and the window created by that difference in timing is the opportunity. The difference between professionals and amateurs: amateurs chase the rally; professionals are already in during the few seconds when the surge happens.
125
·
--
A lot of people think arbitrage is just moving assets around to pocket the spread. They’re seriously underestimating this game.
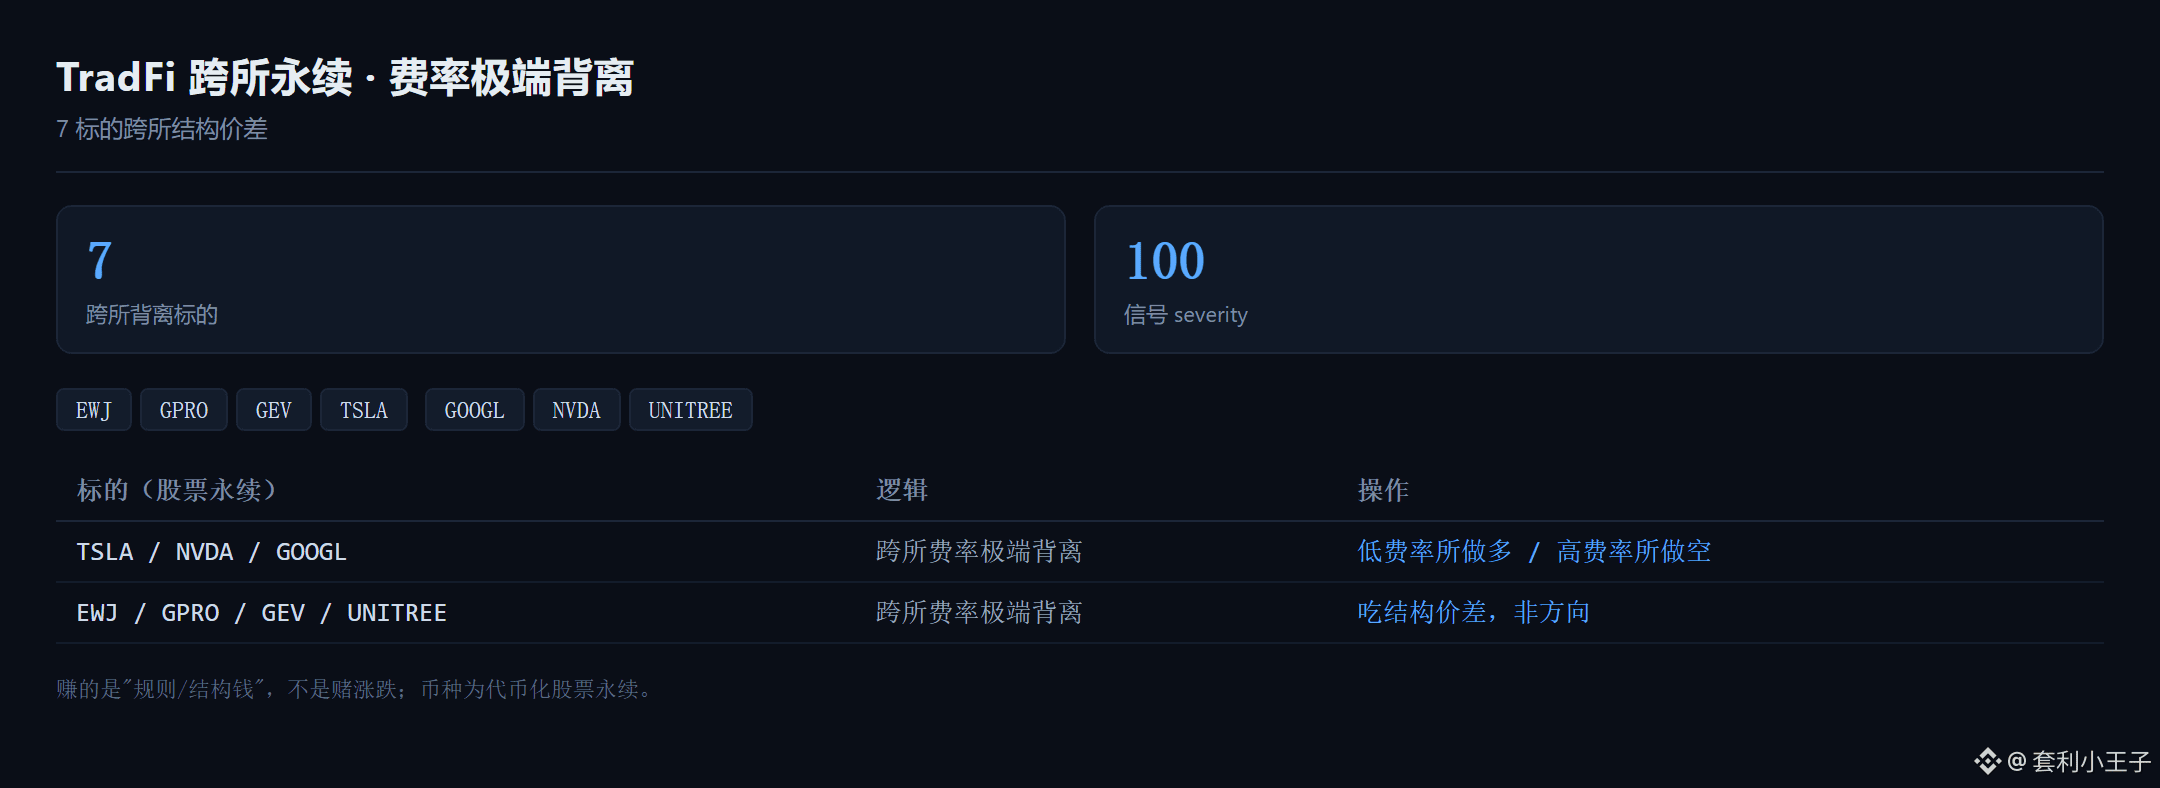
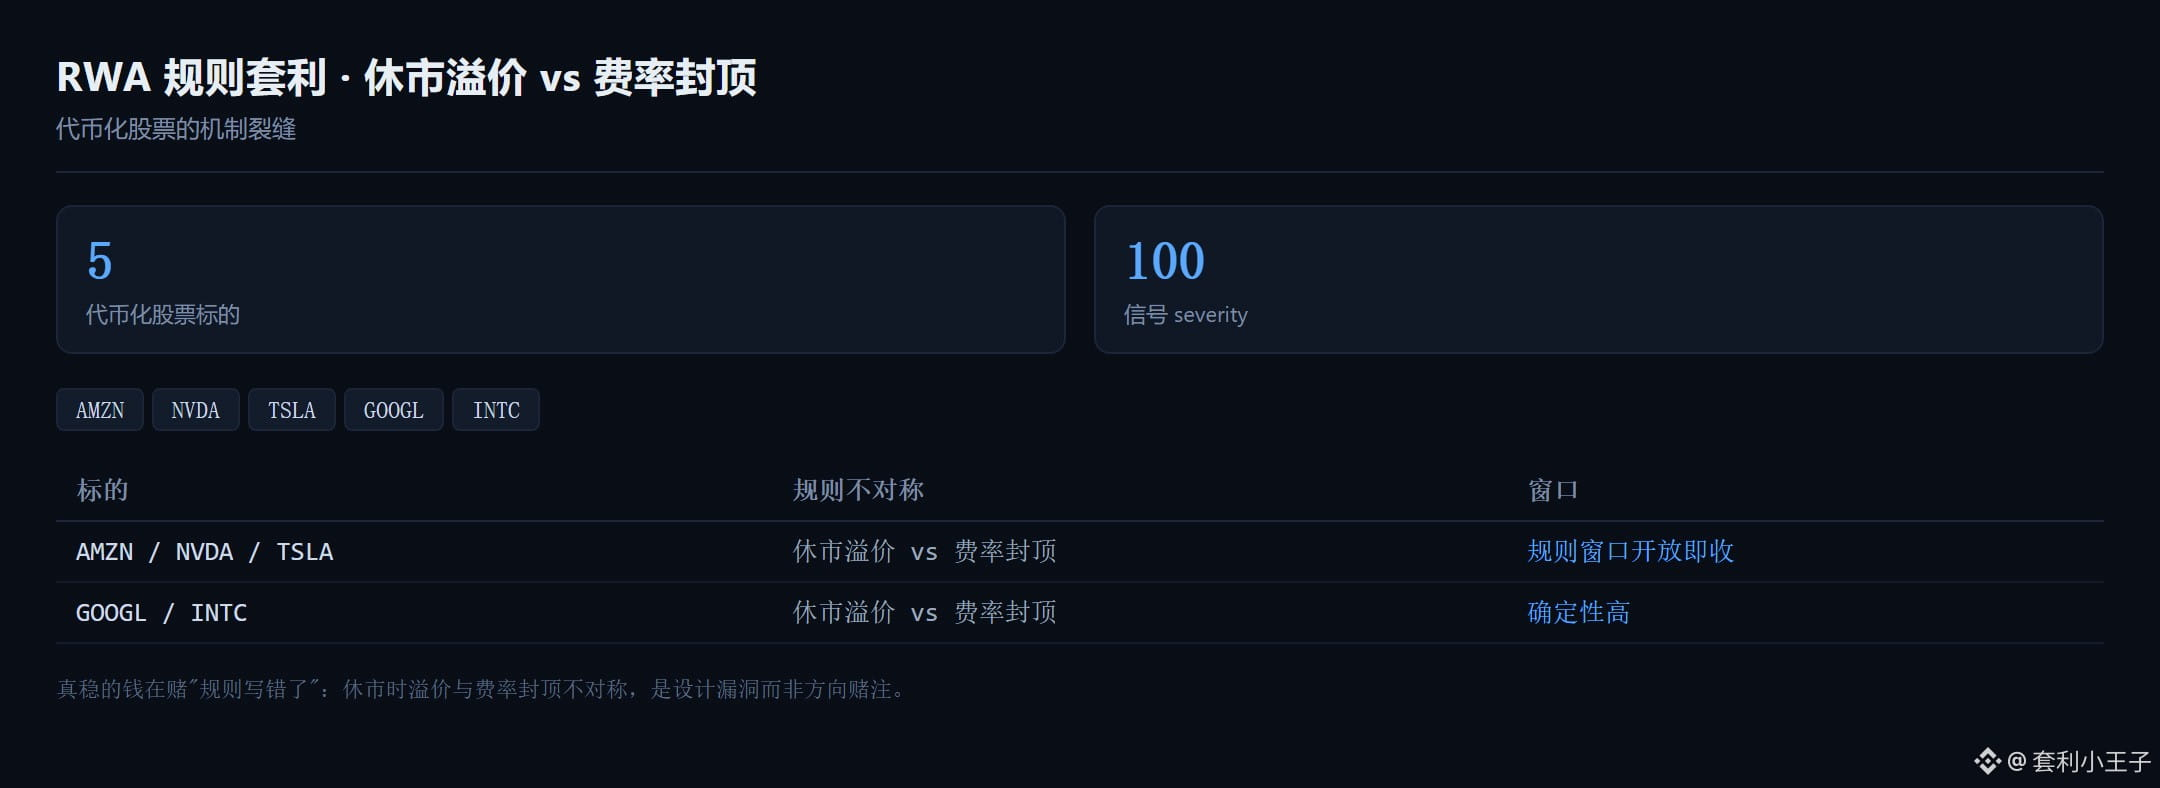
Tonight, our market scan picked up two real opportunities: one in cross-exchange TradFi perpetuals—perps on stocks like TSLA, NVDA, and GOOGL, where funding rates diverge wildly across exchanges. Go long on one exchange and short on another, and you’re capturing structural edge, not betting on direction. The other is the premium on tokenized stocks while traditional markets are closed versus capped funding rates. The rules themselves are asymmetric, so you collect while the window is open.
The truly steady money has never come from betting on whether prices go up or down. It comes from betting that “the rules were written wrong.”
The people who survive in this game are the ones who find cracks in the rules. Directional traders bet on being right or wrong; we bet on design flaws.
A lot of people think arbitrage is just moving assets around to pocket the spread. They’re seriously underestimating this game.
Tonight, our market scan picked up two real opportunities: one in cross-exchange TradFi perpetuals—perps on stocks like TSLA, NVDA, and GOOGL, where funding rates diverge wildly across exchanges. Go long on one exchange and short on another, and you’re capturing structural edge, not betting on direction. The other is the premium on tokenized stocks while traditional markets are closed versus capped funding rates. The rules themselves are asymmetric, so you collect while the window is open.
The truly steady money has never come from betting on whether prices go up or down. It comes from betting that “the rules were written wrong.”
The people who survive in this game are the ones who find cracks in the rules. Directional traders bet on being right or wrong; we bet on design flaws.
Tonight, our market scan picked up two real opportunities: one in cross-exchange TradFi perpetuals—perps on stocks like TSLA, NVDA, and GOOGL, where funding rates diverge wildly across exchanges. Go long on one exchange and short on another, and you’re capturing structural edge, not betting on direction. The other is the premium on tokenized stocks while traditional markets are closed versus capped funding rates. The rules themselves are asymmetric, so you collect while the window is open.
The truly steady money has never come from betting on whether prices go up or down. It comes from betting that “the rules were written wrong.”
The people who survive in this game are the ones who find cracks in the rules. Directional traders bet on being right or wrong; we bet on design flaws.
2.4k
·
--
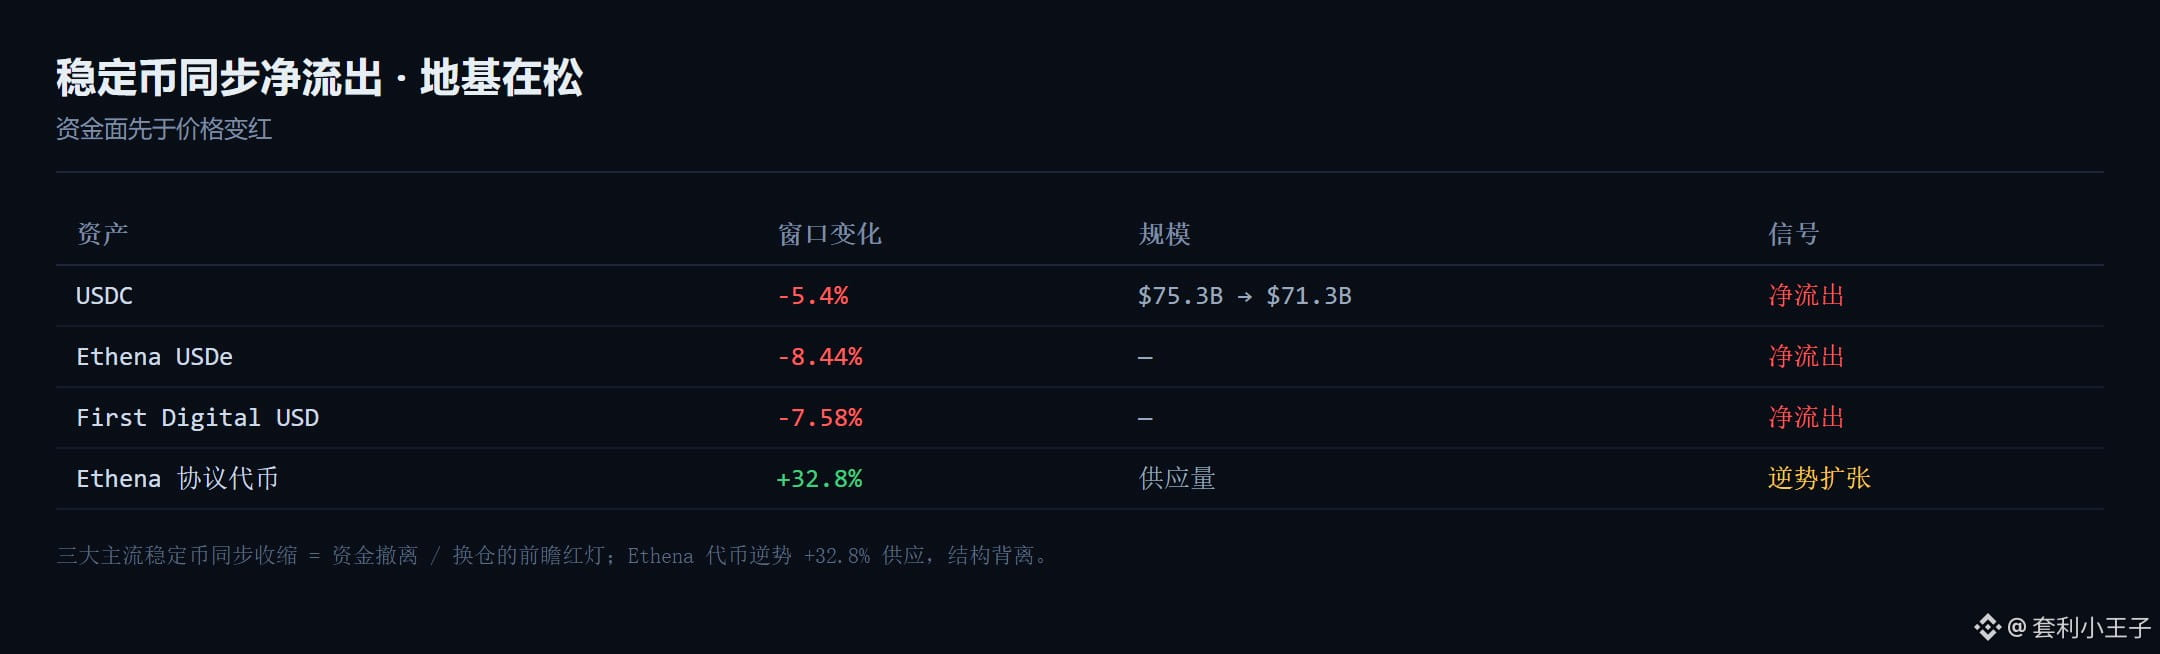
Something no one’s talking about: USDC saw net outflows of 5.4% during this window, Ethena’s USDe fell 8.4%, and First Digital dropped 7.6%. The three major stablecoins are contracting in sync.
On the surface, altcoins are still rallying, but the foundation is starting to weaken.
I’ve seen this happen too many times—the strongest rallies are often when smart money is quietly rotating. Stablecoin contraction doesn’t mean a crash is coming today; it’s a red light: don’t overextend your positions, and keep an exit route open.
Something no one’s talking about: USDC saw net outflows of 5.4% during this window, Ethena’s USDe fell 8.4%, and First Digital dropped 7.6%. The three major stablecoins are contracting in sync.
On the surface, altcoins are still rallying, but the foundation is starting to weaken.
I’ve seen this happen too many times—the strongest rallies are often when smart money is quietly rotating. Stablecoin contraction doesn’t mean a crash is coming today; it’s a red light: don’t overextend your positions, and keep an exit route open.
On the surface, altcoins are still rallying, but the foundation is starting to weaken.
I’ve seen this happen too many times—the strongest rallies are often when smart money is quietly rotating. Stablecoin contraction doesn’t mean a crash is coming today; it’s a red light: don’t overextend your positions, and keep an exit route open.
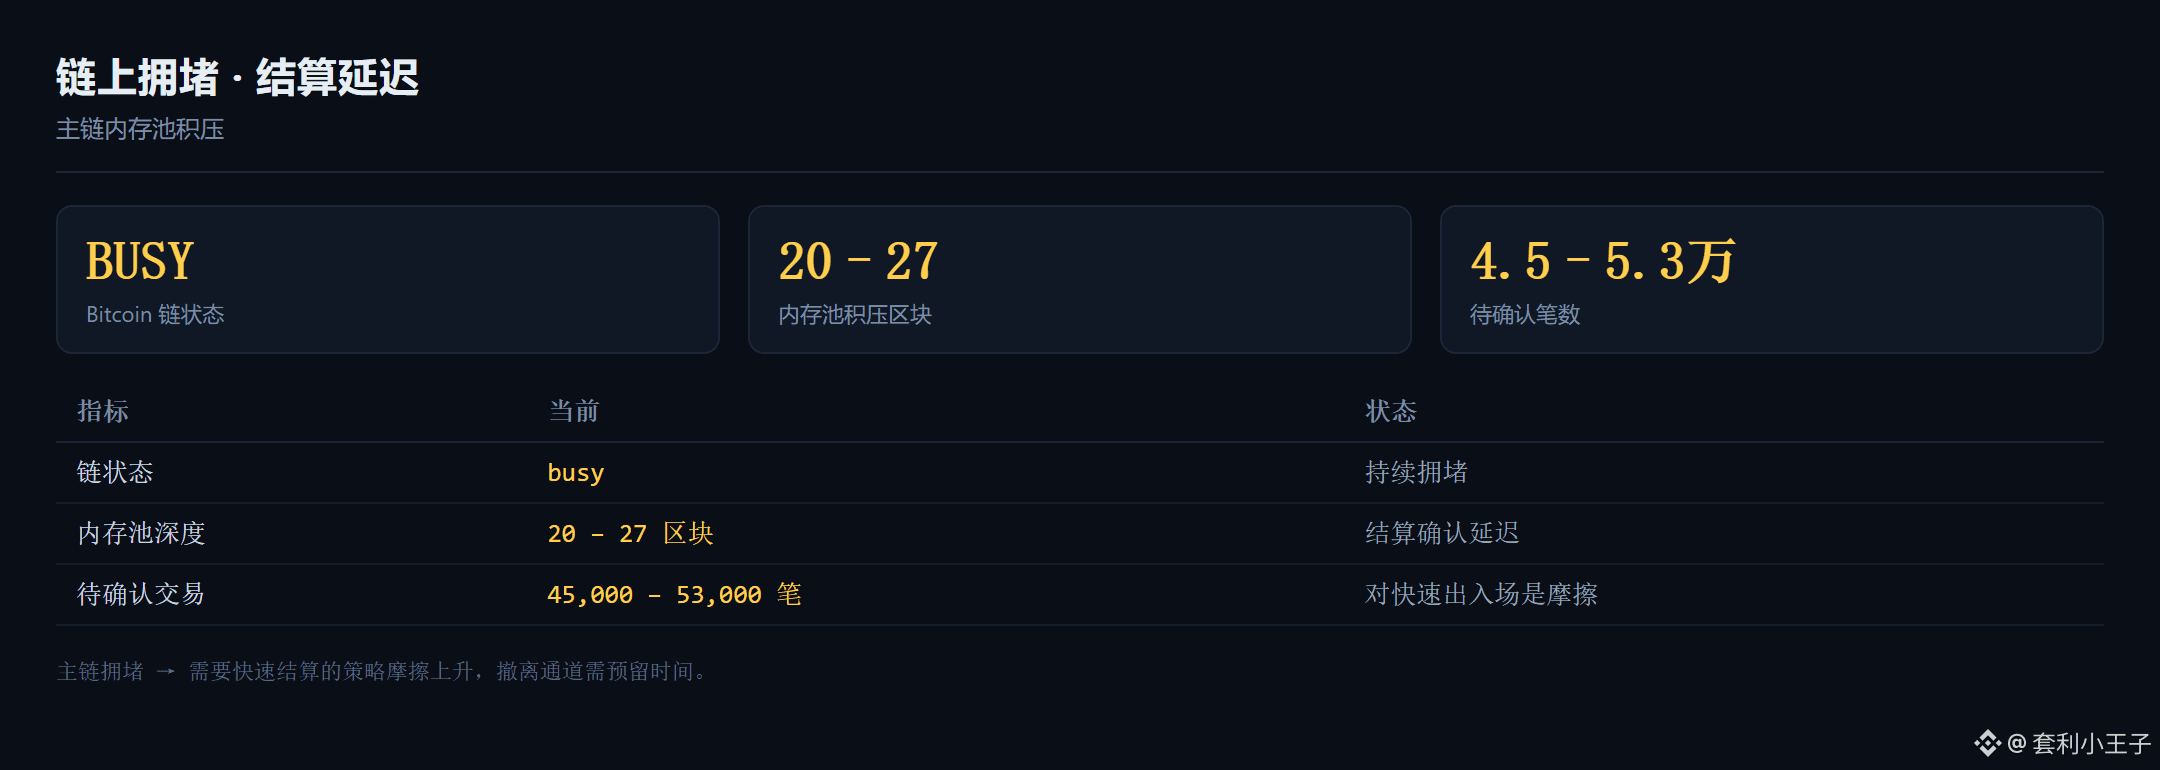
140
·
--
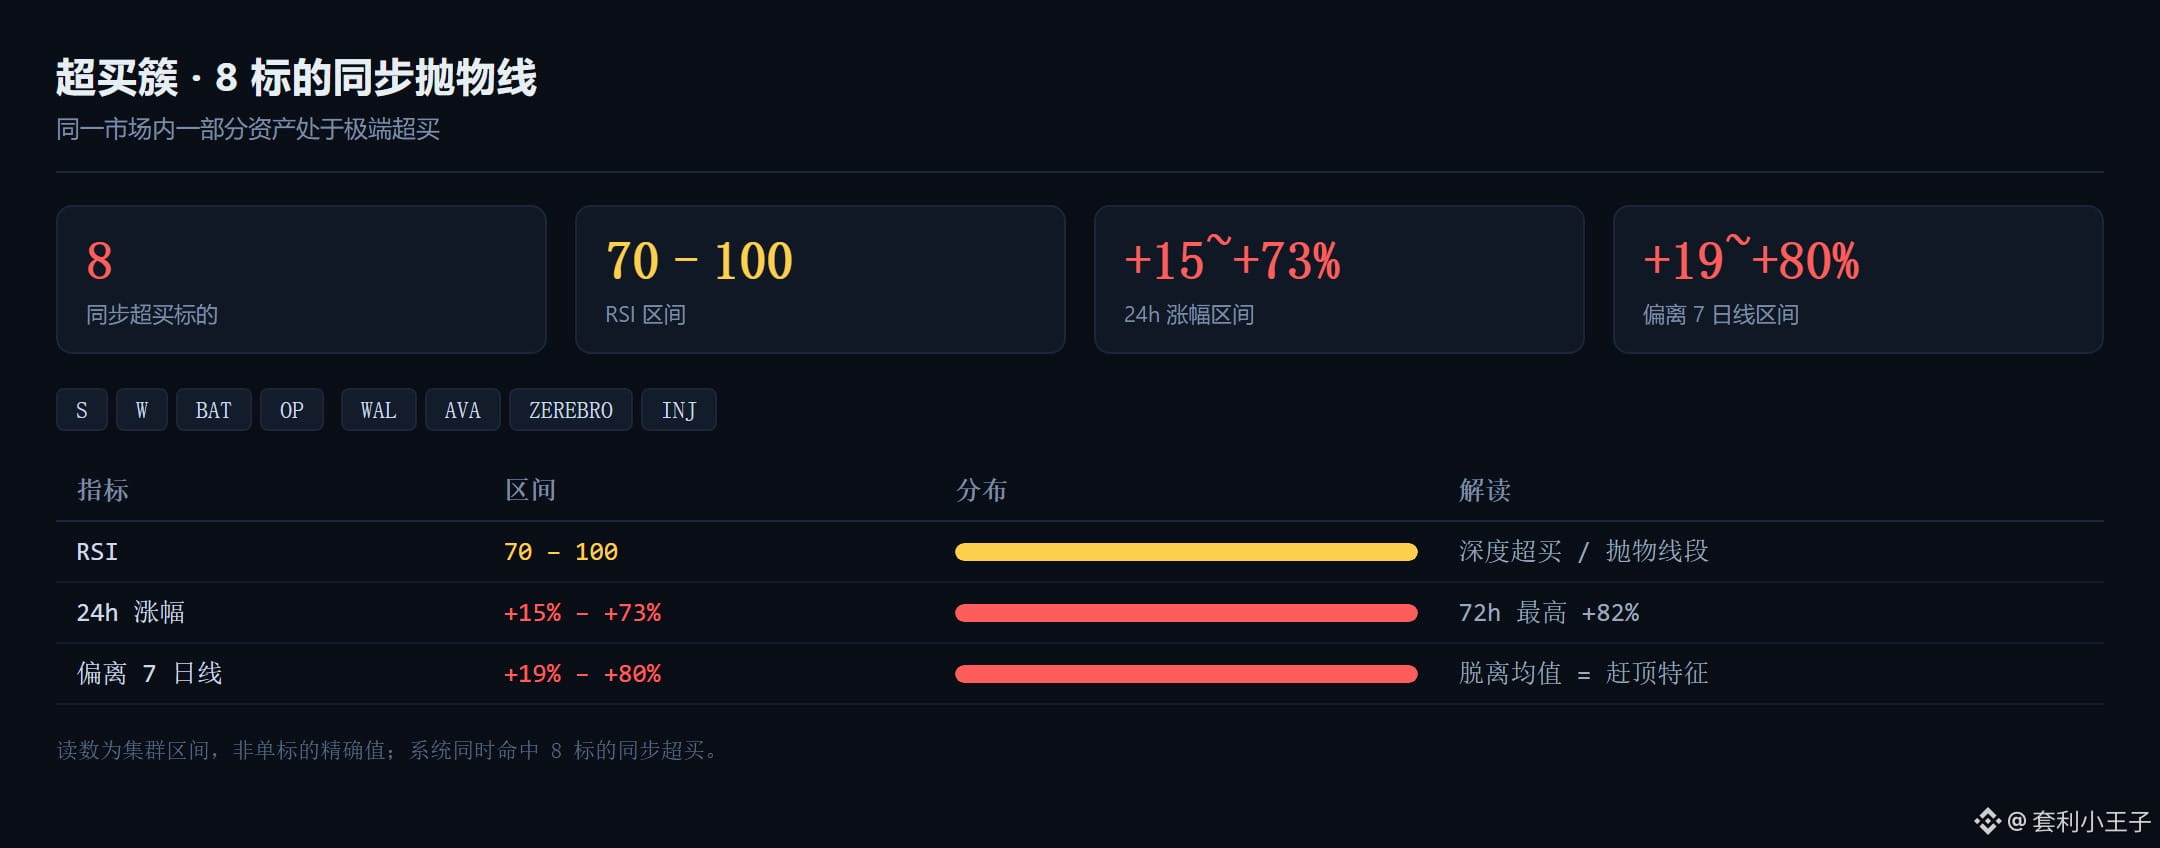
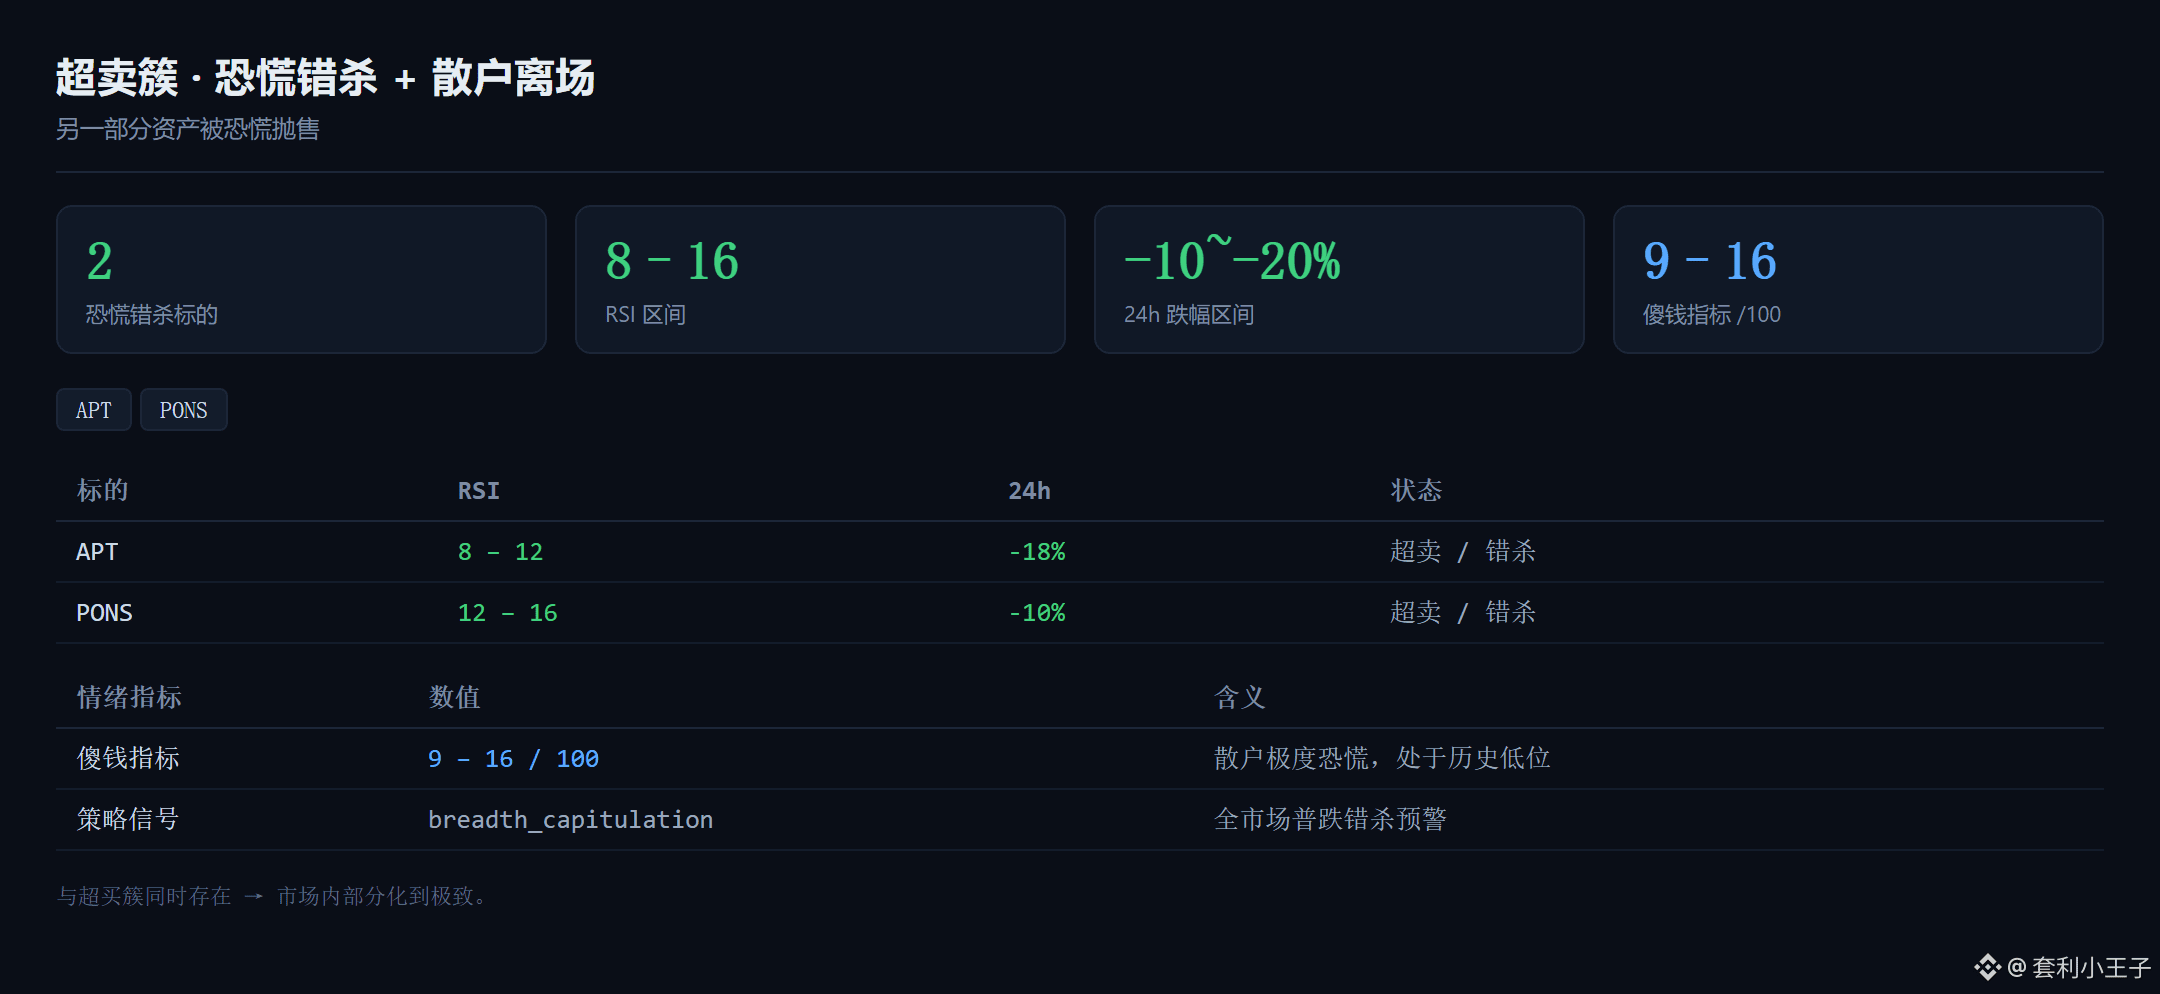
The strangest thing about today's market isn't the drop—it's the split.
Half the assets are racing toward a parabolic top: S, W, BAT, and OP all have RSI readings pegged at 70–100, up 15% to 73% in 24 hours and nearly 80% above their seven-day moving averages. The other half have been unfairly dumped in a panic, with APT and PONS RSI readings down to 8–16, falling 10–20% in a day.
The same market, but two groups of people living in different universes.
My approach is simple: don't chase the ones racing toward a top; wait for them to break on their own. For the panic-sold ones, place your orders and wait for a rebound. In a split market, the worst thing you can do is use the same yardstick for everyone.
The strangest thing about today's market isn't the drop—it's the split.
Half the assets are racing toward a parabolic top: S, W, BAT, and OP all have RSI readings pegged at 70–100, up 15% to 73% in 24 hours and nearly 80% above their seven-day moving averages. The other half have been unfairly dumped in a panic, with APT and PONS RSI readings down to 8–16, falling 10–20% in a day.
The same market, but two groups of people living in different universes.
My approach is simple: don't chase the ones racing toward a top; wait for them to break on their own. For the panic-sold ones, place your orders and wait for a rebound. In a split market, the worst thing you can do is use the same yardstick for everyone.
Half the assets are racing toward a parabolic top: S, W, BAT, and OP all have RSI readings pegged at 70–100, up 15% to 73% in 24 hours and nearly 80% above their seven-day moving averages. The other half have been unfairly dumped in a panic, with APT and PONS RSI readings down to 8–16, falling 10–20% in a day.
The same market, but two groups of people living in different universes.
My approach is simple: don't chase the ones racing toward a top; wait for them to break on their own. For the panic-sold ones, place your orders and wait for a rebound. In a split market, the worst thing you can do is use the same yardstick for everyone.
35
·
--
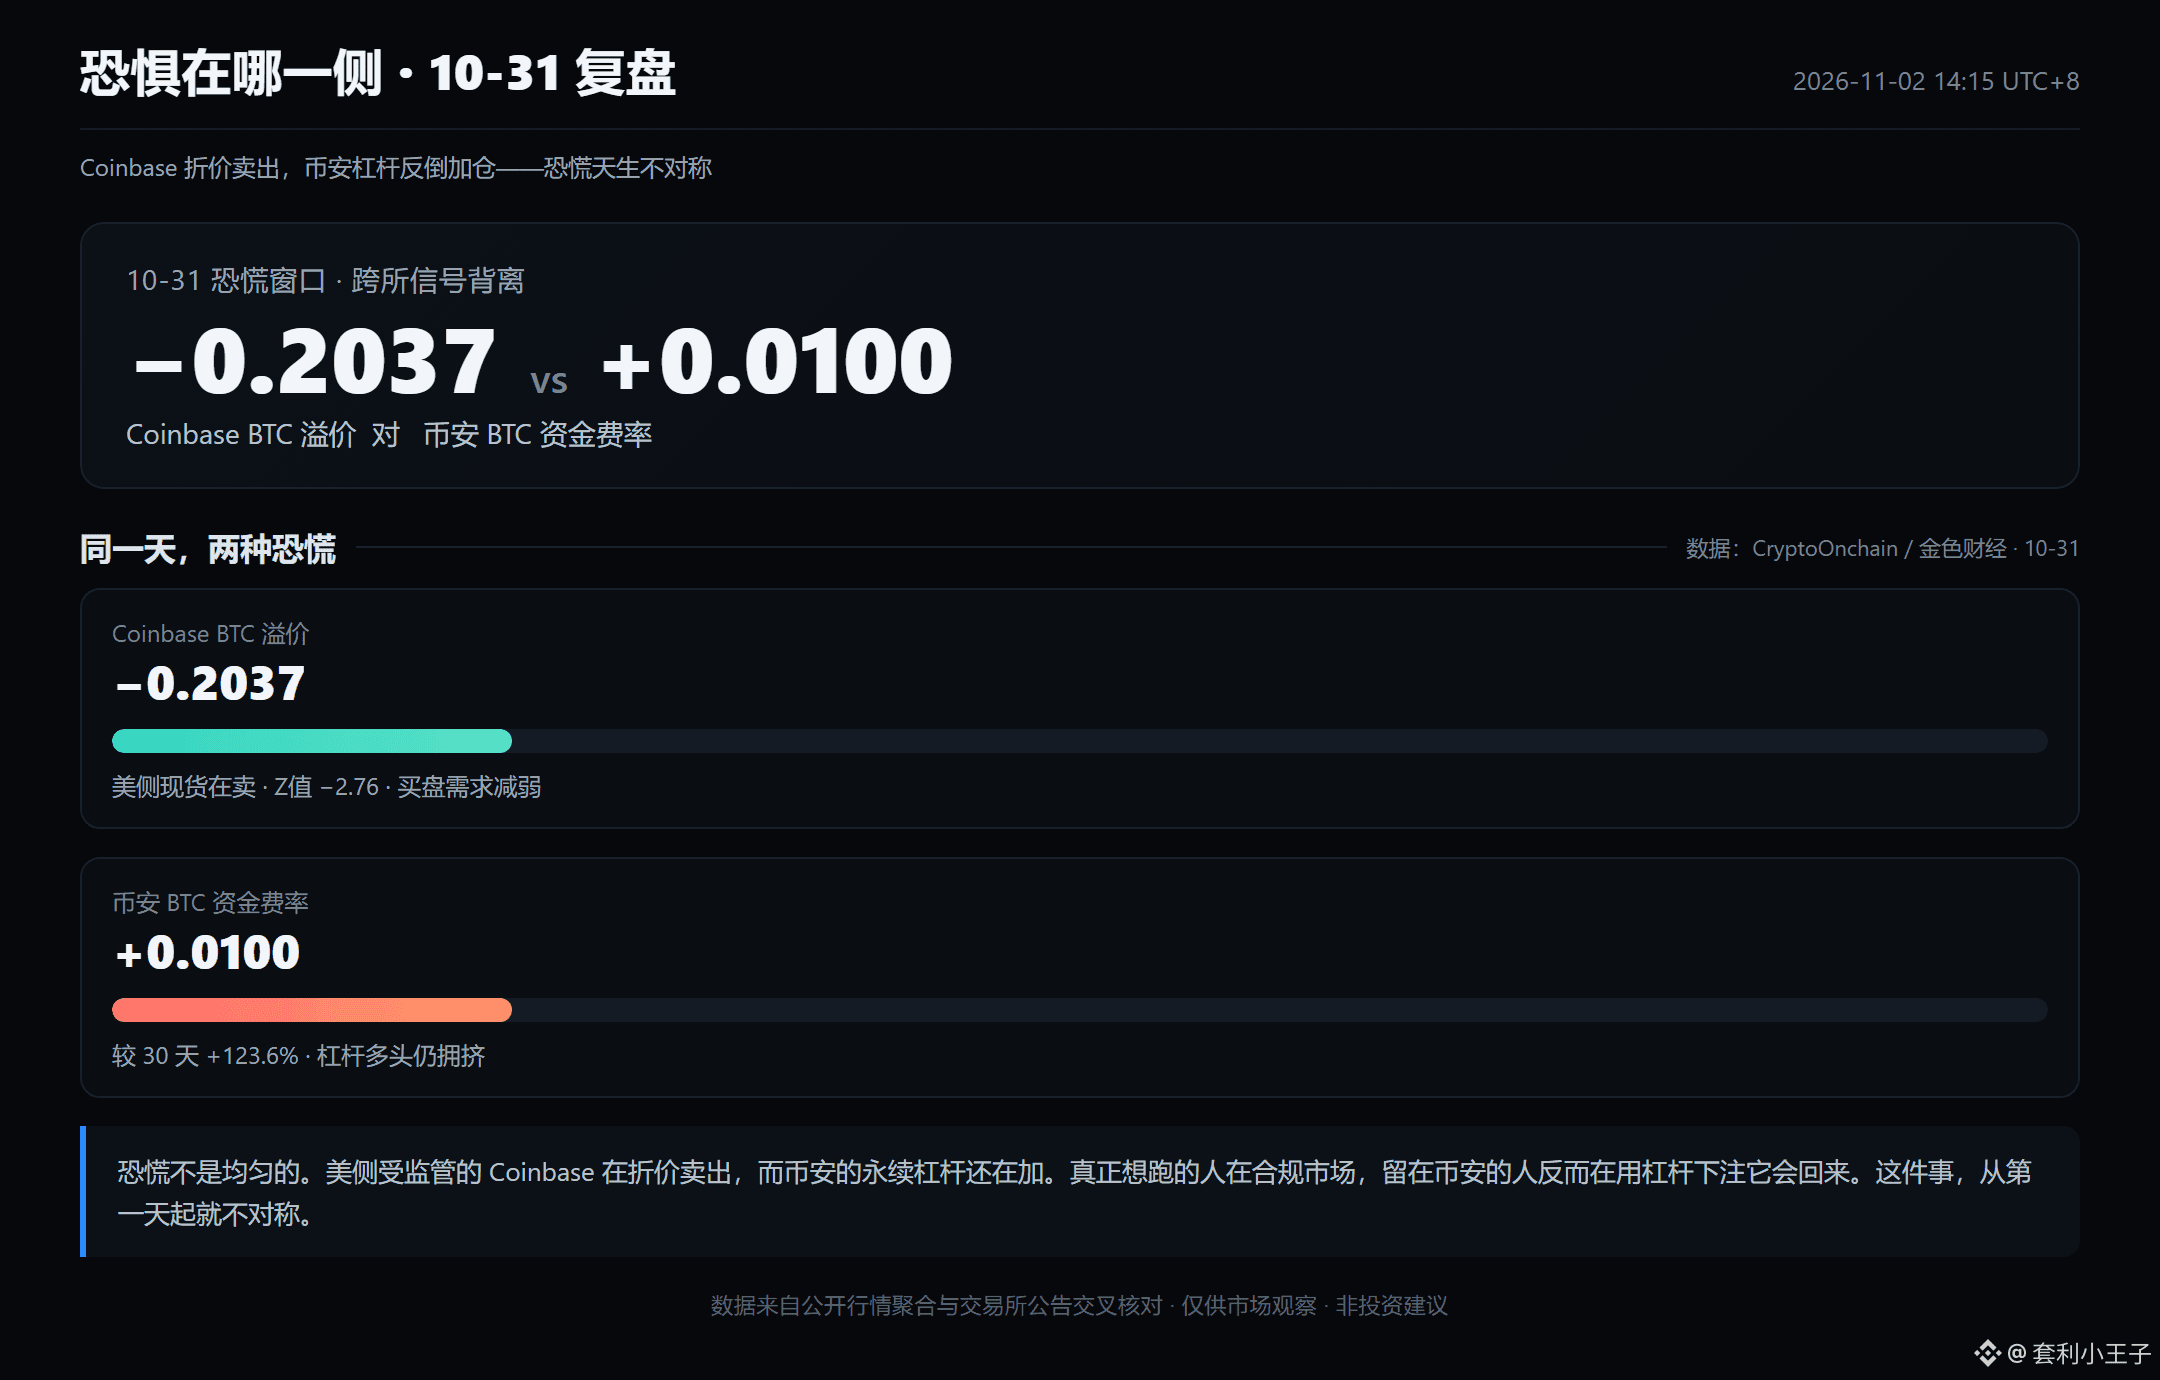
There was one detail nobody mentioned on October 31.
At the same time, Coinbase’s Bitcoin premium was −0.2037 (Z-score −2.76), with U.S. spot traders selling; while Binance’s Bitcoin funding rate was +0.0100, 123.6% above its 30-day average, and leveraged longs were still piling in.
In other words: those who really wanted to get out were selling at a discount on regulated markets; those staying on Binance, on the other hand, were betting with leverage that it would bounce back.
Panic is never evenly distributed. Regulation, liquidity, and time zones split it into two asymmetric halves.
Those who understood this didn’t panic that day, nor did they recklessly add to their positions.
There was one detail nobody mentioned on October 31.
At the same time, Coinbase’s Bitcoin premium was −0.2037 (Z-score −2.76), with U.S. spot traders selling; while Binance’s Bitcoin funding rate was +0.0100, 123.6% above its 30-day average, and leveraged longs were still piling in.
In other words: those who really wanted to get out were selling at a discount on regulated markets; those staying on Binance, on the other hand, were betting with leverage that it would bounce back.
Panic is never evenly distributed. Regulation, liquidity, and time zones split it into two asymmetric halves.
Those who understood this didn’t panic that day, nor did they recklessly add to their positions.
At the same time, Coinbase’s Bitcoin premium was −0.2037 (Z-score −2.76), with U.S. spot traders selling; while Binance’s Bitcoin funding rate was +0.0100, 123.6% above its 30-day average, and leveraged longs were still piling in.
In other words: those who really wanted to get out were selling at a discount on regulated markets; those staying on Binance, on the other hand, were betting with leverage that it would bounce back.
Panic is never evenly distributed. Regulation, liquidity, and time zones split it into two asymmetric halves.
Those who understood this didn’t panic that day, nor did they recklessly add to their positions.
55
Log in to explore more content
Join global crypto users on Binance Square
⚡️ Get latest and useful information about crypto.
💬 Trusted by the world’s largest crypto exchange.
👍 Discover real insights from verified creators.
Email / Phone number
Trending Topics
BinanceReopensWithdrawalsForMoreAssets
765,938 views
4,237 Discussing
Security Incident | Recovery Update #8: Withdrawals for More Assets to Reopen (2026-11-05)
Binance Announcement
·330 Likes
·1.4M views
Binance98PercentReplenished
138,796 views
1,630 Discussing
USStocksSlipandCryptoMarketUnderBroadPressure
201 views
79 Discussing