

币圈掘金人
7.3k Posts

币圈掘金人
Report
Block User
币圈掘金人,加密世界的财富勘探者。以冷静目光审视波动,以专业工具捕捉机遇。在区块链的矿脉中,执着的前行者,于代码浪潮间筛选真金。不追逐狂热,只深耕价值——在比特与字节的新大陆,做时间的朋友。行业先锋,永远在冷静与狂热之间,寻找下一个确定性。
Open Trade
Frequent Trader
8 Years
2.4K+ Following
13.1K+ Followers
6.6K+ Liked
Posts
Portfolio
All
Quotes
Videos
·
--
Article
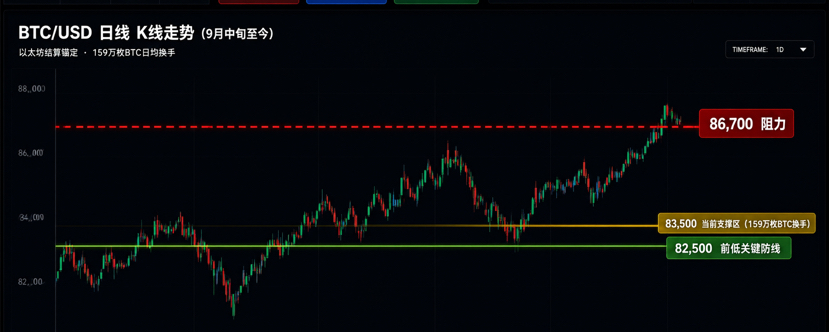
Market Shakeout or Trend Reversal? The Three Forces Behind Bitcoin’s Fight to Hold $83,500On October 7, 2026, Bitcoin plunged from $86,500 to around $83,500, wiping out more than $550 million in leveraged positions within 24 hours. Amid widespread market panic, however, the Fear and Greed Index fell only from 73 to 70, remaining far from capitulation territory. On-chain data shows that whales accumulated more than 40,000 BTC over 10 days, while BlackRock’s IBIT saw net inflows of $122 million in a single day. The real risk isn’t in today’s candlestick chart, but in 2028: the strategic Bitcoin reserve established by executive order could unravel with a change in presidents. This article unpacks the true significance of the crash through three lenses: technicals, capital flows, and policy.
Market Shakeout or Trend Reversal? The Three Forces Behind Bitcoin’s Fight to Hold $83,500
On October 7, 2026, Bitcoin plunged from $86,500 to around $83,500, wiping out more than $550 million in leveraged positions within 24 hours. Amid widespread market panic, however, the Fear and Greed Index fell only from 73 to 70, remaining far from capitulation territory. On-chain data shows that whales accumulated more than 40,000 BTC over 10 days, while BlackRock’s IBIT saw net inflows of $122 million in a single day. The real risk isn’t in today’s candlestick chart, but in 2028: the strategic Bitcoin reserve established by executive order could unravel with a change in presidents. This article unpacks the true significance of the crash through three lenses: technicals, capital flows, and policy.
20
4
578
·
--

Article
After the Old Stories Fade: How Much “Sentiment Premium” Is Left in BNB, ETH, and SOL?In October 2026, the crypto market is in a delicate balance: Bitcoin is staging a modest rebound near $86,000, institutional capital continues to flow back in, and the Fear and Greed Index is hovering in “Greed” territory—but remains far from euphoric highs. Yet the picture for three major coins—BNB, ETH, and SOL—is far more complex than the index suggests. Their core narratives have long since been priced in. Ethereum’s technical upgrades are still advancing, but pressure on the supply side is beginning to emerge. SOL has found a new anchor in the institutional settlement space, while BNB is seeking growth at the intersection of AI and RWA. Now that old stories are no longer scarce, will the next leg up come from a fundamental re-rating or sentiment-driven multiple expansion? Using a framework that distinguishes “narrative returns” from “sentiment returns,” and drawing on the latest on-chain data and market developments, this article explores a key question: when the bull market reaches its peak, are the major coins in your portfolio telling a new story—or simply running on old sentiment?
After the Old Stories Fade: How Much “Sentiment Premium” Is Left in BNB, ETH, and SOL?
In October 2026, the crypto market is in a delicate balance: Bitcoin is staging a modest rebound near $86,000, institutional capital continues to flow back in, and the Fear and Greed Index is hovering in “Greed” territory—but remains far from euphoric highs. Yet the picture for three major coins—BNB, ETH, and SOL—is far more complex than the index suggests. Their core narratives have long since been priced in. Ethereum’s technical upgrades are still advancing, but pressure on the supply side is beginning to emerge. SOL has found a new anchor in the institutional settlement space, while BNB is seeking growth at the intersection of AI and RWA. Now that old stories are no longer scarce, will the next leg up come from a fundamental re-rating or sentiment-driven multiple expansion? Using a framework that distinguishes “narrative returns” from “sentiment returns,” and drawing on the latest on-chain data and market developments, this article explores a key question: when the bull market reaches its peak, are the major coins in your portfolio telling a new story—or simply running on old sentiment?
223
1
12
456
·
--

Article
From the Four-Year Cycle to a Multidimensional Strategy: Bitcoin Is Undergoing a Structural TransformationA year ago, Bitcoin hit an all-time high of around $126,000 in October. One year later, its price has fallen back to around $85,000, a drop of approximately 32%. Prices are falling, but the market structure is undergoing a fundamental transformation: the number of publicly traded companies holding BTC has grown from just a handful to more than 105, while monthly net inflows into spot ETFs remain as high as $2.65 billion. Bitcoin’s 30-day correlation with the S&P 500 has also fallen to its lowest level since the FTX collapse. Drawing on the latest market data and macroeconomic event calendar, this article explores a central question: as BTC shifts from a retail asset to an institutional one, does the investor’s strategic framework also need to evolve? The answer points in one direction: moving away from predictive investing based on a single four-year cycle and toward multidimensional position management guided by risk appetite.
From the Four-Year Cycle to a Multidimensional Strategy: Bitcoin Is Undergoing a Structural Transformation
A year ago, Bitcoin hit an all-time high of around $126,000 in October. One year later, its price has fallen back to around $85,000, a drop of approximately 32%. Prices are falling, but the market structure is undergoing a fundamental transformation: the number of publicly traded companies holding BTC has grown from just a handful to more than 105, while monthly net inflows into spot ETFs remain as high as $2.65 billion. Bitcoin’s 30-day correlation with the S&P 500 has also fallen to its lowest level since the FTX collapse. Drawing on the latest market data and macroeconomic event calendar, this article explores a central question: as BTC shifts from a retail asset to an institutional one, does the investor’s strategic framework also need to evolve? The answer points in one direction: moving away from predictive investing based on a single four-year cycle and toward multidimensional position management guided by risk appetite.
41
4
148
·
--

Article
Global Macro Weekly: U.S. Treasury “Decoupling” and Liquidity Undercurrents—The Real Risks Behind Delayed Rate HikesDuring the week of October 5–11, global markets entered a macro data vacuum. Beneath the calm surface, however, a battle over “who sets the price of bonds” is rapidly intensifying. Downward revisions to U.S. August PCE data and a sharp weakening in nonfarm payrolls pushed the probability of an October rate hike down to around 22%. Yet the 10-year Treasury yield remained near 5.3%, while the 30-year yield touched a multi-decade high above 5.6%—a rare “decoupling” between the bond market and the Fed’s near-term policy signals. Meanwhile, U.S.-Iran talks over the Strait of Hormuz have stalled, and the recovery in energy supplies has failed to bring Brent crude prices down significantly, suggesting that markets are pricing in a pessimistic outlook for geopolitical risks in the Middle East. Globally, the Bank of Japan has raised rates to a 31-year high, and expectations of a rate hike by the Reserve Bank of India are mounting. The synchronized rate-hike story is no longer just about the United States; it is now global. Bitcoin has climbed above $86,000, but weakening on-chain momentum is locked in a tug-of-war with liquidity pressures from a high-yield environment. This week, watch closely for divergence between 2-year and 10-/30-year Treasury yields, and whether gold rises in tandem with yields—this will be a key signal of bond-market risks spilling over into risk assets.
Global Macro Weekly: U.S. Treasury “Decoupling” and Liquidity Undercurrents—The Real Risks Behind Delayed Rate Hikes
During the week of October 5–11, global markets entered a macro data vacuum. Beneath the calm surface, however, a battle over “who sets the price of bonds” is rapidly intensifying. Downward revisions to U.S. August PCE data and a sharp weakening in nonfarm payrolls pushed the probability of an October rate hike down to around 22%. Yet the 10-year Treasury yield remained near 5.3%, while the 30-year yield touched a multi-decade high above 5.6%—a rare “decoupling” between the bond market and the Fed’s near-term policy signals. Meanwhile, U.S.-Iran talks over the Strait of Hormuz have stalled, and the recovery in energy supplies has failed to bring Brent crude prices down significantly, suggesting that markets are pricing in a pessimistic outlook for geopolitical risks in the Middle East. Globally, the Bank of Japan has raised rates to a 31-year high, and expectations of a rate hike by the Reserve Bank of India are mounting. The synchronized rate-hike story is no longer just about the United States; it is now global. Bitcoin has climbed above $86,000, but weakening on-chain momentum is locked in a tug-of-war with liquidity pressures from a high-yield environment. This week, watch closely for divergence between 2-year and 10-/30-year Treasury yields, and whether gold rises in tandem with yields—this will be a key signal of bond-market risks spilling over into risk assets.
238
1
14
374
·
--

Article
ETH stuck at 2,700 and ZEC rebounding faces resistance: wait for direction, or set boundaries first?ETH has recently been repeatedly jostling around the $2,700 mark, with both upside momentum and downside room constrained, putting the market into a typical “waiting-for-signal” state. A staking-ETH withdrawal queue extension caused by a wallet security incident has brought some phased sentiment pressure, but the scale and release timing are not sufficient to trigger a systemic collapse. ZEC, after experiencing a sharp earlier surge in volatility, has rebounded into resistance; on the shorter cycle it looks more like a repair following a steep selloff rather than a trend reversal. For ordinary investors, the safer approach now is not to bet on direction in advance, but first to define key boundaries: what to do to follow up after a breakout, and how to defend if it breaks down.
ETH stuck at 2,700 and ZEC rebounding faces resistance: wait for direction, or set boundaries first?
ETH has recently been repeatedly jostling around the $2,700 mark, with both upside momentum and downside room constrained, putting the market into a typical “waiting-for-signal” state. A staking-ETH withdrawal queue extension caused by a wallet security incident has brought some phased sentiment pressure, but the scale and release timing are not sufficient to trigger a systemic collapse. ZEC, after experiencing a sharp earlier surge in volatility, has rebounded into resistance; on the shorter cycle it looks more like a repair following a steep selloff rather than a trend reversal. For ordinary investors, the safer approach now is not to bet on direction in advance, but first to define key boundaries: what to do to follow up after a breakout, and how to defend if it breaks down.
19
1
521
·
--
Verified

Article
Big Reversal in Rate-Hike Expectations! In Just One Week, It Dropped from 70% to 25%—On October 28, Will the Fed Actually Hike Rates? Three Signals the Crypto Market Needs to WatchWithin a week, market pricing for the Fed’s October rate hike swung sharply. The probability of a hike fell rapidly from 71% to 25%, but expectations for additional hikes later in the year have not disappeared—pressure has simply shifted to December. The biggest variable for inflation is oil-price volatility amid the situation in the Middle East. This article breaks down three key observation signals, explains how monetary policy transmission works into the crypto market, and provides practical trading discipline for ordinary investors during the policy-meeting window—helping them avoid the high-volatility traps around the Fed’s decision.
Within a week, the entire market’s assessment of the Federal Reserve’s October policy meeting was completely rewritten.
Big Reversal in Rate-Hike Expectations! In Just One Week, It Dropped from 70% to 25%—On October 28, Will the Fed Actually Hike Rates? Three Signals the Crypto Market Needs to Watch
Within a week, market pricing for the Fed’s October rate hike swung sharply. The probability of a hike fell rapidly from 71% to 25%, but expectations for additional hikes later in the year have not disappeared—pressure has simply shifted to December. The biggest variable for inflation is oil-price volatility amid the situation in the Middle East. This article breaks down three key observation signals, explains how monetary policy transmission works into the crypto market, and provides practical trading discipline for ordinary investors during the policy-meeting window—helping them avoid the high-volatility traps around the Fed’s decision.
Within a week, the entire market’s assessment of the Federal Reserve’s October policy meeting was completely rewritten.
Within a week, the entire market’s assessment of the Federal Reserve’s October policy meeting was completely rewritten.
600
28
600
·
--

Article
Nonfarm shocks fail to curb long-end rates: With macro divergence, crypto enters a critical weekThe U.S. nonfarm payrolls for September came in far below expectations, and expectations for Fed rate hikes in October cooled quickly. However, yields on 10-year U.S. Treasuries and the U.S. dollar index rose against the trend, creating a typical market divergence. Short-end interest-rate pricing has eased, while long-end yields have remained stubbornly high due to constraints from fiscal supply and energy inflation. This contradictory macro environment is becoming a new pricing backdrop for crypto assets. Next week, the Fed meeting minutes, long-end Treasury auctions, the release of G7 oil reserves, and the ISM non-manufacturing PMI will be key variables determining the near-term direction of risk assets. The crypto market will no longer focus only on a single employment report; changes in long-end Treasury yields will become the most important “steering wheel” for the行情.
Nonfarm shocks fail to curb long-end rates: With macro divergence, crypto enters a critical week
The U.S. nonfarm payrolls for September came in far below expectations, and expectations for Fed rate hikes in October cooled quickly. However, yields on 10-year U.S. Treasuries and the U.S. dollar index rose against the trend, creating a typical market divergence. Short-end interest-rate pricing has eased, while long-end yields have remained stubbornly high due to constraints from fiscal supply and energy inflation. This contradictory macro environment is becoming a new pricing backdrop for crypto assets. Next week, the Fed meeting minutes, long-end Treasury auctions, the release of G7 oil reserves, and the ISM non-manufacturing PMI will be key variables determining the near-term direction of risk assets. The crypto market will no longer focus only on a single employment report; changes in long-end Treasury yields will become the most important “steering wheel” for the行情.
175
7
654
·
--
Article
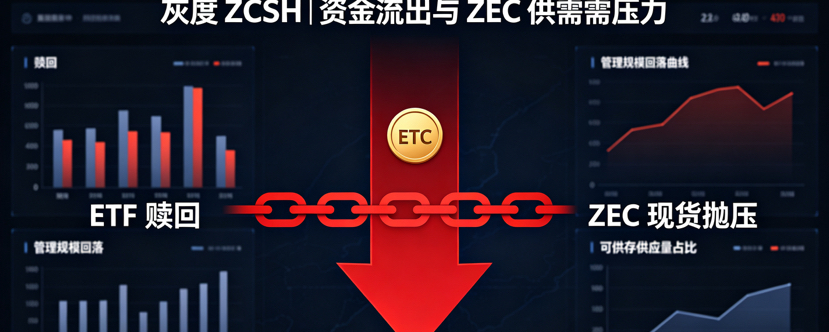
From a “hit ETF” to a source of sell pressure: ZCSH records $93.56 million in weekly outflows, and small-cap coin ETFs begin to test supply-and-demand resilienceGrayscale ZCSH, as the first US spot Zcash ETF, saw a brief breakout craze after listing, but net outflows in a single week reached $93.56 million. Assets under management, which peaked at about $915 million to $979 million, subsequently fell back to around $751 million. For ZEC, what is truly worth关注 is not the ETF’s “celebrity status” in name, but the fact that it has become an unavoidable supply-and-demand variable. This article analyzes the reasons from the perspectives of capital flows, share splits, fee structures, circulating supply, and the price mechanism—explaining why a small-cap cryptocurrency ETF can both amplify upward moves and, during redemptions, create rapid selling pressure.
From a “hit ETF” to a source of sell pressure: ZCSH records $93.56 million in weekly outflows, and small-cap coin ETFs begin to test supply-and-demand resilience
Grayscale ZCSH, as the first US spot Zcash ETF, saw a brief breakout craze after listing, but net outflows in a single week reached $93.56 million. Assets under management, which peaked at about $915 million to $979 million, subsequently fell back to around $751 million. For ZEC, what is truly worth关注 is not the ETF’s “celebrity status” in name, but the fact that it has become an unavoidable supply-and-demand variable. This article analyzes the reasons from the perspectives of capital flows, share splits, fee structures, circulating supply, and the price mechanism—explaining why a small-cap cryptocurrency ETF can both amplify upward moves and, during redemptions, create rapid selling pressure.
19
1
70
·
--

Article
From “holding coins” to “spending coins”: Binance Pay integrates PayPay, and USDT is moving into Japan’s offline consumption sceneBinance Pay recently announced that eligible inbound international visitors to Japan can use cryptocurrencies to pay at merchants that support PayPay in Japan, with the merchants ultimately settling in Japanese yen. This means that digital assets such as USDT are entering Japan’s offline consumer scene for the first time via a more mainstream QR payment network. However, this service is not a “full-scale opening of crypto payments in Japan,” but rather a limited attempt aimed at inbound tourists, leveraging existing payment infrastructure. This article analyzes the practical usage conditions, payment process, promotional mechanisms, industry significance, and potential risks to help readers judge whether it is a genuinely usable consumer tool—or just another marketing event.
From “holding coins” to “spending coins”: Binance Pay integrates PayPay, and USDT is moving into Japan’s offline consumption scene
Binance Pay recently announced that eligible inbound international visitors to Japan can use cryptocurrencies to pay at merchants that support PayPay in Japan, with the merchants ultimately settling in Japanese yen. This means that digital assets such as USDT are entering Japan’s offline consumer scene for the first time via a more mainstream QR payment network. However, this service is not a “full-scale opening of crypto payments in Japan,” but rather a limited attempt aimed at inbound tourists, leveraging existing payment infrastructure. This article analyzes the practical usage conditions, payment process, promotional mechanisms, industry significance, and potential risks to help readers judge whether it is a genuinely usable consumer tool—or just another marketing event.
53
3
93
·
--

Article
Citigroup Raises Its Bitcoin and Ethereum Price Targets: A Window for Institutional Money to Return + Improved Macro Liquidity for CryptoCitigroup recently raised its 12-month target prices for bitcoin to $113,000 and for ethereum to $3,028. The key rationale points to a rebound in activity in the crypto market, a recovery in ETF inflows, and a macro environment that is more favorable to risk assets. If you look only at the target prices, this looks more like a round of “expectation adjustment.” But if you break down the driving factors, what is truly worth watching is whether institutional capital is shifting from “short-term speculation” to “sustained allocation.” This article examines the reasonableness of the current rally, potential bottlenecks, and what it means for different types of investors by combining Citigroup’s report logic, ETF fund flows, the U.S. dollar and Treasury environment, and recent U.S. regulatory developments.
Citigroup Raises Its Bitcoin and Ethereum Price Targets: A Window for Institutional Money to Return + Improved Macro Liquidity for Crypto
Citigroup recently raised its 12-month target prices for bitcoin to $113,000 and for ethereum to $3,028. The key rationale points to a rebound in activity in the crypto market, a recovery in ETF inflows, and a macro environment that is more favorable to risk assets. If you look only at the target prices, this looks more like a round of “expectation adjustment.” But if you break down the driving factors, what is truly worth watching is whether institutional capital is shifting from “short-term speculation” to “sustained allocation.” This article examines the reasonableness of the current rally, potential bottlenecks, and what it means for different types of investors by combining Citigroup’s report logic, ETF fund flows, the U.S. dollar and Treasury environment, and recent U.S. regulatory developments.
55
6
90
·
--
Article
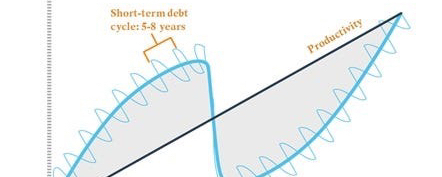
Bitcoin Under Debt-Machine Roar: When Dalio Meets the 2026 Q4 Crypto MarketRay Dalio’s “economic machine,” explained in 42 minutes, is now sending a harsh screech through the crypto market in October 2026. Bitcoin is hovering around $83,000, down 34% from the record high of $126,000 on October 12, 2025, yet it has still surged 44% within 90 days. This isn’t just simple price movement; it’s the inevitable result of the triple overlap of the short-term debt cycle (the Fed hiking rates to 3.75%–4%), the long-term debt cycle (the global debt-to-GDP ratio approaching historical extremes), and the productivity revolution (AI and tokenization). When the Fed faces a 64% probability of a rate decision on October 27–28, when Brent crude breaks above $100, and when daily inflows into Bitcoin ETFs plunge from $1 billion to $134 million—then we’re standing right at the critical point of what Dalio calls the “policy leverage failure.” This article will use the underlying logic of the economic machine to break down the crypto market’s true position right now, and provide actionable asset allocation principles.
Bitcoin Under Debt-Machine Roar: When Dalio Meets the 2026 Q4 Crypto Market
Ray Dalio’s “economic machine,” explained in 42 minutes, is now sending a harsh screech through the crypto market in October 2026. Bitcoin is hovering around $83,000, down 34% from the record high of $126,000 on October 12, 2025, yet it has still surged 44% within 90 days. This isn’t just simple price movement; it’s the inevitable result of the triple overlap of the short-term debt cycle (the Fed hiking rates to 3.75%–4%), the long-term debt cycle (the global debt-to-GDP ratio approaching historical extremes), and the productivity revolution (AI and tokenization). When the Fed faces a 64% probability of a rate decision on October 27–28, when Brent crude breaks above $100, and when daily inflows into Bitcoin ETFs plunge from $1 billion to $134 million—then we’re standing right at the critical point of what Dalio calls the “policy leverage failure.” This article will use the underlying logic of the economic machine to break down the crypto market’s true position right now, and provide actionable asset allocation principles.
81
7
300
·
--
Article
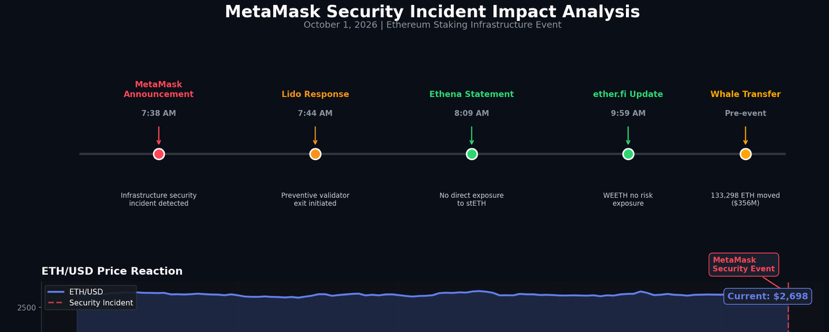
In-Depth Analysis of the MetaMask Staking Infrastructure Security Incident: Ethereum’s “Stress Test” and Market TakeawaysOn the morning of October 1, MetaMask Staking (formerly Consensys Staking) announced that some of its core infrastructure had suffered a security incident. As a precautionary measure, its Ethereum validators operating on Lido have begun主动退出 (voluntarily exiting) . The incident briefly drew market attention, but as of the time of writing, the ETH price has only fluctuated slightly, suggesting that the market’s “immunity” to such security events has been significantly strengthened. This article offers an in-depth analysis of the full picture of the incident, lays out a timeline of responses from various parties, assesses the actual impact on the Ethereum ecosystem, and discusses the long-term lessons this event holds for the security of decentralized staking infrastructure.
In-Depth Analysis of the MetaMask Staking Infrastructure Security Incident: Ethereum’s “Stress Test” and Market Takeaways
On the morning of October 1, MetaMask Staking (formerly Consensys Staking) announced that some of its core infrastructure had suffered a security incident. As a precautionary measure, its Ethereum validators operating on Lido have begun主动退出 (voluntarily exiting) . The incident briefly drew market attention, but as of the time of writing, the ETH price has only fluctuated slightly, suggesting that the market’s “immunity” to such security events has been significantly strengthened. This article offers an in-depth analysis of the full picture of the incident, lays out a timeline of responses from various parties, assesses the actual impact on the Ethereum ecosystem, and discusses the long-term lessons this event holds for the security of decentralized staking infrastructure.
20
2
395
·
--
Article
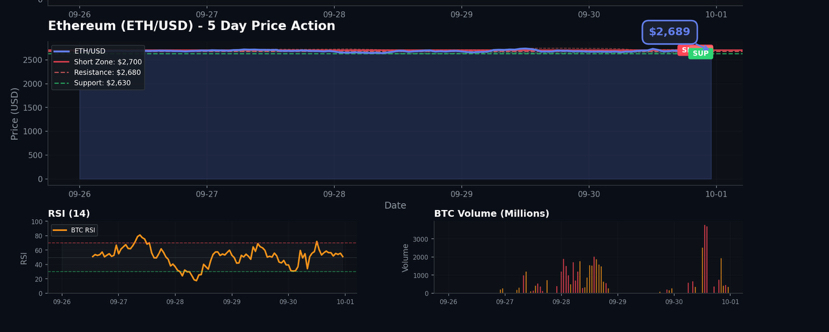
Oct 1 BTC/ETH Morning Strategy: After PCE-positive news, the rally fades and reverses—selling on rallies remains the main themeOn the first day of National Day, the cryptocurrency market continues to trade in a choppy range with ongoing consolidation and adjustment. Bitcoin is currently at $83,699, down slightly by 0.25% over the past 24 hours; Ethereum is at $2,689, essentially flat. After yesterday’s PCE data was released, bulls pushed higher to the $85,600 area on the news, but were quickly suppressed by strong bears and promptly fell back, completing a typical “short squeeze/short washout” type of move. On the 4-hour timeframe, the KDJ forms a bearish cross and turns downward; price has pulled back to the middle Bollinger Band, and the weak technical setup remains unchanged. With the Federal Reserve’s October 27–28 interest-rate decision meeting approaching and rate-hike expectations heating up, market risk appetite remains under sustained pressure, and ETF fund inflows have noticeably slowed. Combining the latest intraday market data with the macro backdrop, this article provides an in-depth analysis of the current market structure and offers specific, actionable trading strategies.
Oct 1 BTC/ETH Morning Strategy: After PCE-positive news, the rally fades and reverses—selling on rallies remains the main theme
On the first day of National Day, the cryptocurrency market continues to trade in a choppy range with ongoing consolidation and adjustment. Bitcoin is currently at $83,699, down slightly by 0.25% over the past 24 hours; Ethereum is at $2,689, essentially flat. After yesterday’s PCE data was released, bulls pushed higher to the $85,600 area on the news, but were quickly suppressed by strong bears and promptly fell back, completing a typical “short squeeze/short washout” type of move. On the 4-hour timeframe, the KDJ forms a bearish cross and turns downward; price has pulled back to the middle Bollinger Band, and the weak technical setup remains unchanged. With the Federal Reserve’s October 27–28 interest-rate decision meeting approaching and rate-hike expectations heating up, market risk appetite remains under sustained pressure, and ETF fund inflows have noticeably slowed. Combining the latest intraday market data with the macro backdrop, this article provides an in-depth analysis of the current market structure and offers specific, actionable trading strategies.
71
8
466
·
--
Article
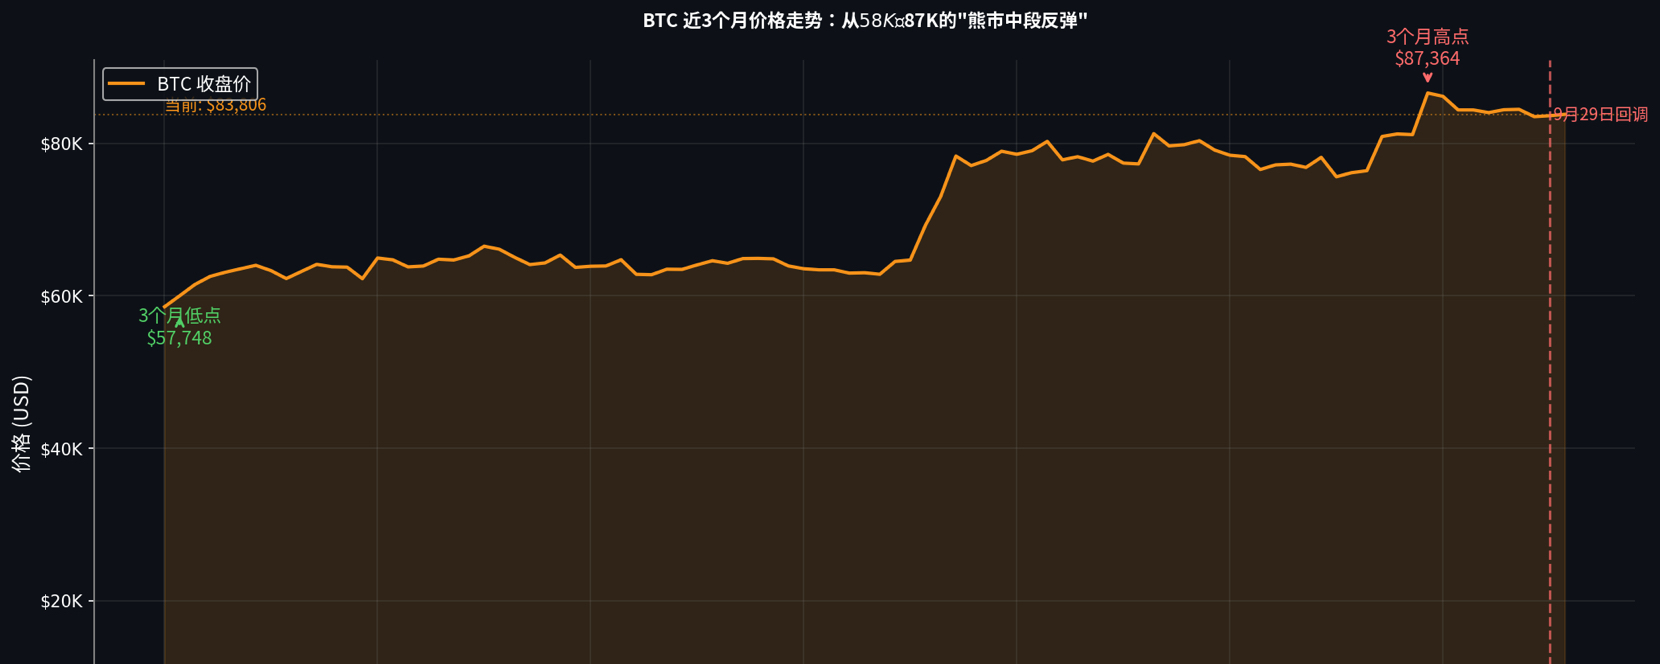
A "silent rebound" in the middle of a bear market: when institutions build a moat with put options, how should retail investors position themselves?September 29, Greeks.live analyst Adam characterized this round of Bitcoin pullback as a "mid-bear-market rebound." His core rationale is the triple contradiction shown in the options market: while prices rebound, implied volatility (IV) does not rise but instead falls to around 35%; the share of trading volume in large-size put options is as high as one-third; and the market’s expectations for subsequent volatility are extremely low. Combined with the latest market data—BTC rebounded from about $58K in early July all the way to $87K in mid-September, then pulled back and is currently consolidating around $83K—this article delves into the institutional behavioral logic behind this "low-volatility rebound," reveals the potential crisis of accumulating negative gamma risk, and provides actionable response strategies for investors with different risk appetites.
A "silent rebound" in the middle of a bear market: when institutions build a moat with put options, how should retail investors position themselves?
September 29, Greeks.live analyst Adam characterized this round of Bitcoin pullback as a "mid-bear-market rebound." His core rationale is the triple contradiction shown in the options market: while prices rebound, implied volatility (IV) does not rise but instead falls to around 35%; the share of trading volume in large-size put options is as high as one-third; and the market’s expectations for subsequent volatility are extremely low. Combined with the latest market data—BTC rebounded from about $58K in early July all the way to $87K in mid-September, then pulled back and is currently consolidating around $83K—this article delves into the institutional behavioral logic behind this "low-volatility rebound," reveals the potential crisis of accumulating negative gamma risk, and provides actionable response strategies for investors with different risk appetites.
52
4
567
·
--
Article
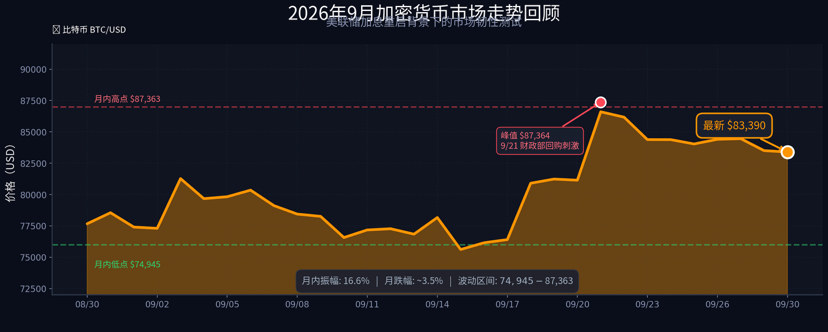
The Crypto Market Under the Restart of the Rate-Hike Cycle: Bitcoin Seeking a New Balance Between the "Currency Devaluation Trade" and "Liquidity Draining"September 2026 saw a profound shift in the global macro environment: after a three-year pause, the Federal Reserve restarted rate hikes, raising the federal funds rate to a 3.75%-4.00% range; the yield on the 10-year U.S. Treasury climbed to 5.20%, the highest level since 2007; and the yield on the 30-year U.S. Treasury broke above 5.5%, setting a new 22-year high. However, contrary to conventional expectations, Bitcoin did not collapse during the rate-hike cycle. Instead, it demonstrated rare resilience within a range of $75,000 to $87,000. This article provides an in-depth analysis of the dual-force game currently facing the crypto market: on one side, renewed liquidity tightening pressure brought about by the Federal Reserve restarting rate hikes; on the other, structural buy-side support re-ignited by the "currency devaluation trade." It also offers forward-looking judgment on market trends in Q4 and practical strategy recommendations.
The Crypto Market Under the Restart of the Rate-Hike Cycle: Bitcoin Seeking a New Balance Between the "Currency Devaluation Trade" and "Liquidity Draining"
September 2026 saw a profound shift in the global macro environment: after a three-year pause, the Federal Reserve restarted rate hikes, raising the federal funds rate to a 3.75%-4.00% range; the yield on the 10-year U.S. Treasury climbed to 5.20%, the highest level since 2007; and the yield on the 30-year U.S. Treasury broke above 5.5%, setting a new 22-year high. However, contrary to conventional expectations, Bitcoin did not collapse during the rate-hike cycle. Instead, it demonstrated rare resilience within a range of $75,000 to $87,000. This article provides an in-depth analysis of the dual-force game currently facing the crypto market: on one side, renewed liquidity tightening pressure brought about by the Federal Reserve restarting rate hikes; on the other, structural buy-side support re-ignited by the "currency devaluation trade." It also offers forward-looking judgment on market trends in Q4 and practical strategy recommendations.
66
1
7
395
·
--
Article
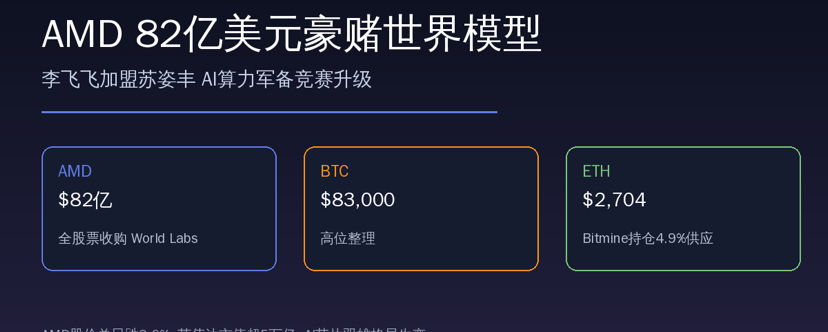
AMD’s $8.2 Billion Acquisition of World Labs: How Fei-Fei Li Joining Xu Zifeng and the AI Compute Arms Race Reshape the Logic Behind Crypto Assets?September 29, AMD announced an $8.2 billion all-stock acquisition of World Labs, founded by “the AI godmother” Fei-Fei Li. Not only does this deal signal that the rivalry between the two AI-chip giants has entered a new battleground—the “world model” arena—but at the macro level it also creates a subtle resonance with the crypto market. As AMD and Nvidia launch an arms race to capture the entry point for next-generation AI compute, Ethereum is emerging—thanks to institutional treasury allocations and staking rewards—as a core asset of the “on-chain settlement layer.” This article breaks down the strategic logic behind the deal and explores the deep connections between the expansion of AI compute and the capture of value by crypto assets.
AMD’s $8.2 Billion Acquisition of World Labs: How Fei-Fei Li Joining Xu Zifeng and the AI Compute Arms Race Reshape the Logic Behind Crypto Assets?
September 29, AMD announced an $8.2 billion all-stock acquisition of World Labs, founded by “the AI godmother” Fei-Fei Li. Not only does this deal signal that the rivalry between the two AI-chip giants has entered a new battleground—the “world model” arena—but at the macro level it also creates a subtle resonance with the crypto market. As AMD and Nvidia launch an arms race to capture the entry point for next-generation AI compute, Ethereum is emerging—thanks to institutional treasury allocations and staking rewards—as a core asset of the “on-chain settlement layer.” This article breaks down the strategic logic behind the deal and explores the deep connections between the expansion of AI compute and the capture of value by crypto assets.
62
1
6
365
·
--
Article
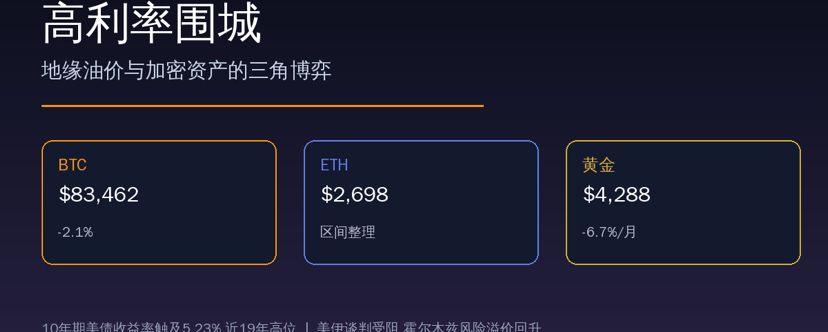
High-Interest-Rate Siege: The Triangular Game Between Geopolitical Oil Prices, US Treasury Yields, and Crypto AssetsThe global market is currently being dominated by a clear transmission chain—stalled US-Iran negotiations are pushing up oil prices and inflation expectations, while the yield on 10-year US Treasuries has hit a near-19-year high of 5.23%. Under the double blow of high interest rates and a strong US dollar, US stocks and gold are under pressure, while the crypto market is showing structural divergence amid macro headwinds and an ongoing tug-of-war involving institutional accumulation. Ethereum has demonstrated rare resilience thanks to sustained weekly institutional buying such as Bitmine (holdings have surpassed 6 million ETH, accounting for 4.9% of supply). $2,700 is a key dividing line between bulls and bears. This article breaks down the logic behind this complex landscape and explores potential breakout scenarios for Q4.
High-Interest-Rate Siege: The Triangular Game Between Geopolitical Oil Prices, US Treasury Yields, and Crypto Assets
The global market is currently being dominated by a clear transmission chain—stalled US-Iran negotiations are pushing up oil prices and inflation expectations, while the yield on 10-year US Treasuries has hit a near-19-year high of 5.23%. Under the double blow of high interest rates and a strong US dollar, US stocks and gold are under pressure, while the crypto market is showing structural divergence amid macro headwinds and an ongoing tug-of-war involving institutional accumulation. Ethereum has demonstrated rare resilience thanks to sustained weekly institutional buying such as Bitmine (holdings have surpassed 6 million ETH, accounting for 4.9% of supply). $2,700 is a key dividing line between bulls and bears. This article breaks down the logic behind this complex landscape and explores potential breakout scenarios for Q4.
66
1
4
509
·
--

Article
A single tweet ignites QNT: From the BIS unified ledger to the TCH partnership—was this breakout fueled by a new narrative or just an old bottle with a new label?Quant (QNT) surged as analysts publicly issued trading calls, with its single-day high rise reaching 145%, jumping 430% over four days, and then falling nearly 30% from the highs within a short period. The rise in QNT was not merely a matter of sentiment-driven speculation; it was driven by a combination of factors, including cooperation with the U.S. clearing organization TCH, the BIS unified ledger narrative, expectations around the Agora project, and the “historic halo” of a 2013 Bitcoin trading call. This article will break down the logic behind the rally, identify key risk points, and provide a practical tracking framework.
The crypto market is never short of stories about how a single sentence can change one’s fate, but cases like Quant (QNT)—which was pulled into a nearly twofold rally directly by a social media post—are still hard to overlook.
A single tweet ignites QNT: From the BIS unified ledger to the TCH partnership—was this breakout fueled by a new narrative or just an old bottle with a new label?
Quant (QNT) surged as analysts publicly issued trading calls, with its single-day high rise reaching 145%, jumping 430% over four days, and then falling nearly 30% from the highs within a short period. The rise in QNT was not merely a matter of sentiment-driven speculation; it was driven by a combination of factors, including cooperation with the U.S. clearing organization TCH, the BIS unified ledger narrative, expectations around the Agora project, and the “historic halo” of a 2013 Bitcoin trading call. This article will break down the logic behind the rally, identify key risk points, and provide a practical tracking framework.
The crypto market is never short of stories about how a single sentence can change one’s fate, but cases like Quant (QNT)—which was pulled into a nearly twofold rally directly by a social media post—are still hard to overlook.
The crypto market is never short of stories about how a single sentence can change one’s fate, but cases like Quant (QNT)—which was pulled into a nearly twofold rally directly by a social media post—are still hard to overlook.
20
3
424
·
--

Article
A Super-Macro Week Is Coming! Core PCE + Heavy Fed Commentary + Nonfarm Payrols—Crypto May Face a Major Reality CheckAfter a round of fake-and-follow mass rallying, the most uncertain variable in the crypto market is no longer just on-chain liquidity and in-market sentiment, but rather a repricing coming from the U.S. macro side. Over the coming week, key releases such as core PCE, ADP, and Nonfarm Payrolls, along with a flurry of remarks from multiple Federal Reserve officials, combined with major earnings reports from U.S. equities, will directly reshape rate expectations for the October FOMC meeting. We will fully break down event priority, the different market-play scenarios tied to each data release, and practical monitoring and risk-control approaches that ordinary people can actually implement.
In recent times, many people’s attention has been focused on the on-chain side: Total2 continues to rise, many low-quality tokens have moved above the 200-day moving average, and whale transfers along with ETF fund flows have become key topics of discussion.
A Super-Macro Week Is Coming! Core PCE + Heavy Fed Commentary + Nonfarm Payrols—Crypto May Face a Major Reality Check
After a round of fake-and-follow mass rallying, the most uncertain variable in the crypto market is no longer just on-chain liquidity and in-market sentiment, but rather a repricing coming from the U.S. macro side. Over the coming week, key releases such as core PCE, ADP, and Nonfarm Payrolls, along with a flurry of remarks from multiple Federal Reserve officials, combined with major earnings reports from U.S. equities, will directly reshape rate expectations for the October FOMC meeting. We will fully break down event priority, the different market-play scenarios tied to each data release, and practical monitoring and risk-control approaches that ordinary people can actually implement.
In recent times, many people’s attention has been focused on the on-chain side: Total2 continues to rise, many low-quality tokens have moved above the 200-day moving average, and whale transfers along with ETF fund flows have become key topics of discussion.
In recent times, many people’s attention has been focused on the on-chain side: Total2 continues to rise, many low-quality tokens have moved above the 200-day moving average, and whale transfers along with ETF fund flows have become key topics of discussion.
83
1
8
449
·
--
Article
87% of altcoins are above the 200-day moving average! Behind the $371 billion surge, a set of dangerous signals has already lit upFrom June to now, Total2 (including ETH, excluding BTC) has absorbed over $371 billion in net inflows, up 45%. The vast majority of altcoins have escaped the long-term bear-market structure, and the market has entered a broad-based rally frenzy. But CryptoQuant’s latest on-chain data shows something at the same time: a sharp rebound in exchange deposits, and Total2 displaying a bearish RSI divergence. Is this truly the start of an altcoin season, or is it a phase of distribution that requires high vigilance? We won’t hype bullish or call for bearishness—let’s fully break down the data, historical patterns, and actionable observation criteria for you.
What gives most people the feeling that “the bull market is back” lately is not that BTC is making fresh highs, but that almost everywhere there are altcoins going up.
87% of altcoins are above the 200-day moving average! Behind the $371 billion surge, a set of dangerous signals has already lit up
From June to now, Total2 (including ETH, excluding BTC) has absorbed over $371 billion in net inflows, up 45%. The vast majority of altcoins have escaped the long-term bear-market structure, and the market has entered a broad-based rally frenzy. But CryptoQuant’s latest on-chain data shows something at the same time: a sharp rebound in exchange deposits, and Total2 displaying a bearish RSI divergence. Is this truly the start of an altcoin season, or is it a phase of distribution that requires high vigilance? We won’t hype bullish or call for bearishness—let’s fully break down the data, historical patterns, and actionable observation criteria for you.
What gives most people the feeling that “the bull market is back” lately is not that BTC is making fresh highs, but that almost everywhere there are altcoins going up.
What gives most people the feeling that “the bull market is back” lately is not that BTC is making fresh highs, but that almost everywhere there are altcoins going up.
139
8
562
Log in to explore more content
Join global crypto users on Binance Square
⚡️ Get latest and useful information about crypto.
💬 Trusted by the world’s largest crypto exchange.
👍 Discover real insights from verified creators.
Email / Phone number
Trending Topics
FedMinutesFocusOnOctoberPause
77,751 views
932 Discussing
🚨 HIGH ALERT ‼️ PLEASE DON’T TRADE BLINDLY FOR THE NEXT HOUR 🚨
Guys, we have FOMC Minutes coming in less than 1 hour.
And after the kind of volatility we already saw today, I really don’t want anyone opening random high-leverage positions just before this release.
The biggest reaction I’m watching will be in Gold (XAU), Silver (XAG), BTC and ETH. Then coins like SOL and other highly leveraged mid/low-cap alts can exaggerate whatever move BTC makes.
Gold and Silver are especially sensitive tonight because the market is already reacting to the US dollar + Treasury yields, and both metals have been under heavy pressure ahead of the Fed minutes.
Briefly speaking
📉Hawkish Fed Minutes → Dollar/yields can push higher → pressure on BTC, crypto, Gold & silver
📈Dovish Fed Minutes → Dollar/yields can cool → BTC, Gold, Silver and risk assets can bounce hard.
And please remember the first candle can be a trap. We can get a pump, immediate dump, liquidations on both sides, and then the real direction.
So for now, protect your positions, reduce unnecessary leverage and don’t FOMO into the first move.
Tonight I’m watching $XAU , $XAG and $BTC first. These will tell us very quickly how the market is reading the Fed.
I will Update you guys on time
Follow @Panda Traders and Turn on Your notifications right now
#FedMinutesFocusOnOctoberPause
Panda Traders
·14 Likes
·2.6k views
BinanceLaunchesBinanceIntelligence
1M views
6,193 Discussing
EvernorthDelaysNasdaqDebutToOct12
4,220 views
179 Discussing