

Giannis Andreou
1.3k Posts

Giannis Andreou
Report
Block User
Crypto analyst. 2000 Video content on YouTube - Giannis Andreou | Bitmern Mining Founder & CEO | Author
1.4K+ Following
29.3K+ Followers
19.9K+ Liked
Posts
All
Quotes
Videos
Live
PINNED
🔥 Throwback to One of My Most Insightful Crypto Conversations! 🔥
Two years ago, I had the chance to sit down with CZ for a deep dive into the future of Web3, the challenges of global adoption, and the mindset behind building in a fast-moving crypto world.
From discussing Bitcoin’s resilience 🟧, to the rise of BNB 🚀, to exploring how stablecoins would reshape global finance 💴 → it was one of those conversations that sticks with you long after the cameras stop rolling.
If you missed it back then, now’s the perfect time to revisit it— the insights are still gold. ✨
$BTC $ETH $BNB
🔥 Throwback to One of My Most Insightful Crypto Conversations! 🔥
Two years ago, I had the chance to sit down with CZ for a deep dive into the future of Web3, the challenges of global adoption, and the mindset behind building in a fast-moving crypto world.
From discussing Bitcoin’s resilience 🟧, to the rise of BNB 🚀, to exploring how stablecoins would reshape global finance 💴 → it was one of those conversations that sticks with you long after the cameras stop rolling.
If you missed it back then, now’s the perfect time to revisit it— the insights are still gold. ✨
$BTC $ETH $BNB
Two years ago, I had the chance to sit down with CZ for a deep dive into the future of Web3, the challenges of global adoption, and the mindset behind building in a fast-moving crypto world.
From discussing Bitcoin’s resilience 🟧, to the rise of BNB 🚀, to exploring how stablecoins would reshape global finance 💴 → it was one of those conversations that sticks with you long after the cameras stop rolling.
If you missed it back then, now’s the perfect time to revisit it— the insights are still gold. ✨
$BTC $ETH $BNB
26
18
159
51.5k
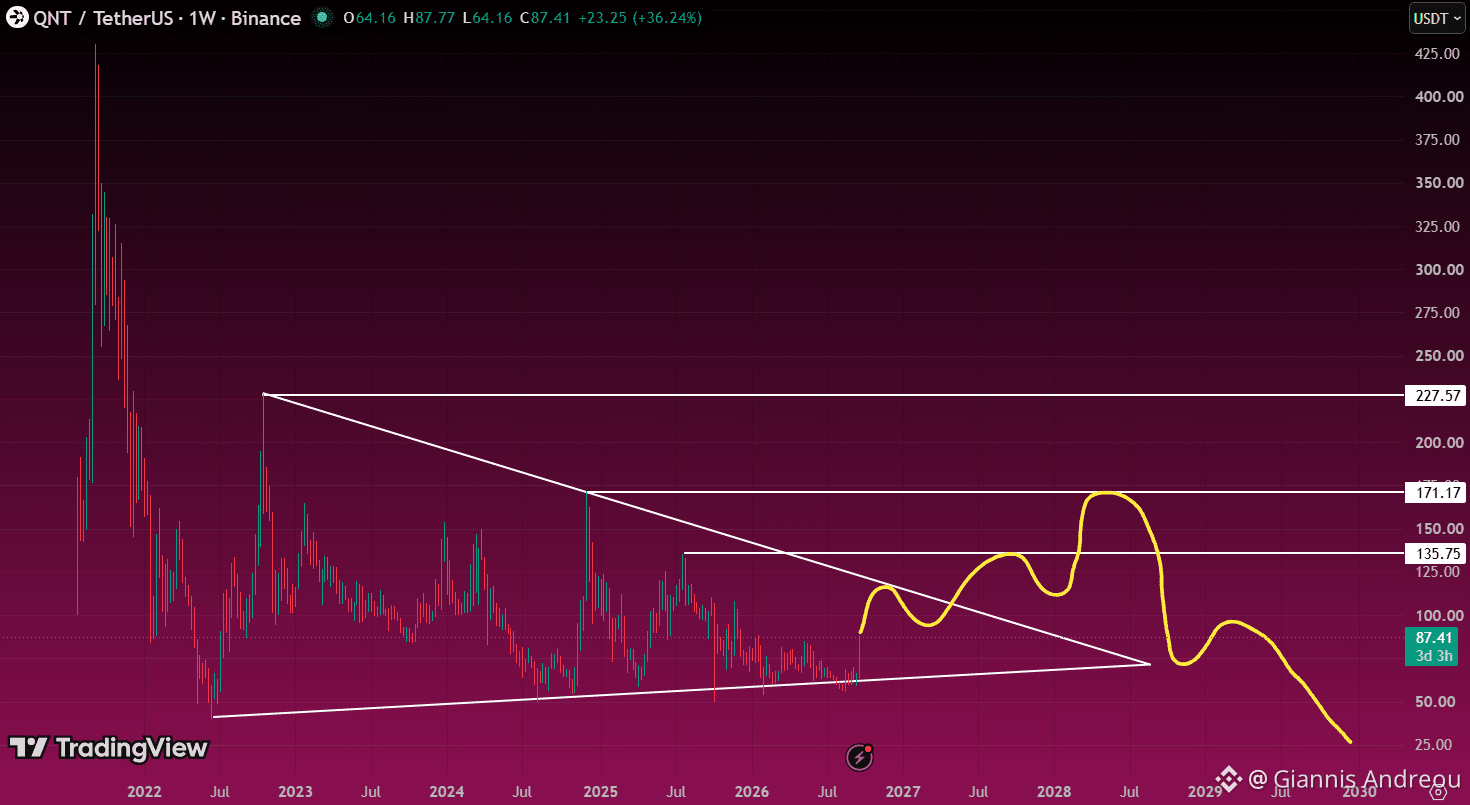
⚪ $QNT: A BIG BOUNCE INSIDE A BIGGER SQUEEZE
$QNT is rebounding from its rising support line, but price remains inside the multi-year triangle. The descending trendline is the next major test.
A weekly breakout and successful retest would strengthen the case for $135.75, followed by $171.17.
My drawn scenario allows that recovery before a potential rejection. A sustained break above $171.17 would challenge that bearish second leg and bring $227.57 into focus.
Lose the rising support near $60–$65 instead, and the recovery setup weakens.
The weekly candle is still open. The projected path is conditional, not a timetable.
Nothing is guaranteed. Do Your Own Research.
⚪ $QNT: A BIG BOUNCE INSIDE A BIGGER SQUEEZE
$QNT is rebounding from its rising support line, but price remains inside the multi-year triangle. The descending trendline is the next major test.
A weekly breakout and successful retest would strengthen the case for $135.75, followed by $171.17.
My drawn scenario allows that recovery before a potential rejection. A sustained break above $171.17 would challenge that bearish second leg and bring $227.57 into focus.
Lose the rising support near $60–$65 instead, and the recovery setup weakens.
The weekly candle is still open. The projected path is conditional, not a timetable.
Nothing is guaranteed. Do Your Own Research.
$QNT is rebounding from its rising support line, but price remains inside the multi-year triangle. The descending trendline is the next major test.
A weekly breakout and successful retest would strengthen the case for $135.75, followed by $171.17.
My drawn scenario allows that recovery before a potential rejection. A sustained break above $171.17 would challenge that bearish second leg and bring $227.57 into focus.
Lose the rising support near $60–$65 instead, and the recovery setup weakens.
The weekly candle is still open. The projected path is conditional, not a timetable.
Nothing is guaranteed. Do Your Own Research.
26
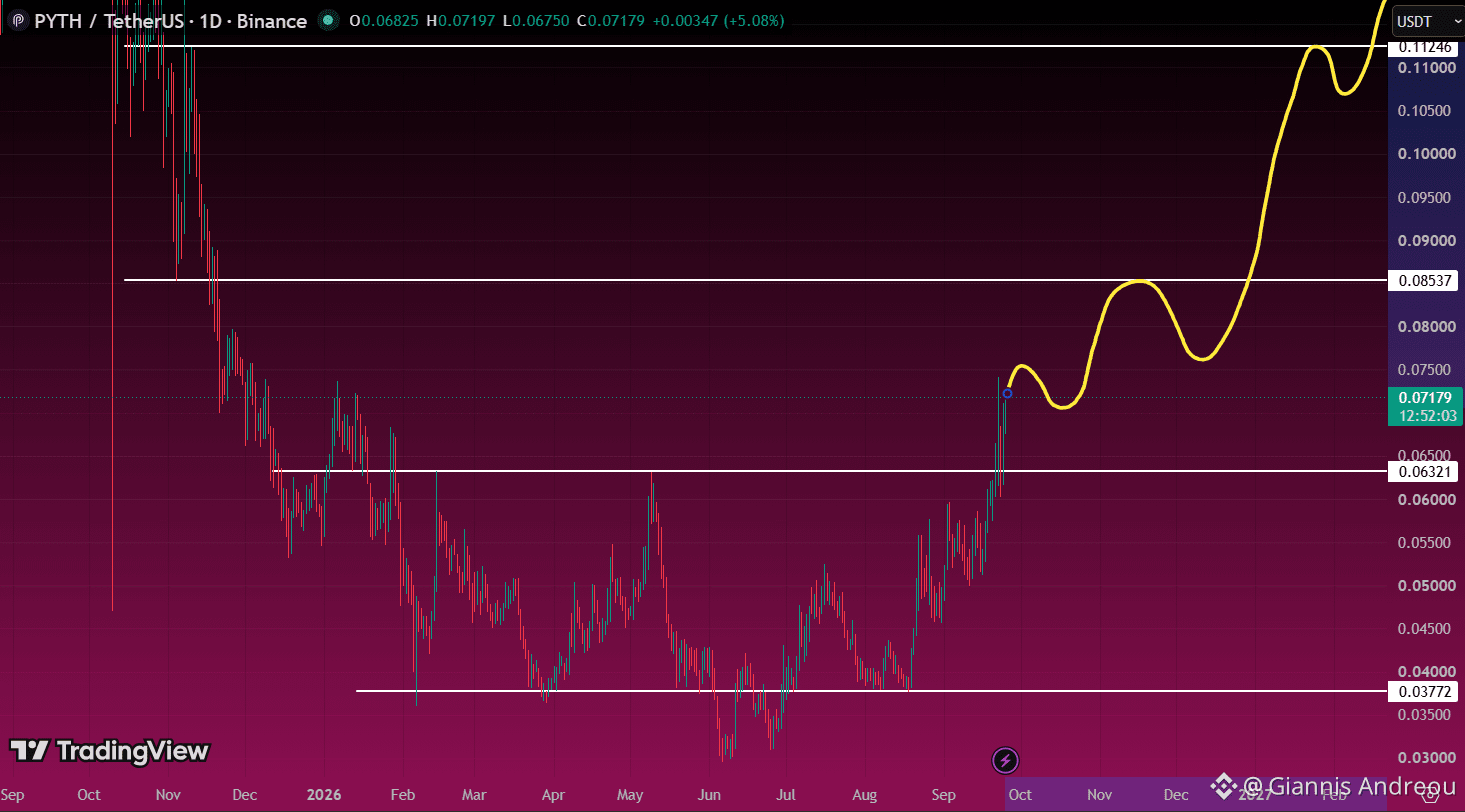
🟣 $PYTH: THE RECOVERY HAS ITS FIRST REAL TEST.
PYTH has pushed above $0.0632 after building a base around $0.0377.
Now the key is holding that reclaimed level on a pullback. If buyers defend it, $0.0854 becomes the next resistance to watch.
Break above that and hold the retest, and $0.1125 comes into focus.
Lose $0.0632, and the bullish setup weakens, bringing $0.050 back into play.
The yellow path is a scenario. Each breakout still needs confirmation.
Nothing is guaranteed. Do Your Own Research.
🟣 $PYTH: THE RECOVERY HAS ITS FIRST REAL TEST.
PYTH has pushed above $0.0632 after building a base around $0.0377.
Now the key is holding that reclaimed level on a pullback. If buyers defend it, $0.0854 becomes the next resistance to watch.
Break above that and hold the retest, and $0.1125 comes into focus.
Lose $0.0632, and the bullish setup weakens, bringing $0.050 back into play.
The yellow path is a scenario. Each breakout still needs confirmation.
Nothing is guaranteed. Do Your Own Research.
PYTH has pushed above $0.0632 after building a base around $0.0377.
Now the key is holding that reclaimed level on a pullback. If buyers defend it, $0.0854 becomes the next resistance to watch.
Break above that and hold the retest, and $0.1125 comes into focus.
Lose $0.0632, and the bullish setup weakens, bringing $0.050 back into play.
The yellow path is a scenario. Each breakout still needs confirmation.
Nothing is guaranteed. Do Your Own Research.
25
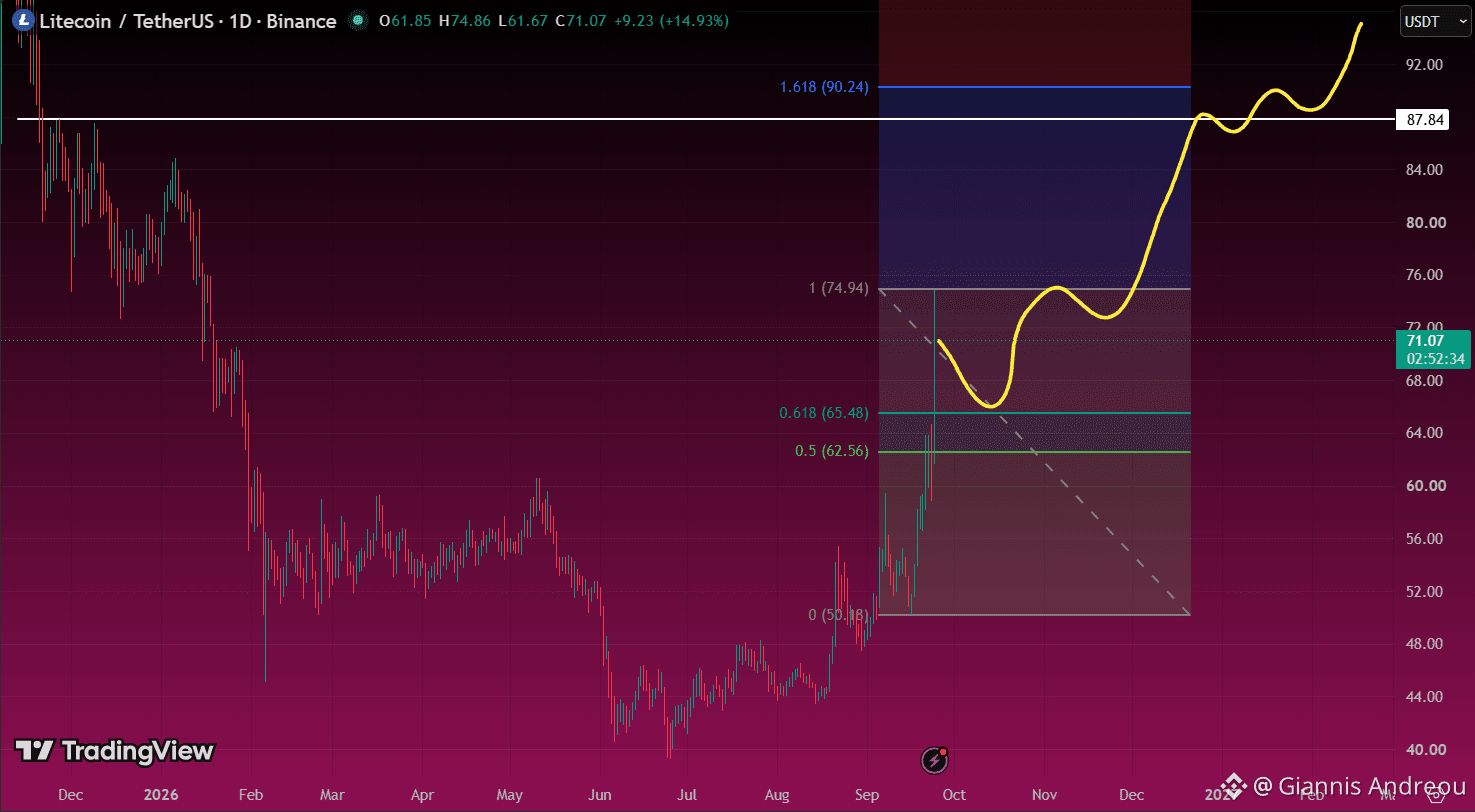
⚡ $LTC: THE NEXT DIP COULD BE THE REAL TEST
After a sharp rally, I’m watching a potential pullback toward $65.48. The broader support zone sits at $62.56–$65.48, matching the marked 0.5–0.618 Fibonacci levels.
Hold that zone and reclaim $74.94, and $87.84–$90.24 becomes the next major area to watch. Historical resistance and the 1.618 extension sit close together there.
My bullish scenario is a retest first, then continuation. A daily close below $62.56 would weaken that setup.
The current daily candle is still open. Let the close confirm the move.
Nothing is guaranteed. Do Your Own Research.
⚡ $LTC: THE NEXT DIP COULD BE THE REAL TEST
After a sharp rally, I’m watching a potential pullback toward $65.48. The broader support zone sits at $62.56–$65.48, matching the marked 0.5–0.618 Fibonacci levels.
Hold that zone and reclaim $74.94, and $87.84–$90.24 becomes the next major area to watch. Historical resistance and the 1.618 extension sit close together there.
My bullish scenario is a retest first, then continuation. A daily close below $62.56 would weaken that setup.
The current daily candle is still open. Let the close confirm the move.
Nothing is guaranteed. Do Your Own Research.
After a sharp rally, I’m watching a potential pullback toward $65.48. The broader support zone sits at $62.56–$65.48, matching the marked 0.5–0.618 Fibonacci levels.
Hold that zone and reclaim $74.94, and $87.84–$90.24 becomes the next major area to watch. Historical resistance and the 1.618 extension sit close together there.
My bullish scenario is a retest first, then continuation. A daily close below $62.56 would weaken that setup.
The current daily candle is still open. Let the close confirm the move.
Nothing is guaranteed. Do Your Own Research.
32
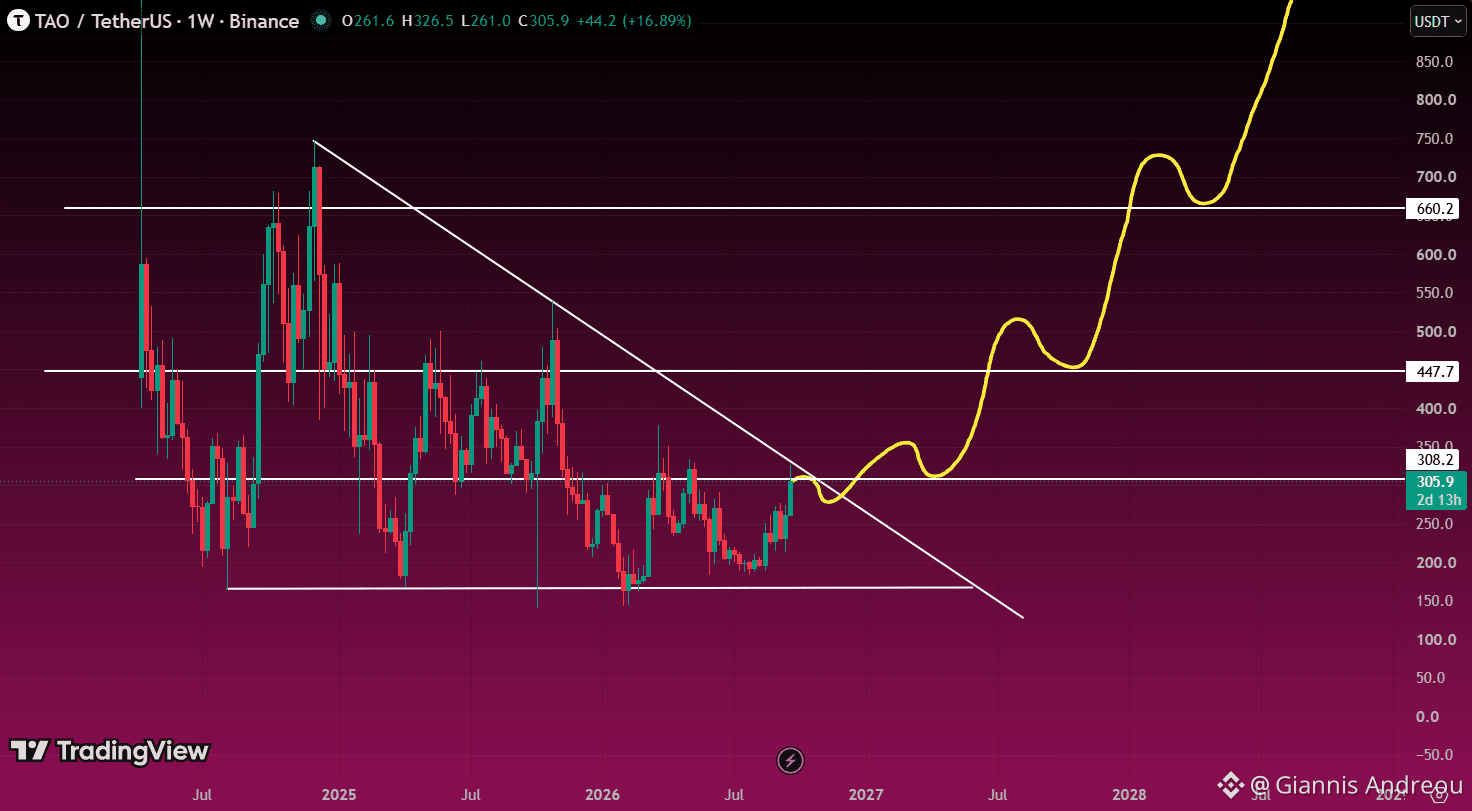
⚪ $TAO: WAITING FOR THE TRIANGLE TO BREAK.
TAO is approaching descending resistance on the weekly chart, with $308.2 adding another hurdle nearby.
I’m waiting for a weekly close above both, followed by a retest that holds.
That would strengthen the bullish scenario toward $447.7, then $660.2. Turning those levels into support could open the path toward the previous highs.
Until the breakout confirms, price remains inside the triangle. Rejection keeps another move toward $200–$165 in play.
Nothing is guaranteed. Do Your Own Research.
⚪ $TAO: WAITING FOR THE TRIANGLE TO BREAK.
TAO is approaching descending resistance on the weekly chart, with $308.2 adding another hurdle nearby.
I’m waiting for a weekly close above both, followed by a retest that holds.
That would strengthen the bullish scenario toward $447.7, then $660.2. Turning those levels into support could open the path toward the previous highs.
Until the breakout confirms, price remains inside the triangle. Rejection keeps another move toward $200–$165 in play.
Nothing is guaranteed. Do Your Own Research.
TAO is approaching descending resistance on the weekly chart, with $308.2 adding another hurdle nearby.
I’m waiting for a weekly close above both, followed by a retest that holds.
That would strengthen the bullish scenario toward $447.7, then $660.2. Turning those levels into support could open the path toward the previous highs.
Until the breakout confirms, price remains inside the triangle. Rejection keeps another move toward $200–$165 in play.
Nothing is guaranteed. Do Your Own Research.
48
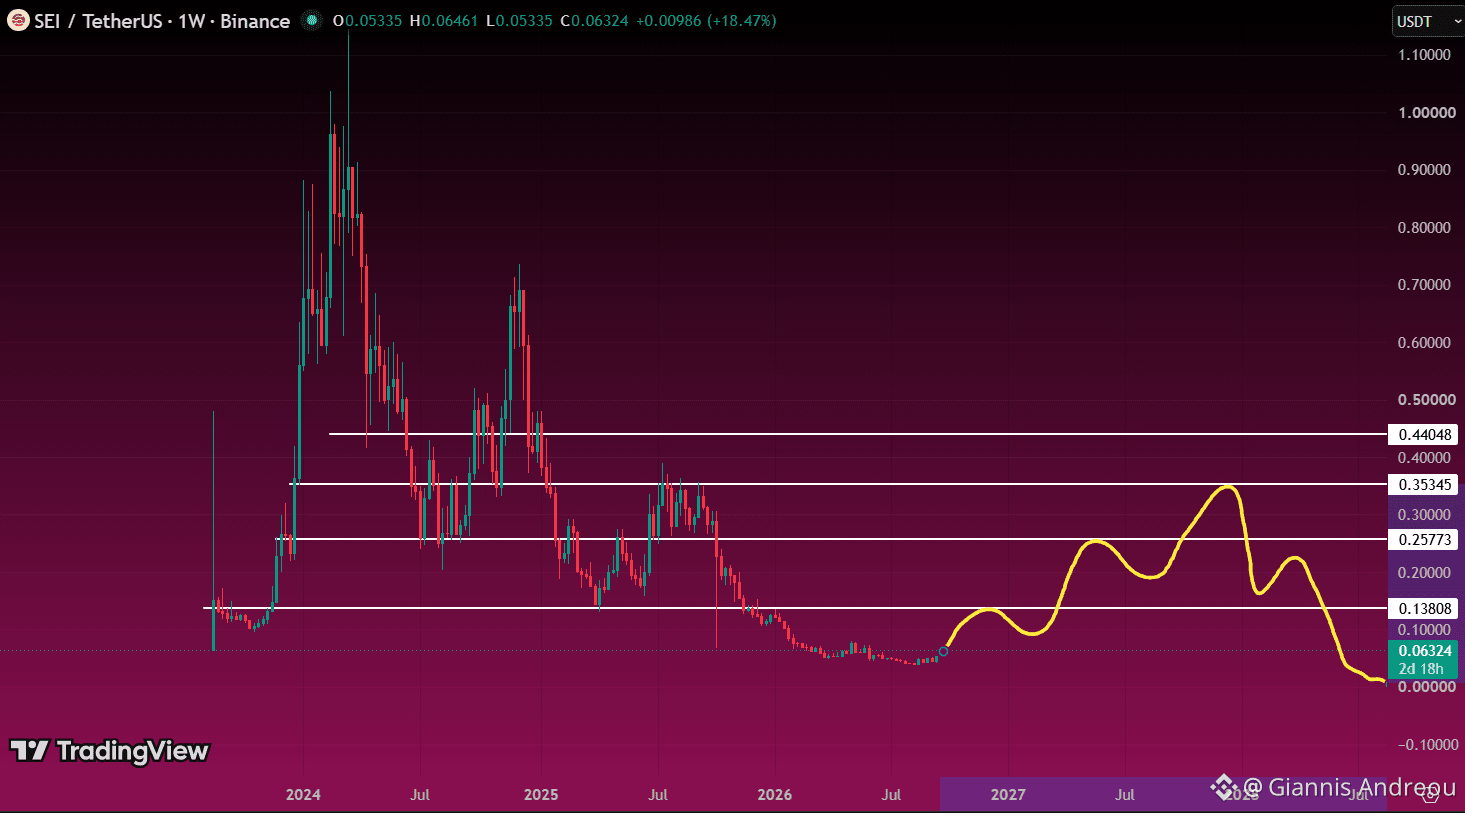
🔴 $SEI: A BIG RALLY CAN STILL END IN A LOWER HIGH.
My drawn scenario starts with a recovery toward $0.138. A weekly breakout and successful retest would bring $0.258, then $0.353 into focus.
That’s where I’d watch closely for exhaustion. Even reaching those levels would leave SEI well below its previous cycle peak.
Rejection followed by a lower high could set up another major decline. Sustained strength above $0.353–$0.440 would challenge that bearish second leg.
The yellow path is a scenario, not a prediction of zero.
Nothing is guaranteed. Do Your Own Research.
🔴 $SEI: A BIG RALLY CAN STILL END IN A LOWER HIGH.
My drawn scenario starts with a recovery toward $0.138. A weekly breakout and successful retest would bring $0.258, then $0.353 into focus.
That’s where I’d watch closely for exhaustion. Even reaching those levels would leave SEI well below its previous cycle peak.
Rejection followed by a lower high could set up another major decline. Sustained strength above $0.353–$0.440 would challenge that bearish second leg.
The yellow path is a scenario, not a prediction of zero.
Nothing is guaranteed. Do Your Own Research.
My drawn scenario starts with a recovery toward $0.138. A weekly breakout and successful retest would bring $0.258, then $0.353 into focus.
That’s where I’d watch closely for exhaustion. Even reaching those levels would leave SEI well below its previous cycle peak.
Rejection followed by a lower high could set up another major decline. Sustained strength above $0.353–$0.440 would challenge that bearish second leg.
The yellow path is a scenario, not a prediction of zero.
Nothing is guaranteed. Do Your Own Research.
1
42
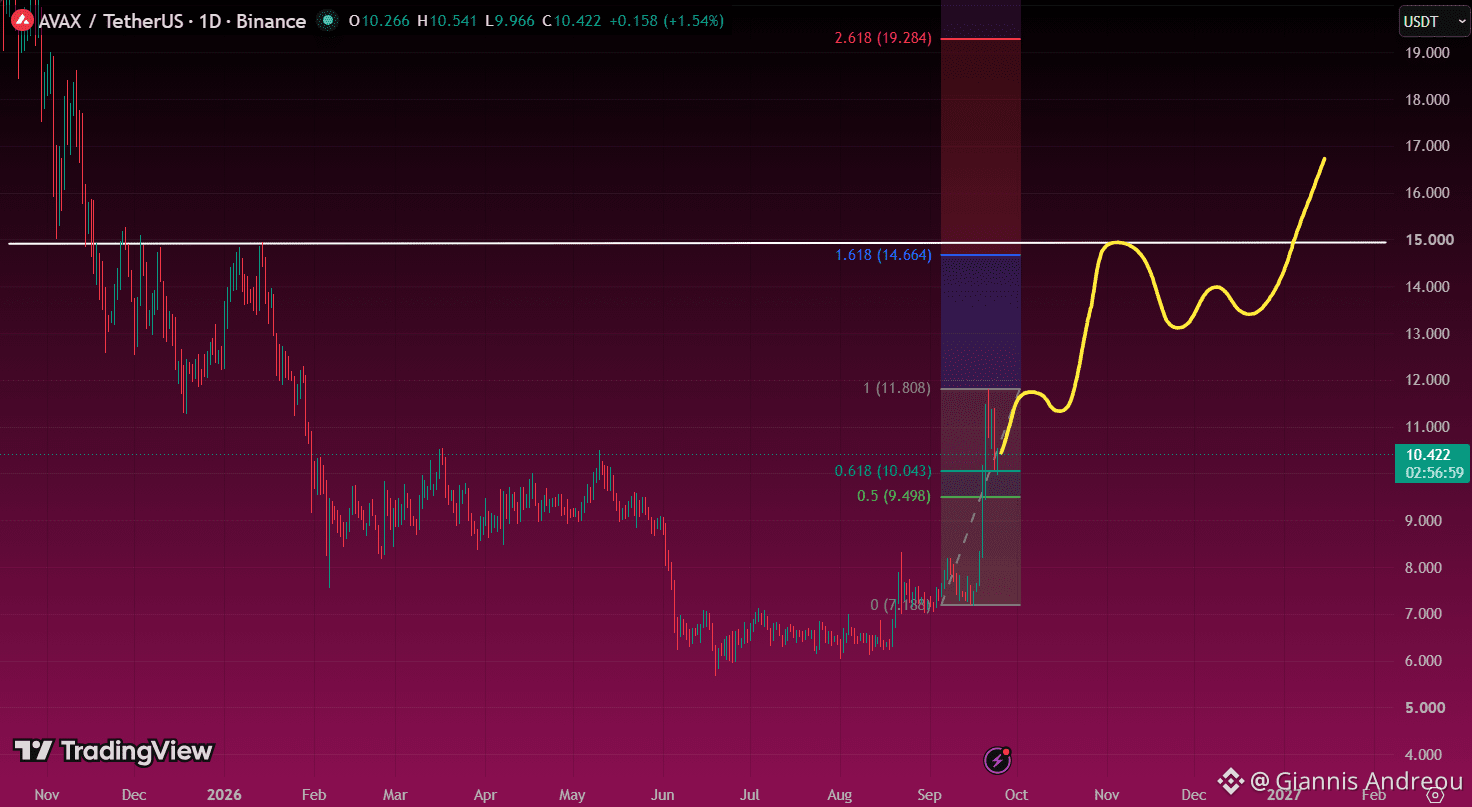
🔺 $AVAX: THE PULLBACK THAT COULD SET UP ROUND TWO
$AVAX is testing the $10 area after its sharp rally. I’m watching $9.50–$10.04 as the support zone for this setup.
Hold that zone and reclaim $11.81, and the next upside area is $14.66–$15.00, where the 1.618 Fibonacci extension meets historical resistance.
That’s where I’d expect a tougher test. A breakout and successful retest would strengthen the case for $16–$17.
A daily close below $9.50 would weaken this scenario and put the breakout base near $7.20 back on the radar.
Nothing is guaranteed. Do Your Own Research.
🔺 $AVAX: THE PULLBACK THAT COULD SET UP ROUND TWO
$AVAX is testing the $10 area after its sharp rally. I’m watching $9.50–$10.04 as the support zone for this setup.
Hold that zone and reclaim $11.81, and the next upside area is $14.66–$15.00, where the 1.618 Fibonacci extension meets historical resistance.
That’s where I’d expect a tougher test. A breakout and successful retest would strengthen the case for $16–$17.
A daily close below $9.50 would weaken this scenario and put the breakout base near $7.20 back on the radar.
Nothing is guaranteed. Do Your Own Research.
$AVAX is testing the $10 area after its sharp rally. I’m watching $9.50–$10.04 as the support zone for this setup.
Hold that zone and reclaim $11.81, and the next upside area is $14.66–$15.00, where the 1.618 Fibonacci extension meets historical resistance.
That’s where I’d expect a tougher test. A breakout and successful retest would strengthen the case for $16–$17.
A daily close below $9.50 would weaken this scenario and put the breakout base near $7.20 back on the radar.
Nothing is guaranteed. Do Your Own Research.
21
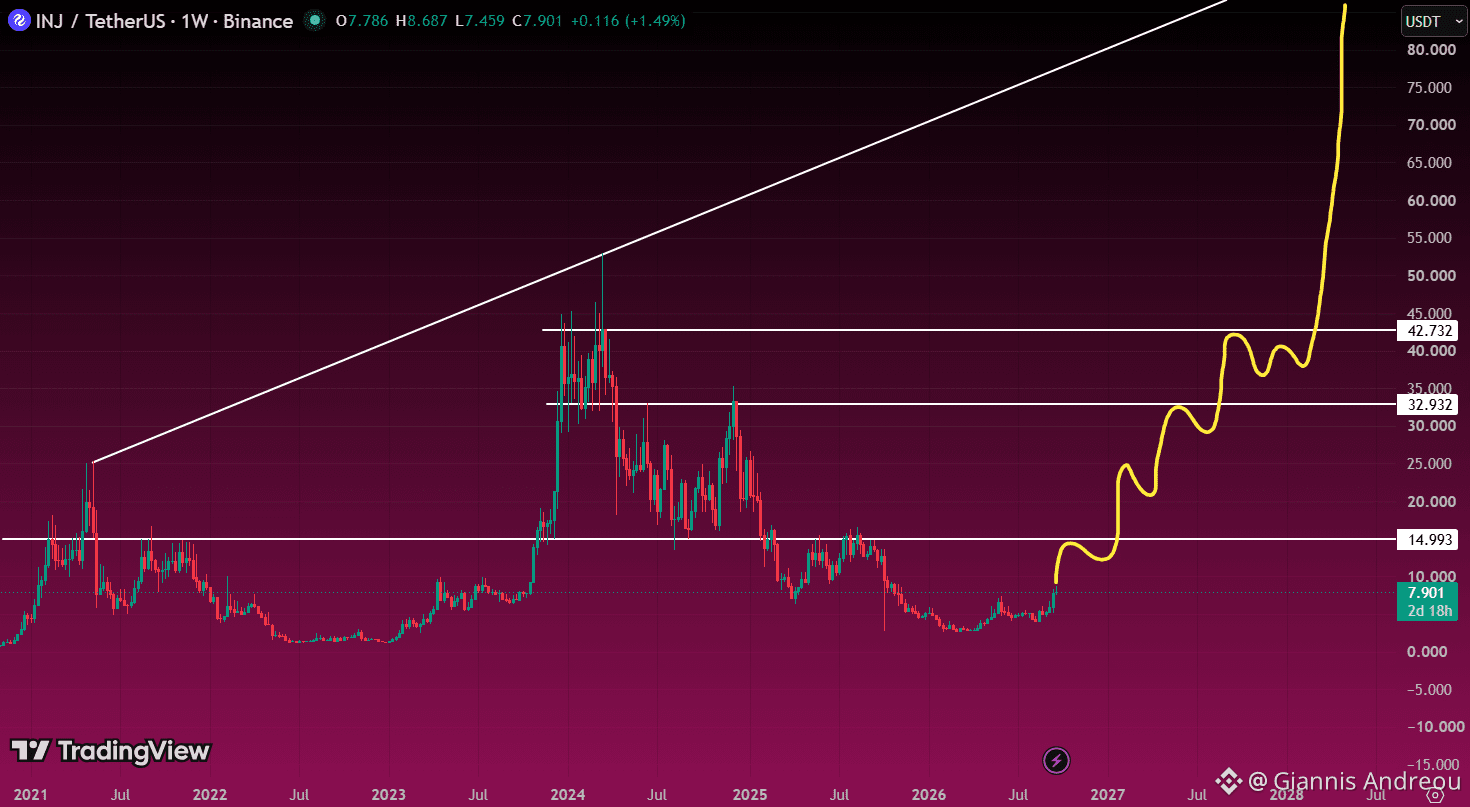
🔵 $INJ: THE COMEBACK HAS LEVELS TO CLEAR.
INJ is recovering from its recent base, but $15 remains the first major resistance on this weekly chart.
Reclaim it and hold the retest, and the recovery could extend toward $20–$25, then $32.93 and $42.73.
My bullish scenario builds through those levels before challenging the previous peak near $53. The drawn $80+ extension depends on that breakout actually happening.
Losing the recent base around $3–$4 would undermine the setup.
Nothing is guaranteed. Do Your Own Research.
🔵 $INJ: THE COMEBACK HAS LEVELS TO CLEAR.
INJ is recovering from its recent base, but $15 remains the first major resistance on this weekly chart.
Reclaim it and hold the retest, and the recovery could extend toward $20–$25, then $32.93 and $42.73.
My bullish scenario builds through those levels before challenging the previous peak near $53. The drawn $80+ extension depends on that breakout actually happening.
Losing the recent base around $3–$4 would undermine the setup.
Nothing is guaranteed. Do Your Own Research.
INJ is recovering from its recent base, but $15 remains the first major resistance on this weekly chart.
Reclaim it and hold the retest, and the recovery could extend toward $20–$25, then $32.93 and $42.73.
My bullish scenario builds through those levels before challenging the previous peak near $53. The drawn $80+ extension depends on that breakout actually happening.
Losing the recent base around $3–$4 would undermine the setup.
Nothing is guaranteed. Do Your Own Research.
1
53
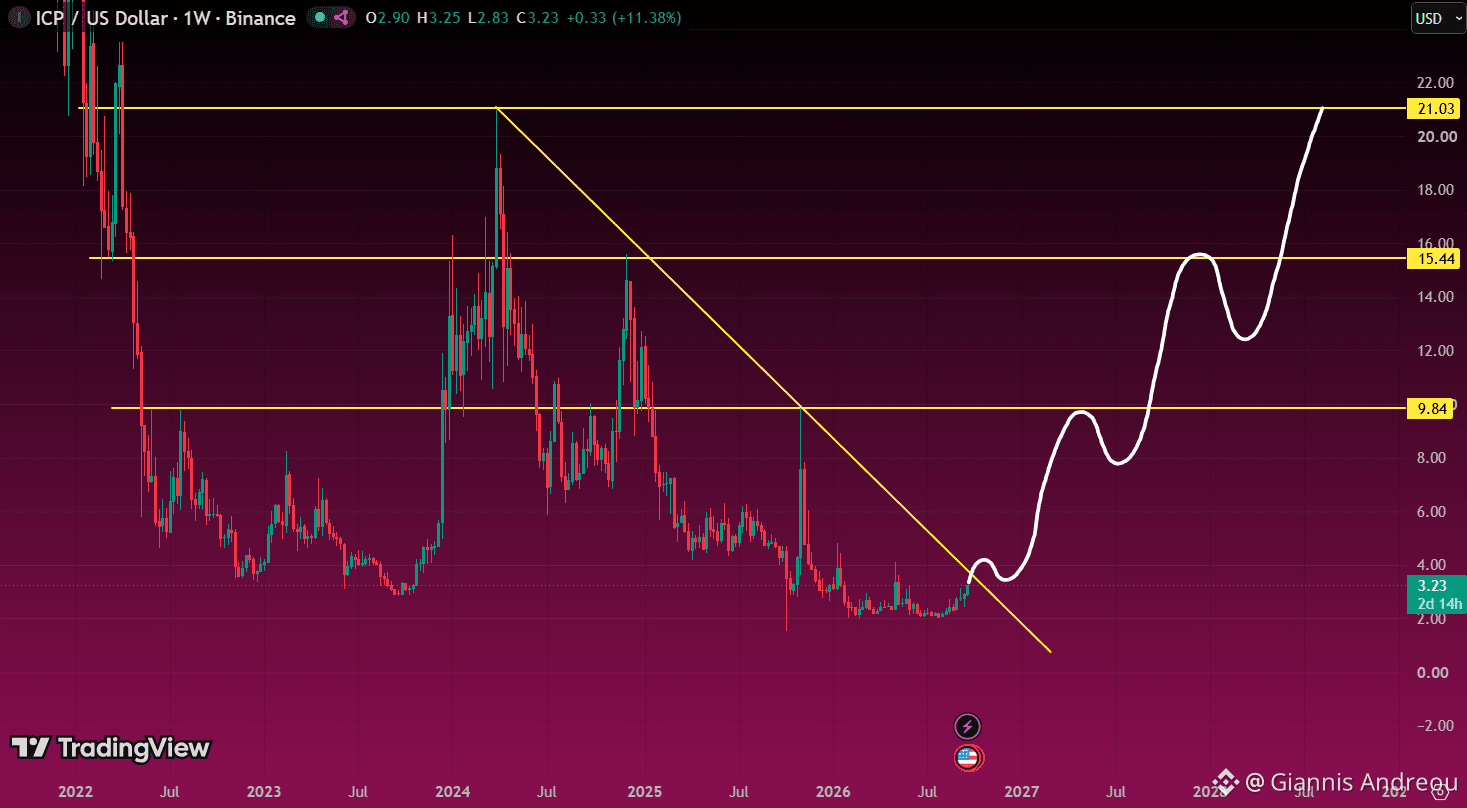
⚪ $ICP: ONE TRENDLINE COULD CHANGE THE PICTURE.
$ICP is approaching the descending trendline from its 2024 peak.
If it breaks above and holds a successful weekly retest, the recovery could start building toward $5–$6, then the major resistance at $9.84.
My broader bullish scenario puts $15.44 and $21.03 on the map, provided each breakout holds and higher lows keep forming.
Until that trendline clears, this remains an unconfirmed setup. Rejection could send price back toward the base near $2.
Nothing is guaranteed. Do Your Own Research.
⚪ $ICP: ONE TRENDLINE COULD CHANGE THE PICTURE.
$ICP is approaching the descending trendline from its 2024 peak.
If it breaks above and holds a successful weekly retest, the recovery could start building toward $5–$6, then the major resistance at $9.84.
My broader bullish scenario puts $15.44 and $21.03 on the map, provided each breakout holds and higher lows keep forming.
Until that trendline clears, this remains an unconfirmed setup. Rejection could send price back toward the base near $2.
Nothing is guaranteed. Do Your Own Research.
$ICP is approaching the descending trendline from its 2024 peak.
If it breaks above and holds a successful weekly retest, the recovery could start building toward $5–$6, then the major resistance at $9.84.
My broader bullish scenario puts $15.44 and $21.03 on the map, provided each breakout holds and higher lows keep forming.
Until that trendline clears, this remains an unconfirmed setup. Rejection could send price back toward the base near $2.
Nothing is guaranteed. Do Your Own Research.
70
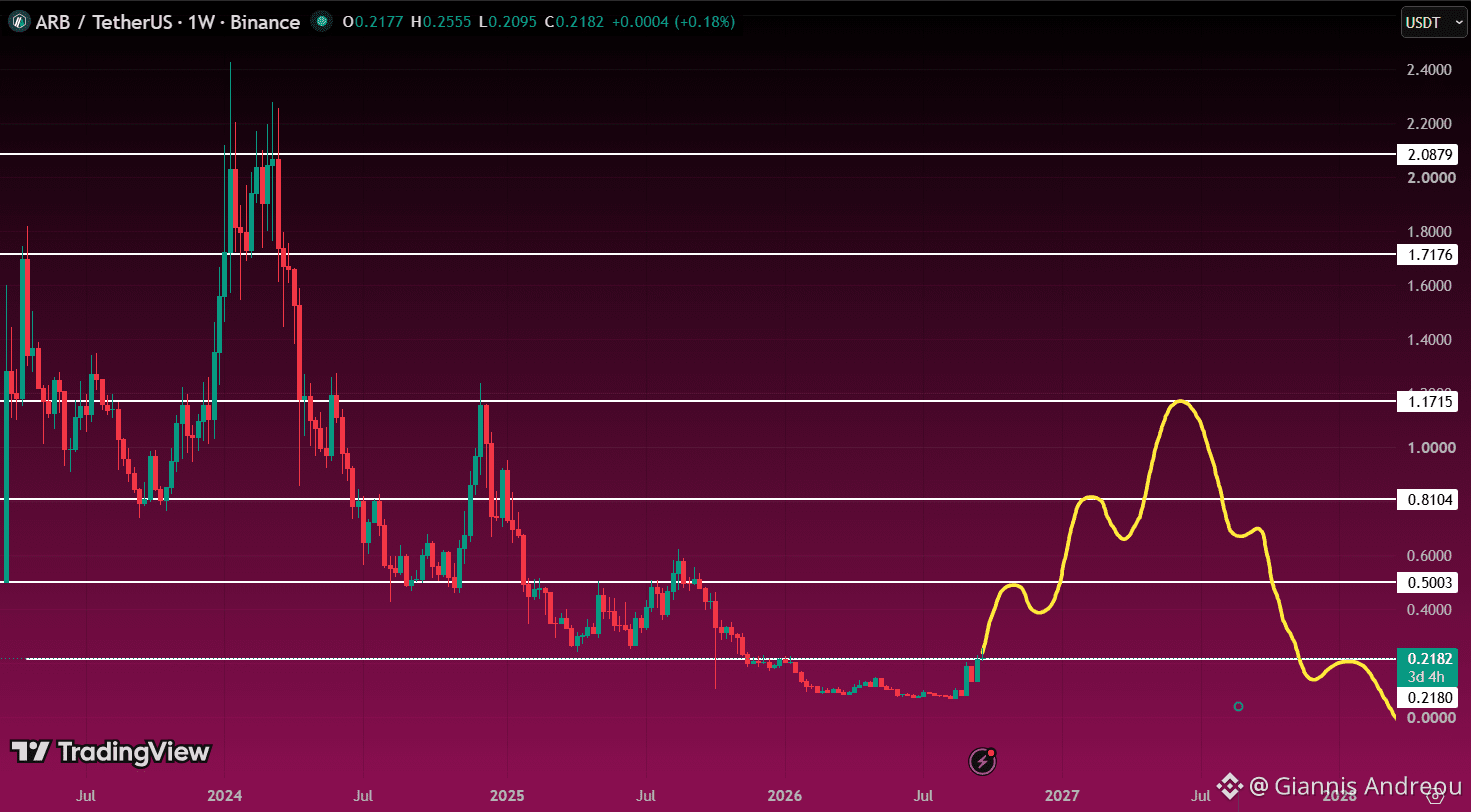
🔵 $ARB: HOW FAR CAN A RELIEF RALLY GO?
$ARB is testing $0.218 after a prolonged decline. The weekly candle is still open, so the reclaim isn’t confirmed.
Hold above this level and establish support, and $0.50 becomes the next major checkpoint. Further strength would bring $0.81, then $1.17 into focus.
My broader scenario is a recovery into resistance followed by renewed selling. Even a rally toward $1.17 would leave price well below its previous peak.
Lose $0.218 and fail to reclaim it, and the recent base comes back into play.
The yellow path illustrates that scenario, not an exact timeline or a prediction of zero.
Nothing is guaranteed. Do Your Own Research.
🔵 $ARB: HOW FAR CAN A RELIEF RALLY GO?
$ARB is testing $0.218 after a prolonged decline. The weekly candle is still open, so the reclaim isn’t confirmed.
Hold above this level and establish support, and $0.50 becomes the next major checkpoint. Further strength would bring $0.81, then $1.17 into focus.
My broader scenario is a recovery into resistance followed by renewed selling. Even a rally toward $1.17 would leave price well below its previous peak.
Lose $0.218 and fail to reclaim it, and the recent base comes back into play.
The yellow path illustrates that scenario, not an exact timeline or a prediction of zero.
Nothing is guaranteed. Do Your Own Research.
$ARB is testing $0.218 after a prolonged decline. The weekly candle is still open, so the reclaim isn’t confirmed.
Hold above this level and establish support, and $0.50 becomes the next major checkpoint. Further strength would bring $0.81, then $1.17 into focus.
My broader scenario is a recovery into resistance followed by renewed selling. Even a rally toward $1.17 would leave price well below its previous peak.
Lose $0.218 and fail to reclaim it, and the recent base comes back into play.
The yellow path illustrates that scenario, not an exact timeline or a prediction of zero.
Nothing is guaranteed. Do Your Own Research.
48
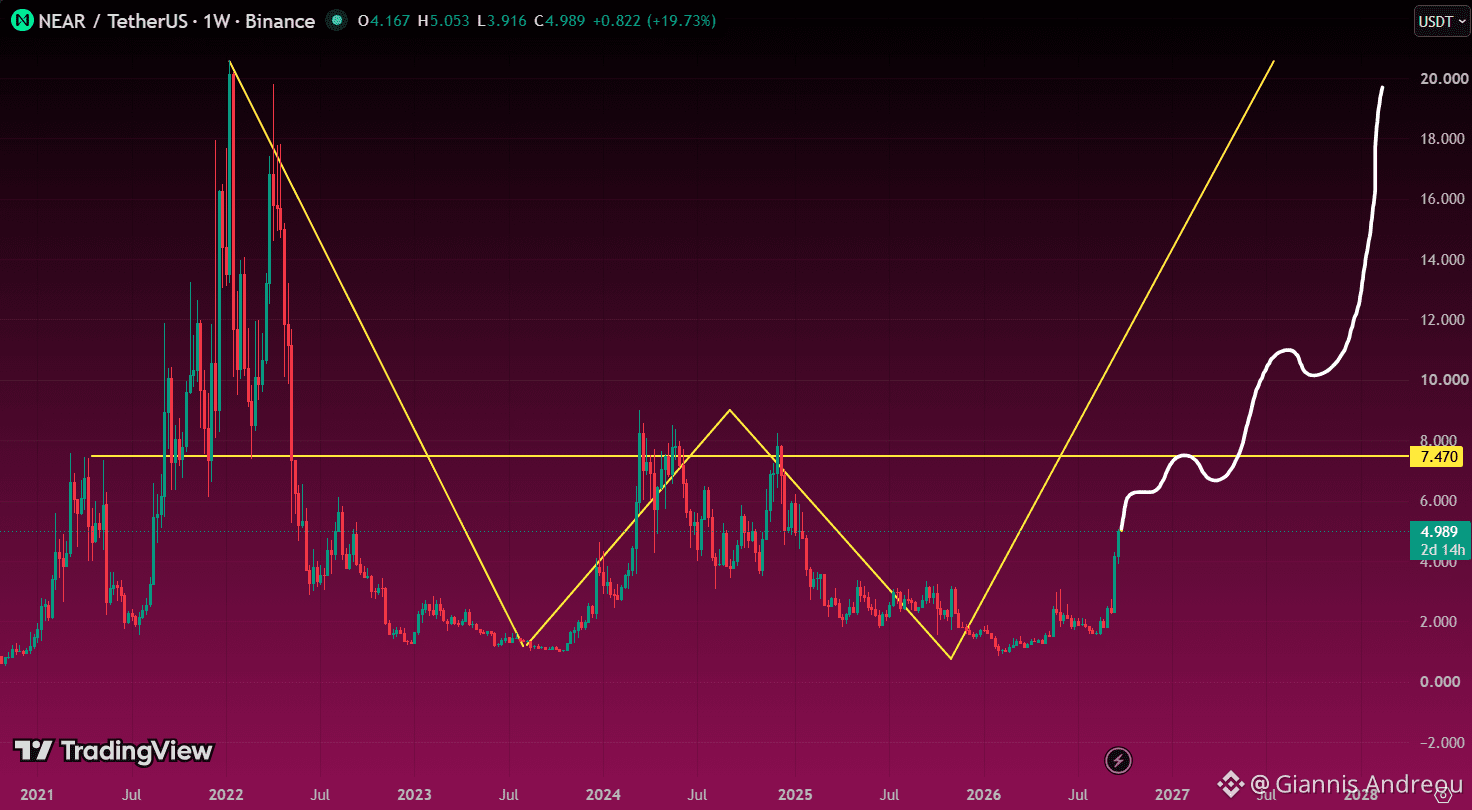
🟢 $NEAR: A MULTI-YEAR W IS TAKING SHAPE.
NEAR’s weekly chart shows a potential double bottom around $1, with the right side now recovering.
$7.47 is the first major resistance. Clearing it would bring the central peak around $9 into focus, the key neckline for confirming the broader W.
A weekly breakout and successful retest there would strengthen the case for $10–$11, followed by a longer-term recovery toward $17–$20.
The pattern is still unconfirmed. Losing the base near $1 would invalidate it.
Nothing is guaranteed. Do Your Own Research.
🟢 $NEAR: A MULTI-YEAR W IS TAKING SHAPE.
NEAR’s weekly chart shows a potential double bottom around $1, with the right side now recovering.
$7.47 is the first major resistance. Clearing it would bring the central peak around $9 into focus, the key neckline for confirming the broader W.
A weekly breakout and successful retest there would strengthen the case for $10–$11, followed by a longer-term recovery toward $17–$20.
The pattern is still unconfirmed. Losing the base near $1 would invalidate it.
Nothing is guaranteed. Do Your Own Research.
NEAR’s weekly chart shows a potential double bottom around $1, with the right side now recovering.
$7.47 is the first major resistance. Clearing it would bring the central peak around $9 into focus, the key neckline for confirming the broader W.
A weekly breakout and successful retest there would strengthen the case for $10–$11, followed by a longer-term recovery toward $17–$20.
The pattern is still unconfirmed. Losing the base near $1 would invalidate it.
Nothing is guaranteed. Do Your Own Research.
43
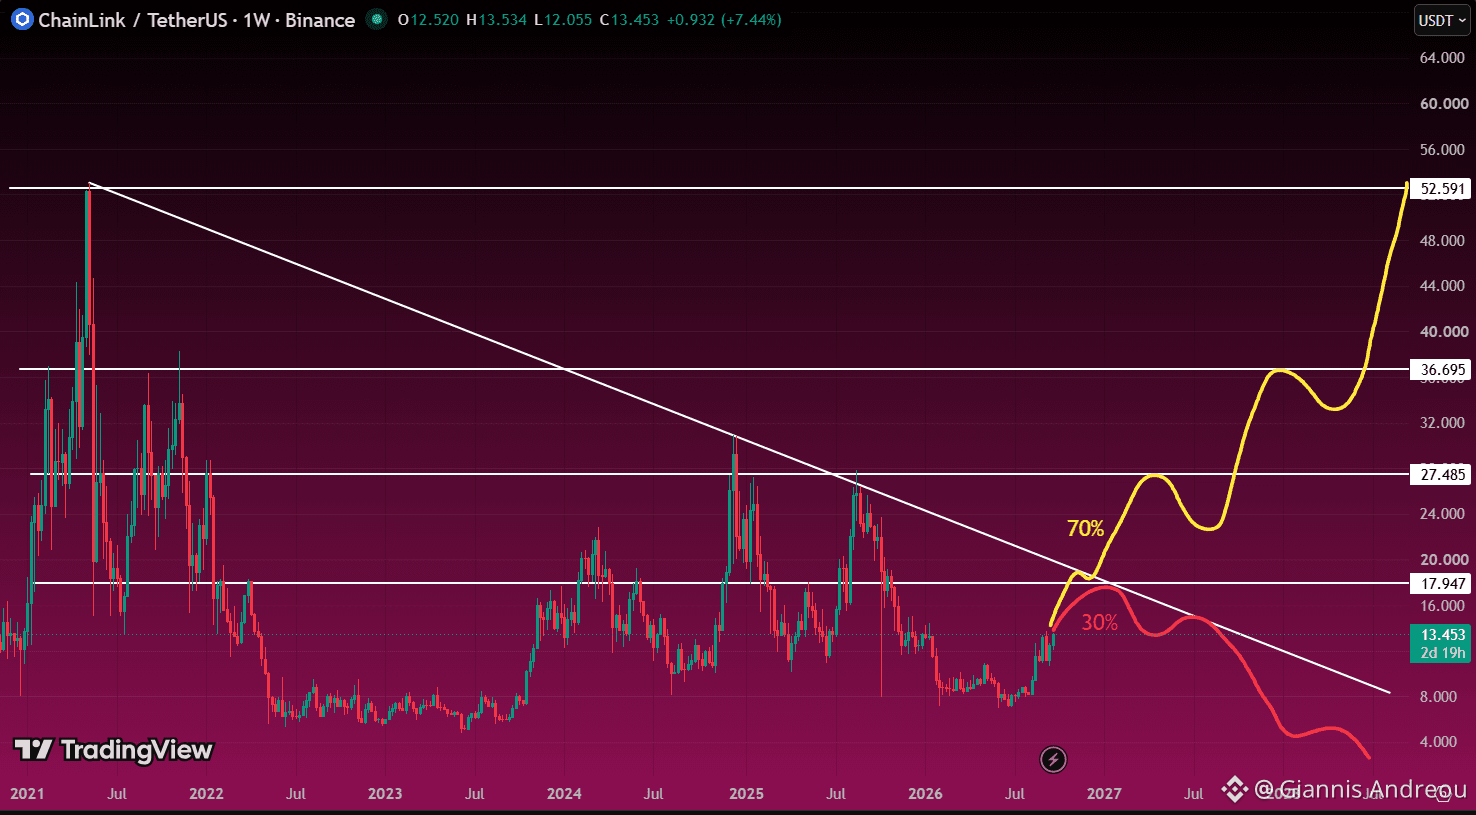
🔗 $LINK : FIVE YEARS OF RESISTANCE. ONE BIG TEST AHEAD.
$LINK is recovering toward $18, where horizontal resistance meets the descending trendline from the 2021 peak.
That confluence is the key to my bullish scenario.
A weekly breakout and successful retest would put $27.49 in focus, followed by $36.70. Clearing those levels could open a path toward $52.59.
Rejection around $18 keeps the broader downtrend intact. Losing support near $8 would seriously weaken the recovery.
The chart’s 70/30 split reflects a subjective scenario weighting, not measured odds.
Nothing is guaranteed. Do Your Own Research.
🔗 $LINK : FIVE YEARS OF RESISTANCE. ONE BIG TEST AHEAD.
$LINK is recovering toward $18, where horizontal resistance meets the descending trendline from the 2021 peak.
That confluence is the key to my bullish scenario.
A weekly breakout and successful retest would put $27.49 in focus, followed by $36.70. Clearing those levels could open a path toward $52.59.
Rejection around $18 keeps the broader downtrend intact. Losing support near $8 would seriously weaken the recovery.
The chart’s 70/30 split reflects a subjective scenario weighting, not measured odds.
Nothing is guaranteed. Do Your Own Research.
$LINK is recovering toward $18, where horizontal resistance meets the descending trendline from the 2021 peak.
That confluence is the key to my bullish scenario.
A weekly breakout and successful retest would put $27.49 in focus, followed by $36.70. Clearing those levels could open a path toward $52.59.
Rejection around $18 keeps the broader downtrend intact. Losing support near $8 would seriously weaken the recovery.
The chart’s 70/30 split reflects a subjective scenario weighting, not measured odds.
Nothing is guaranteed. Do Your Own Research.
44
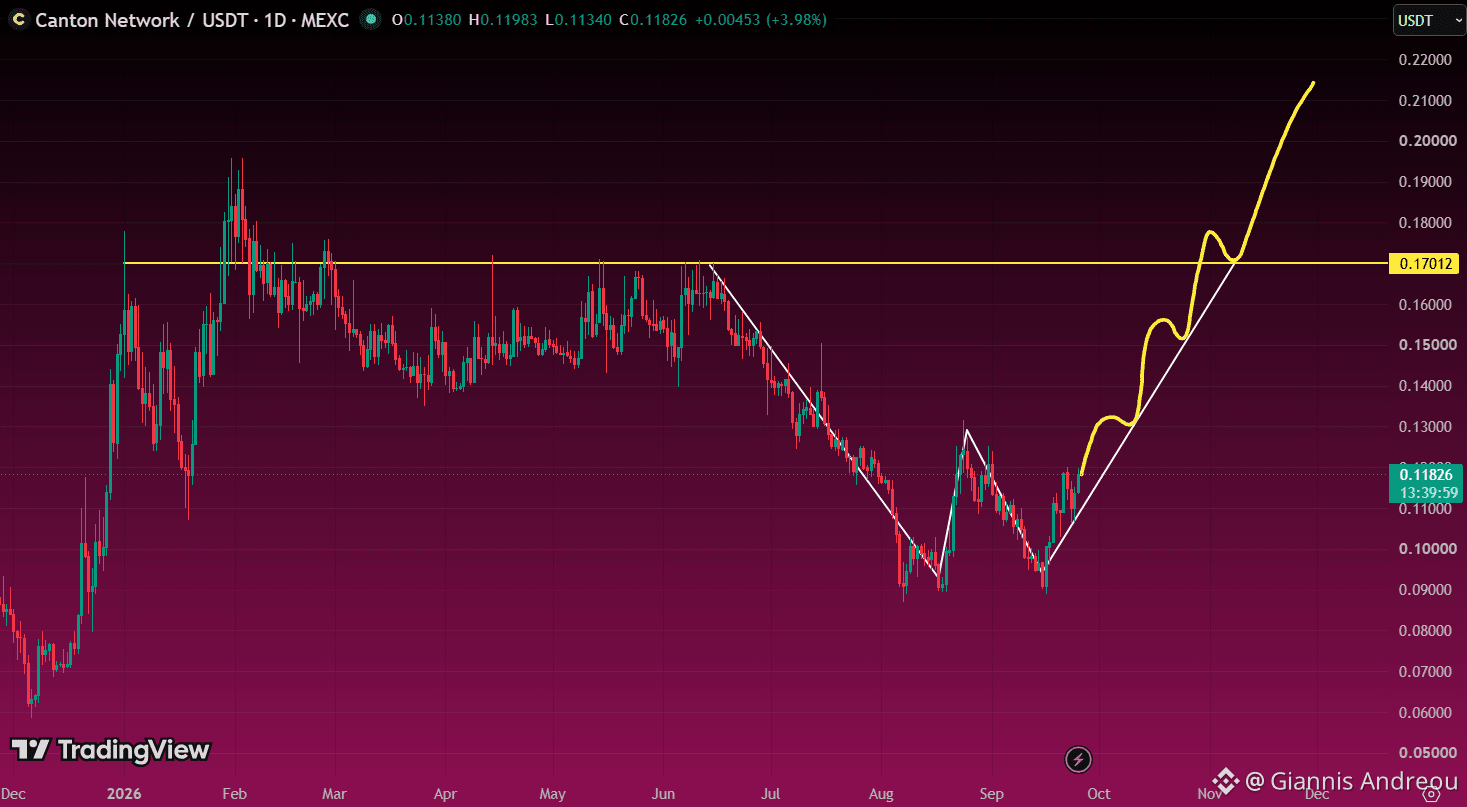
🟡 $CC: A W PATTERN IS TAKING SHAPE.
Canton has tested the $0.09 area twice, forming a potential double bottom on the daily chart.
The neckline sits near $0.13. A daily close above it, followed by a successful retest, would confirm the breakout and put the measured target around $0.17, right at major historical resistance.
Clear $0.17 and hold, and $0.19–$0.22 comes into focus.
Until the neckline breaks, the W remains unconfirmed. Losing $0.09 invalidates the setup.
Nothing is guaranteed. Do Your Own Research.
🟡 $CC: A W PATTERN IS TAKING SHAPE.
Canton has tested the $0.09 area twice, forming a potential double bottom on the daily chart.
The neckline sits near $0.13. A daily close above it, followed by a successful retest, would confirm the breakout and put the measured target around $0.17, right at major historical resistance.
Clear $0.17 and hold, and $0.19–$0.22 comes into focus.
Until the neckline breaks, the W remains unconfirmed. Losing $0.09 invalidates the setup.
Nothing is guaranteed. Do Your Own Research.
Canton has tested the $0.09 area twice, forming a potential double bottom on the daily chart.
The neckline sits near $0.13. A daily close above it, followed by a successful retest, would confirm the breakout and put the measured target around $0.17, right at major historical resistance.
Clear $0.17 and hold, and $0.19–$0.22 comes into focus.
Until the neckline breaks, the W remains unconfirmed. Losing $0.09 invalidates the setup.
Nothing is guaranteed. Do Your Own Research.
95
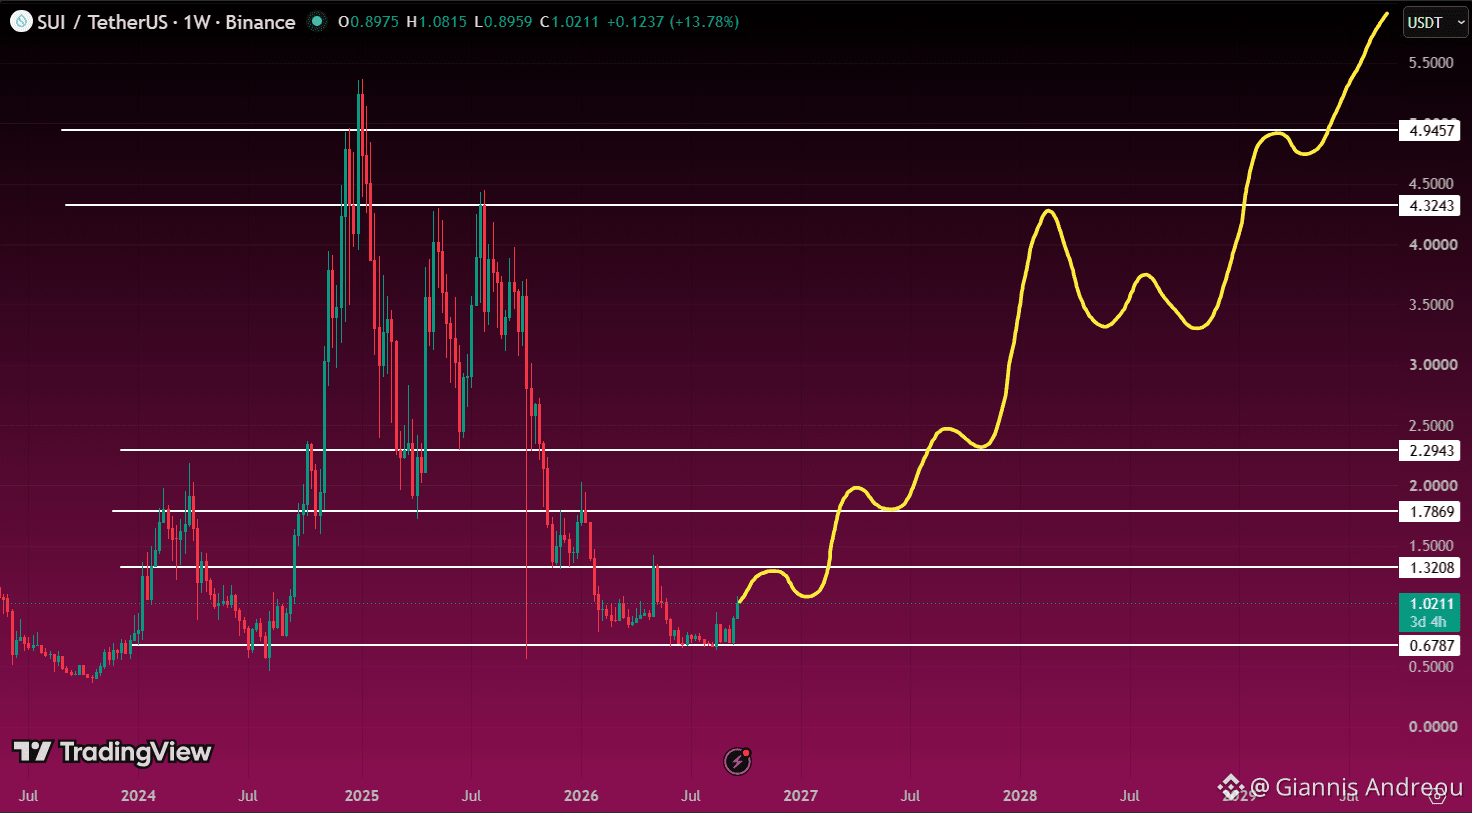
💧 $SUI: THE ROAD BACK STARTS AT $1.32
$SUI is recovering near $1.02 after holding the $0.68 area. Now buyers need to reclaim lost ground.
My first checkpoint is $1.32. A weekly close above it and a successful retest would strengthen the case for $1.79, then $2.29.
If those levels turn into support, the broader recovery scenario brings $4.32 and $4.95 into focus. New highs would still require clearing the previous peak near $5.35.
The yellow path is my bullish scenario, with pullbacks along the way. A weekly breakdown below $0.68 would undermine it.
Nothing is guaranteed. Do Your Own Research.
💧 $SUI: THE ROAD BACK STARTS AT $1.32
$SUI is recovering near $1.02 after holding the $0.68 area. Now buyers need to reclaim lost ground.
My first checkpoint is $1.32. A weekly close above it and a successful retest would strengthen the case for $1.79, then $2.29.
If those levels turn into support, the broader recovery scenario brings $4.32 and $4.95 into focus. New highs would still require clearing the previous peak near $5.35.
The yellow path is my bullish scenario, with pullbacks along the way. A weekly breakdown below $0.68 would undermine it.
Nothing is guaranteed. Do Your Own Research.
$SUI is recovering near $1.02 after holding the $0.68 area. Now buyers need to reclaim lost ground.
My first checkpoint is $1.32. A weekly close above it and a successful retest would strengthen the case for $1.79, then $2.29.
If those levels turn into support, the broader recovery scenario brings $4.32 and $4.95 into focus. New highs would still require clearing the previous peak near $5.35.
The yellow path is my bullish scenario, with pullbacks along the way. A weekly breakdown below $0.68 would undermine it.
Nothing is guaranteed. Do Your Own Research.
35
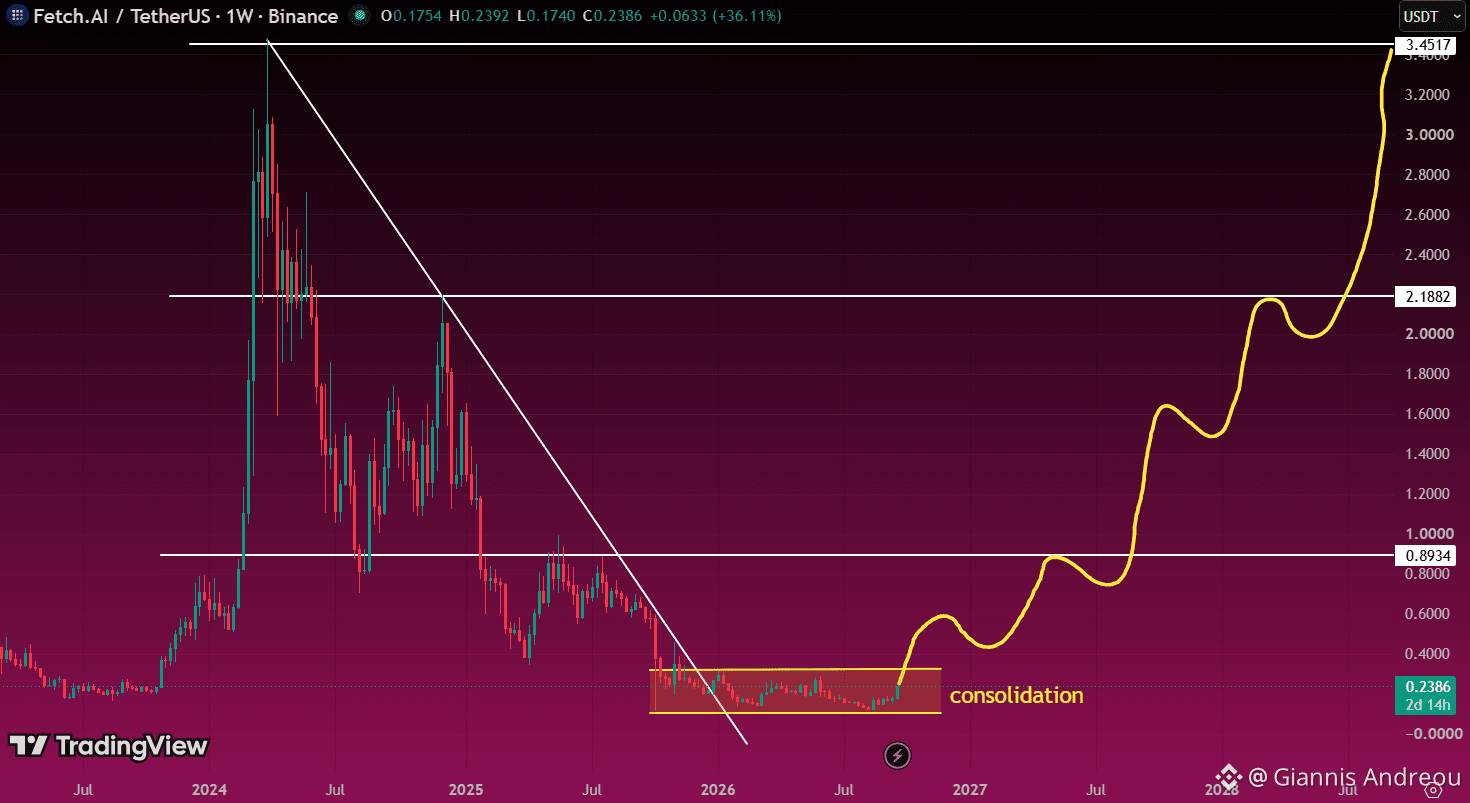
🤖 $FET: THE NEXT CHAPTER STARTS ABOVE THE RANGE.
$FET has moved beyond the drawn descending trendline, but remains inside its consolidation base. The next test is the range ceiling near $0.32.
A weekly close above it and a successful retest would strengthen the recovery scenario toward $0.60, then $0.893.
My longer-term bullish path targets $2.19 and eventually $3.45, provided resistance keeps turning into support.
Losing the base near $0.11–$0.12 would undermine that setup. The current weekly candle is still open.
Nothing is guaranteed. Do Your Own Research.
🤖 $FET: THE NEXT CHAPTER STARTS ABOVE THE RANGE.
$FET has moved beyond the drawn descending trendline, but remains inside its consolidation base. The next test is the range ceiling near $0.32.
A weekly close above it and a successful retest would strengthen the recovery scenario toward $0.60, then $0.893.
My longer-term bullish path targets $2.19 and eventually $3.45, provided resistance keeps turning into support.
Losing the base near $0.11–$0.12 would undermine that setup. The current weekly candle is still open.
Nothing is guaranteed. Do Your Own Research.
$FET has moved beyond the drawn descending trendline, but remains inside its consolidation base. The next test is the range ceiling near $0.32.
A weekly close above it and a successful retest would strengthen the recovery scenario toward $0.60, then $0.893.
My longer-term bullish path targets $2.19 and eventually $3.45, provided resistance keeps turning into support.
Losing the base near $0.11–$0.12 would undermine that setup. The current weekly candle is still open.
Nothing is guaranteed. Do Your Own Research.
62
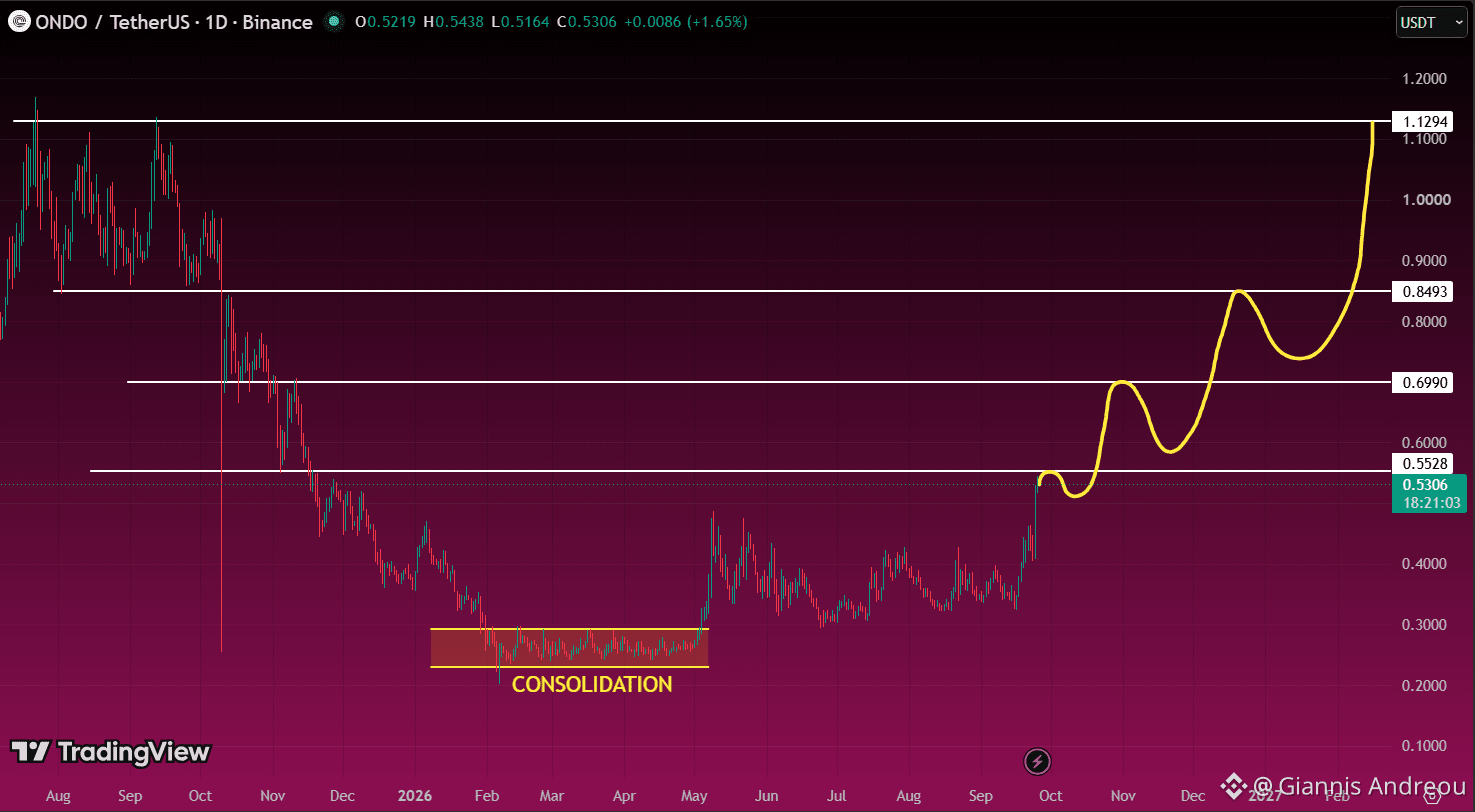
⚪ $ONDO: THE BASE IS BUILT. NOW COMES THE TEST.
After consolidating around $0.23–$0.29, ONDO is testing the next key resistance at $0.553.
A daily close above it, followed by a successful retest, would strengthen the case for $0.699, then $0.849.
My drawn scenario allows pullbacks along the way. Reclaiming each level as support is what keeps the recovery moving toward $1.13.
Rejection at $0.553 keeps a pullback toward $0.40–$0.45 in play.
Nothing is guaranteed. Do Your Own Research.
⚪ $ONDO: THE BASE IS BUILT. NOW COMES THE TEST.
After consolidating around $0.23–$0.29, ONDO is testing the next key resistance at $0.553.
A daily close above it, followed by a successful retest, would strengthen the case for $0.699, then $0.849.
My drawn scenario allows pullbacks along the way. Reclaiming each level as support is what keeps the recovery moving toward $1.13.
Rejection at $0.553 keeps a pullback toward $0.40–$0.45 in play.
Nothing is guaranteed. Do Your Own Research.
After consolidating around $0.23–$0.29, ONDO is testing the next key resistance at $0.553.
A daily close above it, followed by a successful retest, would strengthen the case for $0.699, then $0.849.
My drawn scenario allows pullbacks along the way. Reclaiming each level as support is what keeps the recovery moving toward $1.13.
Rejection at $0.553 keeps a pullback toward $0.40–$0.45 in play.
Nothing is guaranteed. Do Your Own Research.
36
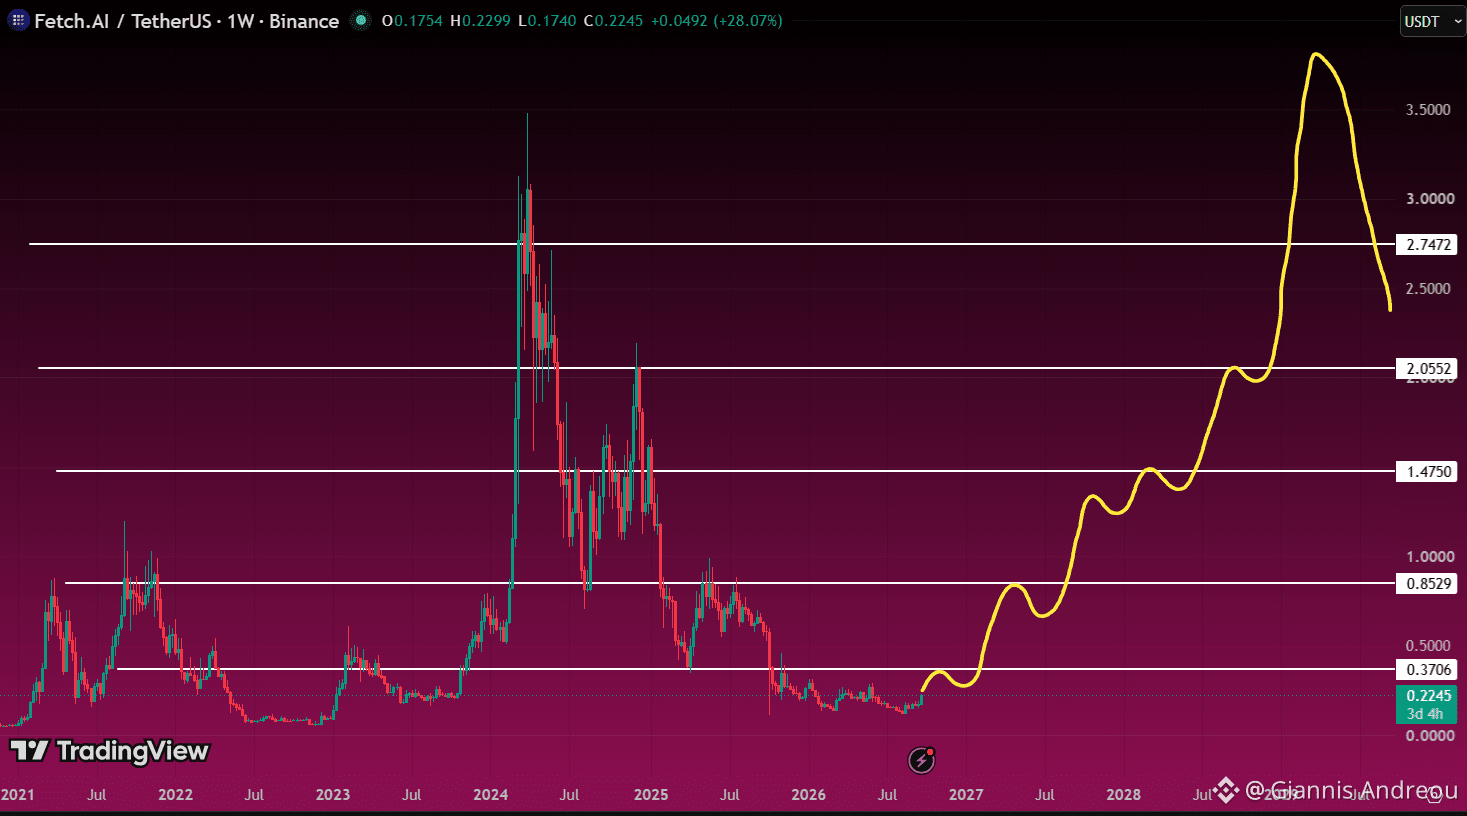
🤖 $FET: BIG DREAMS. FIRST, $0.37.
$FET is bouncing near $0.22, but the recovery still has plenty to prove.
My first checkpoint is $0.37. A weekly close above it, followed by a successful retest, would strengthen the case for $0.85.
Beyond that, the historical resistance ladder is clear: $1.48 → $2.06 → $2.75. Each level needs its own breakout and confirmation.
New highs above $3.50 are the ambitious scenario drawn here, not a guaranteed destination. Losing the recent $0.12–$0.15 base would undermine that recovery setup.
One reclaim at a time.
Nothing is guaranteed. Do Your Own Research.
🤖 $FET: BIG DREAMS. FIRST, $0.37.
$FET is bouncing near $0.22, but the recovery still has plenty to prove.
My first checkpoint is $0.37. A weekly close above it, followed by a successful retest, would strengthen the case for $0.85.
Beyond that, the historical resistance ladder is clear: $1.48 → $2.06 → $2.75. Each level needs its own breakout and confirmation.
New highs above $3.50 are the ambitious scenario drawn here, not a guaranteed destination. Losing the recent $0.12–$0.15 base would undermine that recovery setup.
One reclaim at a time.
Nothing is guaranteed. Do Your Own Research.
$FET is bouncing near $0.22, but the recovery still has plenty to prove.
My first checkpoint is $0.37. A weekly close above it, followed by a successful retest, would strengthen the case for $0.85.
Beyond that, the historical resistance ladder is clear: $1.48 → $2.06 → $2.75. Each level needs its own breakout and confirmation.
New highs above $3.50 are the ambitious scenario drawn here, not a guaranteed destination. Losing the recent $0.12–$0.15 base would undermine that recovery setup.
One reclaim at a time.
Nothing is guaranteed. Do Your Own Research.
84
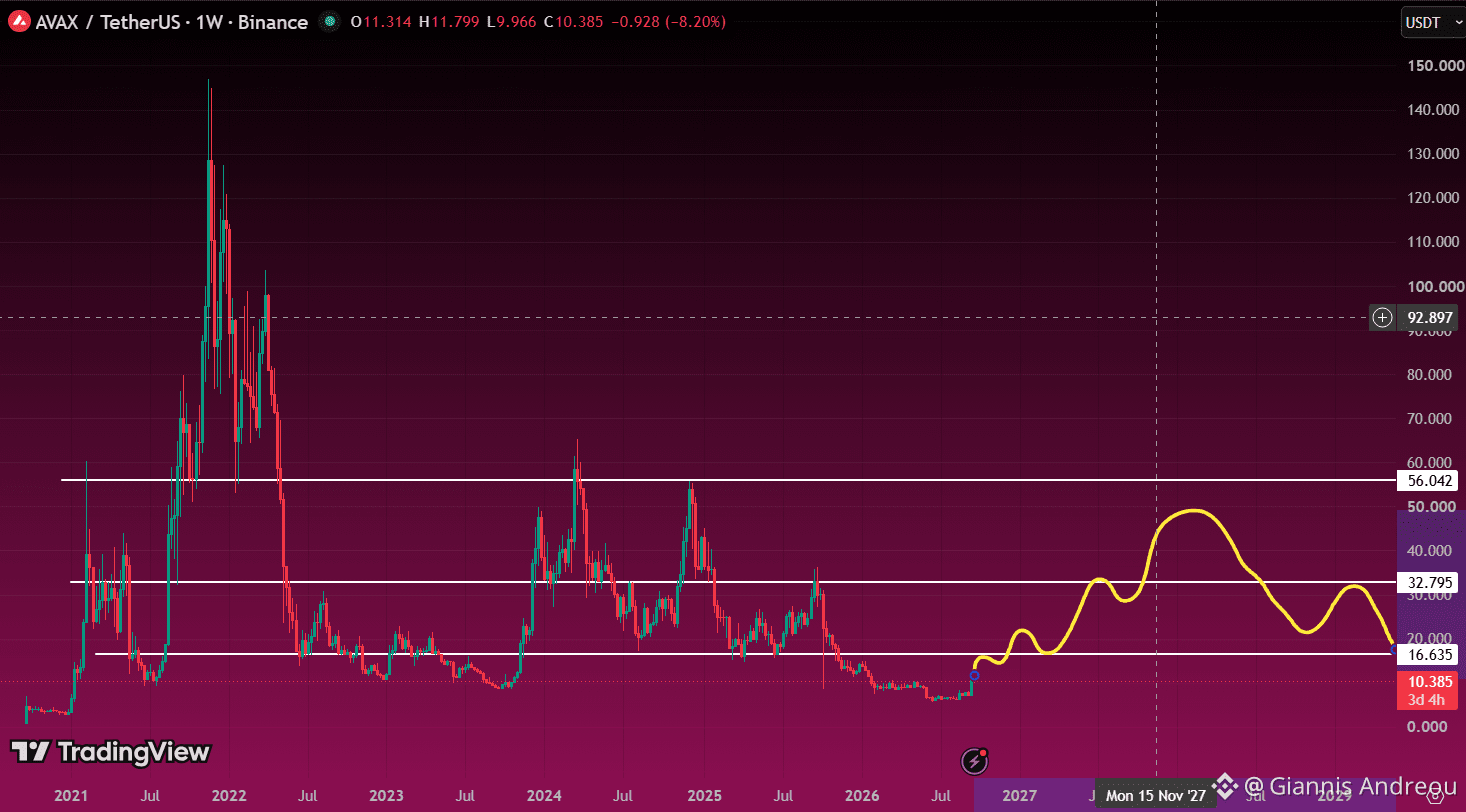
🔺 $AVAX: A COMEBACK DOESN’T NEED A NEW ATH
$AVAX is near $10.4, but the first real test sits at $16.6.
Reclaim that level on a weekly close and hold the retest, and $32.8 becomes the next major resistance to watch.
My broader scenario allows a recovery toward $45–$50, below the $56 historical resistance. That would still leave a lower high within the bigger picture.
The yellow path is a scenario, not a timetable. Rejection at $16.6 would weaken it, while losing the recent $6–$8 base would undermine the recovery.
Nothing is guaranteed. Do Your Own Research.
🔺 $AVAX: A COMEBACK DOESN’T NEED A NEW ATH
$AVAX is near $10.4, but the first real test sits at $16.6.
Reclaim that level on a weekly close and hold the retest, and $32.8 becomes the next major resistance to watch.
My broader scenario allows a recovery toward $45–$50, below the $56 historical resistance. That would still leave a lower high within the bigger picture.
The yellow path is a scenario, not a timetable. Rejection at $16.6 would weaken it, while losing the recent $6–$8 base would undermine the recovery.
Nothing is guaranteed. Do Your Own Research.
$AVAX is near $10.4, but the first real test sits at $16.6.
Reclaim that level on a weekly close and hold the retest, and $32.8 becomes the next major resistance to watch.
My broader scenario allows a recovery toward $45–$50, below the $56 historical resistance. That would still leave a lower high within the bigger picture.
The yellow path is a scenario, not a timetable. Rejection at $16.6 would weaken it, while losing the recent $6–$8 base would undermine the recovery.
Nothing is guaranteed. Do Your Own Research.
45
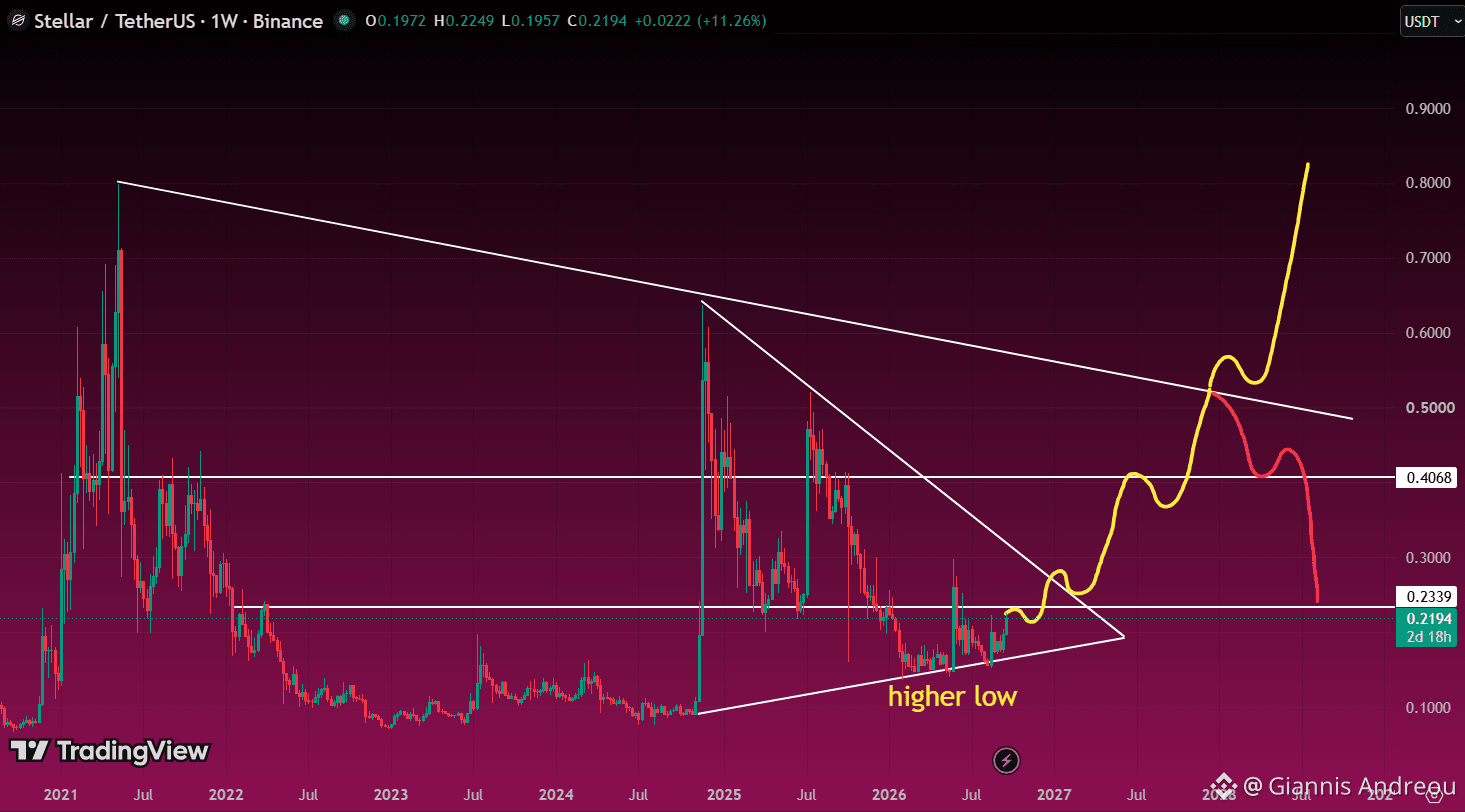
🌟 $XLM: THE SQUEEZE IS GETTING TIGHTER.
$XLM is holding a higher low inside a tightening weekly triangle. First comes $0.234, then the descending triangle resistance.
Clear both and hold the retest, and $0.407 becomes the next major test.
My bullish scenario then targets the longer-term descending trendline. A confirmed breakout there could open the path toward $0.80.
Rejection at that upper trendline keeps the red scenario alive. Losing the rising support would weaken the recovery much earlier.
Nothing is guaranteed. Do Your Own Research.
🌟 $XLM: THE SQUEEZE IS GETTING TIGHTER.
$XLM is holding a higher low inside a tightening weekly triangle. First comes $0.234, then the descending triangle resistance.
Clear both and hold the retest, and $0.407 becomes the next major test.
My bullish scenario then targets the longer-term descending trendline. A confirmed breakout there could open the path toward $0.80.
Rejection at that upper trendline keeps the red scenario alive. Losing the rising support would weaken the recovery much earlier.
Nothing is guaranteed. Do Your Own Research.
$XLM is holding a higher low inside a tightening weekly triangle. First comes $0.234, then the descending triangle resistance.
Clear both and hold the retest, and $0.407 becomes the next major test.
My bullish scenario then targets the longer-term descending trendline. A confirmed breakout there could open the path toward $0.80.
Rejection at that upper trendline keeps the red scenario alive. Losing the rising support would weaken the recovery much earlier.
Nothing is guaranteed. Do Your Own Research.
102
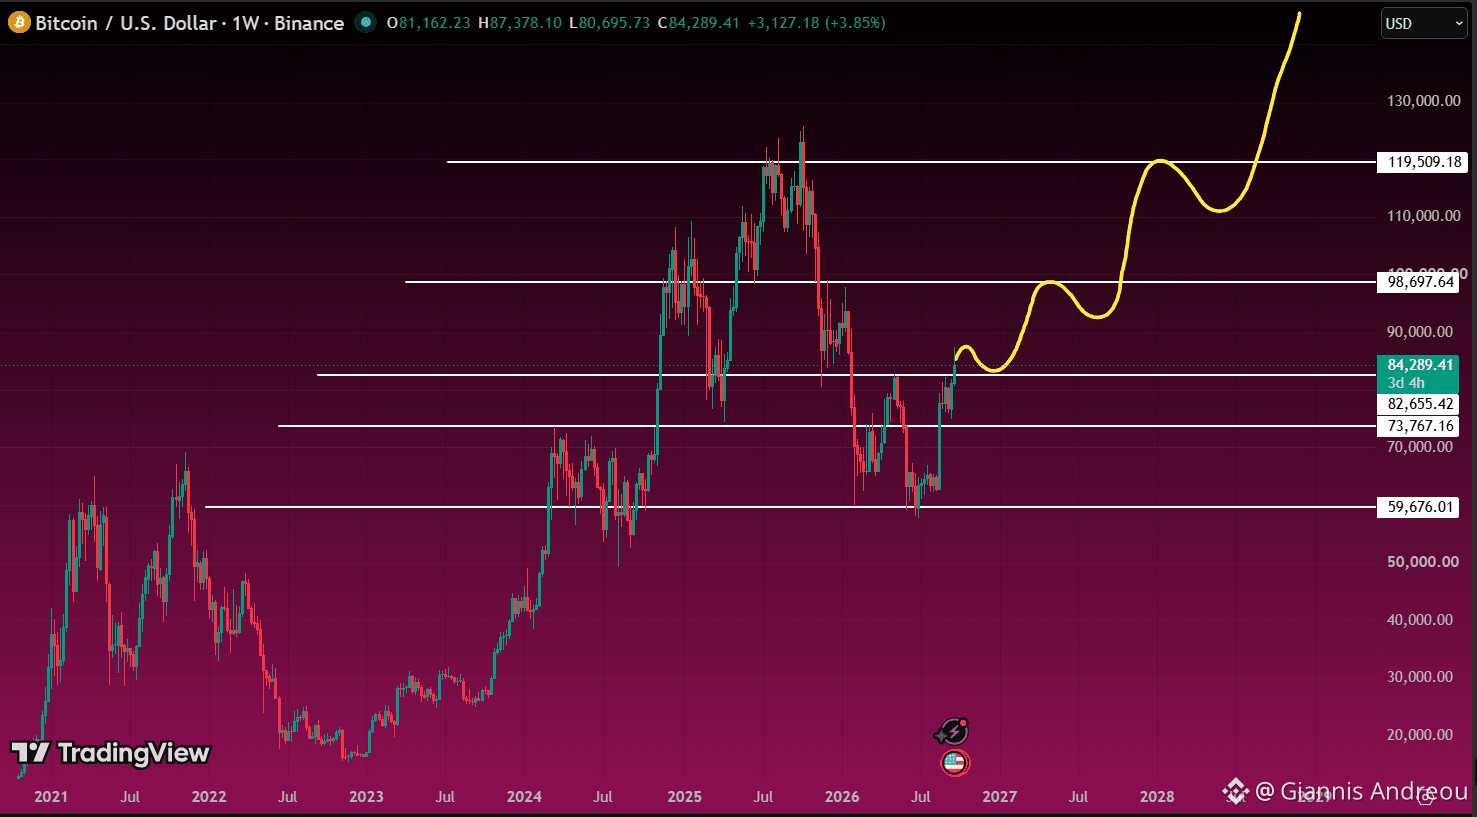
$BTC : THE NEXT CHAPTER STARTS AT $82.7K
The recovery is underway. Now comes the retest.
My bullish scenario: a weekly close above $82.7K, followed by a successful retest, sets up a move toward $98.7K.
Reclaim that next resistance and $119.5K comes into focus. New highs become a possibility if buyers clear the previous peak.
Lose $82.7K and fail to reclaim it, and I’m watching $73.8K. Below that, $59.7K is the deeper support.
The weekly candle is still open. Confirmation first.
Nothing is guaranteed. Do Your Own Research.
$BTC : THE NEXT CHAPTER STARTS AT $82.7K
The recovery is underway. Now comes the retest.
My bullish scenario: a weekly close above $82.7K, followed by a successful retest, sets up a move toward $98.7K.
Reclaim that next resistance and $119.5K comes into focus. New highs become a possibility if buyers clear the previous peak.
Lose $82.7K and fail to reclaim it, and I’m watching $73.8K. Below that, $59.7K is the deeper support.
The weekly candle is still open. Confirmation first.
Nothing is guaranteed. Do Your Own Research.
The recovery is underway. Now comes the retest.
My bullish scenario: a weekly close above $82.7K, followed by a successful retest, sets up a move toward $98.7K.
Reclaim that next resistance and $119.5K comes into focus. New highs become a possibility if buyers clear the previous peak.
Lose $82.7K and fail to reclaim it, and I’m watching $73.8K. Below that, $59.7K is the deeper support.
The weekly candle is still open. Confirmation first.
Nothing is guaranteed. Do Your Own Research.
80
Log in to explore more content
Join global crypto users on Binance Square
⚡️ Get latest and useful information about crypto.
💬 Trusted by the world’s largest crypto exchange.
👍 Discover real insights from verified creators.
Email / Phone number
Trending Topics
PolymarketBankFailureBetsDrawFDICConcern
0 views
5 Discussing
🚨 POLYMARKET BANK FAILURE BETS DRAW FDIC CONCERN
Polymarket contracts betting on potential U.S. bank failures are drawing scrutiny from FDIC officials, who are concerned about possible risks to financial stability.
👀 Prediction markets are entering a new regulatory spotlight.
#Polymarket #Banking #FDIC $BTC
#polymarketbankfailurebetsdrawfdicconcern
The07
·0 Likes
·21 views
BlackRockBuildsTokenizedPortfoliosForOndo
0 views
5 Discussing
BitwiseFilesToListNEARETFOnNYSEArca
170 views
35 Discussing