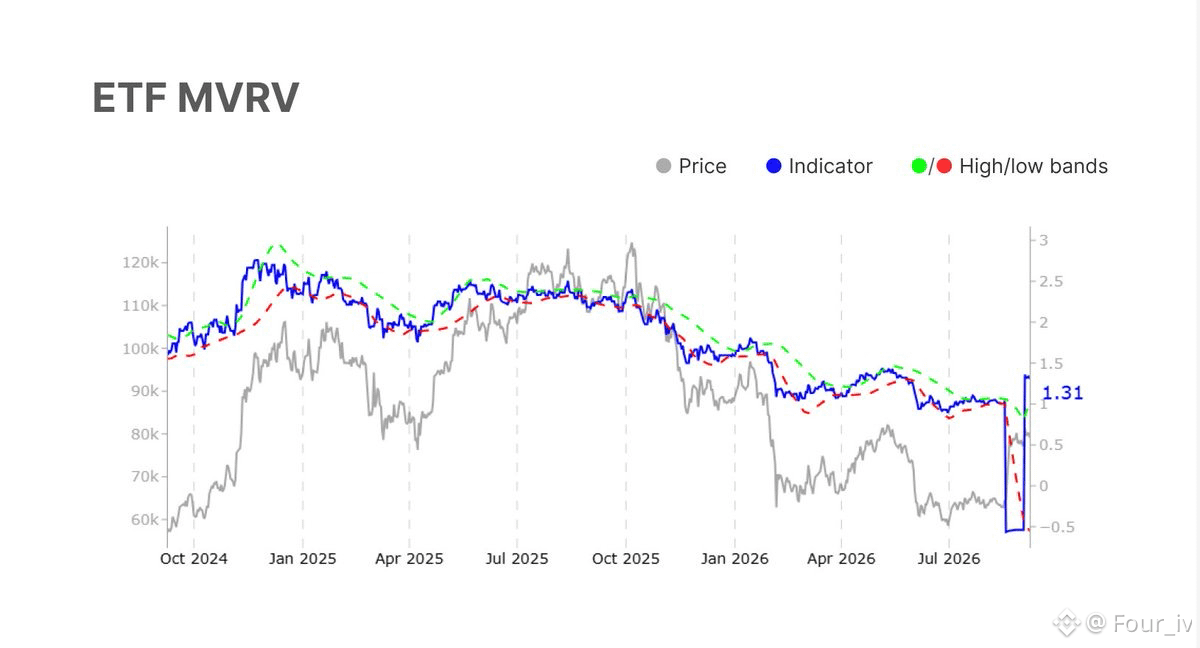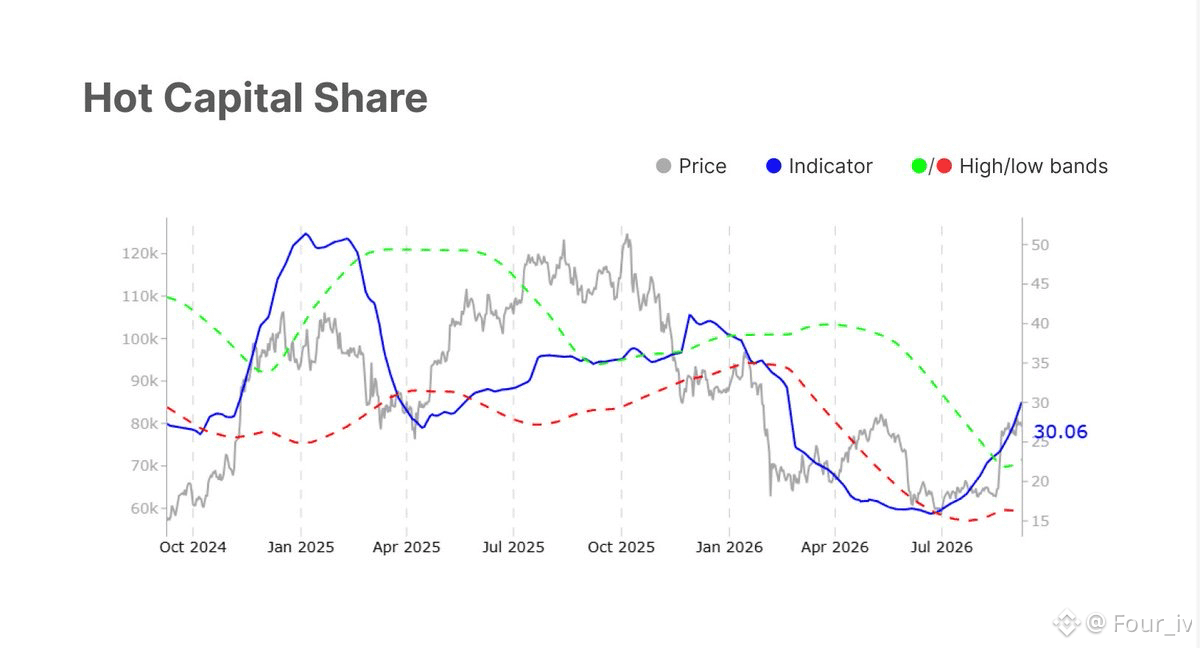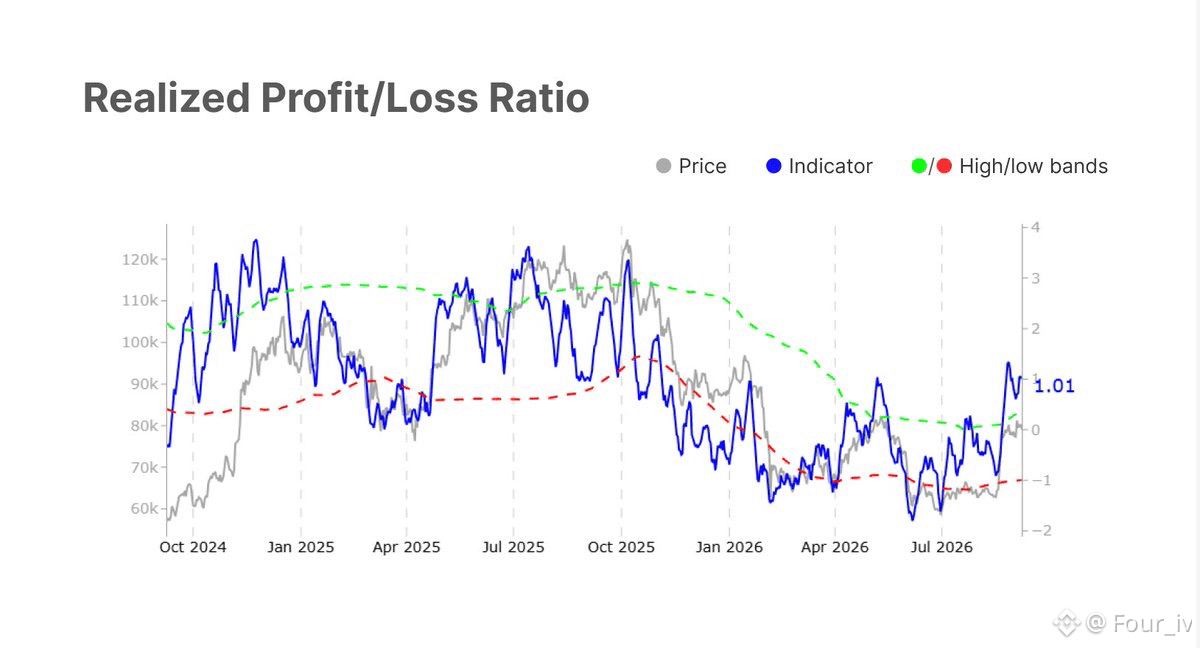
we are advertising and media industry that do promote cryptos and do provide marketing services Check us out on Twitter @X_Four_iv we do present daily new 💎
Most tokenized securities are just IOUs on a chain
Real ownership needs transfer restrictions, investor eligibility checks, and audit trails enforced at the protocol level not bolted on after the fact.
That’s the problem @Dusk XSC (Confidential Security Contract) standard is built to solve. Issuers write compliance logic directly into the contract, so eligibility and transfer rules execute automatically while individual holder positions stay private.
$DUSK is the settlement layer XSC assets run on. It’s the most distinctive piece of Dusk’s stack, and one of the few live attempts at compliant by design RWA infrastructure instead of compliance as an afterthought.
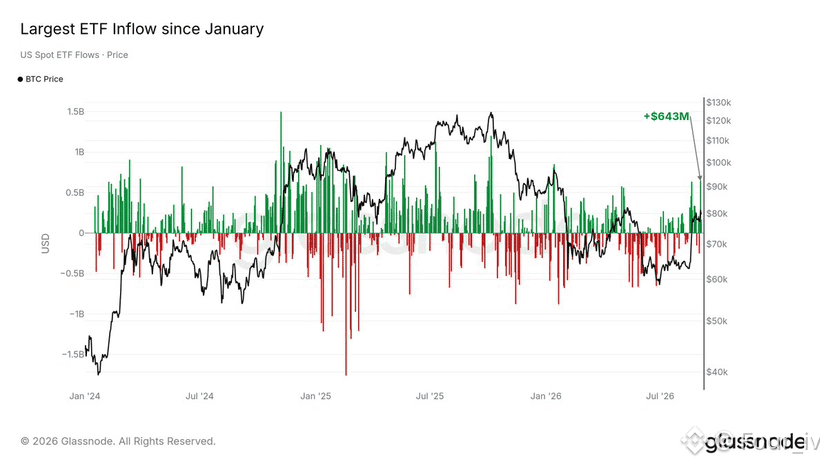
BITCOIN SPOT ETF FLOW UPDATE Institutional demand remains one of the most important metrics to monitor as Bitcoin continues to search for its next major move. After analysing today’s spot ETF data, the short-term picture shows some profit-taking, but the broader trend remains unchanged: institutions are still heavily exposed to Bitcoin and ETF demand remains one of the strongest structural forces in this market. Daily ETF Flows Latest trading session: Total Net Flow: -885.64 BTC Approximately: -$52.25M in net outflows The selling was mainly driven by the largest ETF providers: BlackRock IBIT: -874.61 BTC Fidelity FBTC: -107.16 BTC Bitwise BITB: +96.13 BTC The majority of today’s outflows came from IBIT, which continues to be the largest Bitcoin ETF by assets and therefore has the biggest influence on overall ETF flow data. One day of outflows is insignificant compared with the size of the institutional positions already built. Institutional Holdings Remain Strong Current Bitcoin ETF holdings: 648.33K BTC Total ETF assets: $78.91B Despite short-term fluctuations, US spot Bitcoin ETFs continue to hold hundreds of thousands of BTC, representing one of the largest sources of institutional demand in Bitcoin’s history. The important point: Institutions are not exiting Bitcoin. Daily flows will naturally move between inflows and outflows as investors rebalance, take profits, or adjust exposure. The larger trend remains focused on accumulation. ETF Landscape Breakdown: The concentration of Bitcoin exposure remains heavily dominated by the largest issuers. BlackRock IBIT: 746.89K BTC Fidelity FBTC: 172.07K BTC Grayscale GBTC: 131.25K BTC The biggest trend since ETF approval has been the shift away from older, higher-fee products into newer spot ETFs. Capital has increasingly moved towards providers such as BlackRock and Fidelity, showing that institutional demand has not disappeared — it has simply become more efficient. What The Data Is Telling Us: The most interesting part of the current ETF picture is the relationship between flows and price. Bitcoin has remained relatively range-bound while ETF holdings have continued to stay elevated. This suggests: Institutions are not aggressively chasing price higher right now. But they also are not abandoning their positions. The market is currently waiting for a catalyst strong enough to bring fresh demand back into the spot market. What We Are Watching Next: For Bitcoin to confirm the next major upside move, we want to see: • Consistent daily ETF inflows returning • Stronger spot demand alongside price appreciation • Leverage cooling while institutional accumulation increases The strongest bullish setup would be: ETF inflows accelerating + open interest resetting + funding rates normalising. That combination would show genuine demand entering the market rather than another leverage-driven move. Chart House Research Conclusion: Today’s ETF data shows short-term caution, not a change in the broader institutional trend. The overall picture remains: Bitcoin continues to have a significant institutional bid underneath the market. However, after recent volatility, investors appear to be waiting for confirmation before adding aggressively. The next key signal will be whether ETF flows return to positive territory while leverage continues to reset. That would provide the strongest indication that institutions are positioning for the next major Bitcoin expansion.
🇯🇵 Japan’s Life Insurers Hit with Record $96B Unrealized Bond Losses: What It Means for Global Mar
Japan’s financial sector is feeling the severe pressure of shifting global macroeconomic conditions. Japan’s four largest life insurers recently reported that their unrealized losses on domestic bonds surged by $6 billion, hitting an astonishing record high of $96 billion. As traditional institutional heavyweights face mounting portfolio pressures, let's break down why this matters for the broader financial and crypto landscapes. 📊 The Core Issue: Bonds Under Pressure The Record High: Total unrealized losses for Japan's top four life insurers climbed to $96 billion, driven by a massive $6 billion jump in recent periods. The Cause: As global interest rate environments fluctuate and bond yields shift, legacy fixed-income portfolios held by institutional giants take a heavy hit in market value. The Ripple Effect: When traditional safe-haven assets like domestic bonds experience heavy unrealized drawdowns, institutional risk appetite, capital allocation strategies, and liquidity management across traditional finance (TradFi) undergo significant shifts. 🌐 Why TradFi Instability Matters for Crypto Whenever institutional giants face structural pressure in traditional debt and bond markets, the macro narrative shifts: Liquidity Reallocation: Traditional institutions constantly look for ways to hedge against sovereign debt devaluation and inflation risks. Alternative Safe Havens: As confidence in legacy fiat-backed debt instruments wavers under massive unrealized losses, alternative assets—ranging from hard assets like gold to decentralized digital assets—remain on the long-term radar for institutional portfolio diversification. Macro Volatility: Bond market stress in major economies like Japan often triggers broader currency fluctuations that can cause short-term ripple effects across global risk assets, including crypto. 🚀 Join the Movement & Claim Rewards! As we navigate these market shifts, don't miss out on the opportunity to earn while you trade. You can jump right into the action and start earning rewards by checking out this exclusive link: 👉 Claim Your USDC Rewards Here 💬 How do you think ongoing stress in traditional bond markets will impact global liquidity and crypto moving forward? Let’s discuss in the comments below! #BinanceSquare #Japan #BondMarket #Macroeconomics #TradFi #Crypto #GlobalEconomy #Investing$btc
Solana (SOL) is an important cryptocurrency because it powers the Solana blockchain, a high-performance network designed to process transactions quickly and at relatively low cost. Its speed and scalability make it suitable for decentralized applications (dApps), decentralized finance (DeFi), NFTs, gaming, and digital payments. SOL is used to pay transaction fees and can also be staked to help secure the network. A strong developer ecosystem and growing use of on-chain applications have helped Solana become one of the major blockchain platforms in the crypto market. Its importance comes from its focus on combining speed, scalability, and affordability while supporting a wide range of real-world blockchain applications. However, SOL remains a volatile crypto asset, so investors should consider risks and conduct their own research.
🎁Gifting brings people together, and that’s really how Web3 thrives—it's all about community. Portal is working on an AI-driven gaming world where players and creators don’t just show up, they actually connect and grow alongside each other. Everything runs on account-based access, so your info stays safe, and $PORTAL is starting to play a bigger part in the ever-changing GameFi scene. So, if you could give something to another gamer or creator, what would it be? #Portal @BNB Chain #DOLO #SECReviewsSix3xLeveragedCommodityETFs
#BinanceFutures Join the Altcoin Summer Sprint and Share a Prize Pool of 150,000 USDC! https://www.binance.com/activity/trading-competition/altcoinsprint-2026aug?ref=49235444👉🏻 Click this link and win rewards 🎁
BITCOIN MARKET VOLUME UPDATE Price is attempting a localised recovery towards $63,550, but buying volume is rapidly dropping off on shorter timeframes. This move is driven by passive order fills and short-covering rather than aggressive institutional bidding, leaving the rally fragile. KEY METRICS: • Current BTC Price: $63,546 (+0.31% 4H | +0.78% 24H) • 24H Taker Buy Dominance: Futures 52.56% | Spot 50.71% • Derivatives Volume Share: 93.83% ($1.19T) • Physical Spot Share: 6.17% ($78.22B) VOLUME BREAKDOWN: Over the last 24 hours: • Futures Volume: $27.49B (+42.02%) • Spot Volume: $1.56B (+123.41%) Over the last 4 hours: • Futures Volume: $5.76B (-17.68% / -$1.02B) • Spot Volume: $411.74M (-9.79% / -$40.31M) vs 30-Day Baselines: • Futures Ratio vs 30D Avg: 0.6027 (~40% below average) • Spot Ratio vs 30D Avg: 0.5969 (~40% below average) WHAT THE DATA IS TELLING US: Buying Interest Is Fading Fast While 24-hour totals look high (+42.02% futures, +123.41% spot), shorter timeframes show buyers are running out of energy: • Over the last 4 hours, price edged up slightly by +0.31% (+$196.38) to $63,546. • Over the exact same 4 hours, futures trading volume dropped -17.68% and spot buying fell -9.79%. • Total market activity is still roughly 40% lower than normal monthly levels. Driven by Gambling Leverage, Not Real Demand Speculative derivative bets account for 93.83% ($1.19T) of 30-day trading volume, compared to just 6.17% ($78.22B) in actual spot buying. Price bounces that do not have real spot buyers behind them are weak and prone to quick pullbacks. Big Investors Are Selling While Retail Buys There is a clear split in where capital is moving over the last 24 hours: • Offshore Retail Buying: Binance (+$10.09M) and OKX (+$11.29M) saw net spot buying. • US & Institutional Selling: Bitfinex (-$18.81M), Kraken (-$1.92M), and Coinbase saw net selling. Without big US institutional platforms like Coinbase leading the buying, price lacks strong support to keep climbing higher. Short Sellers Are Closing Bets, Not New Buyers Stepping In Short-term buyers lead slightly (52.56% futures / 50.71% spot). However, active positions across major futures exchanges are actually shrinking: • Binance: -0.28% • OKX: -1.45% • Bybit: -6.30% • Bitunix: -22.90% This confirms price is moving up mostly because short sellers are closing out their trades to take profits or cut losses, not because new long-term buyers are entering the market. WHAT THIS MEANS FOR PRICE ACTION Bitcoin is stuck in a delicate holding pattern around $63,500. Because trading volume is dropping as price edges up, and big institutional venues are selling into this bounce, pushing past $63,800–$64,000 will be difficult unless real spot buyers step in with size. KEY SCENARIOS: • Bullish Scenario: A clean move above $64,200 backed by rising spot volume and net buying on Coinbase/Kraken would show real demand, opening the path towards $65,500. • Bearish Scenario: Failure to clear resistance near $63,800–$64,000 followed by a drop below $62,500 would confirm sellers are back in control, targeting lower support at $61,800. CHR TAKEAWAY: Overall market activity remains quiet. Low-volume bounces in a leverage-heavy market favour cautious risk management. As noted in our earlier post, the Bitcoin futures market looks increasingly crowded, which could trigger significant market pain today. We will follow up shortly with a detailed Open Interest Update to break down current market leverage, positioning risks, and key liquidation levels.
Bitcoin open interest is starting to rebuild, but the broader derivatives market is still relatively controlled.
Total BTC open interest currently sits at:
• 754.07K BTC • $47.87B in notional OI • +0.01% over 1H • +0.90% over 4H • -0.01% over 24H
The 4H figure is the main development.
After the recent reduction in positioning, OI has started moving higher again. However, the virtually unchanged 24H figure tells us this is currently a short-term rebuild rather than a major expansion of leverage across the market.
That distinction is important.
Exchange positioning
Binance currently holds the largest share of BTC OI at 150.52K BTC, worth approximately $9.55B.
CME follows with 114.02K BTC, worth $7.24B, while Bybit holds 73.95K BTC, worth $4.70B.
Positioning is also diverging between exchanges.
MEXC OI is up 6.33% over 4H, while BingX has increased more than 30% over the same period.
Bybit is down 2.43% over 24H, while OKX and KuCoin are also lower.
This tells us the current increase is not a broad-based leverage surge across every major venue.
What matters from here
The next few hours are important.
If BTC continues higher while OI gradually increases, that would suggest fresh positioning is supporting the move.
If OI starts accelerating while price struggles to make progress, leverage would be building faster than the underlying price action, increasing the risk of a liquidation event.
If BTC falls alongside declining OI, that would point towards traders closing positions rather than aggressively adding new risk.
For now, we are seeing leverage return, but not an obvious excess.
The key is whether this 4H expansion develops into a sustained increase over the next 12 to 24 hours.
That will tell us far more than the headline OI number alone.
Bitcoin Liquidation Heatmap Update Bitcoin is moving back towards the largest nearby liquidation cluster after spending most of the session consolidating around $63K–$63.5K. Across the 12H, 24H and 3D heatmaps, the same key zones continue to stand out. The liquidity structure is becoming increasingly concentrated around the current range. $63.8K–$64K: Immediate upside liquidity The strongest nearby liquidity sits just above spot, around $63.8K–$64K. This zone has strengthened across the shorter-term heatmaps as BTC has pushed higher. That makes it the first major area to watch. If BTC moves into this region, the concentration of liquidation liquidity could accelerate the move as positions are forced to close. A clean sweep through the cluster would put the next upside liquidity around $65K–$65.5K into focus. $62.2K–$62.6K: Key downside liquidity There is also a significant concentration of liquidity immediately below the market. The $62.2K–$62.6K region remains clearly visible across the 12H, 24H and 3D maps. This is important because BTC has repeatedly consolidated above this area. A move into the zone could therefore trigger a meaningful flush of leveraged longs. If that liquidity is swept and BTC quickly reclaims the area, it would create a potentially strong setup for a reversal back towards the upside liquidity. If BTC loses it decisively, the next major liquidity pocket sits closer to $60.5K–$61K. The larger 3D picture The 3D heatmap gives us the clearest view of the broader positioning. There is substantial liquidity stacked on both sides of the current price rather than one overwhelmingly dominant pocket. Above: $63.8K–$64K $65K–$65.5K $66K+ Below: $62.2K–$62.6K $60.5K–$61K This creates a relatively defined liquidity range. The market does not need to break out immediately. It can continue moving between these pools while leverage gets repositioned. What we are watching The most important question is which liquidity pocket gets taken first. A push into $63.8K–$64K would test the overhead liquidation cluster and could produce a squeeze higher if BTC moves through it with momentum. A rejection followed by a move below $63K would shift attention towards the $62.2K–$62.6K long-liquidation pocket. That would be the key downside test. The important distinction is that a liquidation cluster is a zone of potential forced positioning, not a guaranteed price target. We are watching how BTC reacts when those levels are reached. CHR TAKEAWAY The heatmaps are giving us a very clean setup. BTC is sitting between two major liquidity pools: $63.8K–$64K above $62.2K–$62.6K below The nearest liquidity sits on both sides, meaning volatility could increase quickly once BTC starts moving away from the current consolidation. For now, the bias is not about predicting which side gets taken. It is about waiting for the liquidity sweep and then watching the reaction. Reclaim after a sweep = strength. Breakdown after a sweep = continuation risk. Until then, BTC remains trapped between two major pools of leveraged positioning.
Bitcoin 4H Market Structure Update Bitcoin is continuing to consolidate around the $63,000 level after failing to reclaim the $64,000 area. The 4H structure remains range-bound, with BTC currently sitting near the lower end of the recent range. The key levels are becoming increasingly clear. $63K remains the immediate floor BTC has repeatedly defended the $63,000 region over the last several sessions. Price has tested this area multiple times without a sustained breakdown, showing that buyers are still defending the current range floor. As long as $63K holds on a 4H closing basis, the broader range remains intact. A decisive loss of $63K would change that picture and put the $61K support zone back into focus. $64K is the level bulls need back $64,000 is now the most important level above the current price. BTC previously traded above this area, but after losing it, every recovery has struggled to establish a sustained reclaim. That makes $64K more than just resistance. It is the immediate market-structure level that needs to flip back into support. A clean reclaim and hold above $64K would be the first meaningful sign that buyers are regaining control. Above $64K If BTC can reclaim $64K, the next areas to watch are: $65,000 $65,700 $67,200 $65.7K remains a particularly important resistance zone, while $67.2K is the major resistance at the top of the current structure. A break above $65.7K would materially improve the 4H setup and increase the probability of another attempt at $67.2K. Below $63K The opposite scenario is equally important. A clean 4H breakdown below $63K would weaken the current consolidation and expose the lower part of the range. The next major support is around $61,000. That level has previously acted as a significant lower-range floor, so a move towards it would represent a meaningful deterioration from the current structure. TAKEAWAY Bitcoin is currently stuck between confirmation levels. $63K is the floor. $64K is the reclaim. $65.7K is the major resistance. $67.2K is the larger breakout level. For now, there is no reason to chase the middle of the range. We want to see confirmation. A sustained reclaim of $64K would start shifting the structure back in favour of the bulls. A break above $65.7K would strengthen that considerably. A loss of $63K would instead open the door towards $61K. Until one of those levels breaks, Bitcoin remains in consolidation. The next move matters more than the current noise.
$BTC exchange reserves have broken above the 200D SMA for the first time in a meaningful way, challenging the 2-year downtrend.
More BTC is becoming liquid again, A potential shift from supply scarcity toward distribution. If reserves stay above the 200D SMA + whale inflows rise → bearish pressure could accelerate.
Bitcoin funding remains positive, but the market is not showing signs of excessive long positioning. BTC’s current OI-weighted funding rate is 0.0041%, while the volume-weighted funding rate is higher at 0.0070%. Both are positive. That means longs are currently paying shorts to maintain perpetual positions, indicating a modest long bias across the derivatives market. What stands out The funding signal is remarkably consistent across the major exchanges. Current BTC funding: • Binance: 0.0029% • OKX: 0.0069% • Bybit: 0.0029% • KuCoin: 0.0040% • MEXC: 0.0028% • BingX: 0.0067% • Gate: 0.0027% • Bitunix: 0.0031% • Bitget: 0.0054% • WhiteBIT: 0.0100% • LBank: 0.0029% The majority of major venues are therefore showing positive funding at the same time. This is important because it suggests the current bias is broad-based rather than being driven by one isolated exchange. Funding is positive, but not overheated Positive funding by itself is not bearish. It simply tells us that longs are currently paying shorts. The level matters. At 0.0041% OI-weighted funding, BTC is showing a mild positive carry rather than an extreme long imbalance. That is very different from the kind of aggressive funding environment that can develop when traders become heavily leveraged and longs are paying increasingly large premiums to stay in positions. We are not seeing that here. The OI + funding combination matters more This becomes more interesting when we combine today's funding data with the open-interest update. BTC open interest was recently sitting around $47.46B, with OI down 1.14% over 24 hours. So we currently have: Positive funding + Falling open interest + BTC around $63K That tells us the market still has a slight long bias, but traders are not aggressively adding leverage. Instead, some positioning is being removed while the remaining derivatives market continues to lean slightly long. That is a much healthier setup than positive funding combined with rapidly expanding OI. What we are watching The next move in funding will be important. If BTC reclaims $64K and funding rises alongside expanding OI, that would show traders are becoming more confident and adding fresh long exposure. If BTC remains below $64K while funding stays positive and OI continues falling, it would suggest the market is gradually de-risking rather than preparing for a strong leveraged breakout. And if funding suddenly pushes sharply higher while OI expands, that is where we would start paying much closer attention to potential long overcrowding. CHR TAKEAWAY The derivatives market is currently mildly long-biased, but it is not showing signs of extreme leverage. Funding is positive across the major BTC venues, yet open interest is declining. That distinction matters. For now, the data points towards controlled positioning rather than an overheated long market. The key confirmation remains price. $64K reclaim + rising OI + controlled funding would strengthen the bullish case. Continued rejection below $64K + falling OI would indicate that leverage is still being removed. Funding is telling us which side is paying. Open interest is telling us how much leverage is actually being deployed. Right now, both are pointing to a market that is cautious rather than crowded.
BITCOIN OPEN INTEREST UPDATE Bitcoin’s derivatives market is continuing to deleverage. Total BTC open interest currently sits at 753.73K BTC, equivalent to approximately $47.46B across tracked exchanges. OI is down: • 0.21% over 1H • 0.92% over 4H • 1.14% over 24H At the same time, Bitcoin is trading around $63K. WHAT THIS TELLS US The important point is that leverage is coming out of the market while price remains relatively stable. This is not the same setup as a market where OI is aggressively expanding alongside price. Instead, traders are gradually reducing exposure. That can be constructive from a positioning perspective because excessive leverage is being flushed out, reducing the amount of forced positioning sitting in the market. However, it also tells us that conviction has not yet returned. BTC is still struggling below the $64K area, so the market has not provided the price confirmation needed for aggressive leverage to rebuild. EXCHANGE BREAKDOWN Binance remains the largest contributor with: 151.80K BTC OI $9.56B notional 20.13% of total OI CME follows with: 114.02K BTC $7.18B notional 15.12% of total OI Bybit currently holds 76.05K BTC, while Gate and MEXC account for another 67.96K and 59.74K BTC respectively. The distribution remains heavily concentrated across the major derivatives venues. THE BIGGER PICTURE The longer-term chart shows how far leverage has already contracted from the much higher OI levels seen during previous periods of elevated market activity. With total OI now around $47.5B, the derivatives market is considerably less crowded than it was at its previous extremes. That matters. If BTC eventually reclaims $64K and begins moving higher while OI starts expanding again, that would suggest traders are returning with fresh exposure and would give the move greater significance. If price continues struggling around $63K while OI keeps falling, it would instead indicate continued deleveraging and a market still lacking conviction. CHR TAKEAWAY Bitcoin is not currently showing an aggressive leverage build. It is showing the opposite. OI is declining while BTC consolidates around $63K, meaning some of the speculative positioning is being removed from the market. For now, that leaves us watching two things closely: $64K reclaim + OI expansion = stronger confirmation $63K loss + continued OI contraction = further deleveraging risk The next meaningful signal will come from how open interest responds when Bitcoin finally makes its next decisive move. OI data is useful for understanding positioning, but it does not tell us direction on its own. The price response is what ultimately matters.
The closest major liquidity sits on both sides of the current price.
Above BTC, the $63.7K–$64K region contains a significant concentration of liquidation liquidity.
A move through this area could trigger short liquidations and accelerate a move towards the $65K–$66K region.
Below BTC, the $62.3K–$62.7K area is showing an equally important concentration of leveraged longs.
This makes the current $63K region particularly important.
A move below $62.7K could begin forcing long positions out of the market, potentially creating a cascade towards the next liquidity pockets around $60.5K.
Conversely, reclaiming $64K would put the large upside liquidity around $65.5K–$66K back into focus.
MULTI-TIMEFRAME READ
The key point is the consistency across the heatmaps.
The 12H, 24H and 3D views all show concentrated liquidity immediately above and below the current price.
This means BTC is sitting in a highly leveraged area where a relatively small move could trigger forced flows and amplify the initial direction.
CHR TAKEAWAY
Bitcoin is effectively sitting between two liquidation magnets.
$62.3K–$62.7K below.
$63.7K–$64K above.
A sweep of either zone could provide the fuel for the next larger move.
For now, the heatmap does not give us a directional signal by itself.
It tells us where the leverage is.
The next move into one of these zones is what matters.