
方鸣kaw
819 Posts

方鸣kaw
Crypto x AI x 美股,趋势判断,科普逻辑,链上金狗官,一切分析都是个人观点,无关行情都是娱乐!(公众号:鸣鸣币院)
Frequent Trader
5.5 Years
41 Following
1.0K+ Followers
3.7K+ Liked
Posts
All
Quotes
Videos
See translation
链上异动!龙虾代币大额筹码增幅,占比超14%根据链上监测数据,
龙虾代币
(合约地址:0xeccbb861c0dda7efd964010085488b69317e4444)
近期出现引发人们关注的大额交易活动。
监测数据显示,约1.44亿枚(144,452,986枚)该代币已转入与Aster相关联的地址,数量相当于代币总流通供应量的14.4453%左右,比例不容小觑。
如此规模的筹码转移,通常会引发市场对项目方或相关关联方集中存在后续动作的猜测。
不过截至目前,思考具体内部的意图,无论是内部调仓、生态合作,还是其他安排,官方尚未给出任何说明或确认。
⚠️由于涉及代币量级加大,一旦本批筹码后续出现集中卖出、二次循环等链上操作,很可能会对代币的市场流动性和价格走势带来冲击。建议密切关注相关地址的后续动向,警惕短期内可能出现明显的价格波动,做好风险防范。
CA:0xeccbb861c0dda7efd964010085488b69317e4444
龙虾代币
(合约地址:0xeccbb861c0dda7efd964010085488b69317e4444)
近期出现引发人们关注的大额交易活动。
监测数据显示,约1.44亿枚(144,452,986枚)该代币已转入与Aster相关联的地址,数量相当于代币总流通供应量的14.4453%左右,比例不容小觑。
如此规模的筹码转移,通常会引发市场对项目方或相关关联方集中存在后续动作的猜测。
不过截至目前,思考具体内部的意图,无论是内部调仓、生态合作,还是其他安排,官方尚未给出任何说明或确认。
⚠️由于涉及代币量级加大,一旦本批筹码后续出现集中卖出、二次循环等链上操作,很可能会对代币的市场流动性和价格走势带来冲击。建议密切关注相关地址的后续动向,警惕短期内可能出现明显的价格波动,做好风险防范。
CA:0xeccbb861c0dda7efd964010085488b69317e4444
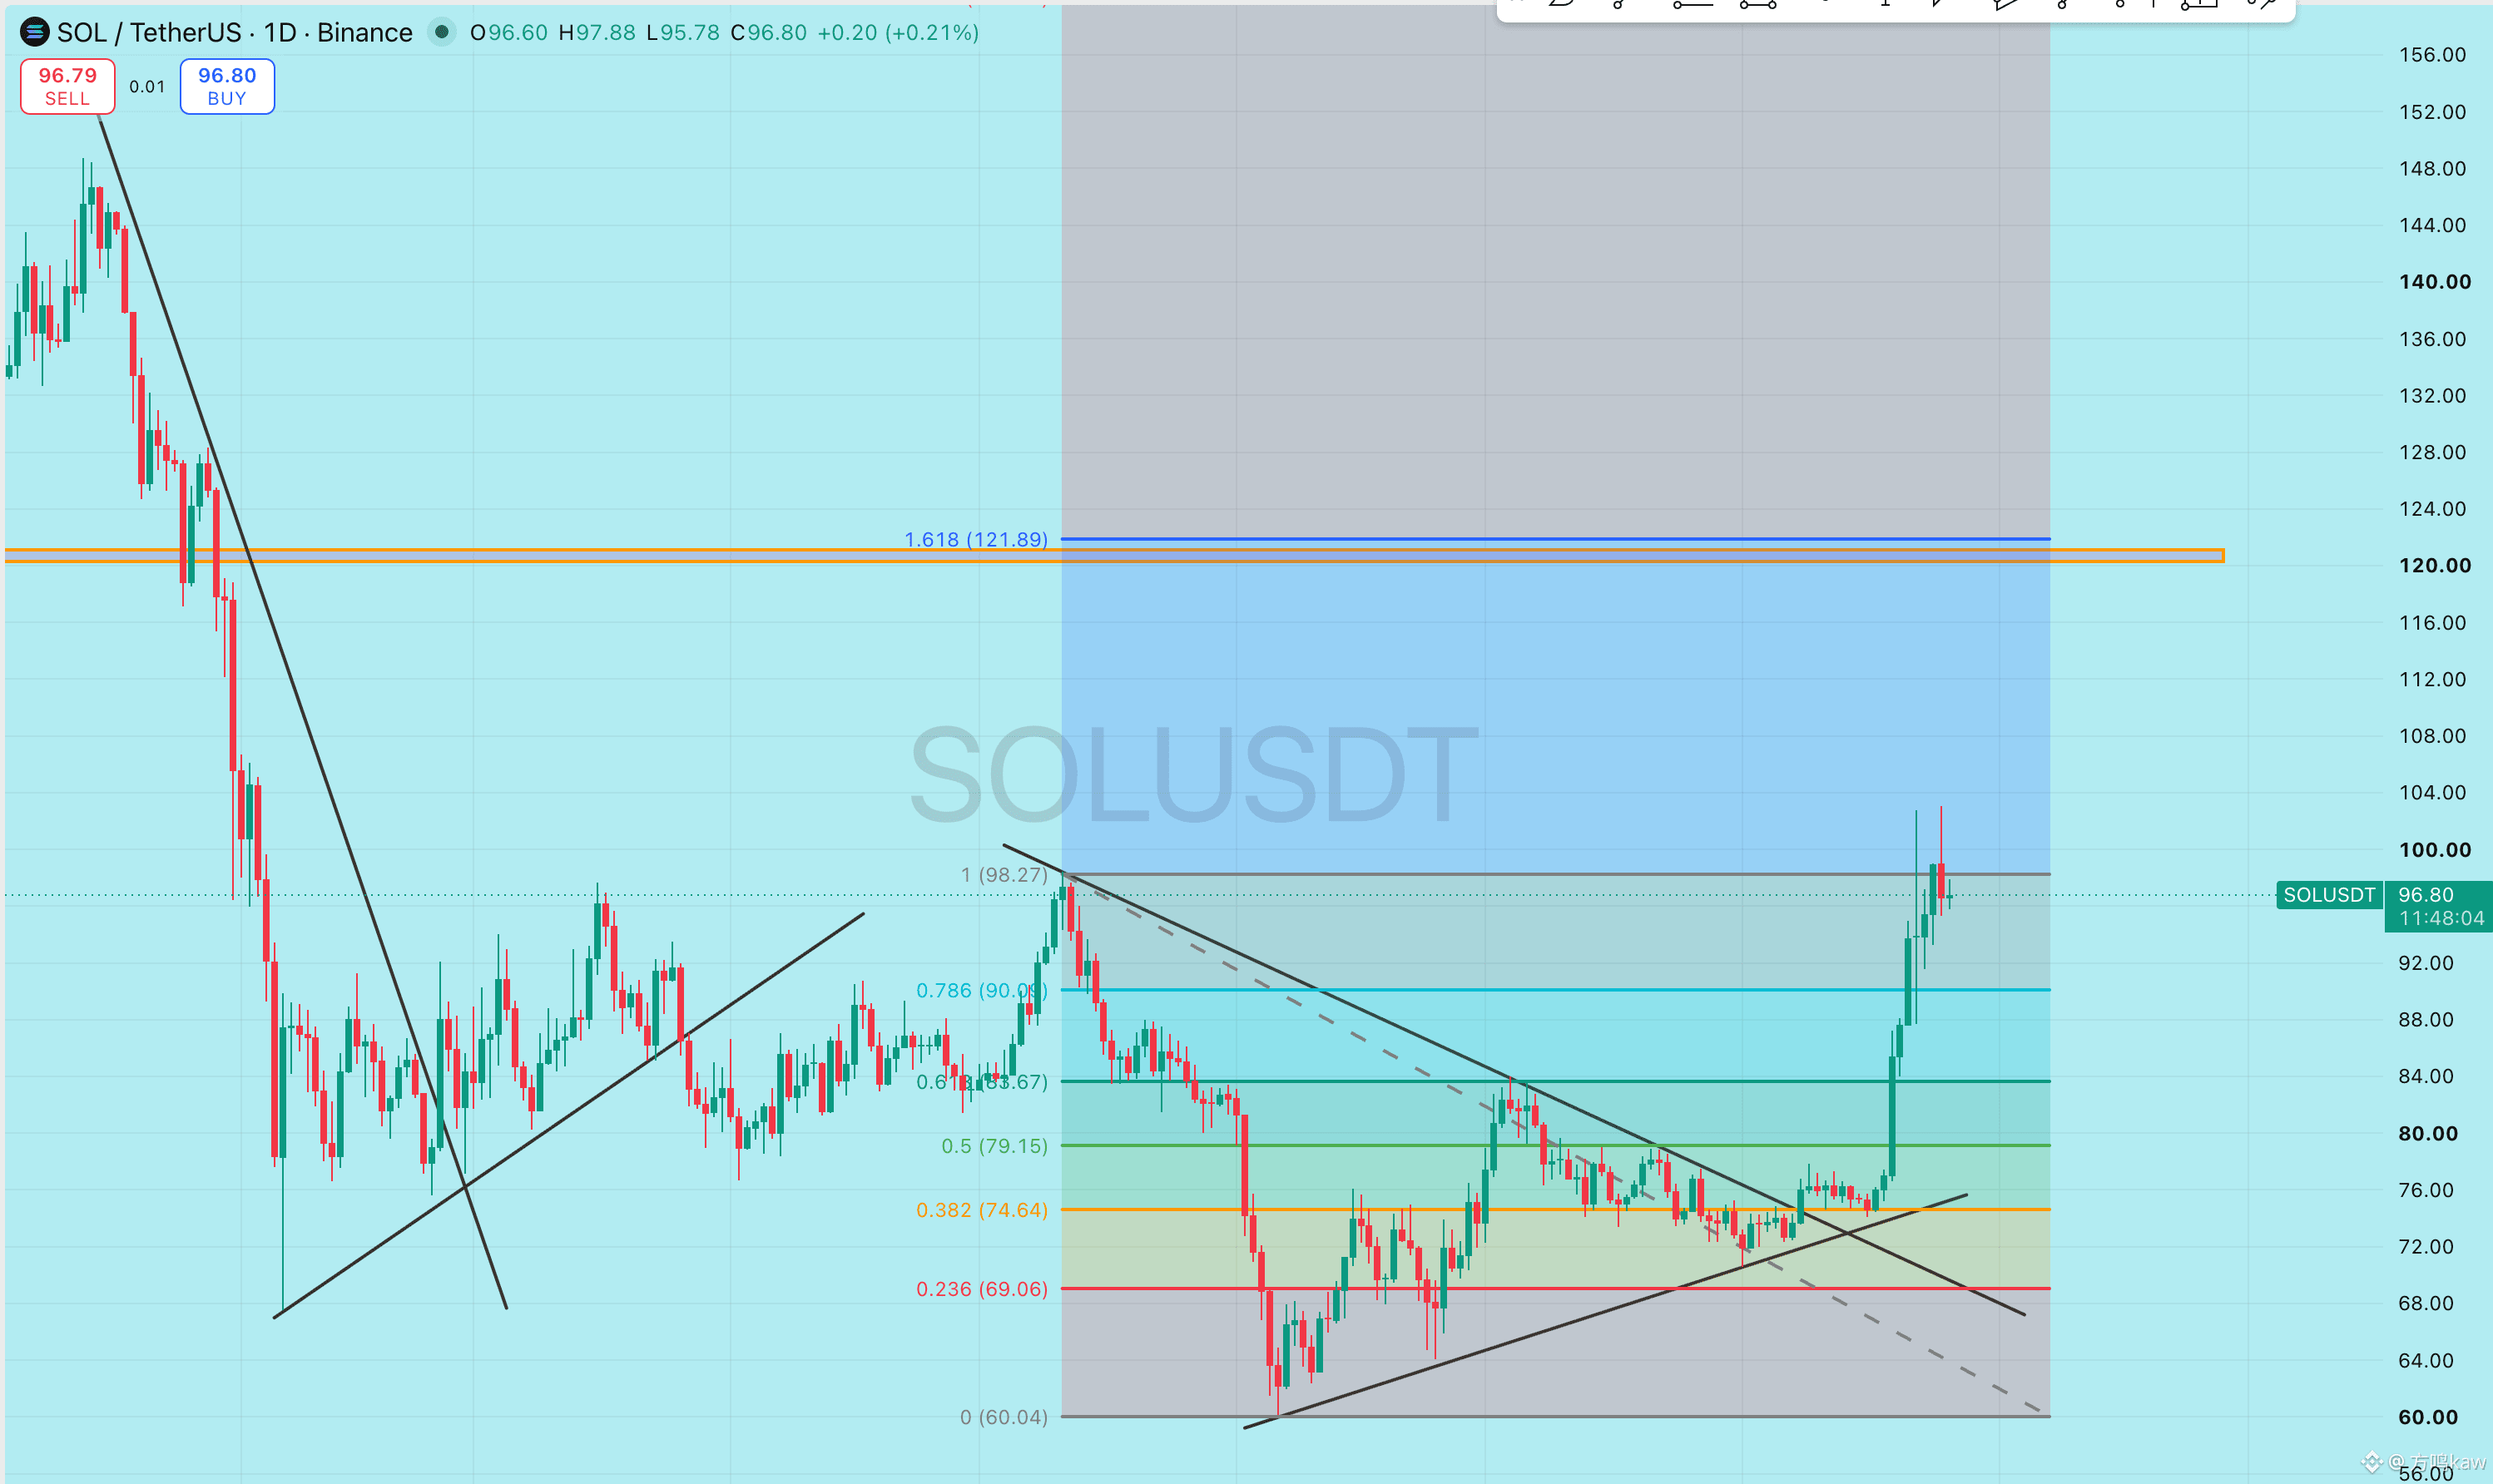
SOL100 integer gate failed to hold; during the session the low dipped to 95. 96 is the current first support. After it breaks, watch 95; below that, pay attention to the area around 92. On the upside, it needs to first reclaim 99, regain it firmly at 100, and only then will there be a chance to test 101 to 103. SOL ETF inflows are still net positive, which supports its relative strength as a fundamental factor. However, the price has already fallen back below 100, indicating that the capital tailwind has not fully offset profit-taking for now. For the short term, it’s better to wait for support to confirm rather than bet on a rebound early.
XRP 1.40 is the most important near-term support today. If it breaks, we’ll look again at 1.35. On the upside, it needs to reclaim 1.46 and then 1.50 in sequence. I didn’t find any new regulatory actions, partnerships, or product events today that would be sufficient on their own to change XRP’s pricing. Therefore, for now we treat it as tracking the broader market, and we can’t keep forcing an explanation of the current price using the earlier policy narrative.
XRP 1.40 is the most important near-term support today. If it breaks, we’ll look again at 1.35. On the upside, it needs to reclaim 1.46 and then 1.50 in sequence. I didn’t find any new regulatory actions, partnerships, or product events today that would be sufficient on their own to change XRP’s pricing. Therefore, for now we treat it as tracking the broader market, and we can’t keep forcing an explanation of the current price using the earlier policy narrative.
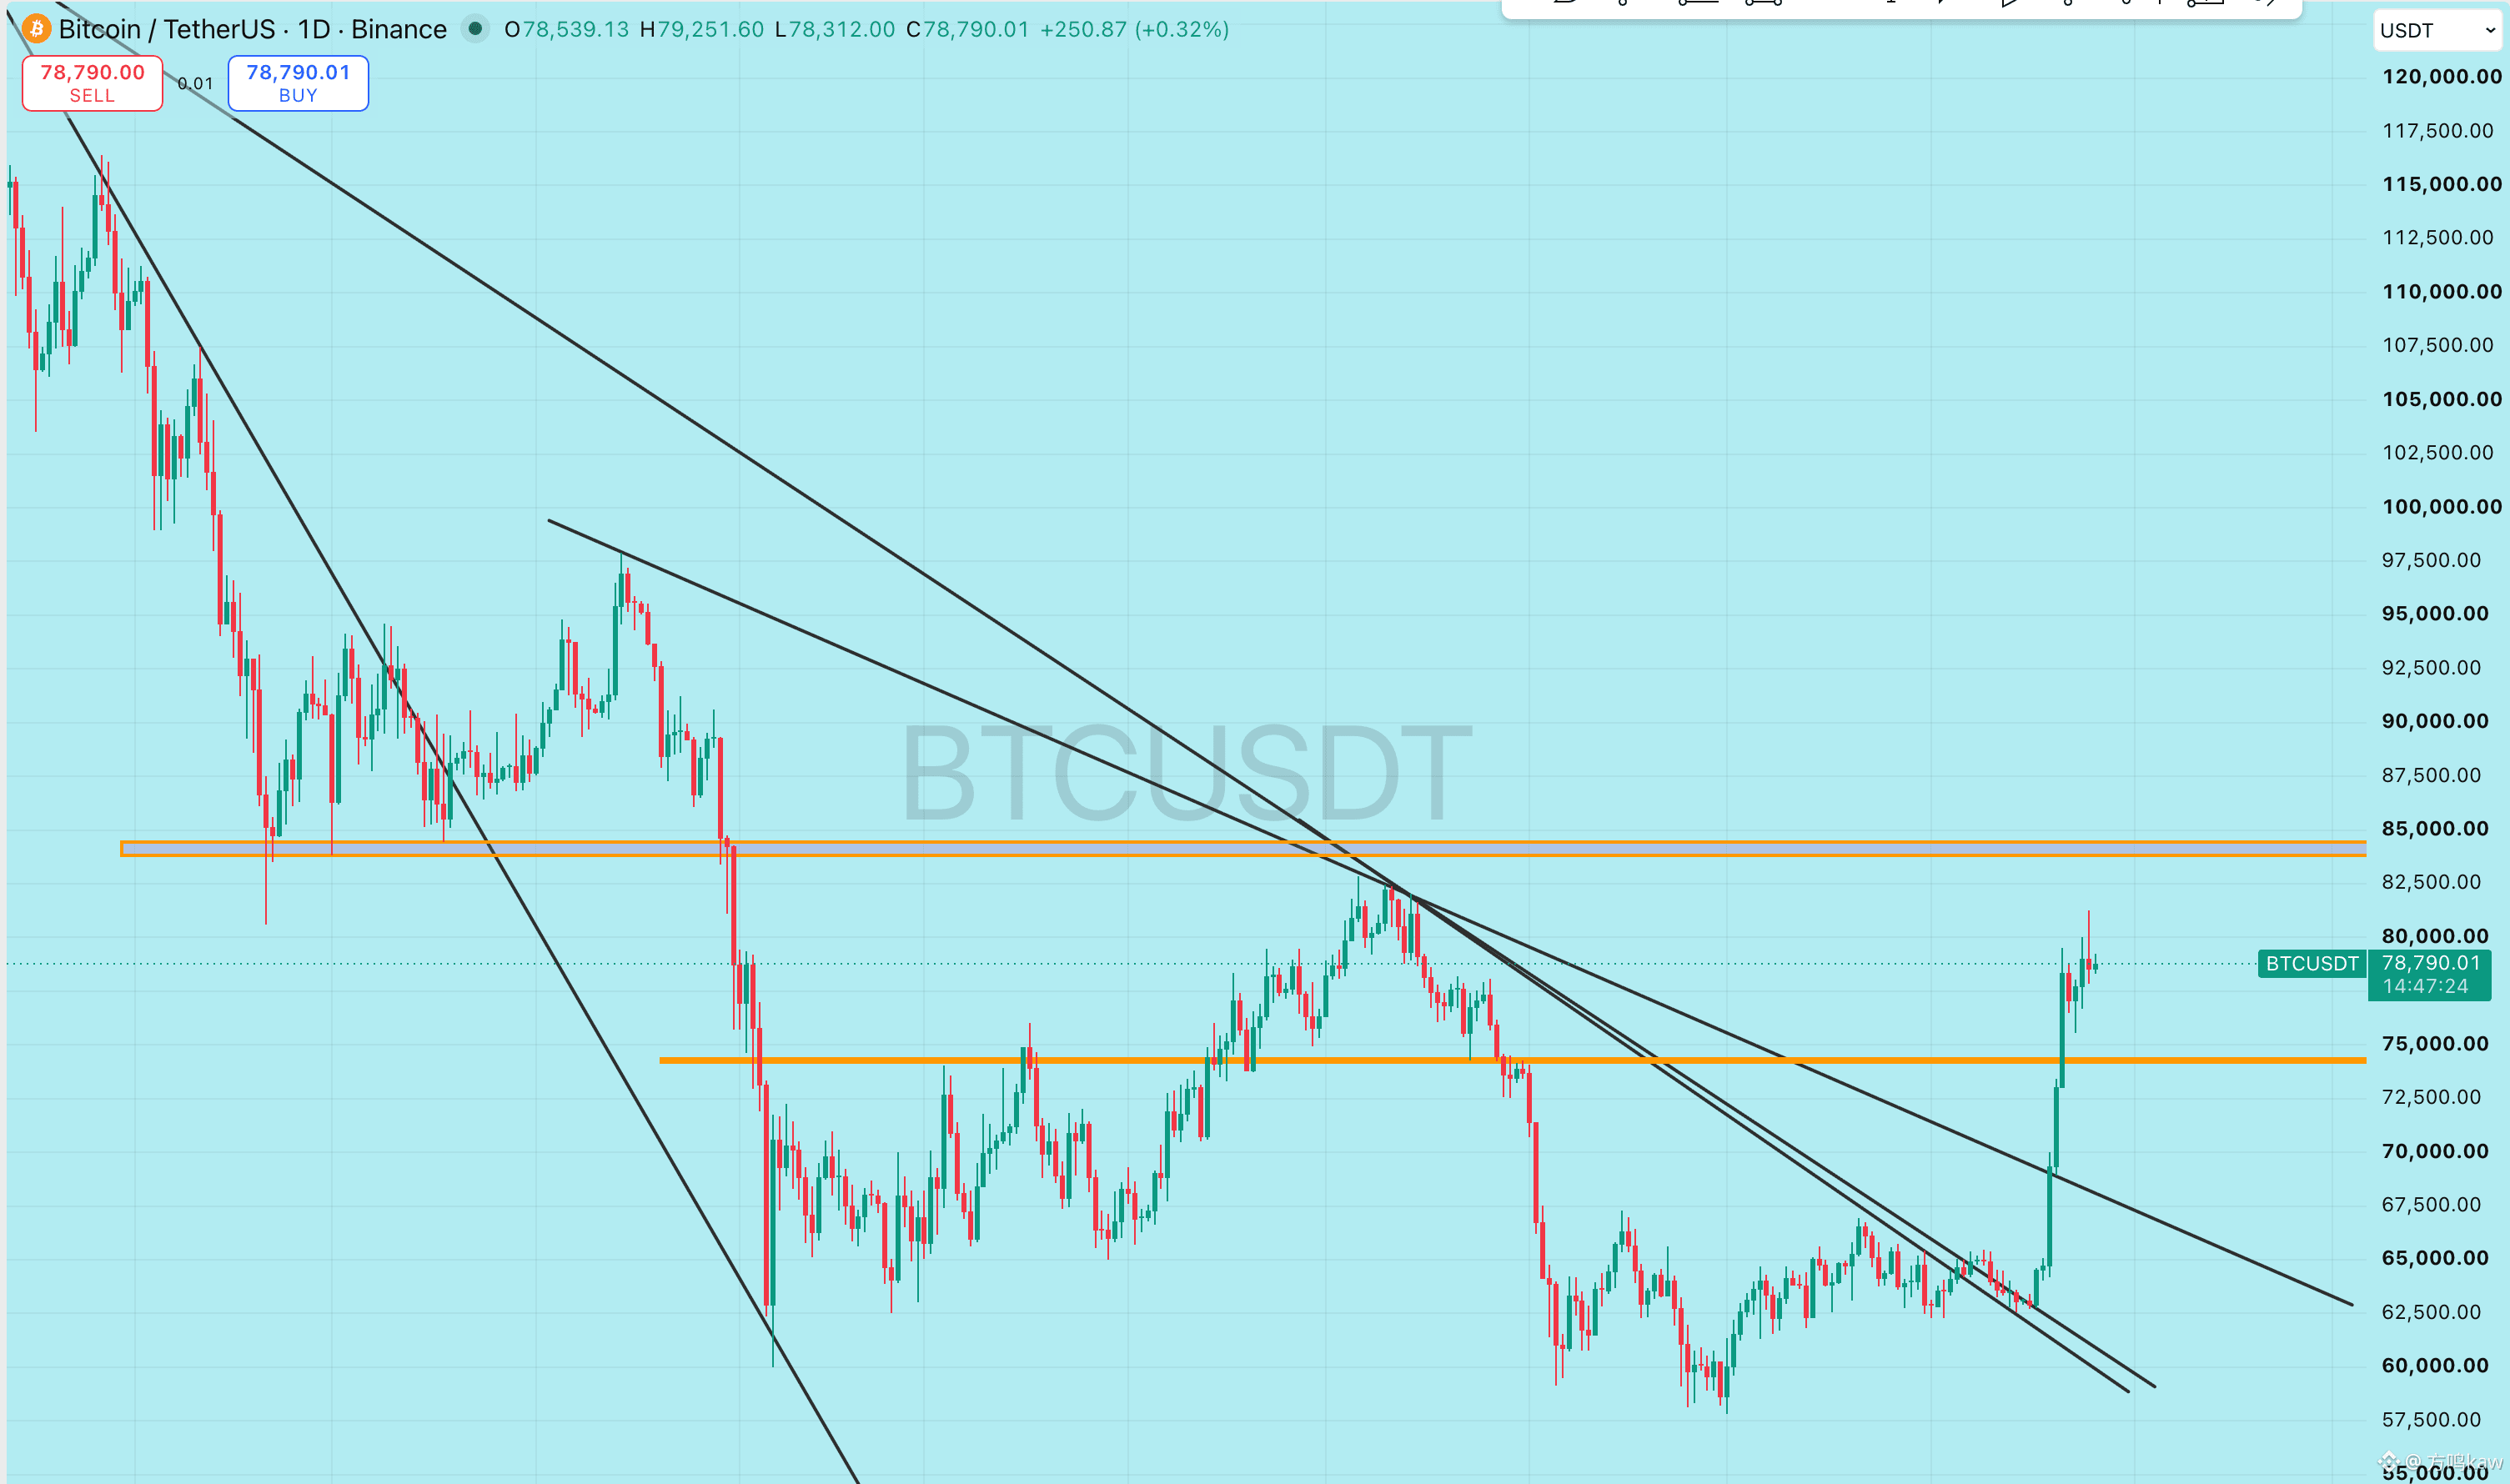
The big pancake is currently hovering around 78,700. The 80,000 level was not successfully defended today, and during the session the low reached 77,851. The 78,500 area is the nearest support/consolidation zone right now; if it breaks, we need to watch the 77,850 to 77,000 range. If this area can still hold, the current upswing is still likely to be a high-level consolidation. On the upside, price first needs to reclaim 80,000, then break above 80,124 in order to test around 81,200 again.
ETF inflows are still coming in, which means you shouldn’t directly interpret this pullback as a trend reversal. However, before 80,000 is regained, it’s also not appropriate to treat every rebound as a breakout.
As for Ethereum, the intraday low at 2415 has already provided a short-term support level. If 2415 to 2400 holds, there may still be an opportunity to retest 2490 and 2500 later. If 2400 breaks, the market will re-evaluate the strength of this rebound/repair. ETH’s ETF inflow is higher than the previous day—liquidity conditions haven’t worsened—but price is still being influenced by the big pancake’s pullback. So the short-term focus is not chasing gains; it’s about observing whether an effective turnover (sustained trading/rotation) can form above 2400.
ETF inflows are still coming in, which means you shouldn’t directly interpret this pullback as a trend reversal. However, before 80,000 is regained, it’s also not appropriate to treat every rebound as a breakout.
As for Ethereum, the intraday low at 2415 has already provided a short-term support level. If 2415 to 2400 holds, there may still be an opportunity to retest 2490 and 2500 later. If 2400 breaks, the market will re-evaluate the strength of this rebound/repair. ETH’s ETF inflow is higher than the previous day—liquidity conditions haven’t worsened—but price is still being influenced by the big pancake’s pullback. So the short-term focus is not chasing gains; it’s about observing whether an effective turnover (sustained trading/rotation) can form above 2400.
BGB has reached a high of 1.97; the trading pattern is steadier than the past few days, but it still needs one final step to truly turn stronger. The 1.90 to 1.88 zone is the support/continuation area below—if it breaks down, this round of correction is likely to wind down. To the upside, only a breakout above 1.97 gives a chance to retest 2.00. Regarding Bitget, today there were no new platform-coin-level positive catalysts found; for now, BGB is still following overall market sentiment in its rebound. If its independence isn’t strong enough, the key is to watch whether BTC can maintain strength.
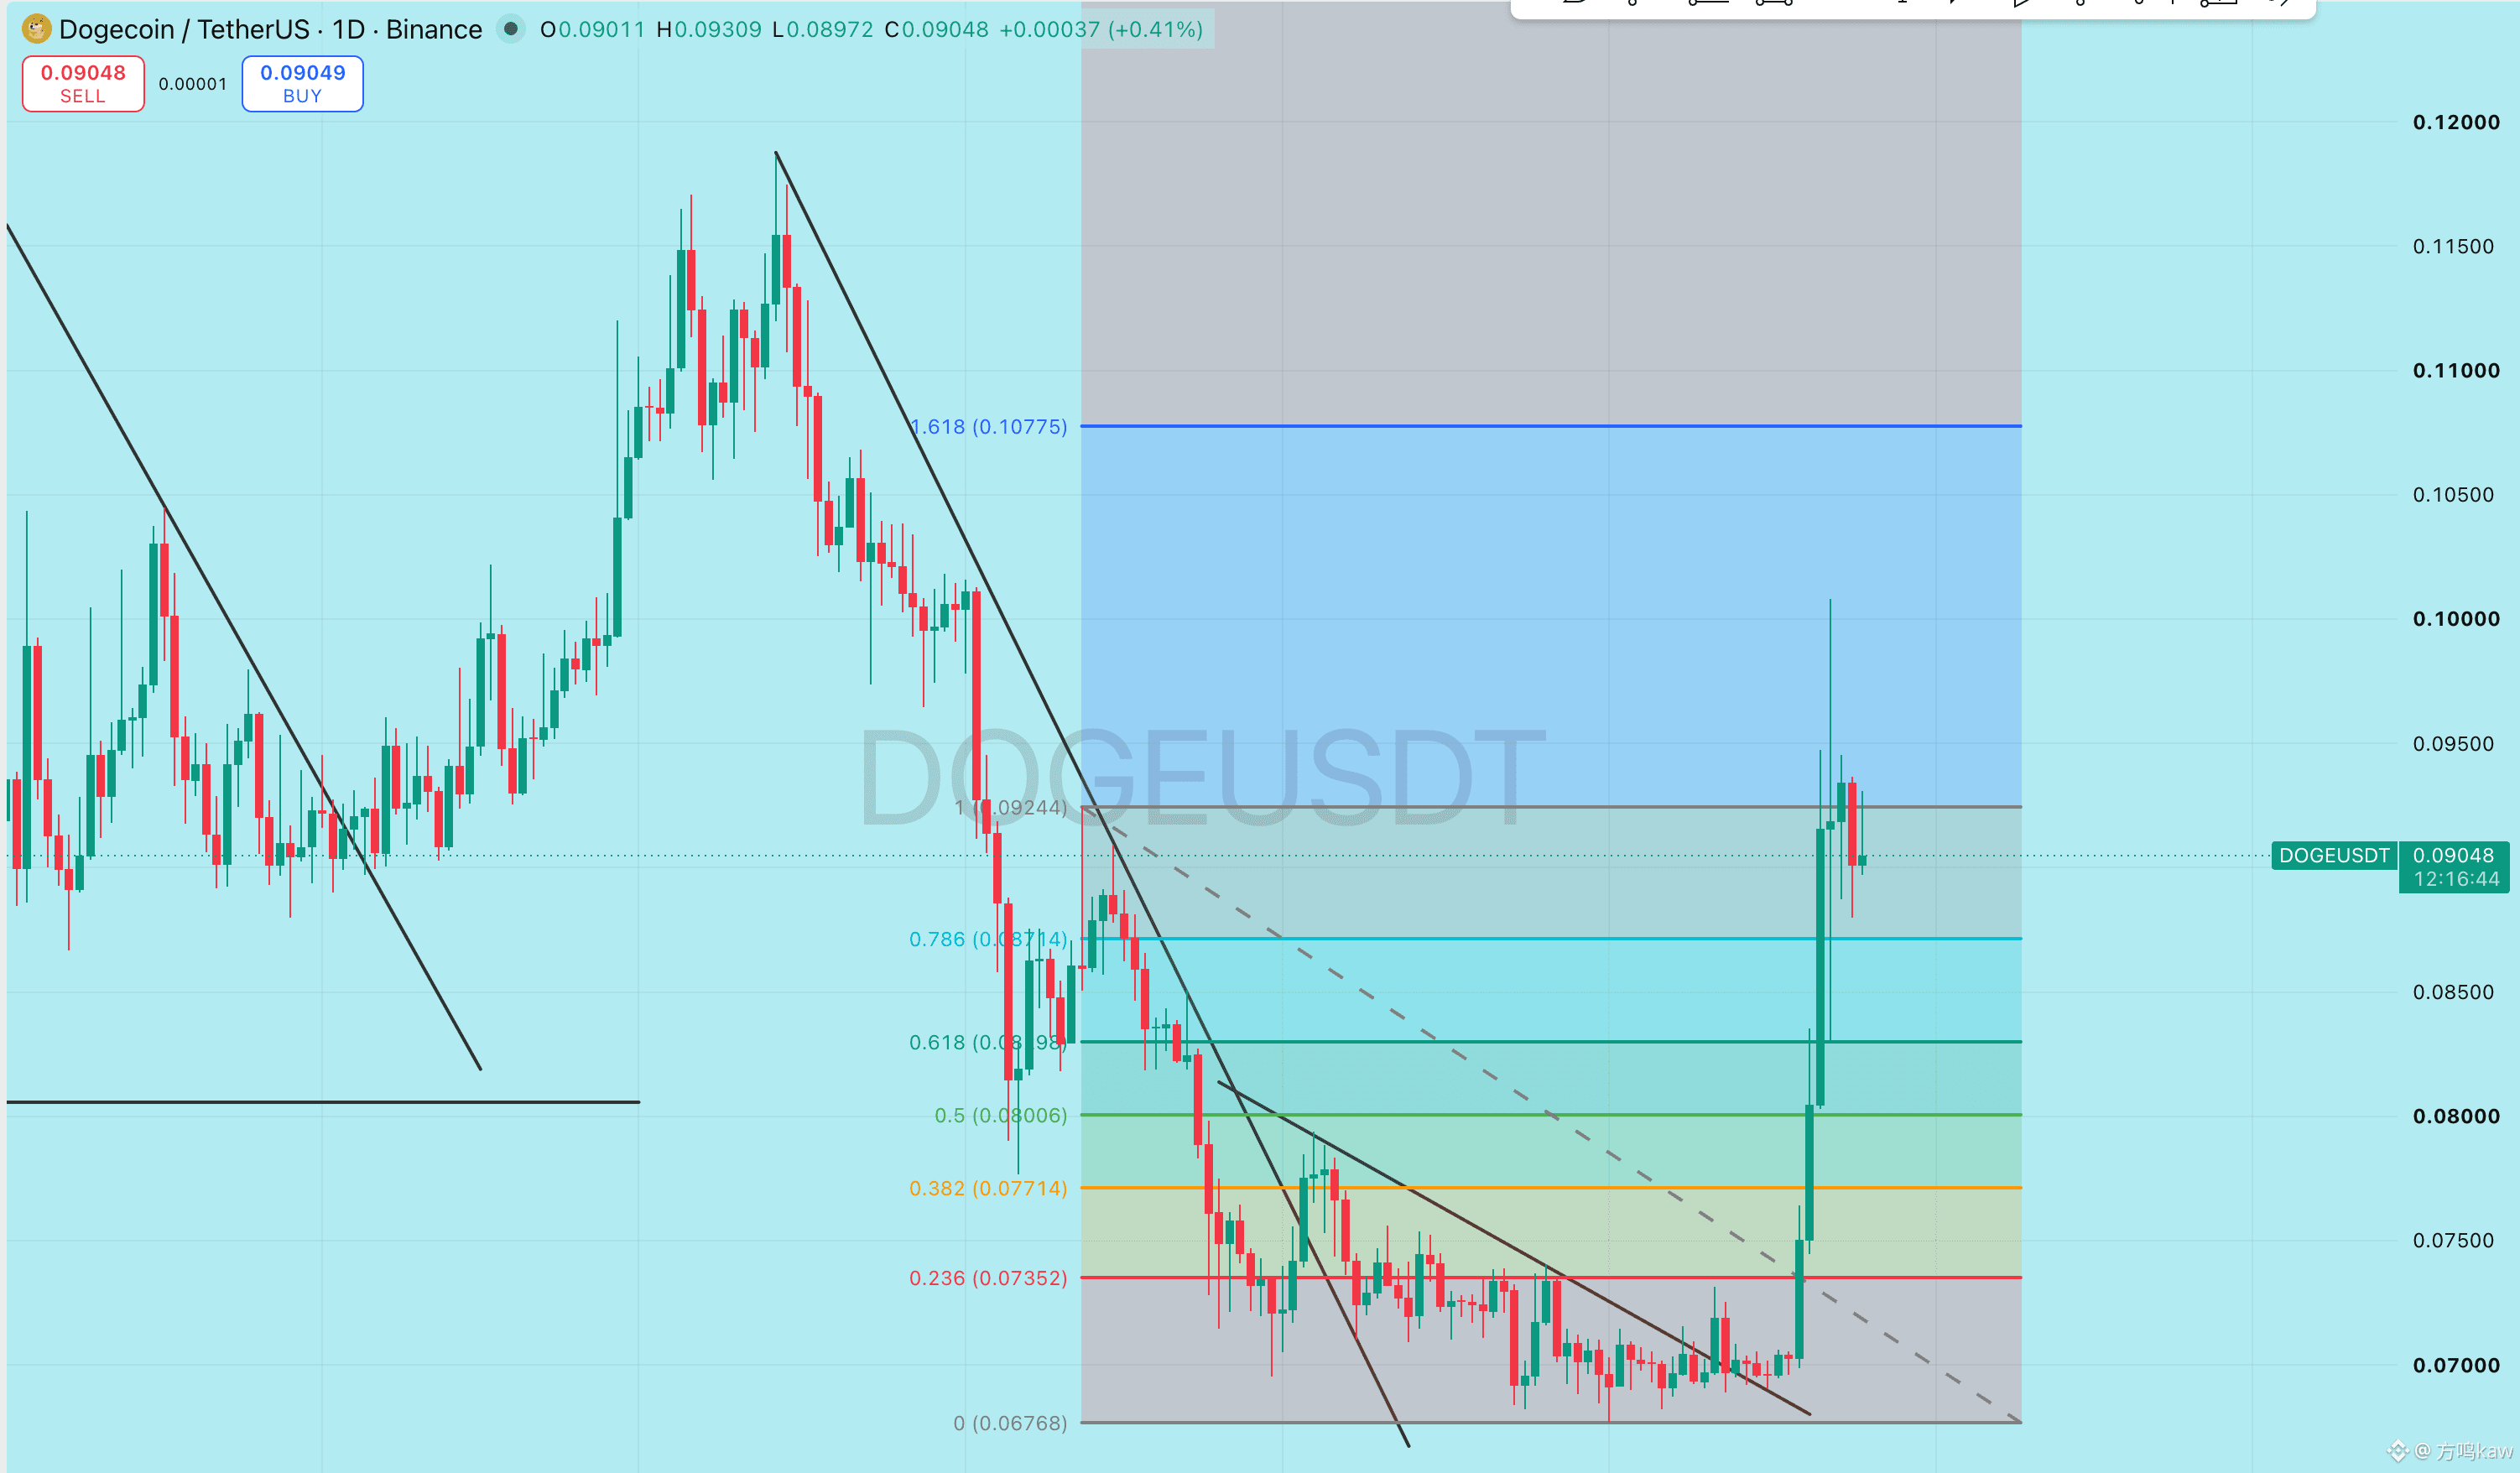
For DOGE, it spiked intraday to 0.093 and then pulled back; 0.090 is still the most direct boundary between long and short. Holding above 0.090 keeps the outlook aimed at 0.093 and 0.095; if it breaks below, then pay attention to support around 0.088. If 0.088 can’t be held either, the rebound structure will clearly weaken. DOGE has no new payment, Musk, or ecosystem-related news to support today’s move; the volatility mainly comes from a rebound in risk appetite—when risk-on, the upside has more elasticity, and when the tide turns, it’s also easiest to be the first to pull back.
For DOGE, it spiked intraday to 0.093 and then pulled back; 0.090 is still the most direct boundary between long and short. Holding above 0.090 keeps the outlook aimed at 0.093 and 0.095; if it breaks below, then pay attention to support around 0.088. If 0.088 can’t be held either, the rebound structure will clearly weaken. DOGE has no new payment, Musk, or ecosystem-related news to support today’s move; the volatility mainly comes from a rebound in risk appetite—when risk-on, the upside has more elasticity, and when the tide turns, it’s also easiest to be the first to pull back.
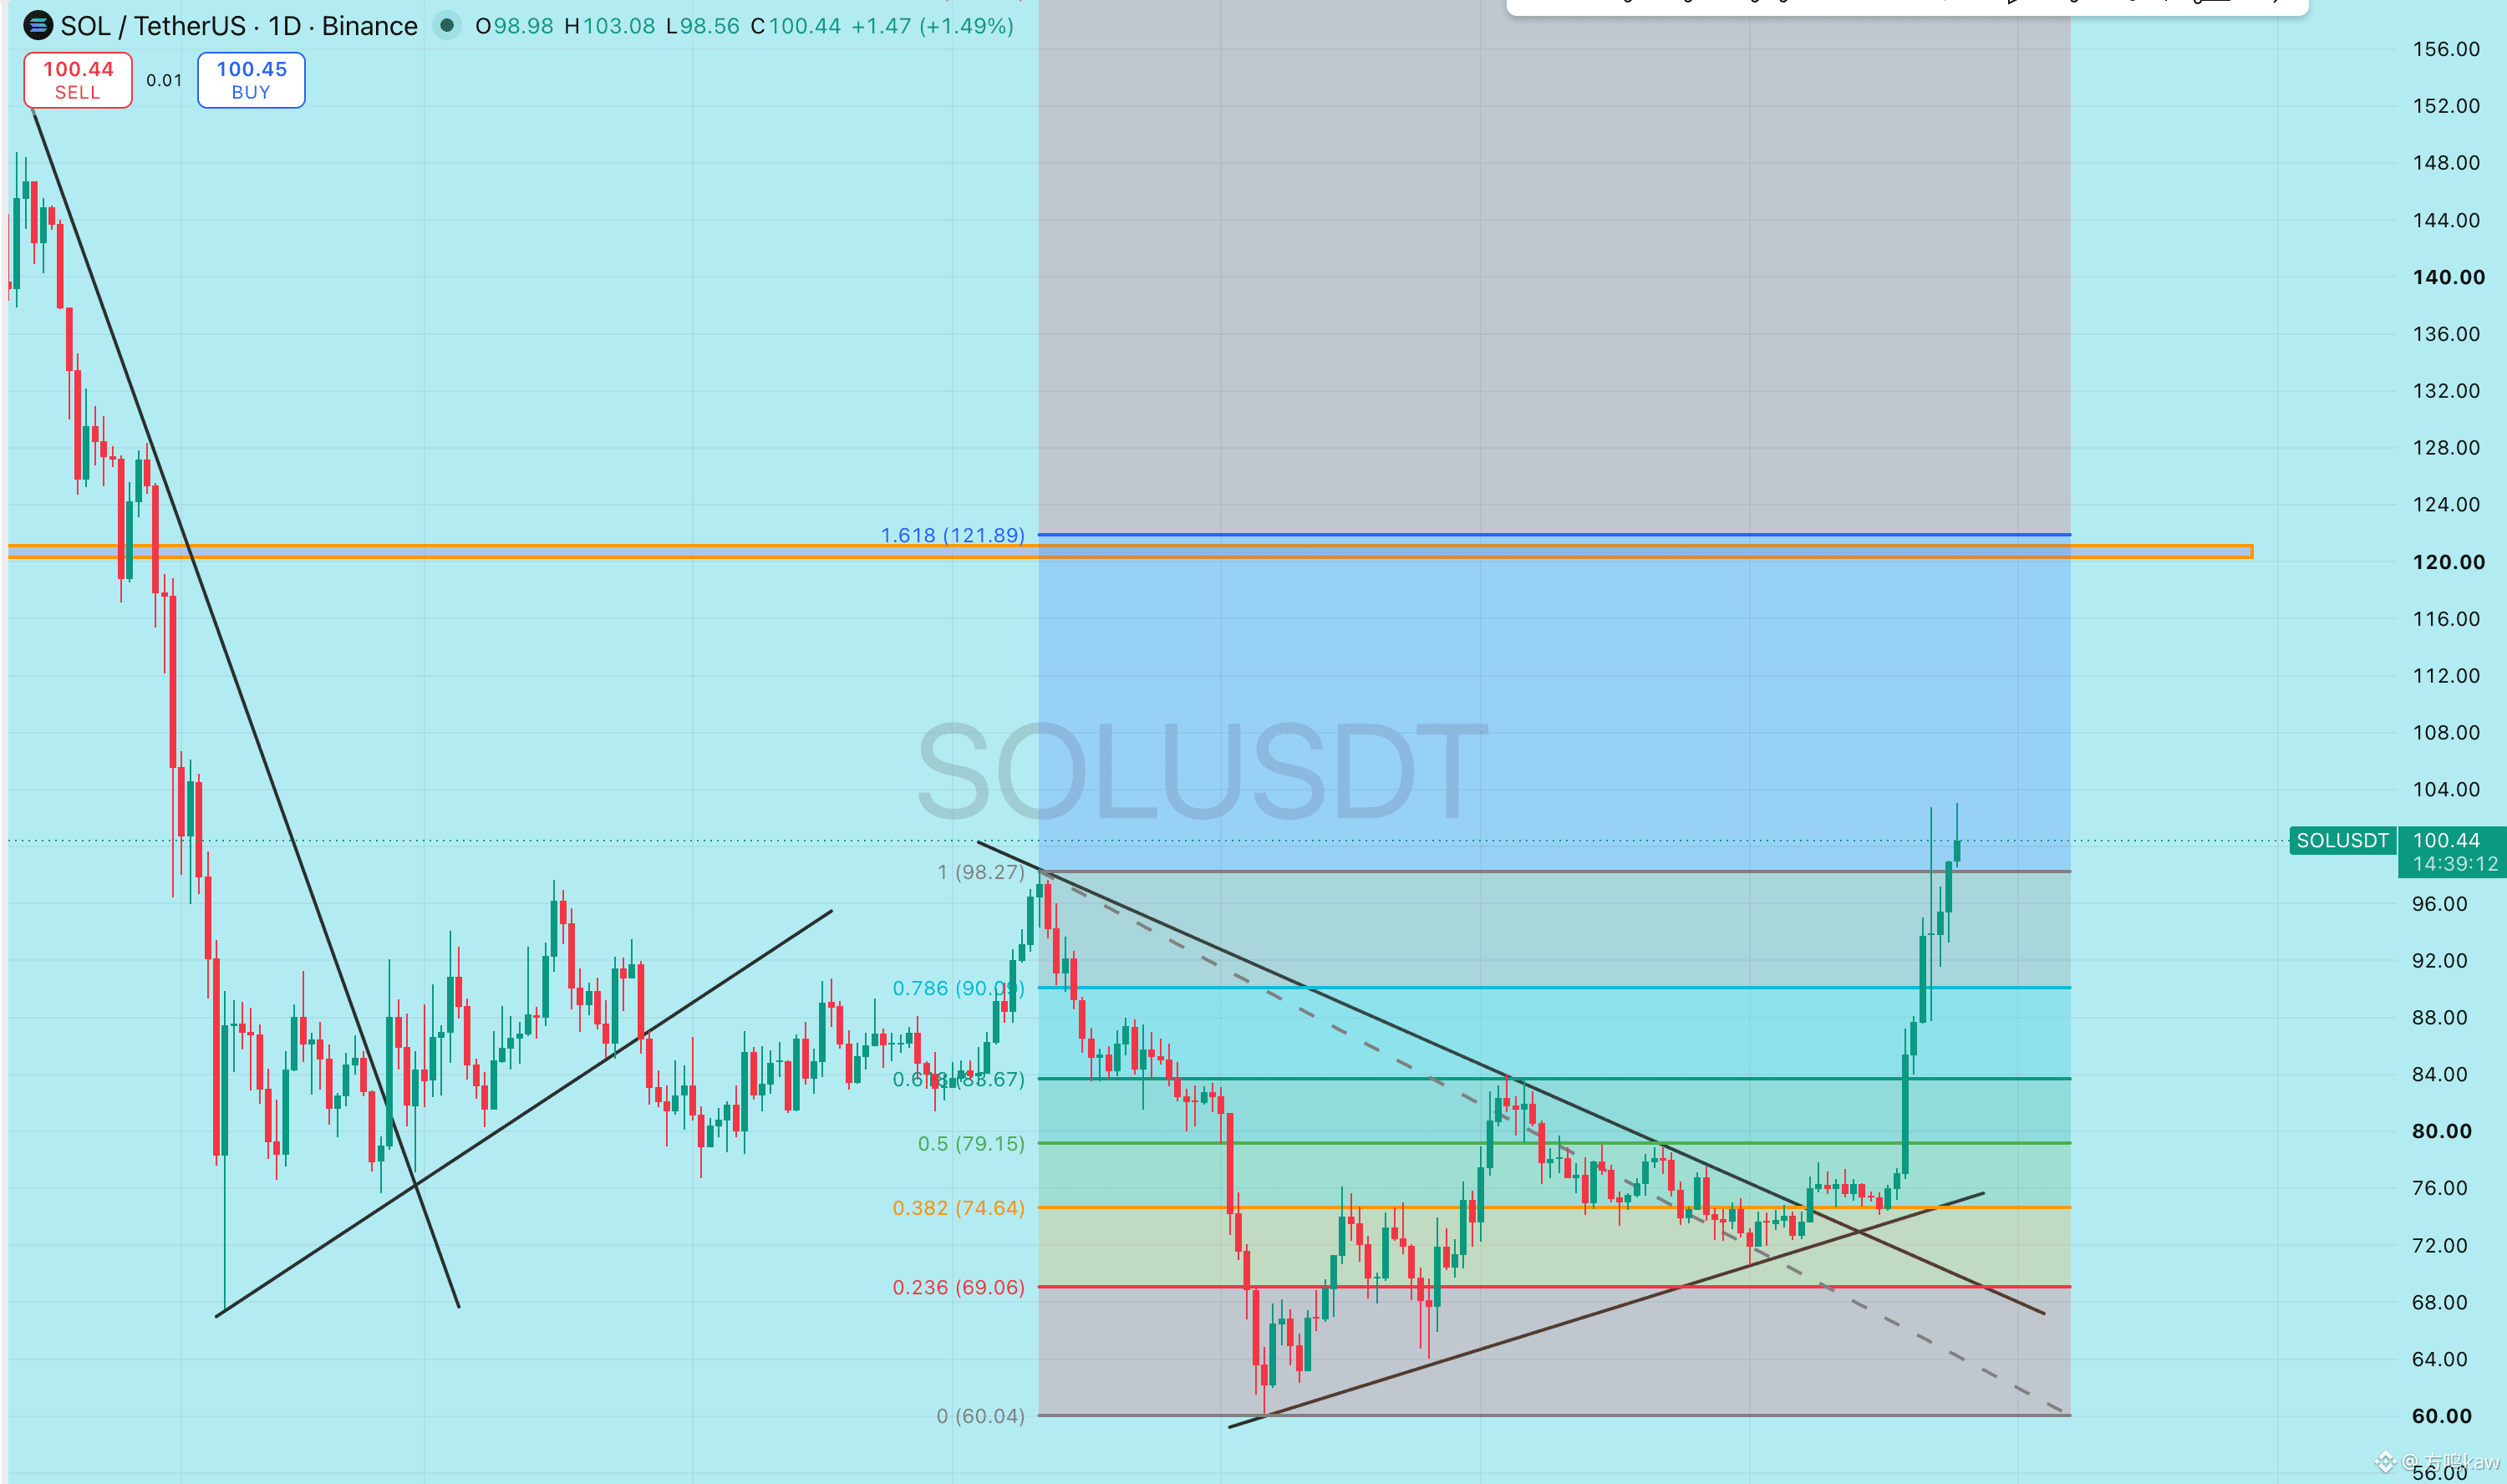
SOL is trading near 100; during the session, the intraday high reached 103, and the capital elasticity is clearly stronger than most mainstream altcoins. 99 is today’s nearest support—if it holds, there is still room to test 103 and 105 again. If price falls back below 99, it is likely to retrace toward 96, and 94 is the level that this round of rebound should not easily lose. SOL ETF single-day inflows have increased noticeably, which has indeed brought fresh attention to the market. However, at the project level, no sudden catalyst was found that would be sufficient on its own to change the pricing dynamics. So this upward move still has the component of risk-on sentiment pushed by the broader market; being above 100 does not mean pullbacks can be ignored.
XRP is consolidating around 1.49. Earlier it surged to 1.55, but it failed to expand further, suggesting that there is still sell pressure above 1.50. 1.46 is short-term support—if it breaks, look for 1.40. To the upside, XRP needs to first reclaim 1.50 and then break above 1.55 before there’s a chance to open up room toward around 1.60. Today there was no confirmation of any new regulatory or project-related news that could change XRP’s independent pricing. For now, XRP is mainly benefiting from the overall market recovery and high-volatility rotation, and you cannot directly treat the broader market’s rise as XRP-specific good news.
XRP is consolidating around 1.49. Earlier it surged to 1.55, but it failed to expand further, suggesting that there is still sell pressure above 1.50. 1.46 is short-term support—if it breaks, look for 1.40. To the upside, XRP needs to first reclaim 1.50 and then break above 1.55 before there’s a chance to open up room toward around 1.60. Today there was no confirmation of any new regulatory or project-related news that could change XRP’s independent pricing. For now, XRP is mainly benefiting from the overall market recovery and high-volatility rotation, and you cannot directly treat the broader market’s rise as XRP-specific good news.
The big pancake is currently consolidating. The intraday high reached 81,273, and the 80,000 integer level has shifted from being a pressure point to becoming a tug-of-war zone for both bulls and bears. If the price can reclaim and hold above 80,000, then later it can continue to be watched toward 81,200 to 82,000. If it still can’t recapture 80,000, then the downside first to watch is 79,000; after a break, the key levels to focus on are 78,500 and 77,000. ETF inflows for spot remain supportive of the trend, but high-level inflows shouldn’t be interpreted as meaning you can chase every bullish candle. Real strength should show up as shallow pullbacks with support holding intact—not being pushed higher nonstop purely on sentiment.
Ethereum is trading around 2,480. The intraday high was 2,533, and the price still hasn’t fully escaped the repeated back-and-forth around the 2,500 area. 2,450 is the most recent consolidation/absorption level. As long as it holds, the price can continue to test 2,530; only with a true breakout above 2,530 is there a chance to look toward 2,600. If 2,450 breaks, then 2,400 will become the next key support level. ETH ETF capital has continued to see net inflows, indicating that spot buying hasn’t withdrawn, but it currently looks more like a steady repair rather than a one-way acceleration. In the short term, it still depends on whether BTC can hold above 80,000.
Ethereum is trading around 2,480. The intraday high was 2,533, and the price still hasn’t fully escaped the repeated back-and-forth around the 2,500 area. 2,450 is the most recent consolidation/absorption level. As long as it holds, the price can continue to test 2,530; only with a true breakout above 2,530 is there a chance to look toward 2,600. If 2,450 breaks, then 2,400 will become the next key support level. ETH ETF capital has continued to see net inflows, indicating that spot buying hasn’t withdrawn, but it currently looks more like a steady repair rather than a one-way acceleration. In the short term, it still depends on whether BTC can hold above 80,000.
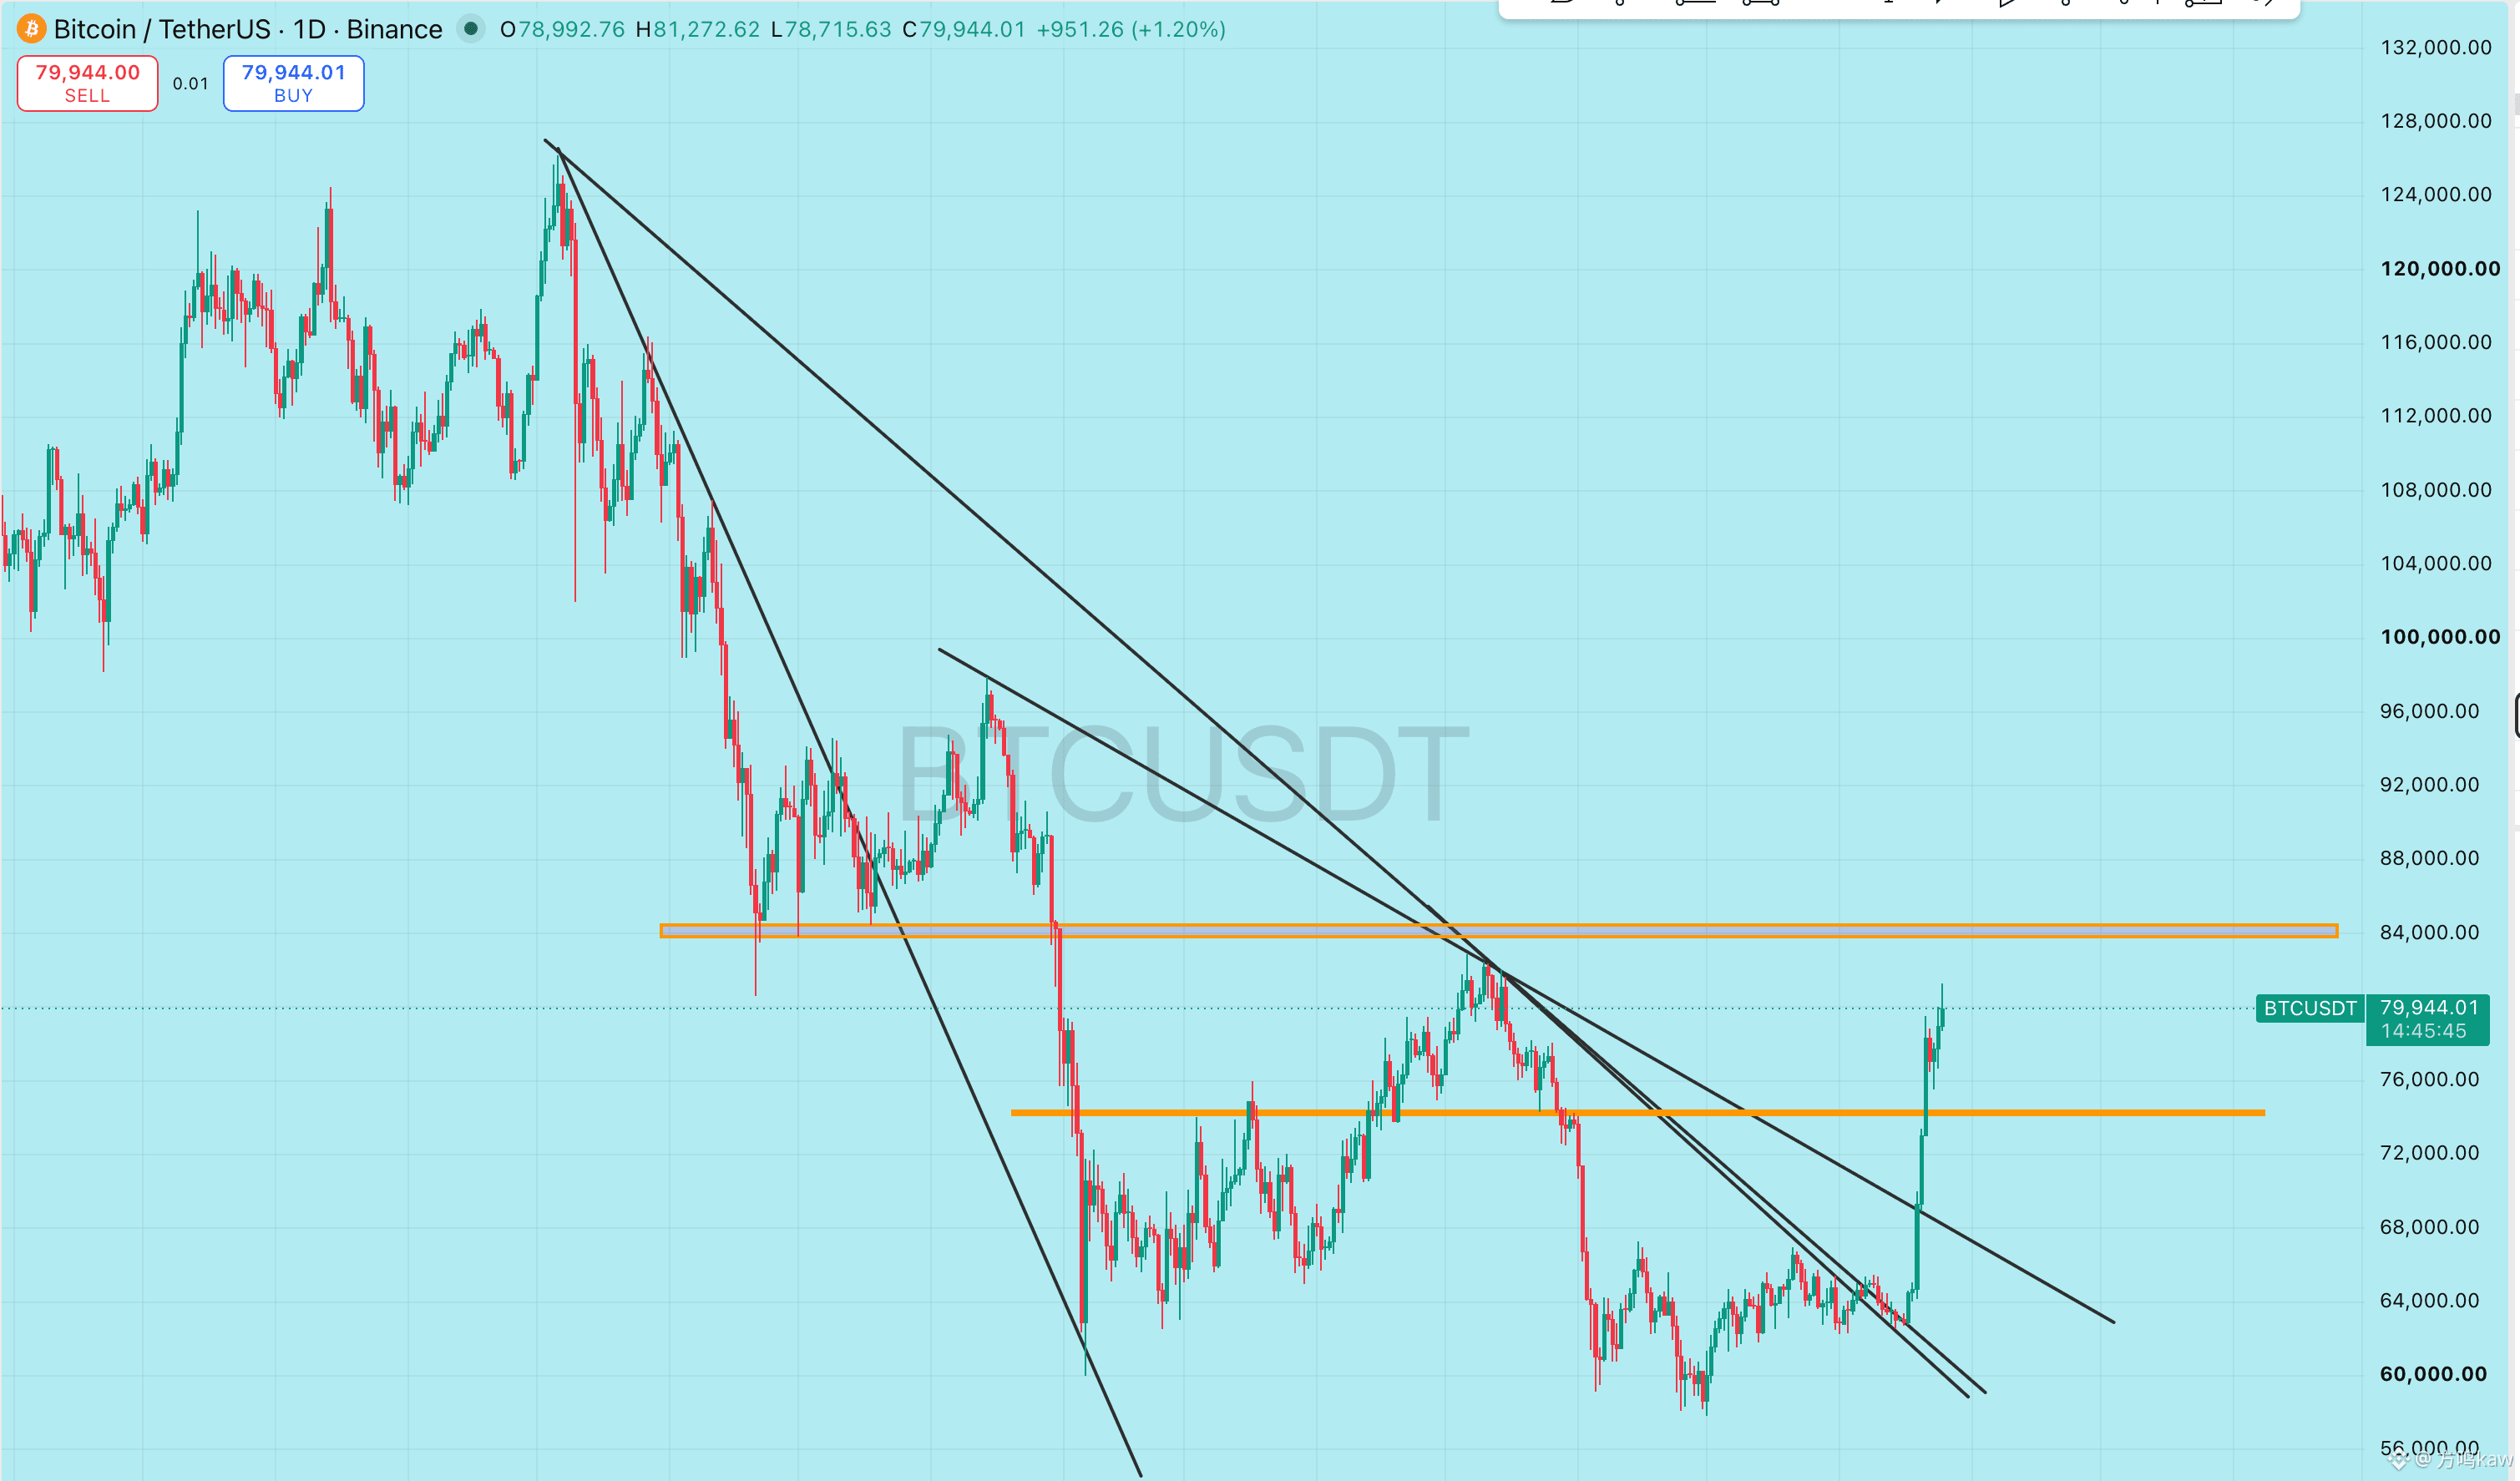
Today, this macro storyline has not provided the market with any new rationale for additional easing. The United States has continued to escalate sanctions against Iran; oil prices are temporarily steady, but geopolitical risks have not truly receded. The yield on 10-year U.S. Treasuries remains above 4.7%, and the pressure from high interest rates on risk assets is still in place. What we really need to watch this week are the PCE data, the GDP revised figures, and the Federal Reserve Chair’s comments at the Jackson Hole meeting. The market is currently betting on capital inflows rather than the macro backdrop having already turned warmer.
That said, spot capital is indeed continuing to move in. In the last U.S. stock trading day, BTC spot ETFs recorded net inflows of $337.6 million, ETH net inflows of $115.6 million, and SOL products also logged net inflows of $33.5 million. Sustained capital absorption is the most solid “underpinning” of this rebound. However, the market has already been trending higher for a while, and while the positives are not absent, it is becoming harder to justify chasing higher at elevated levels with the simple explanation of “just had good news.”
On positioning between longs and shorts: for BTC, large-holder accounts are 46.7% long versus 53.3% short—shorts still hold a slight edge. The funding rate remains positive, indicating that long-side willingness to pay has not disappeared. BTC holdings rose intraday to around 108.5k coins before falling back to near 107k. When the price pushed higher, new leverage was added; when it pulled back, some leverage was also reduced. This structure is not extremely crowded, but above 80,000, each push higher must guard against the risk of longs chasing, shorts covering at the same time, and then a rapid retracement right after that imbalance ends.
That said, spot capital is indeed continuing to move in. In the last U.S. stock trading day, BTC spot ETFs recorded net inflows of $337.6 million, ETH net inflows of $115.6 million, and SOL products also logged net inflows of $33.5 million. Sustained capital absorption is the most solid “underpinning” of this rebound. However, the market has already been trending higher for a while, and while the positives are not absent, it is becoming harder to justify chasing higher at elevated levels with the simple explanation of “just had good news.”
On positioning between longs and shorts: for BTC, large-holder accounts are 46.7% long versus 53.3% short—shorts still hold a slight edge. The funding rate remains positive, indicating that long-side willingness to pay has not disappeared. BTC holdings rose intraday to around 108.5k coins before falling back to near 107k. When the price pushed higher, new leverage was added; when it pulled back, some leverage was also reduced. This structure is not extremely crowded, but above 80,000, each push higher must guard against the risk of longs chasing, shorts covering at the same time, and then a rapid retracement right after that imbalance ends.
This guy was just watching and somehow sent himself off 😂
SOL touched the high at 93 and dipped back to a low of 86. The latest day’s net inflow into the U.S. spot SOL ETF is about $14.6 million, up significantly from the previous $2.5 million—showing that capital attention is increasing. However, on an absolute scale it still can’t compare with BTC or ETH. 90 is the near-term support to watch. As long as it holds, SOL can continue to test 93 and 95. Only if it truly holds above 95 will it have a chance to push toward the 100 psychological level. If it falls back below 90, around 88 will become the next area to watch for support and acceptance. Today, I didn’t find any project-level news strong enough to justify SOL breaking away from the broader market and trading independently. So ETF inflows are a positive factor, but not enough—by themselves—to justify an unconditional chase higher.
As for XRP, this leg of the rally is driven more by rising regulatory narrative, high-volatility capital rotation, and short-covering. Ripple management’s involvement in U.S. policy discussions may improve market expectations, but participating in meetings doesn’t automatically mean XRP has received new regulatory approval, nor does it equate to a finalized, standalone positive catalyst. 1.35 is the level that needs to be defended right now. If it breaks, then watch 1.30 and 1.25 in sequence. For the upside, only if it reclaims 1.40 and breaks above 1.43 will it have conditions to test 1.50. News can spark the move, but price determines how long the fire will burn. At the current position, it isn’t suitable to keep using policy-story narratives to forcefully explain every uptick.
As for XRP, this leg of the rally is driven more by rising regulatory narrative, high-volatility capital rotation, and short-covering. Ripple management’s involvement in U.S. policy discussions may improve market expectations, but participating in meetings doesn’t automatically mean XRP has received new regulatory approval, nor does it equate to a finalized, standalone positive catalyst. 1.35 is the level that needs to be defended right now. If it breaks, then watch 1.30 and 1.25 in sequence. For the upside, only if it reclaims 1.40 and breaks above 1.43 will it have conditions to test 1.50. News can spark the move, but price determines how long the fire will burn. At the current position, it isn’t suitable to keep using policy-story narratives to forcefully explain every uptick.
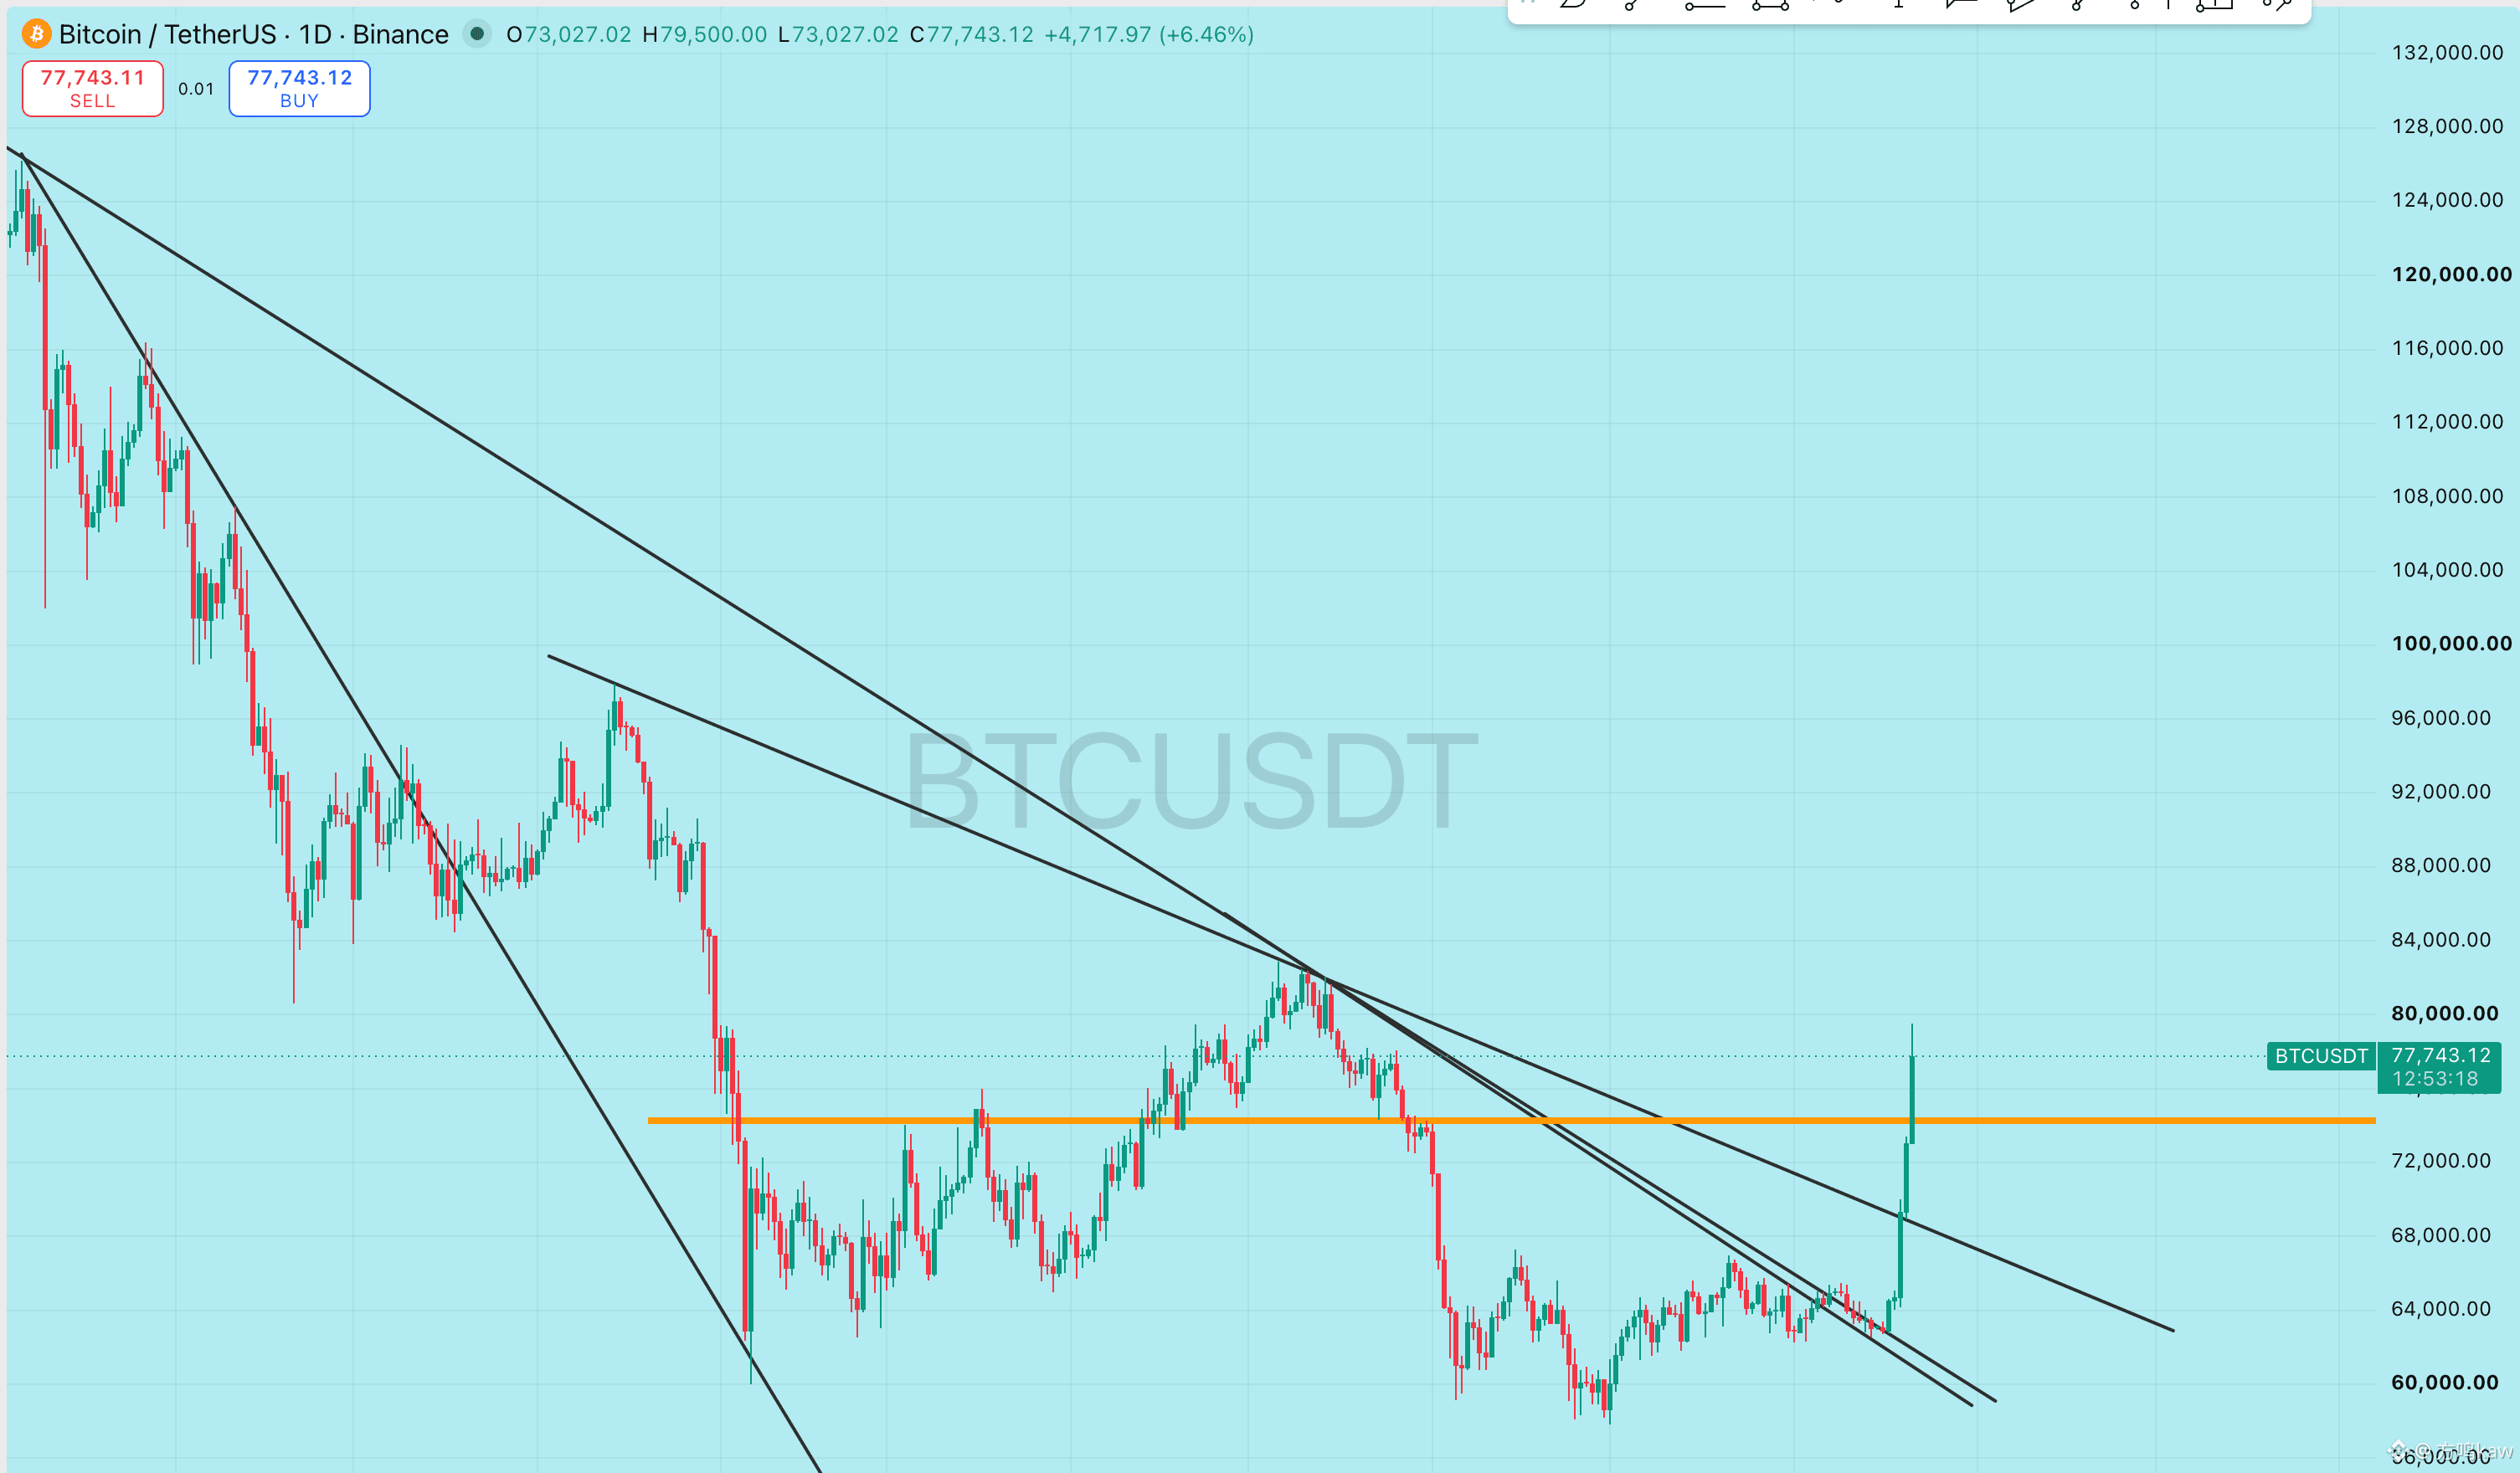
The big pie’s current price is around 77,800 so far; the intraday high has touched 79,500, and the 80,000 psychological level is right around the corner. This is both a source of psychological pressure and the most likely place for disagreements between bulls and bears after this round of rapid spike. Only if there is increased volume and the price holds above 80,000 will there be conditions to further open up space to the upside. On the downside, first look at 77,000—if it holds, it indicates the strong structure is still intact. After a new break below, observe 75,000 to 75,200; this zone is the key validation of whether this breakout can shift from a sentiment-driven move to a trend-driven move. If 75,000 is also lost, the price may easily return to the 72,000 to 73,000 range to look for buyers to take over. When the tide comes in, everyone is a hero; what truly tests the quality is how many buyers remain in the arena after the tide slightly recedes.
Ethereum has already returned to around 2,398, with an intraday high of 2,448. Two consecutive days of net ETF inflows show that ETH is not being completely passively driven by the big pie. Spot funds are indeed adding positions, but the 2,500 threshold has not yet been broken. From here, chasing higher prices is no longer an attractive risk-reward. In the short term, first watch whether 2,350 can hold; after it is lost, then observe 2,280 and 2,250 in sequence. If it breaks back above 2,448, there will be a chance to formally test 2,500. ETH now has funds and flexibility, but it still lacks a new catalyst strong enough to independently change its pricing, so we still need to see whether the big pie can stabilize at high levels.
Ethereum has already returned to around 2,398, with an intraday high of 2,448. Two consecutive days of net ETF inflows show that ETH is not being completely passively driven by the big pie. Spot funds are indeed adding positions, but the 2,500 threshold has not yet been broken. From here, chasing higher prices is no longer an attractive risk-reward. In the short term, first watch whether 2,350 can hold; after it is lost, then observe 2,280 and 2,250 in sequence. If it breaks back above 2,448, there will be a chance to formally test 2,500. ETH now has funds and flexibility, but it still lacks a new catalyst strong enough to independently change its pricing, so we still need to see whether the big pie can stabilize at high levels.
Apprentice Little Sister Loves Learning to Operate a Backhoe
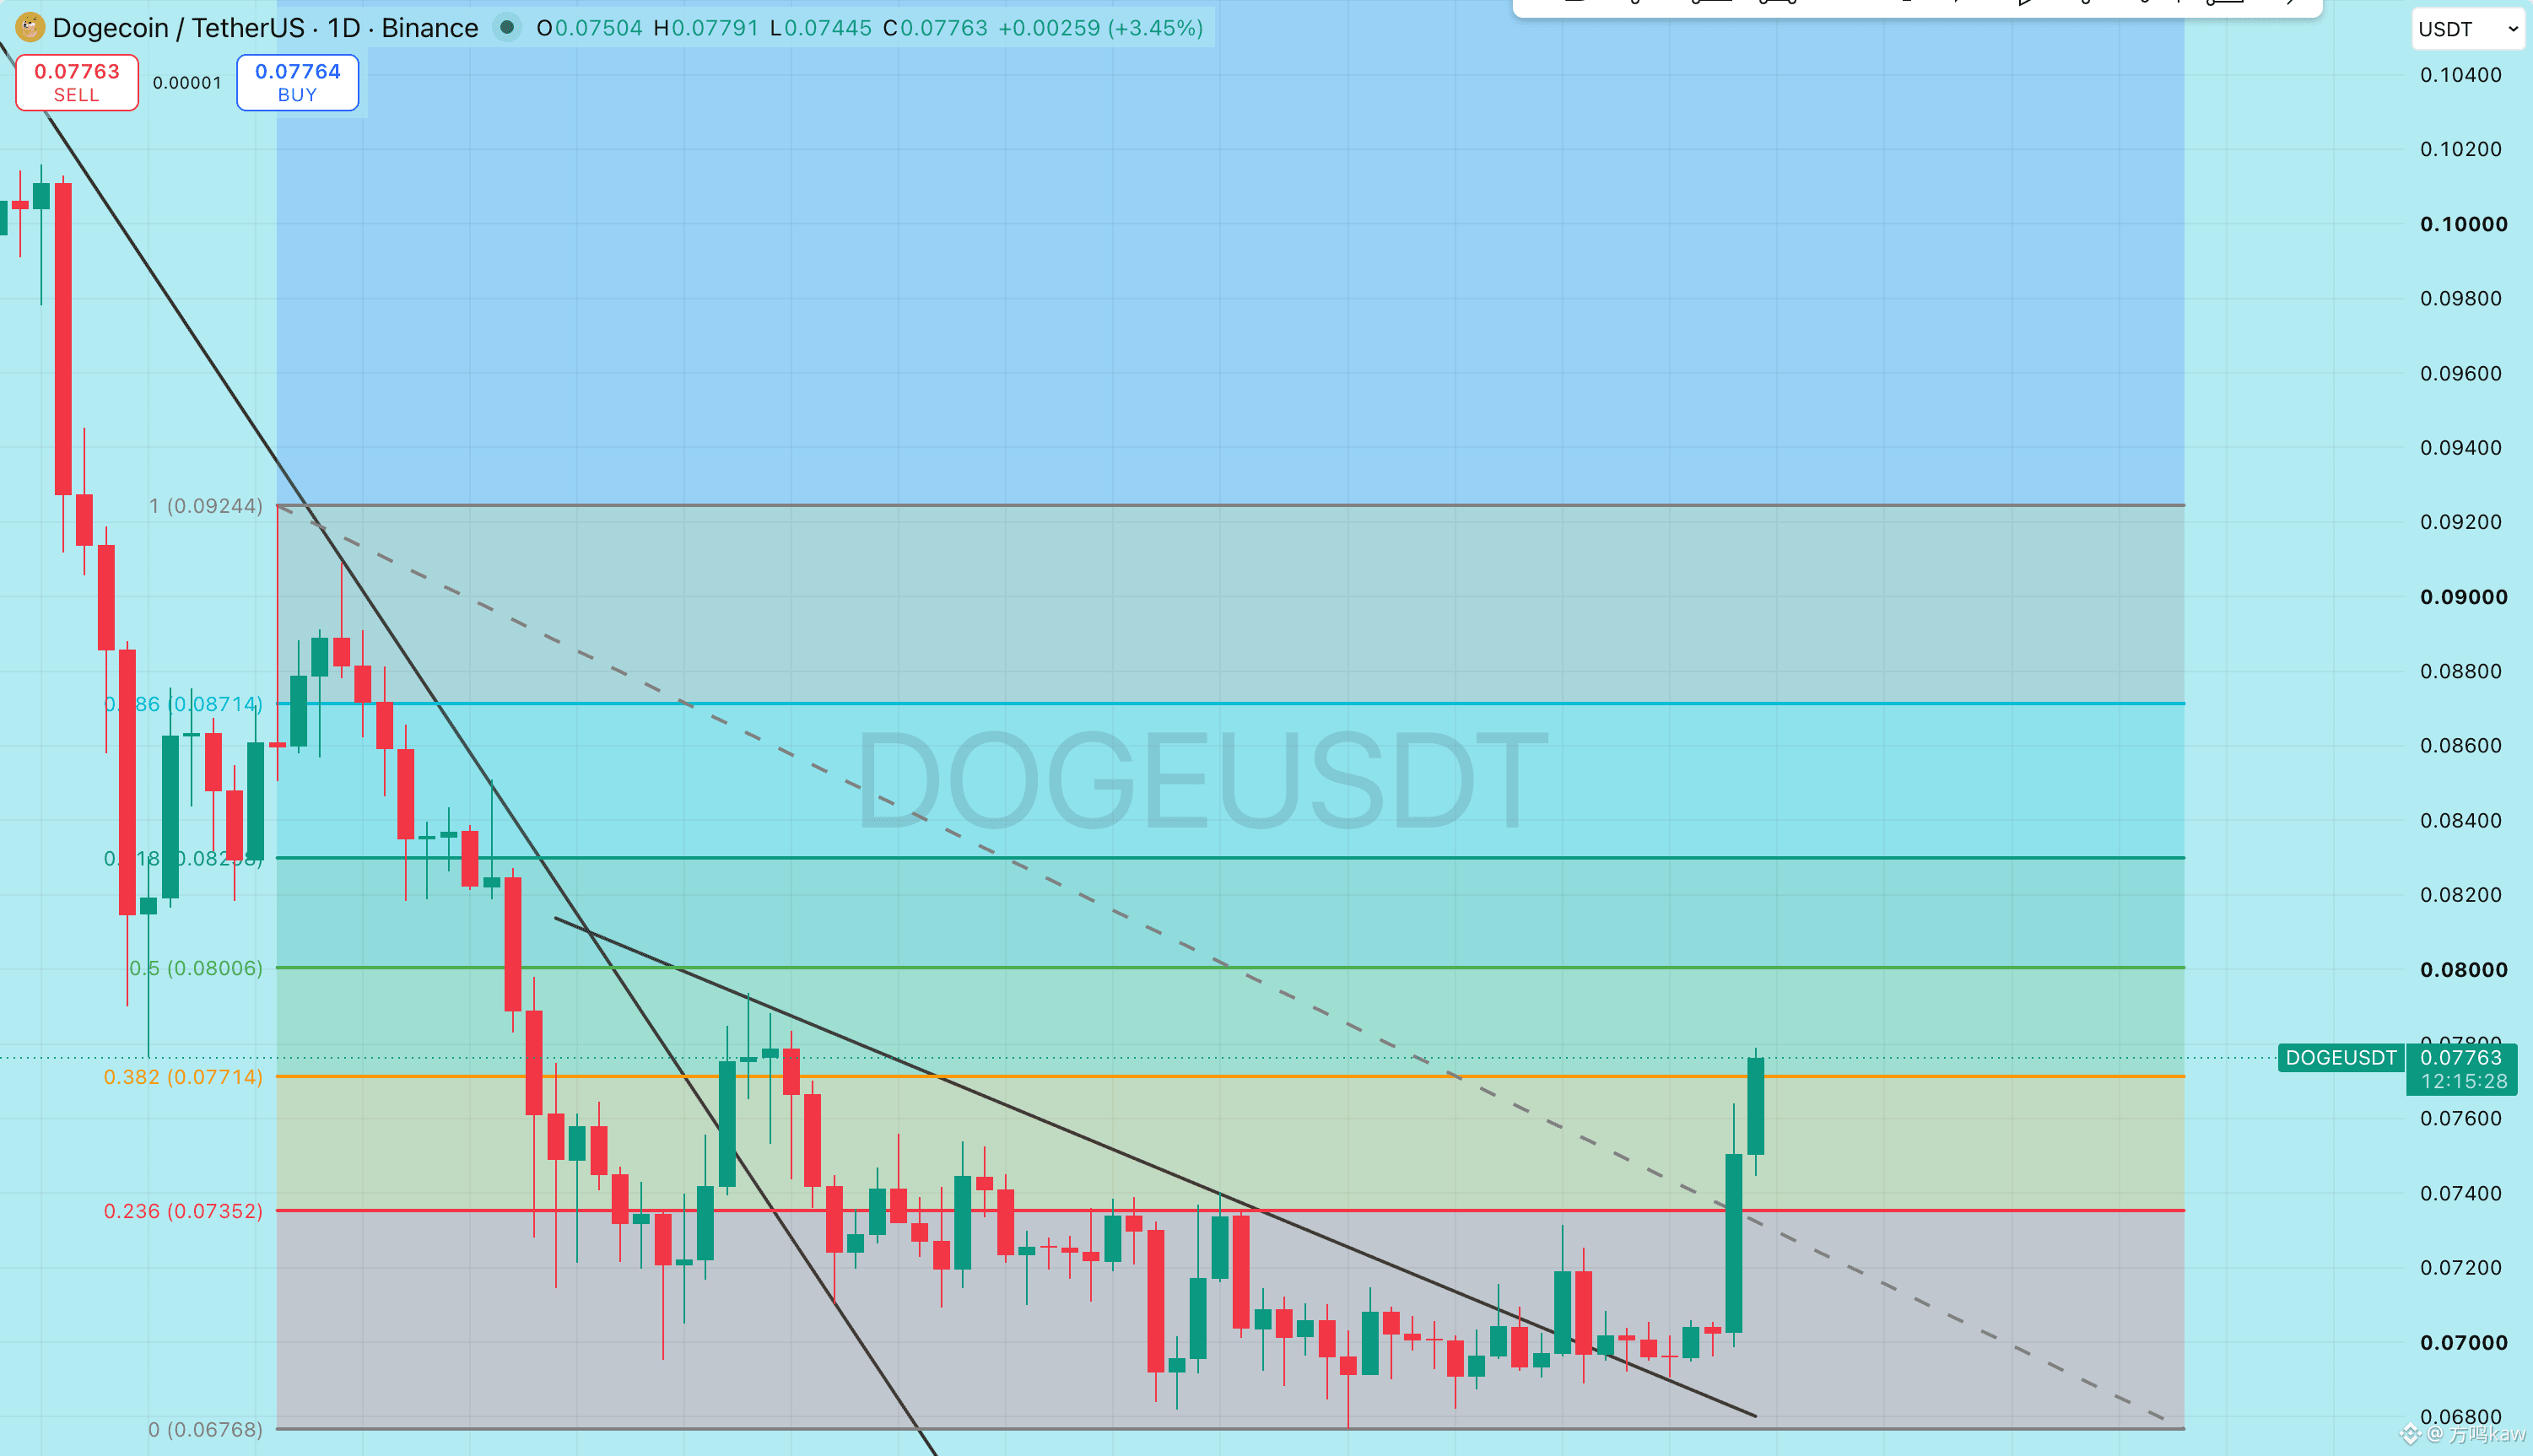
DOGE 0.0740 is the first line of defense for short-term trades. If it breaks, watch 0.0725 next. Above, first look at 0.0764; after a breakout, then watch around 0.0780.
Today there are no new payment integrations, platform applications, or any substantive Musk-related catalysts. DOGE still falls under a high-volatility, momentum-following move that comes with a rebound in risk appetite.
If the broader market holds above 70,000, it has conditions to catch up further. If BTC falls back below 68,000, DOGE will likely be the first among the majors where profit-takers exit fastest.
Today there are no new payment integrations, platform applications, or any substantive Musk-related catalysts. DOGE still falls under a high-volatility, momentum-following move that comes with a rebound in risk appetite.
If the broader market holds above 70,000, it has conditions to catch up further. If BTC falls back below 68,000, DOGE will likely be the first among the majors where profit-takers exit fastest.
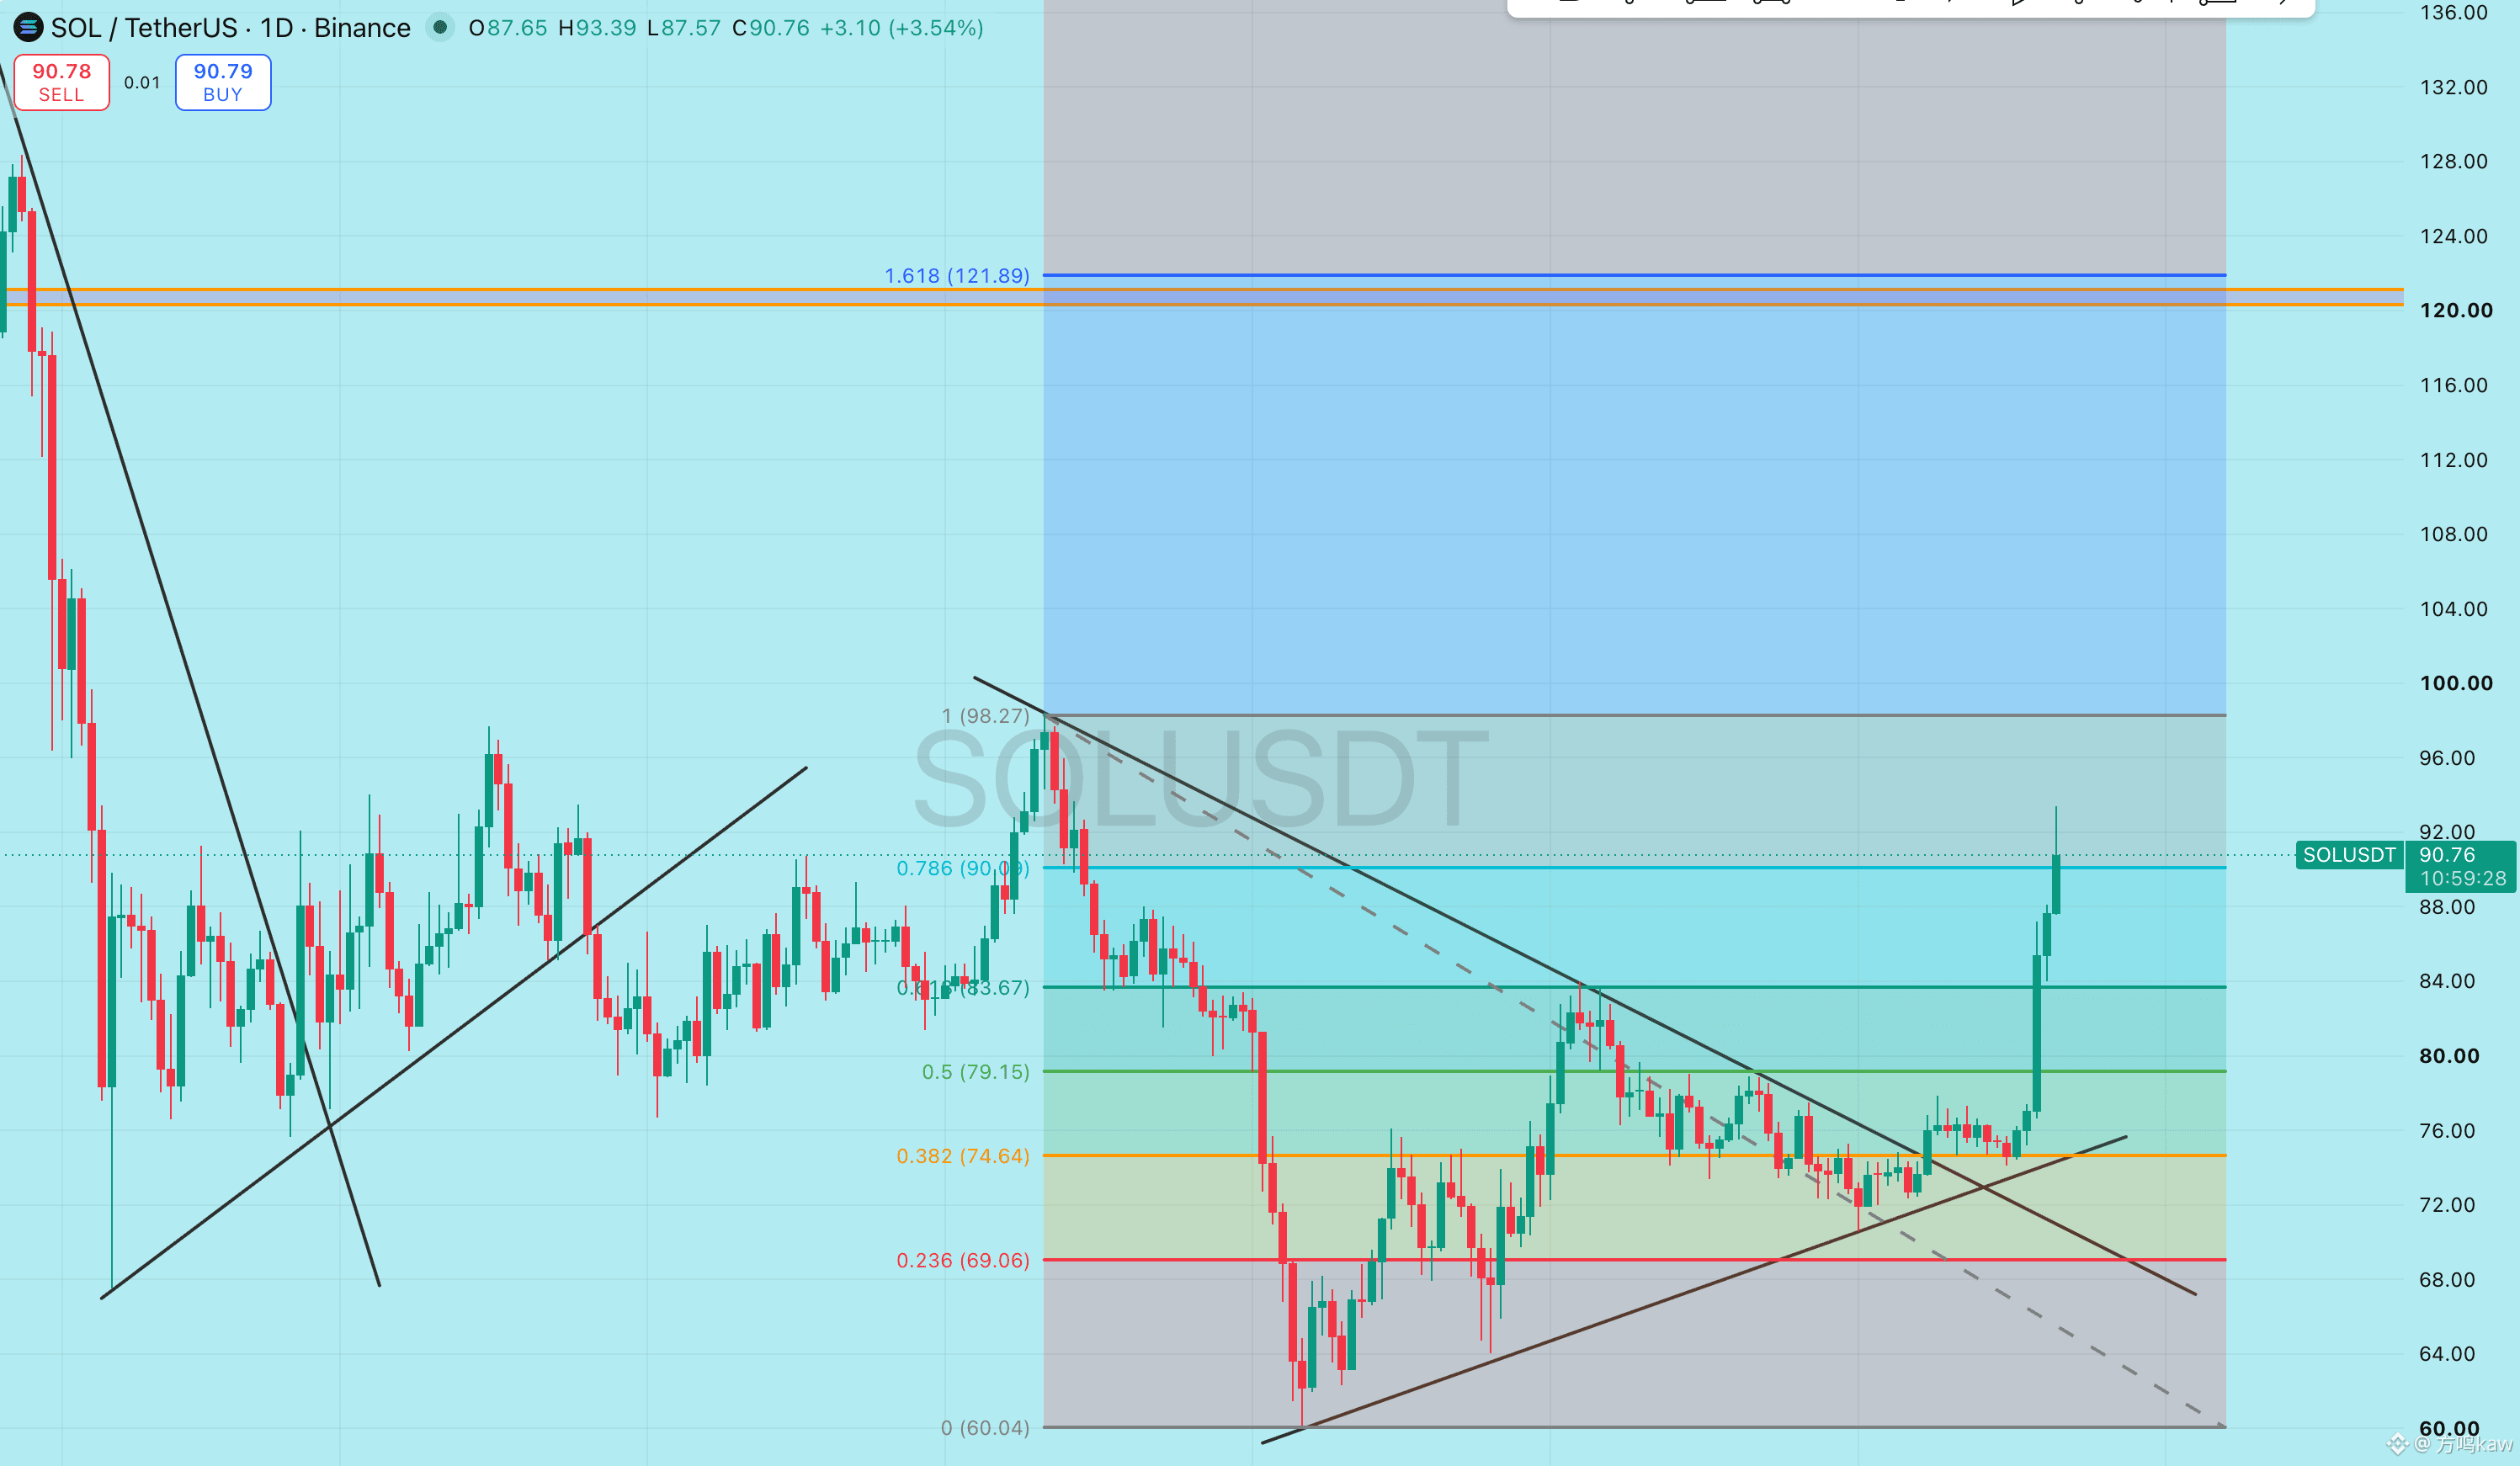
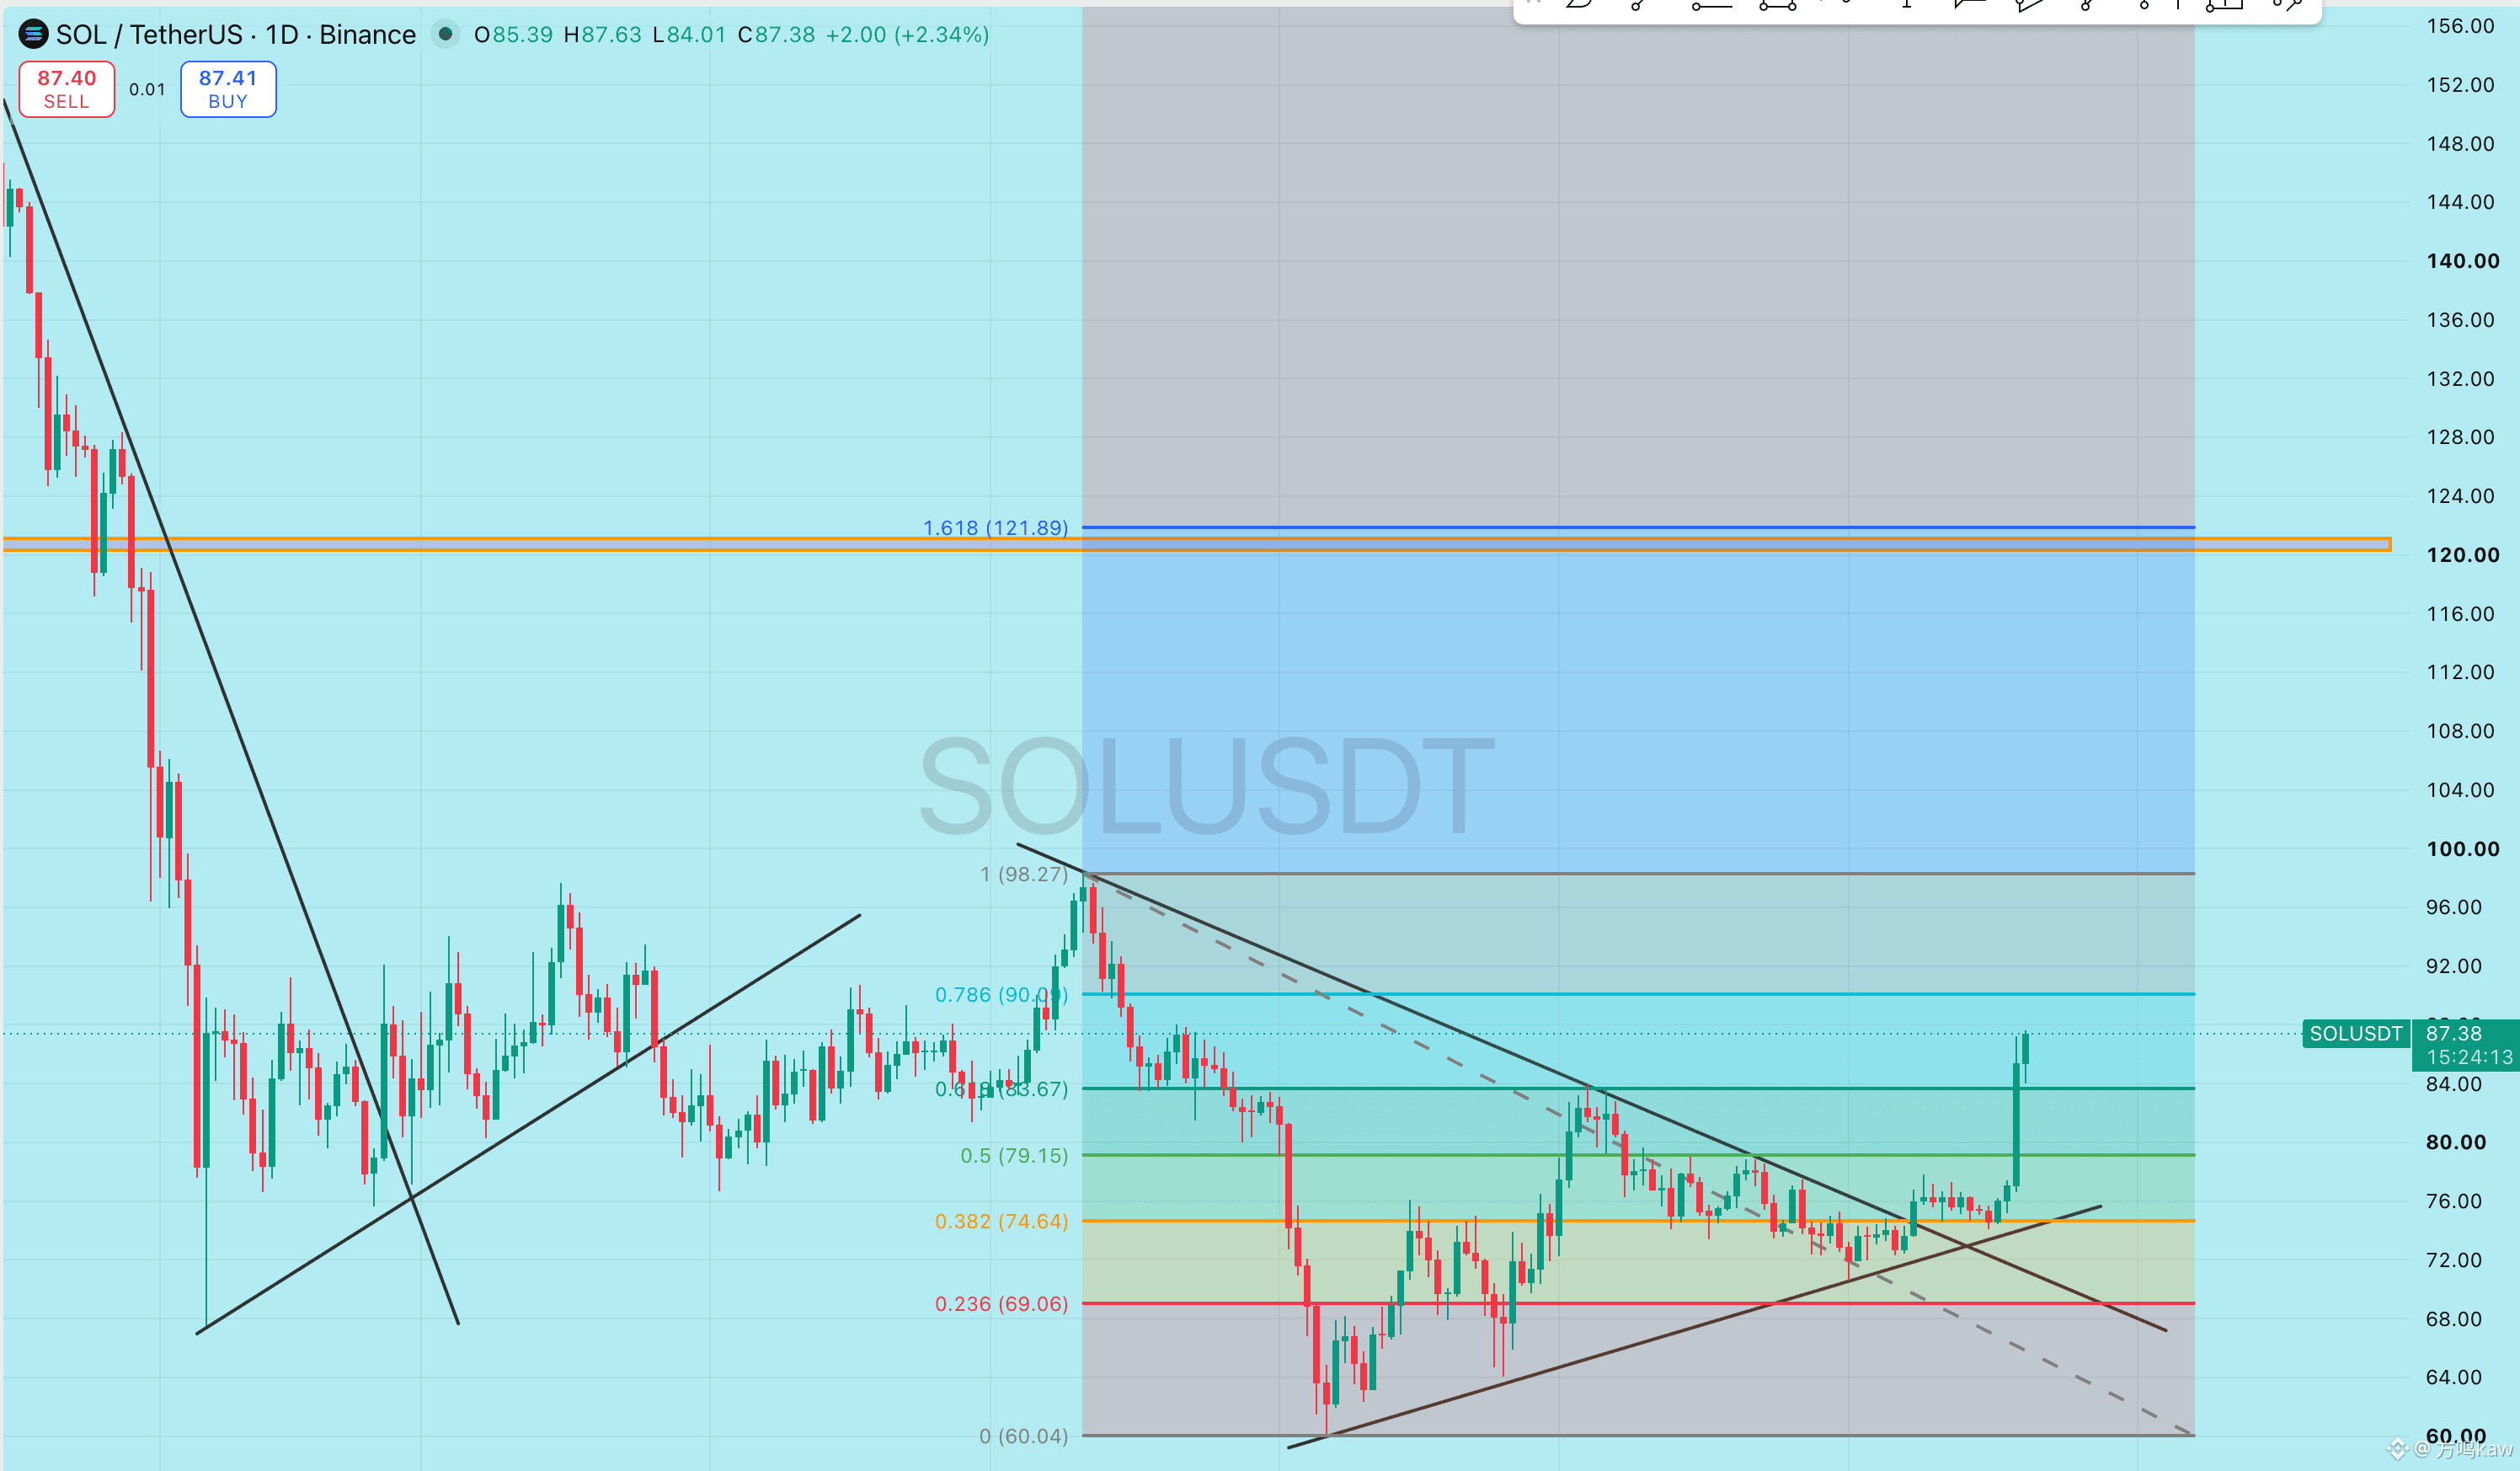
First, look at 84 below the SOL; after it breaks down, then watch 82. For an upside move, SOL needs to break through 87 again. Only after it holds steady can we discuss 90. The latest net inflow for the SOL spot ETF is about $2.5 million, which is a marginal positive, but the scale isn’t enough to drive this round of rally on its own.
Today, I didn’t find any new strong SOL project-level catalyst. The price strength is mainly driven by improving expectations around U.S. regulation and the return of altcoin capital. The healthiest short-term pattern isn’t to push higher again, but to complete a turnover process around 84 to 85; otherwise, after rushing toward 90, profit-taking could become more intense.
For XRP, 1.09 is the recent support/acceptance zone. After a breakdown, watch 1.075 and then 1.05 in sequence. On the upside, XRP needs to first reclaim 1.12, and then break above 1.136 before there’s a basis to retest 1.15. Although Ripple’s CEO is a member of the CFTC Innovation Advisory Committee, that identity has long been public and can’t be used to explain today’s sudden surge. The real logic behind XRP’s benefit is still that the U.S. crypto regulatory framework is gradually becoming clearer—but since the rules are only proposals and the CLARITY Act has not yet been formally passed, selling pressure near 1.136 shouldn’t be ignored.
Today, I didn’t find any new strong SOL project-level catalyst. The price strength is mainly driven by improving expectations around U.S. regulation and the return of altcoin capital. The healthiest short-term pattern isn’t to push higher again, but to complete a turnover process around 84 to 85; otherwise, after rushing toward 90, profit-taking could become more intense.
For XRP, 1.09 is the recent support/acceptance zone. After a breakdown, watch 1.075 and then 1.05 in sequence. On the upside, XRP needs to first reclaim 1.12, and then break above 1.136 before there’s a basis to retest 1.15. Although Ripple’s CEO is a member of the CFTC Innovation Advisory Committee, that identity has long been public and can’t be used to explain today’s sudden surge. The real logic behind XRP’s benefit is still that the U.S. crypto regulatory framework is gradually becoming clearer—but since the rules are only proposals and the CLARITY Act has not yet been formally passed, selling pressure near 1.136 shouldn’t be ignored.
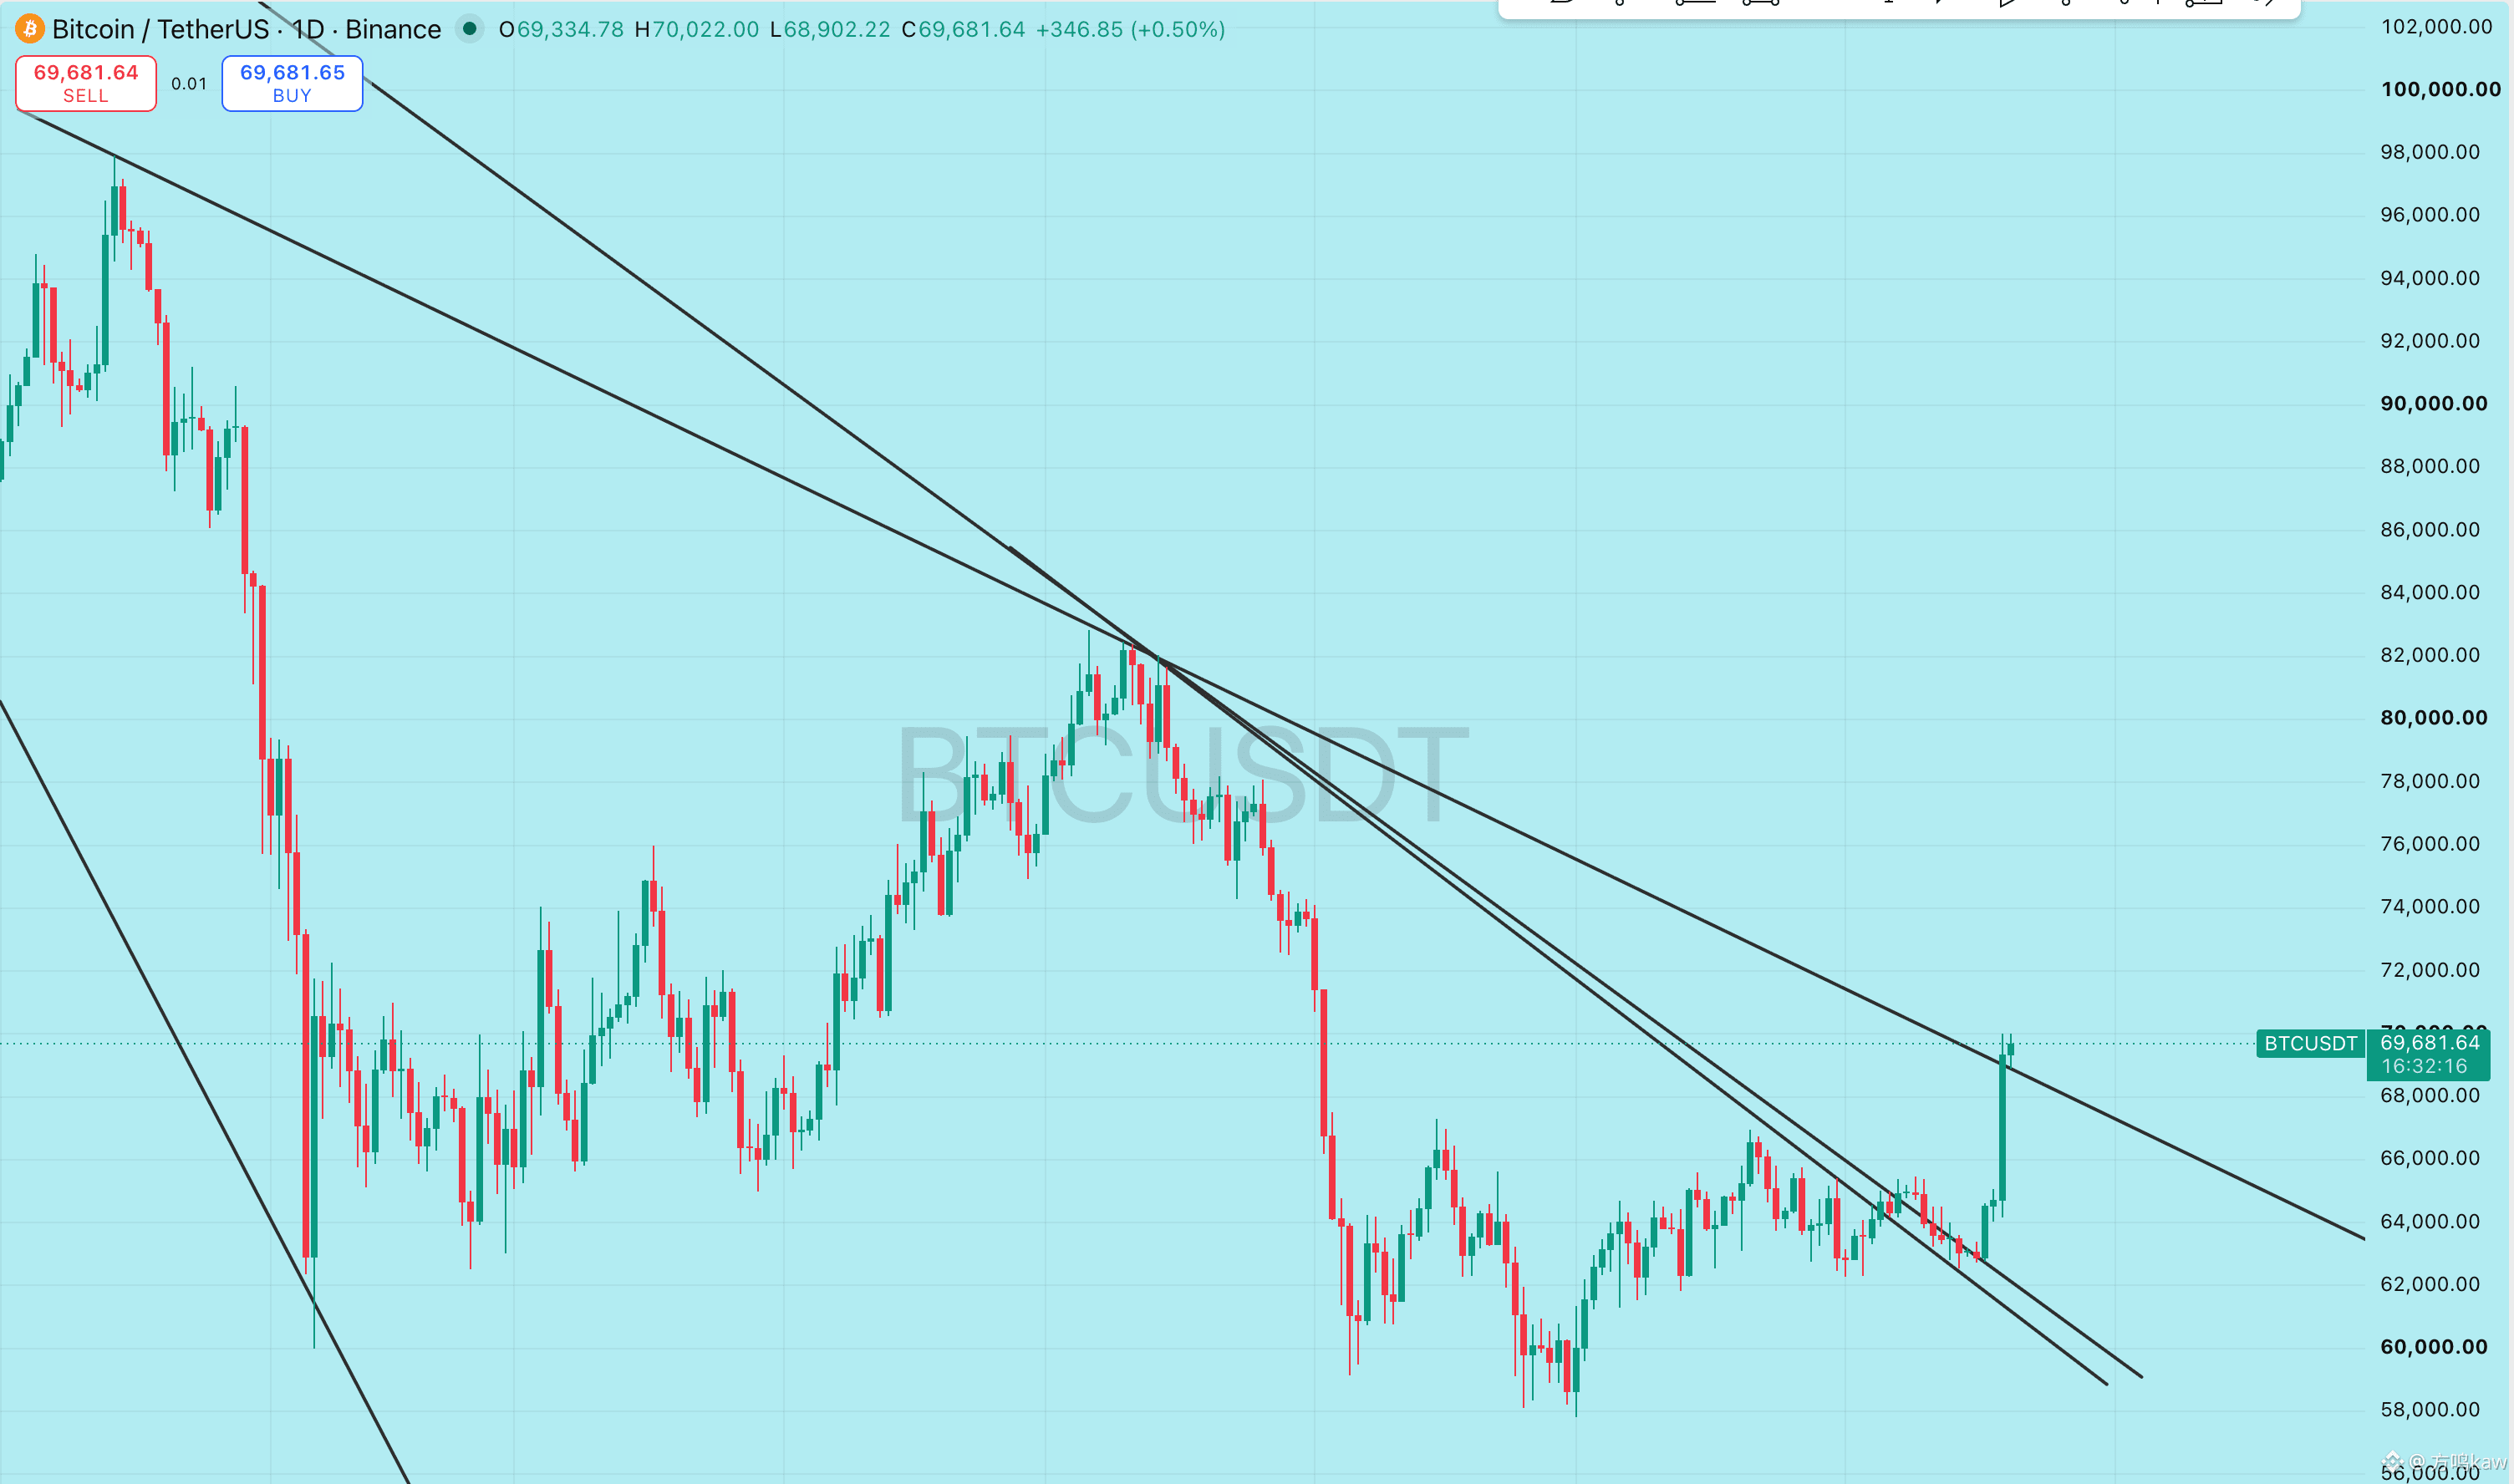
The big pancake has risen steadily from around 64,255 to around 70,000, and is currently pulling back to consolidate around 69,600. 70,000 is the most important resistance level today—this is both a key integer mark and the first genuinely testable spot for spot demand after a continuous run-up. U.S. Bitcoin spot ETFs continued to see net inflows of $164.2 million on August 19, marking three consecutive trading days of capital returning. This indicates that this rally is not completely dependent on futures leverage. On the downside, first look at 69,000. As long as it holds, there is still a foundation for another attempt to break through 70,000 and then 70,600. If a pullback breaks below 69,000, pay attention to the 68,400 to 68,000 price area. Only when the premium from this policy- and liquidity-driven rally shows clear signs of easing can we say it has meaningfully loosened.
As for Ethereum, it surged quickly from around 1,910 up to 2,334, then fell back to around 2,250. The pullback-and-repair strength has been noticeably stronger than that of the big pancake. 2,200 is the recent demand/consolidation area. If 2,200 holds, you can continue to watch 2,280 and 2,334; only with a true breakout above 2,334 may there be further room opening up toward 2,400. If 2,200 breaks, then on the downside you should sequentially watch 2,150 and 2,100. Ethereum spot ETFs latest recorded net inflows of $17.7 million; funds are still flowing back, but the amount is clearly lower than the previous day. Today also hasn’t seen any Ethereum protocol-level new catalyst significant enough to independently explain this surge. Therefore, this strength mainly comes from policy tailwinds, improved liquidity, and position repair after an earlier oversold condition. Don’t treat one sharp rally candle as a fully reversed trend.
As for Ethereum, it surged quickly from around 1,910 up to 2,334, then fell back to around 2,250. The pullback-and-repair strength has been noticeably stronger than that of the big pancake. 2,200 is the recent demand/consolidation area. If 2,200 holds, you can continue to watch 2,280 and 2,334; only with a true breakout above 2,334 may there be further room opening up toward 2,400. If 2,200 breaks, then on the downside you should sequentially watch 2,150 and 2,100. Ethereum spot ETFs latest recorded net inflows of $17.7 million; funds are still flowing back, but the amount is clearly lower than the previous day. Today also hasn’t seen any Ethereum protocol-level new catalyst significant enough to independently explain this surge. Therefore, this strength mainly comes from policy tailwinds, improved liquidity, and position repair after an earlier oversold condition. Don’t treat one sharp rally candle as a fully reversed trend.
The biggest change in the market today isn’t the Fed turning more dovish—it’s that fiscal liquidity and crypto policy are both turning favorable. The U.S. Treasury announced an expansion of long-term Treasury market liquidity support via repurchase agreements, with the size of each repurchase set to at least double. This isn’t the same as the Fed launching quantitative easing, but it does meaningfully increase the demand for longer-dated Treasuries. The latest yield curve shows the 10-year U.S. Treasury yield falling from 4.71% to 4.65%, and the 30-year rate dropping from 5.28% to 5.19%. Financial conditions have been eased in the short term, and risk assets that have been suppressed for a long time are immediately seeing a concentrated rebound.
On the crypto policy front, the SEC has already proposed draft exemptions tailored to financing for crypto projects and “safe harbor” rules. However, it is still at the proposal stage and not yet an effective final regulation. Later, Trump again urged Congress during a crypto meeting at the White House to advance the CLARITY Act. The CFTC will also hold an innovation advisory committee meeting today to continue discussing crypto assets, artificial intelligence, and prediction markets. Put together, these developments are what truly change market expectations for the U.S. crypto industry: the regulatory direction is shifting from “enforce first, explain later” toward “set rules first, then allow innovation.” This provides a direct boost to risk appetite across the entire altcoin market. But a policy meeting is not the same as a bill becoming law—today’s rally already reflects a substantial portion of these expectations.
The FOMC minutes released last night are, in fact, clearly hawkish. Multiple officials believe that if inflation cannot keep falling, further tightening may be necessary; even several officials supported a 25-basis-point rate hike at the July meeting. The minutes also noted that uncertainty around inflation is increasing due to the Middle East conflict, energy prices, and supply-chain risks. The UAE has also suspended trade with Iran again due to threats of a new round of missile attacks, and the actual level of transit through the Strait of Hormuz remains far below pre-conflict levels. In other words, today’s rise isn’t because macro risks disappeared—it’s because the Treasury has eased pressure on the bond market and the U.S. has signaled favorable crypto policy, temporarily outweighing the hawkish minutes and geopolitical risks.
On the crypto policy front, the SEC has already proposed draft exemptions tailored to financing for crypto projects and “safe harbor” rules. However, it is still at the proposal stage and not yet an effective final regulation. Later, Trump again urged Congress during a crypto meeting at the White House to advance the CLARITY Act. The CFTC will also hold an innovation advisory committee meeting today to continue discussing crypto assets, artificial intelligence, and prediction markets. Put together, these developments are what truly change market expectations for the U.S. crypto industry: the regulatory direction is shifting from “enforce first, explain later” toward “set rules first, then allow innovation.” This provides a direct boost to risk appetite across the entire altcoin market. But a policy meeting is not the same as a bill becoming law—today’s rally already reflects a substantial portion of these expectations.
The FOMC minutes released last night are, in fact, clearly hawkish. Multiple officials believe that if inflation cannot keep falling, further tightening may be necessary; even several officials supported a 25-basis-point rate hike at the July meeting. The minutes also noted that uncertainty around inflation is increasing due to the Middle East conflict, energy prices, and supply-chain risks. The UAE has also suspended trade with Iran again due to threats of a new round of missile attacks, and the actual level of transit through the Strait of Hormuz remains far below pre-conflict levels. In other words, today’s rise isn’t because macro risks disappeared—it’s because the Treasury has eased pressure on the bond market and the U.S. has signaled favorable crypto policy, temporarily outweighing the hawkish minutes and geopolitical risks.
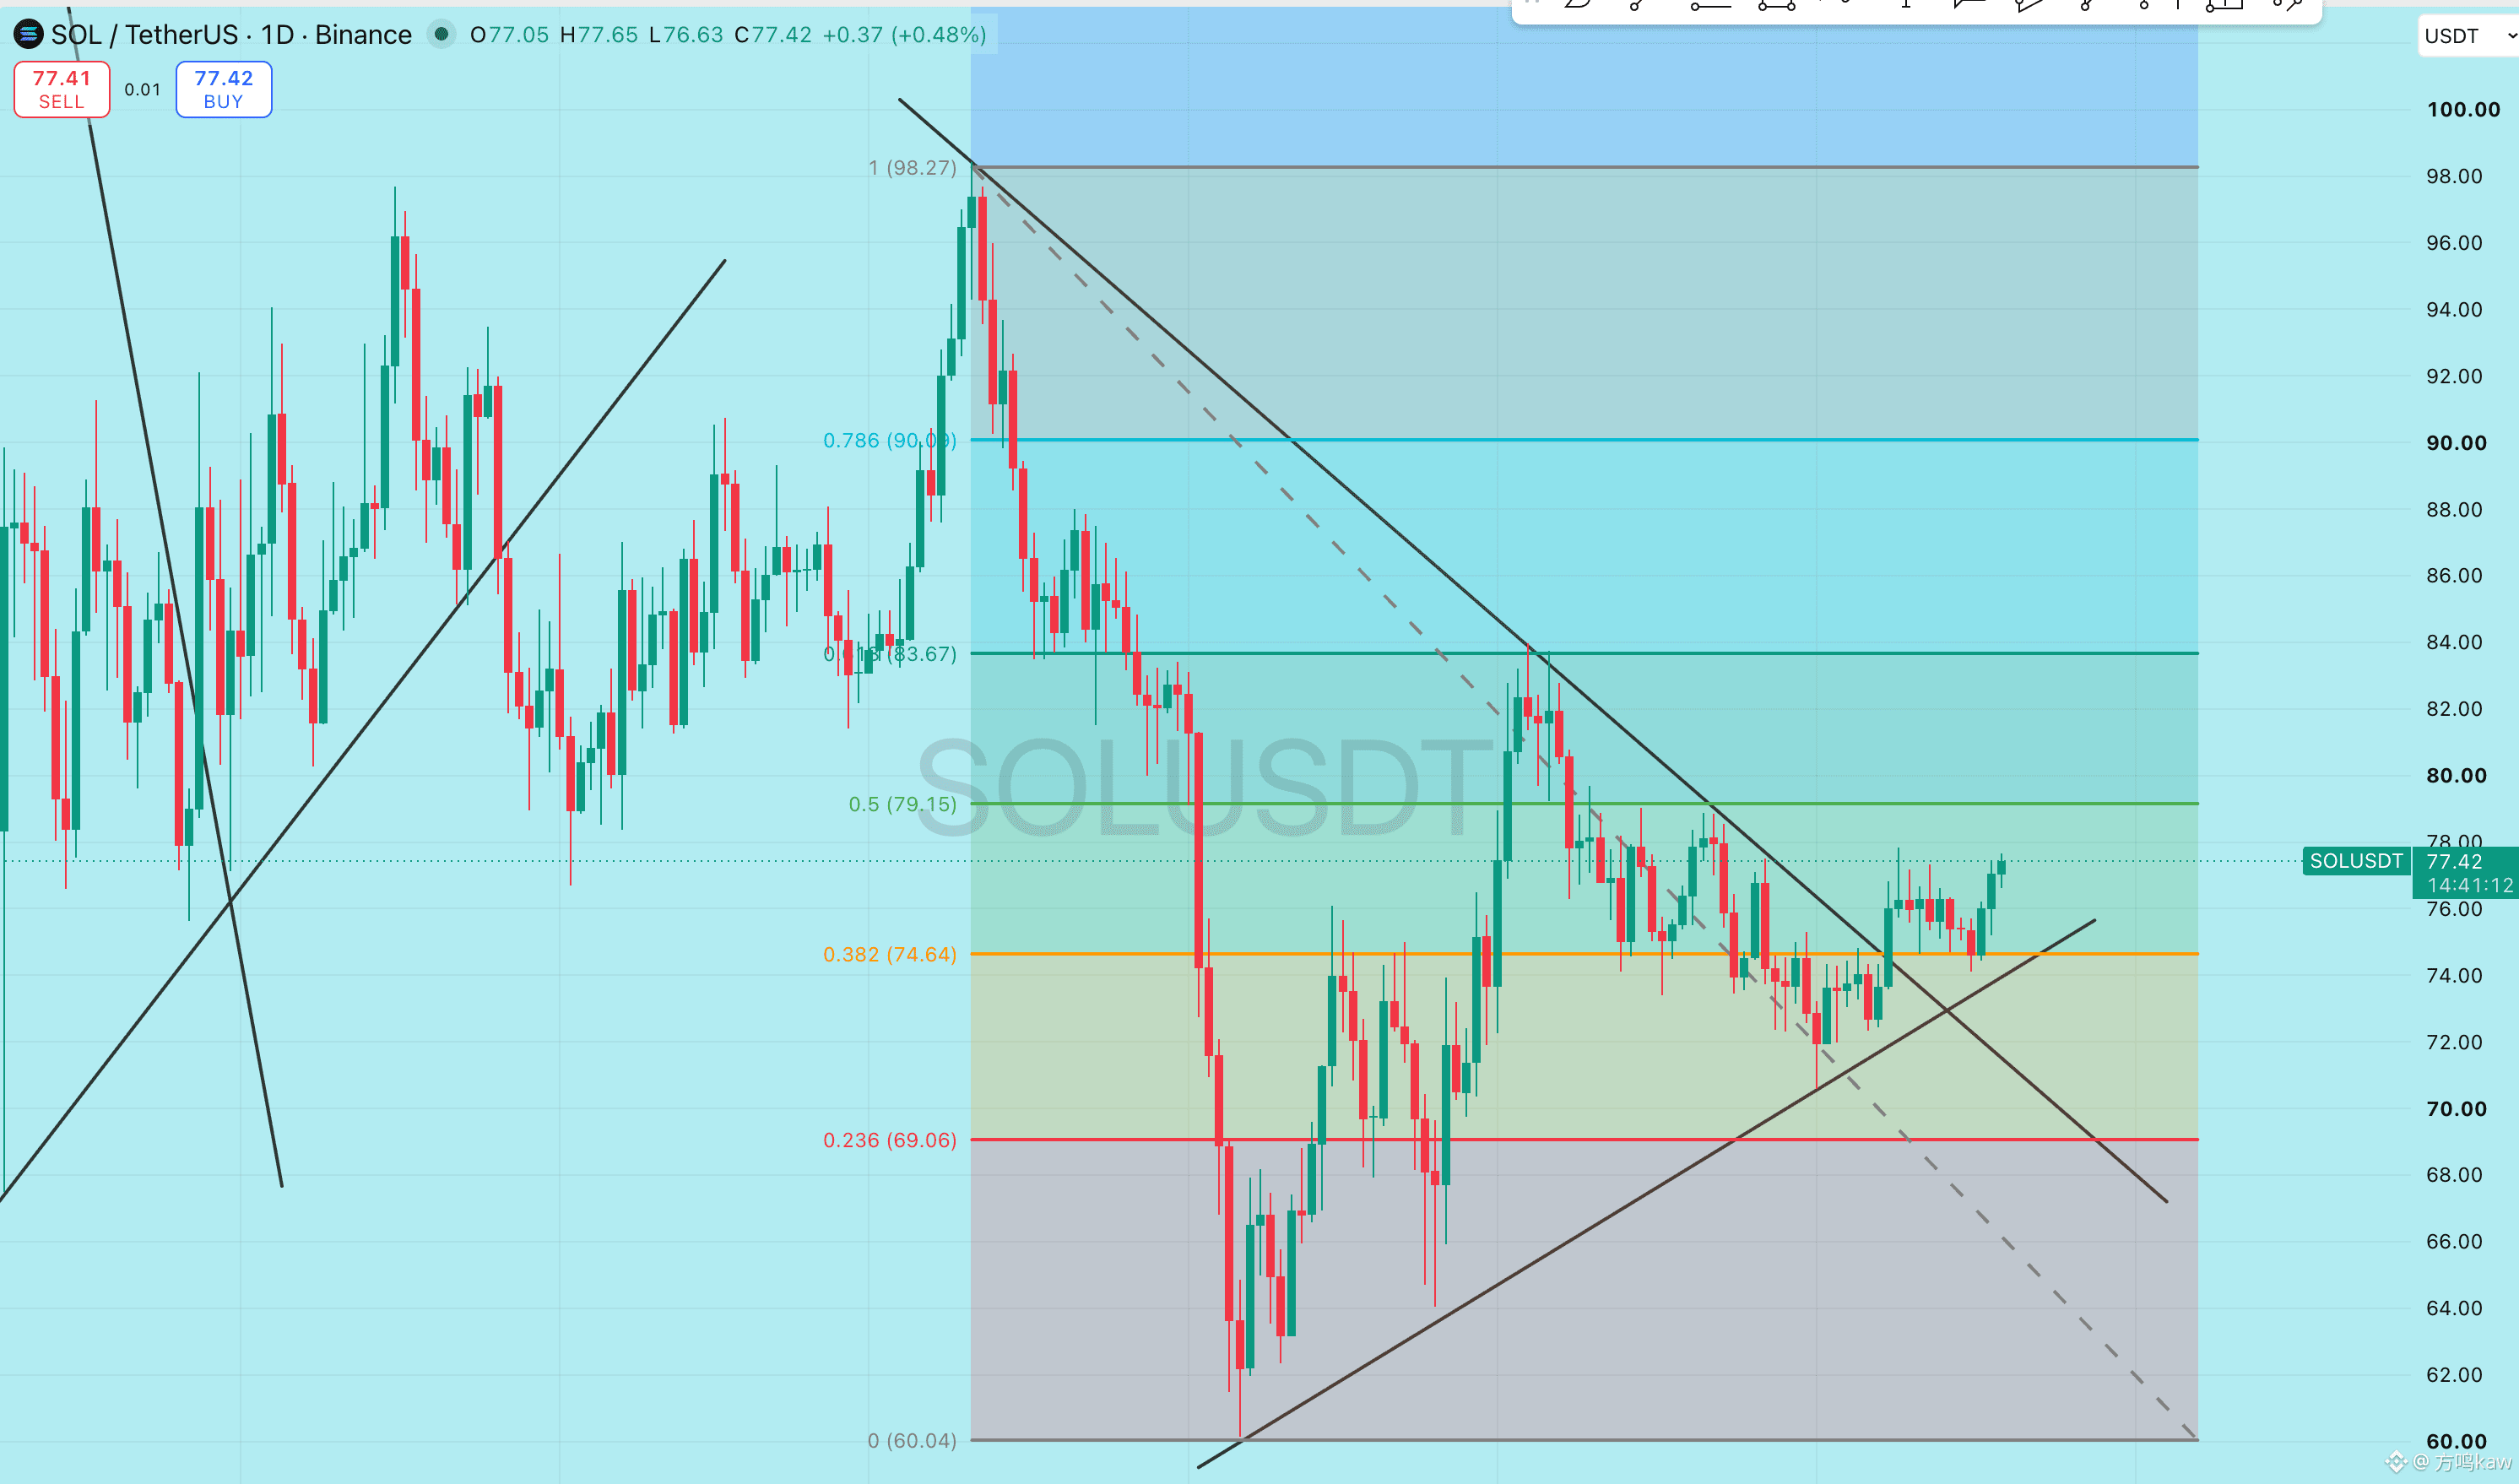
SOL is consolidating around the 77 level. First, look down to 76; the next support is around 75. To the upside, it needs to break above 78, and only then will conditions be favorable to retest 80 again. The latest net inflow for the SOL spot ETF is about $1.6 million; the amount is not large, so it can only be considered a marginal positive. At the same time, there are reports that the mainnet has entered the 350-millisecond slot phase. Official SIMD documents can confirm that 350 milliseconds is the first stage in shortening the block time route, but I have not yet found an equally authoritative mainnet activation announcement. Therefore, this news can be monitored, but it should not be used directly as a reason to chase the price.
XRP is hovering around 1.004. The 1.00 psychological level is the position that must be held today. If the intraday low at 0.9947 is lost again, the market is likely to revisit 0.98. To the upside, first watch 1.007; after a break, then observe 1.02. Today I did not find any independent strong catalyst that would be enough to change XRP’s short-term pricing. Some aggregated news mentions ETF inflows, but it lacks cross-confirmation with official data at the same level of authority. So for now, I’m still treating this as follow-the-market rather than inventing reasons to match price fluctuations.
XRP is hovering around 1.004. The 1.00 psychological level is the position that must be held today. If the intraday low at 0.9947 is lost again, the market is likely to revisit 0.98. To the upside, first watch 1.007; after a break, then observe 1.02. Today I did not find any independent strong catalyst that would be enough to change XRP’s short-term pricing. Some aggregated news mentions ETF inflows, but it lacks cross-confirmation with official data at the same level of authority. So for now, I’m still treating this as follow-the-market rather than inventing reasons to match price fluctuations.
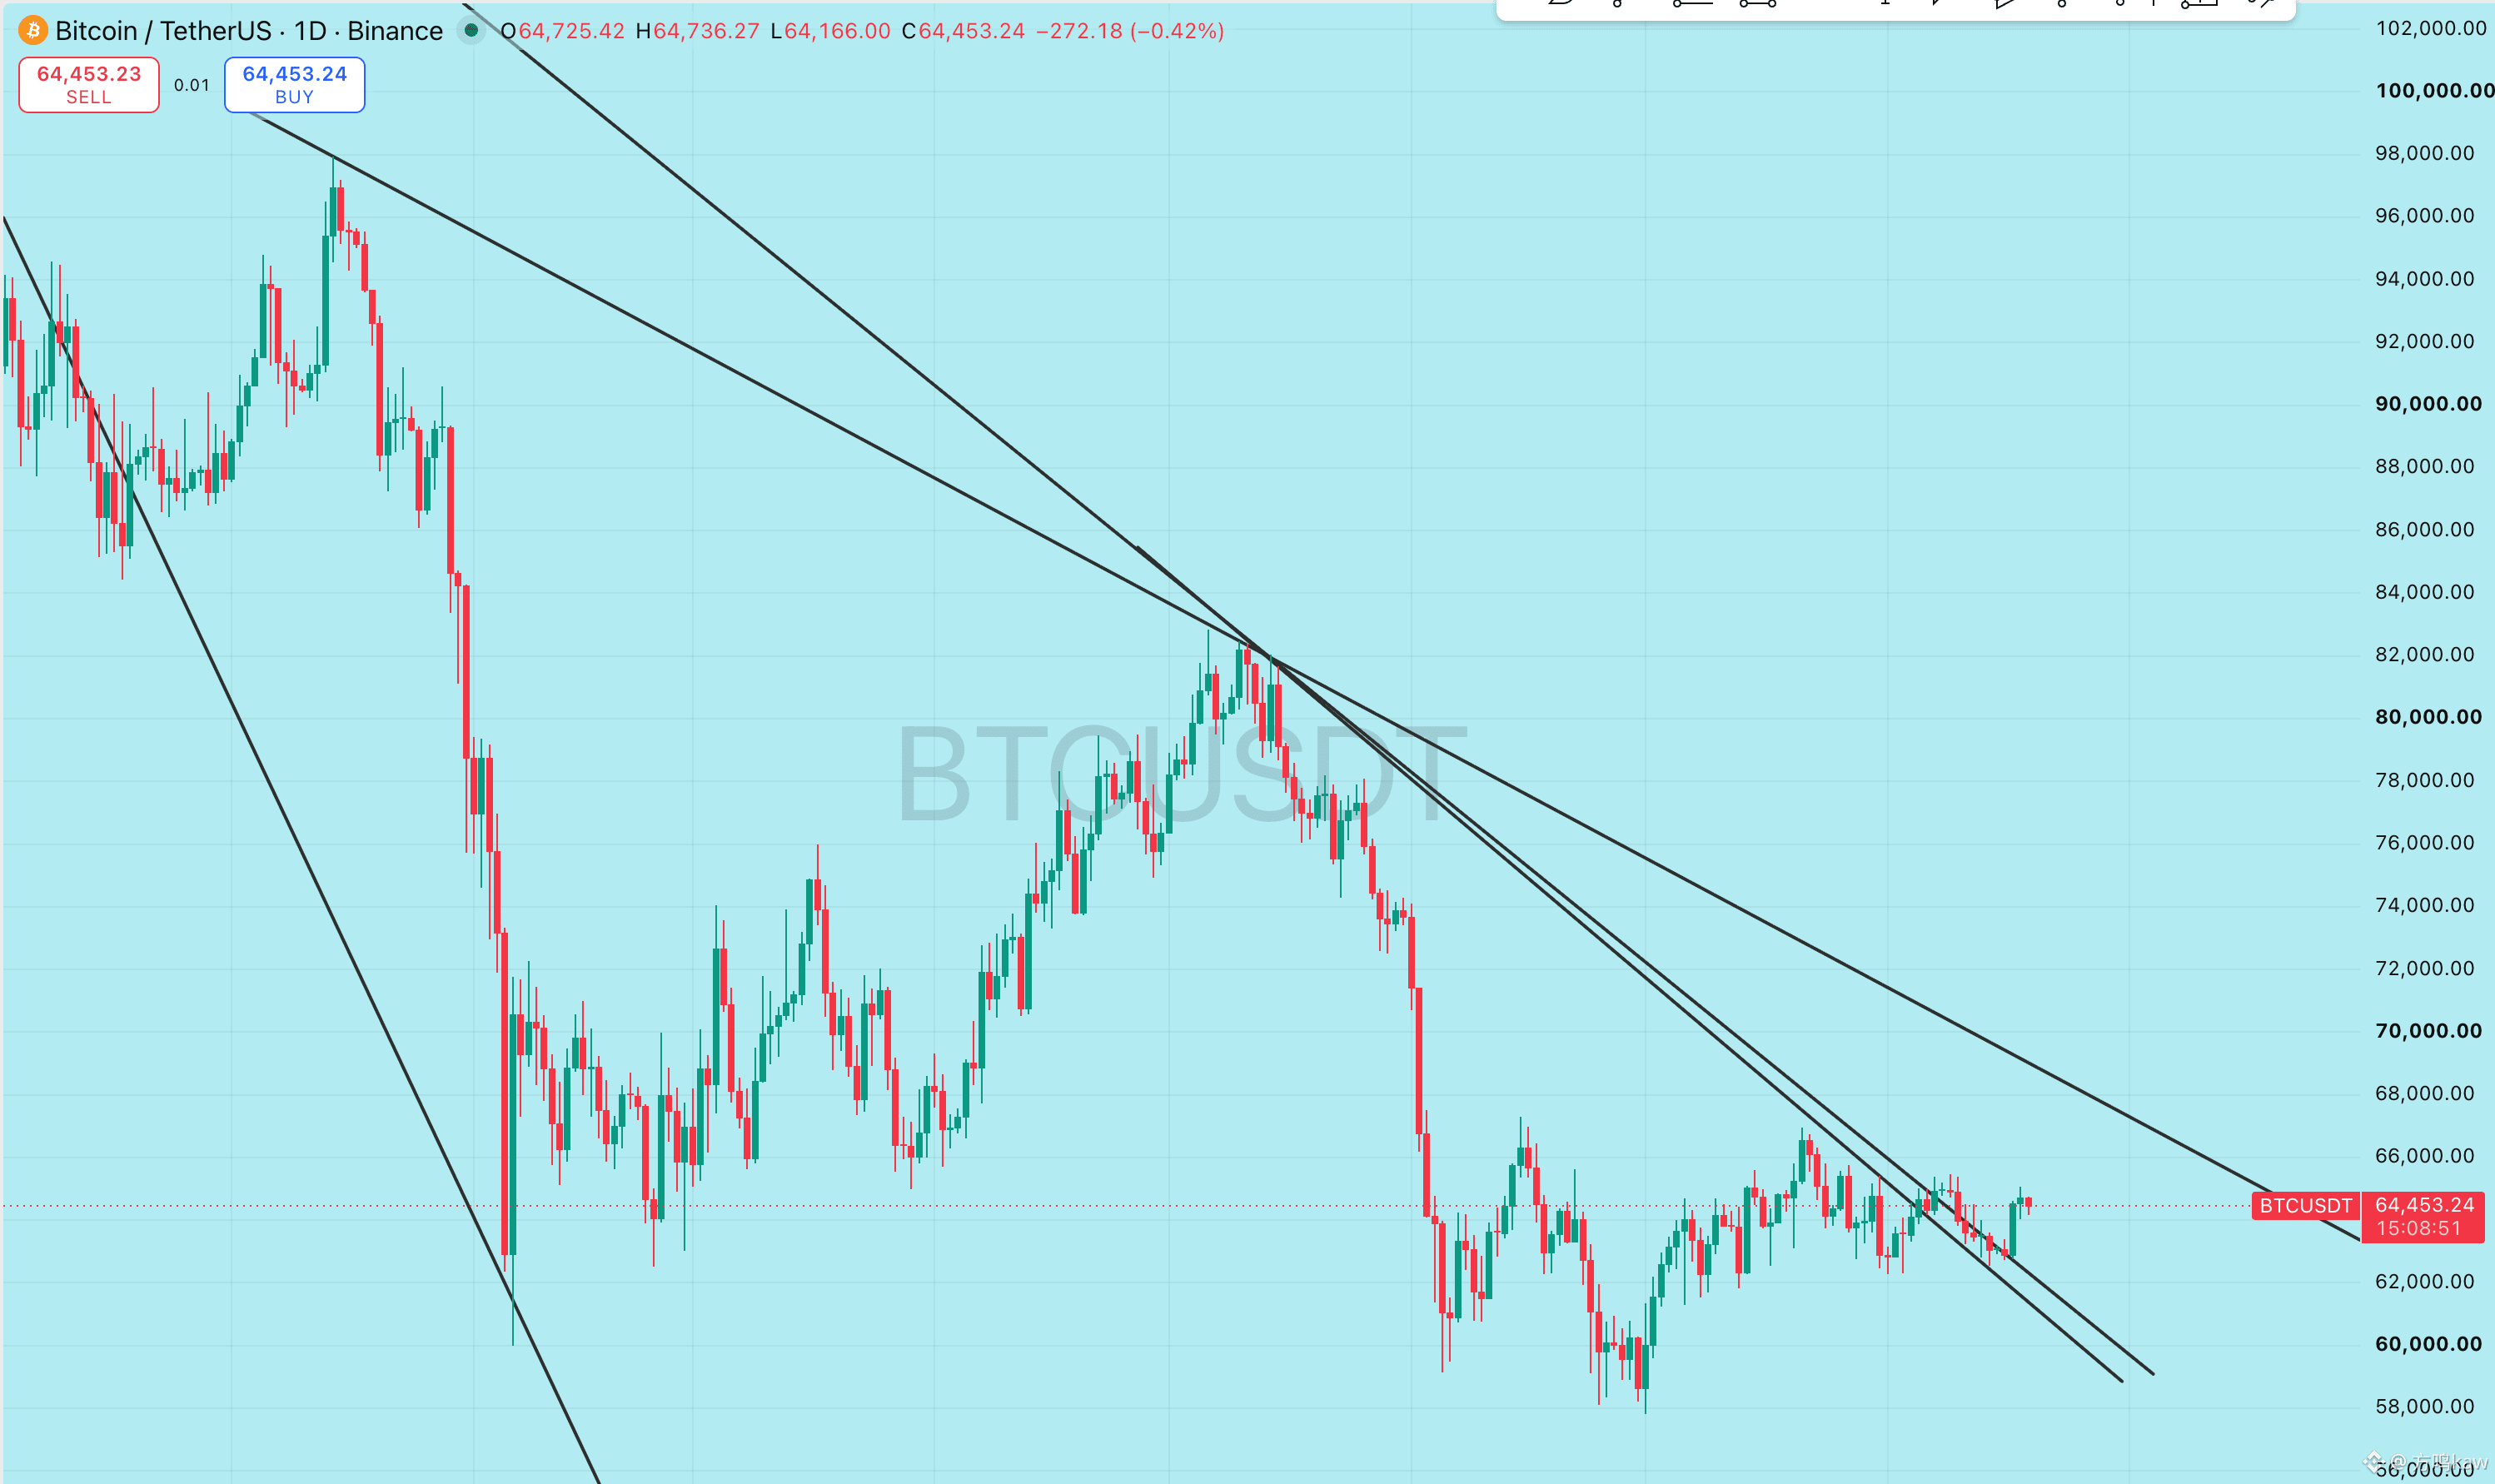
The big pancake is currently trading around 64275. During the session it probed up to 65059 before pulling back. The 65000 to 65060 range has become the most direct resistance zone of today. This is not only an integer level, but also the first real sell-side test the market faces after ETF funds started flowing back. If the 4-hour timeframe can reclaim and hold above 65000, then the market would have the foundation to continue testing 65500 and 66000. On the downside, first look at 64000; once that breaks, then watch 63700 and 63200 in sequence. Consecutive net inflows without producing an effective breakout suggests that we still cannot simply interpret the warming of capital as a trend reversal. Funds have returned, but the pass has not yet been crossed.
Ethereum is around 1916. The intraday low is at 1894, and the high reached 1923. 1900 is still the most recent support area; after 1894 is broken again, watch 1875. On the upside, what truly needs to be broken is 1923—only after holding above it can the repair space open up toward 1950. The spot ETH ETF net inflows have clearly strengthened, which means its short-term support is better than most altcoins. However, today we did not find any specific new project catalyst sufficient to independently change ETH pricing. Current strength is still mainly driven by ETF flows and the direction of the big pancake.
Ethereum is around 1916. The intraday low is at 1894, and the high reached 1923. 1900 is still the most recent support area; after 1894 is broken again, watch 1875. On the upside, what truly needs to be broken is 1923—only after holding above it can the repair space open up toward 1950. The spot ETH ETF net inflows have clearly strengthened, which means its short-term support is better than most altcoins. However, today we did not find any specific new project catalyst sufficient to independently change ETH pricing. Current strength is still mainly driven by ETF flows and the direction of the big pancake.
The real macro switch for this round of market action is the FOMC meeting minutes to be released later. The market needs to gauge just how much disagreement exists within the Federal Reserve on inflation, employment, and the pace of interest-rate cuts. Until the minutes are officially published, there is no sufficient basis to make an early bet on either a dovish or hawkish stance.
Latest data from the U.S. Treasury shows that the yield on the 10-year U.S. Treasury is at 4.71%, while the 30-year stands at 5.28%. High interest rates are still suppressing the valuation upside for risk assets. Geopolitical risk has also not eased: the U.S. said it has not yet scheduled negotiations with Iran, and uncertainty over the Strait of Hormuz passage and energy supply remains. The macro backdrop is still one of high rates, unresolved oil-price risk, and a policy direction that is yet to be confirmed. The market appears calm, but beneath the surface the undercurrents have not stopped.
Liquidity conditions have improved compared with the past few days. U.S. Bitcoin spot ETFs saw net inflows of $297.5 million on August 17, and continued to receive $189.3 million on August 18. Meanwhile, Ethereum spot ETFs in the same period recorded inflows of $30.9 million and $71.4 million, respectively. The consecutive fund returns indicate that institutional capital has resumed absorbing the market, but with BTC facing nearly $490 million in net inflows over two days, it still has not managed to hold above $65,000. This suggests that while capital has returned, the sell pressure overhead has not truly stepped away.
Latest data from the U.S. Treasury shows that the yield on the 10-year U.S. Treasury is at 4.71%, while the 30-year stands at 5.28%. High interest rates are still suppressing the valuation upside for risk assets. Geopolitical risk has also not eased: the U.S. said it has not yet scheduled negotiations with Iran, and uncertainty over the Strait of Hormuz passage and energy supply remains. The macro backdrop is still one of high rates, unresolved oil-price risk, and a policy direction that is yet to be confirmed. The market appears calm, but beneath the surface the undercurrents have not stopped.
Liquidity conditions have improved compared with the past few days. U.S. Bitcoin spot ETFs saw net inflows of $297.5 million on August 17, and continued to receive $189.3 million on August 18. Meanwhile, Ethereum spot ETFs in the same period recorded inflows of $30.9 million and $71.4 million, respectively. The consecutive fund returns indicate that institutional capital has resumed absorbing the market, but with BTC facing nearly $490 million in net inflows over two days, it still has not managed to hold above $65,000. This suggests that while capital has returned, the sell pressure overhead has not truly stepped away.
BGB is trading sideways around 1.657. 1.65 is still the most important nearby support level. As long as it holds, we’ll first watch 1.666; only with a further breakout will there be a chance to test 1.68. If 1.65 breaks, then look at 1.64 and 1.62 in sequence below.
Bitget did not release any new announcements today that clearly boost BGB demand or change the token supply. Price also did not show volume activity that was independent of the broader market. With no news, no incremental changes, and no breakout, we can only wait for now.
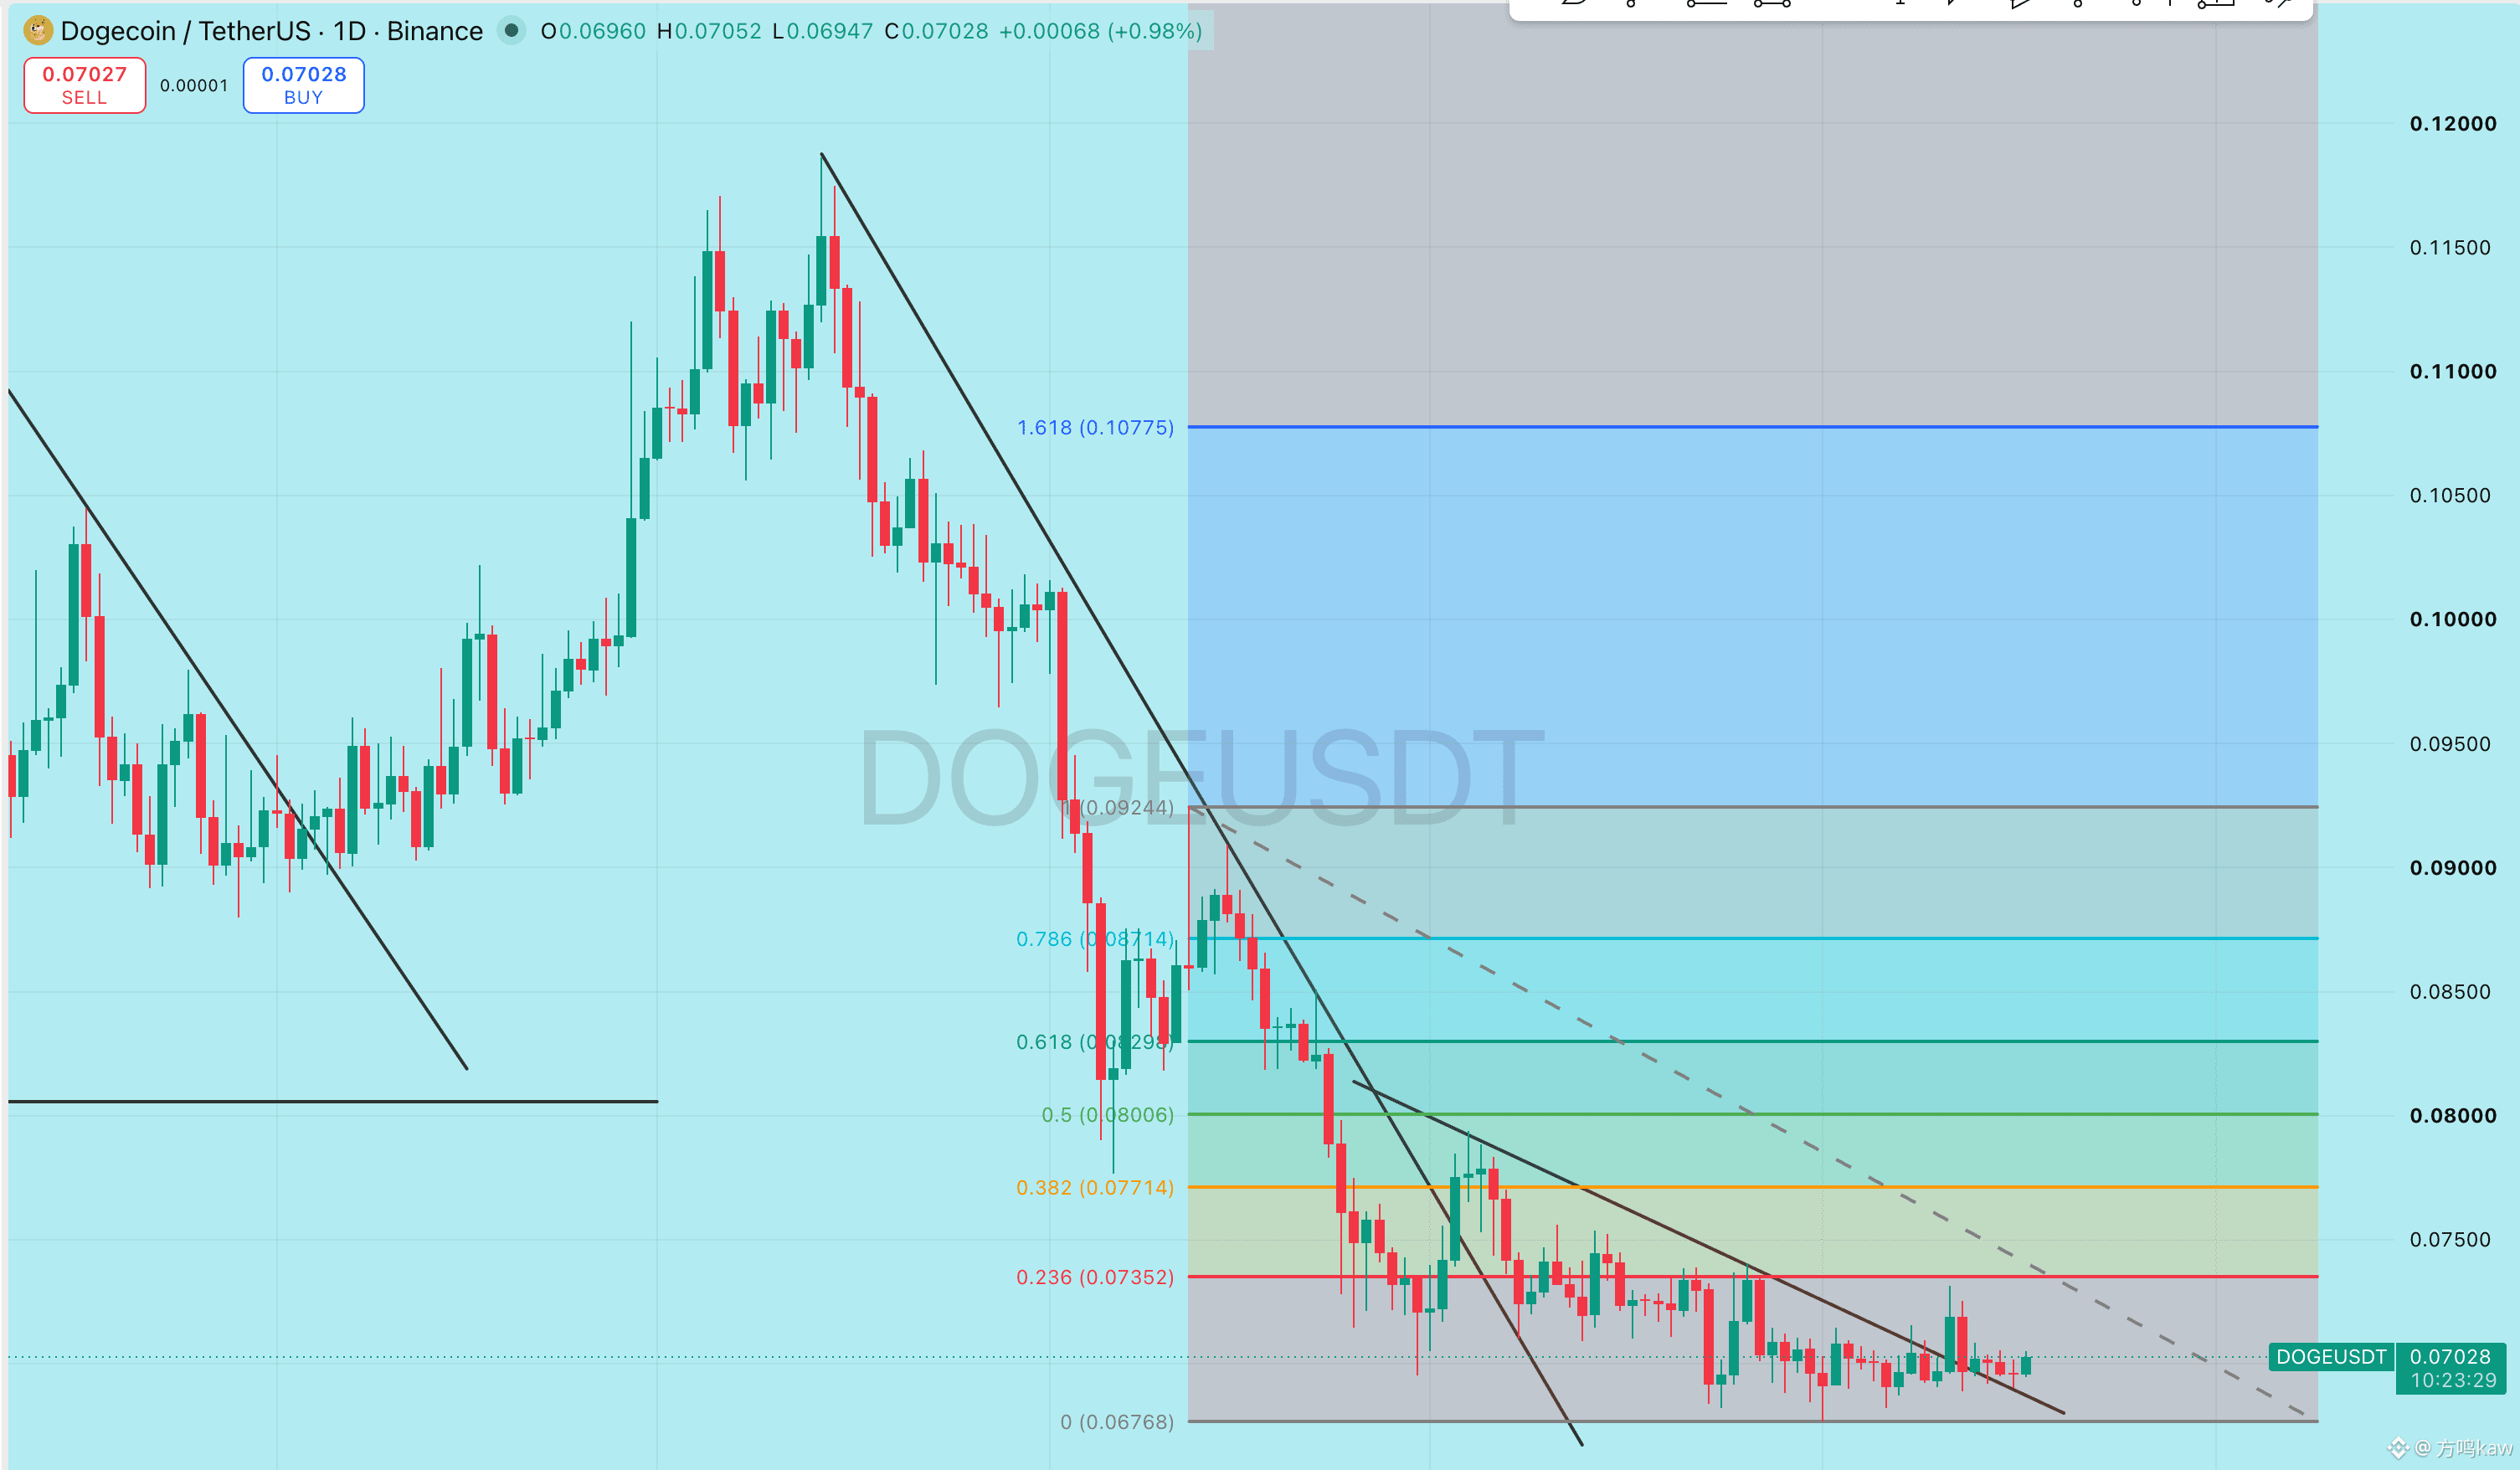
DOGE has returned to around 0.0700. During the session it surged to 0.0705, but didn’t continue to expand its gains. If 0.0700 holds, there will be opportunities to test 0.0705 and 0.0720 later. If it breaks down, first watch 0.0690, followed by 0.0680. Today saw no new payment application, no Musk comments, and no DOGE ecosystem catalyst. Price has essentially tracked the broader market. Meme markets are most afraid of commotion without wind—things look lively, but there isn’t lasting fuel. Until volume and price move up together, don’t chase.
Bitget did not release any new announcements today that clearly boost BGB demand or change the token supply. Price also did not show volume activity that was independent of the broader market. With no news, no incremental changes, and no breakout, we can only wait for now.
DOGE has returned to around 0.0700. During the session it surged to 0.0705, but didn’t continue to expand its gains. If 0.0700 holds, there will be opportunities to test 0.0705 and 0.0720 later. If it breaks down, first watch 0.0690, followed by 0.0680. Today saw no new payment application, no Musk comments, and no DOGE ecosystem catalyst. Price has essentially tracked the broader market. Meme markets are most afraid of commotion without wind—things look lively, but there isn’t lasting fuel. Until volume and price move up together, don’t chase.
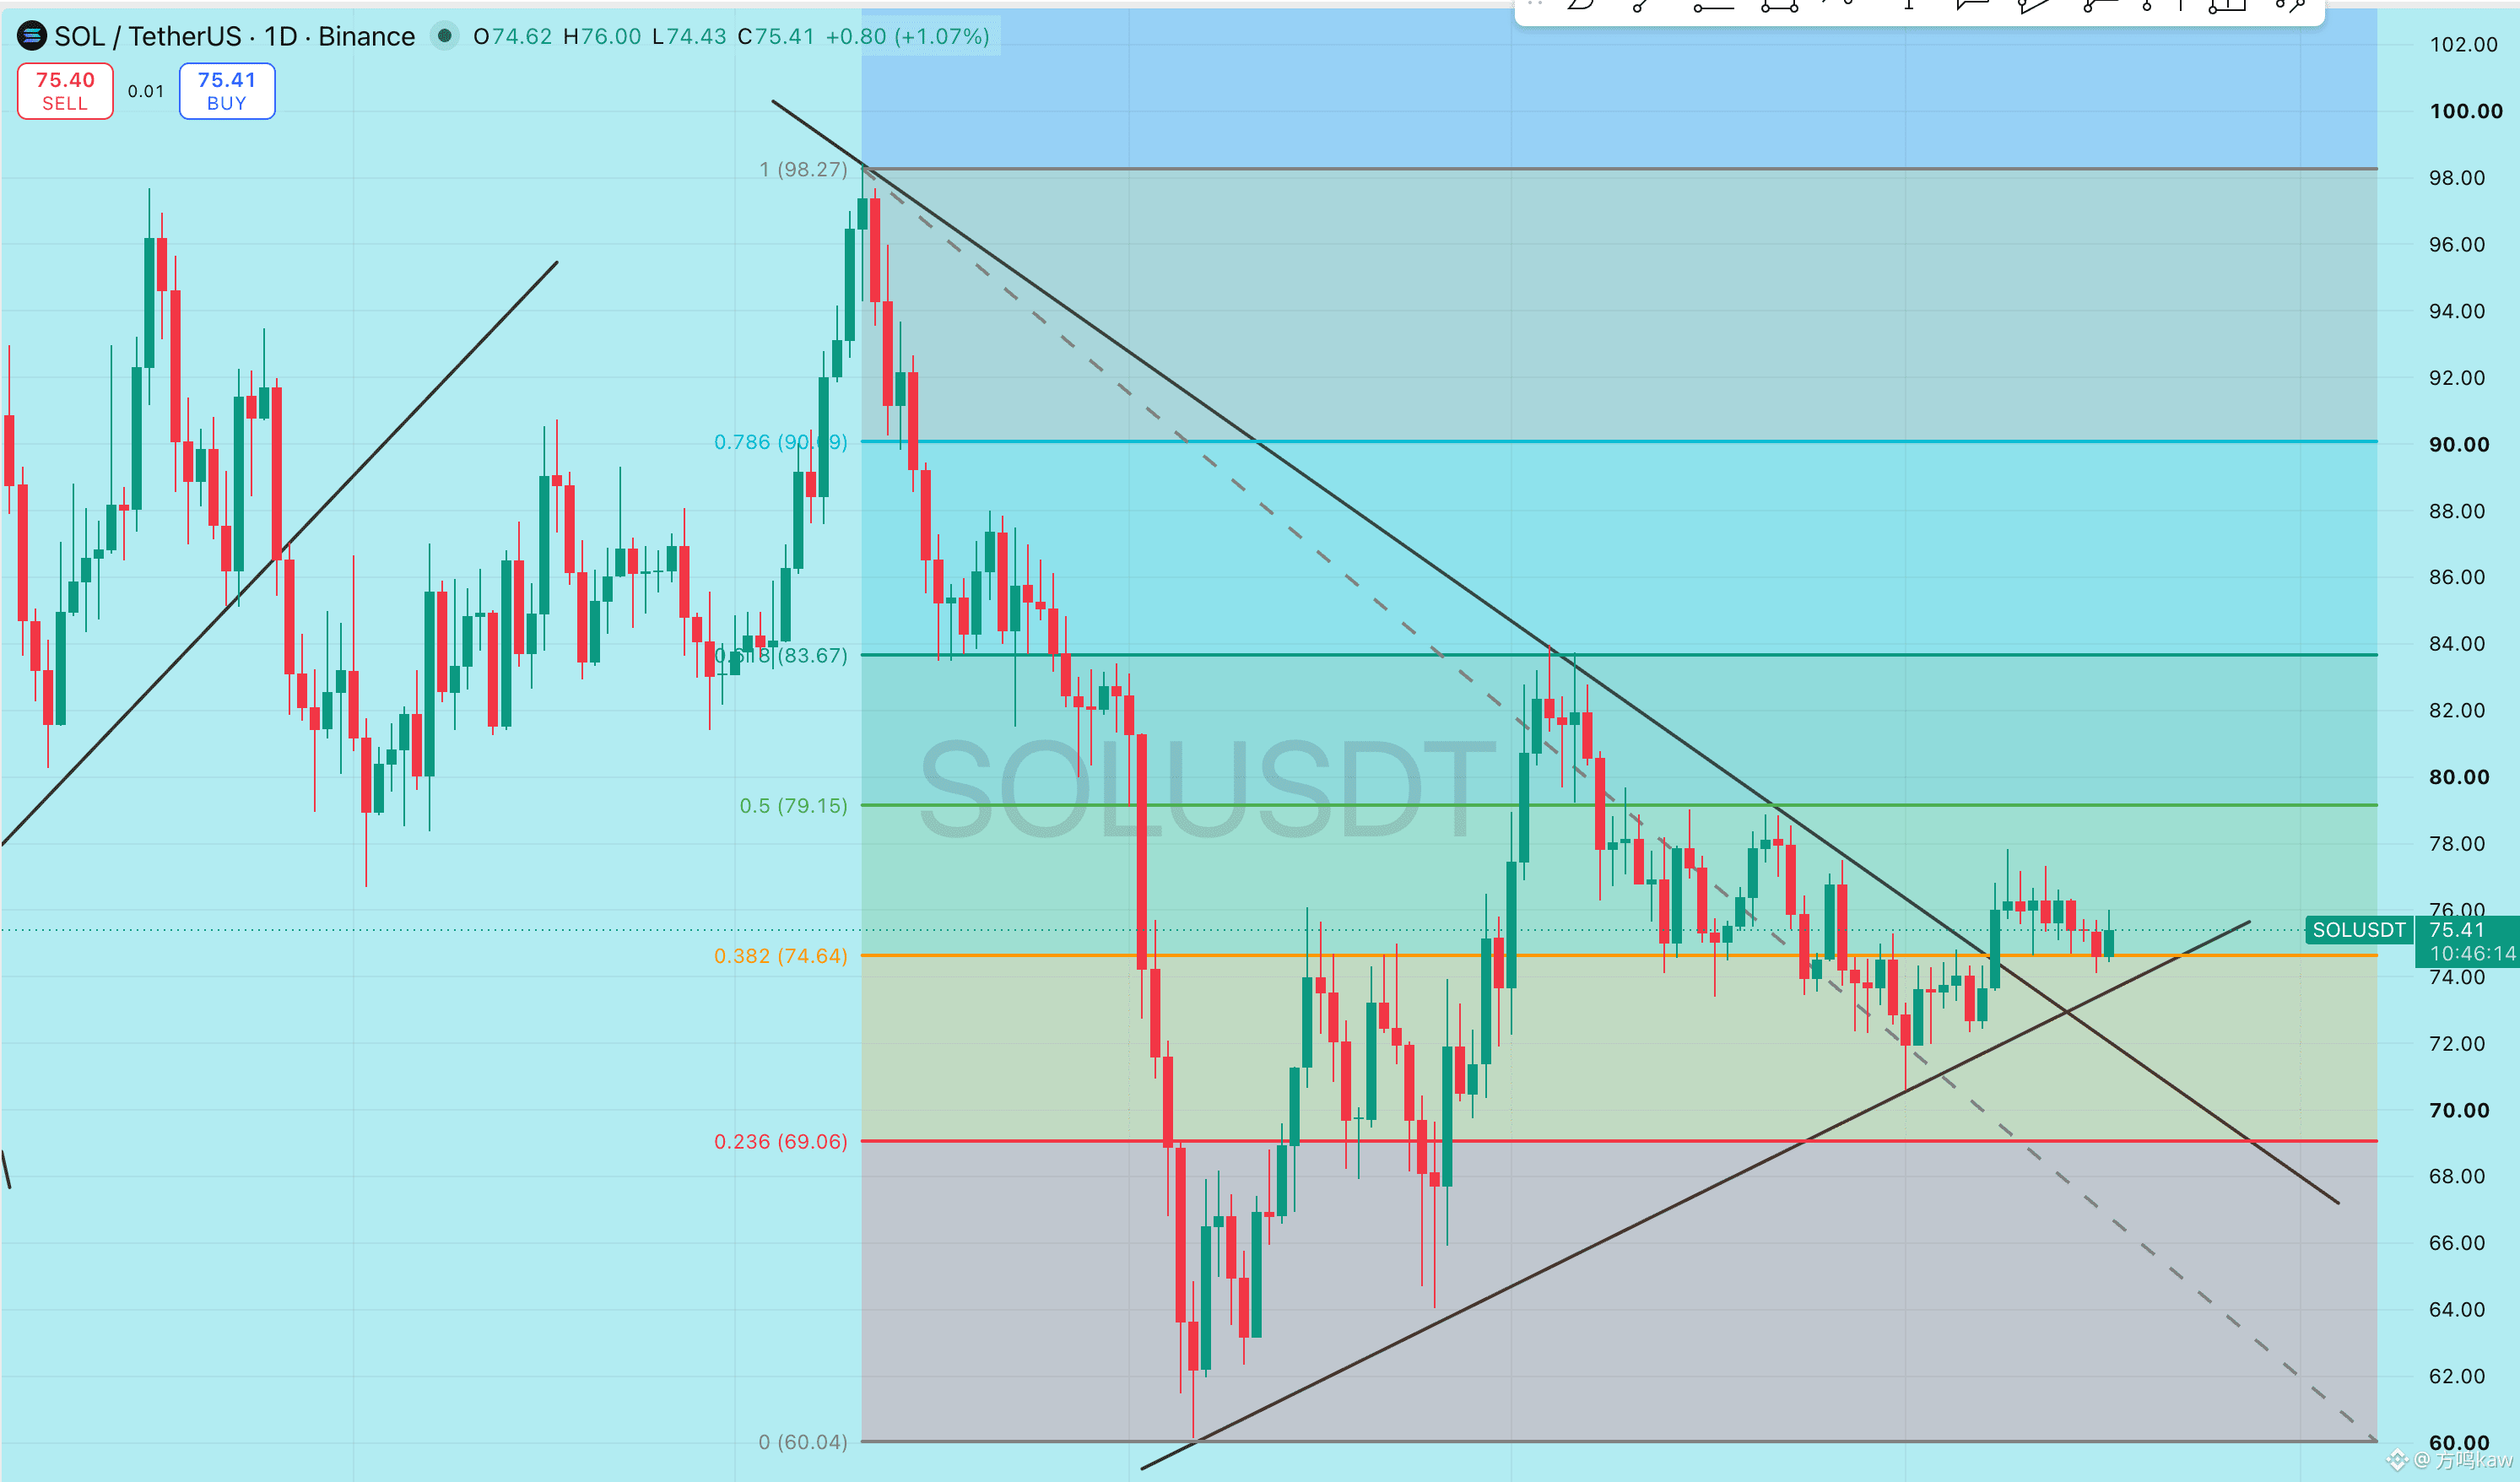
SOL repeatedly changed hands around 75; during the session it probed up to 76 and down to 74, yet the price still hasn’t broken out of the recent consolidation range. After 75 holds, continue to watch for 76—only a breakthrough and hold above it would create the conditions to test 78. If it falls back below 75, then 74 needs to be defended; if 74 is lost again, it will likely retest 73.
For the SOL ETF, there was no net inflow of new capital over the last full trading day, and at the project level there’s no strong news today sufficient to drive a repricing. The rebound potential isn’t the issue—the missing element is the funds to spark it and the catalysts. Therefore, chasing the breakout before 76 is not suitable.
XRP has returned near the 1.00 psychological level, but it didn’t recover until after dipping to 0.988 during the session. This suggests that around 1.00 remains a zone of repeated contention. Holding 1.00 requires breaking sequentially above 1.007 and 1.02 to confirm a short-term turn for the bullish. If it breaks below 0.988 again, then watch 0.98 and 0.97.
Ripple did not release any new message today that directly changes the XRP supply-demand dynamics. The old narratives—payments, ETFs, and institutional stories—can’t explain today’s short-term volatility. So for now, treat it as moving in line with the broader market.
For the SOL ETF, there was no net inflow of new capital over the last full trading day, and at the project level there’s no strong news today sufficient to drive a repricing. The rebound potential isn’t the issue—the missing element is the funds to spark it and the catalysts. Therefore, chasing the breakout before 76 is not suitable.
XRP has returned near the 1.00 psychological level, but it didn’t recover until after dipping to 0.988 during the session. This suggests that around 1.00 remains a zone of repeated contention. Holding 1.00 requires breaking sequentially above 1.007 and 1.02 to confirm a short-term turn for the bullish. If it breaks below 0.988 again, then watch 0.98 and 0.97.
Ripple did not release any new message today that directly changes the XRP supply-demand dynamics. The old narratives—payments, ETFs, and institutional stories—can’t explain today’s short-term volatility. So for now, treat it as moving in line with the broader market.
Log in to explore more content