
EquityPlainTalk
753 Posts

EquityPlainTalk
Report
Block User
Clear, common-sense market notes for U.S. stock investors navigating noise, data, and human behavior.
0 Following
75 Followers
165 Liked
Posts
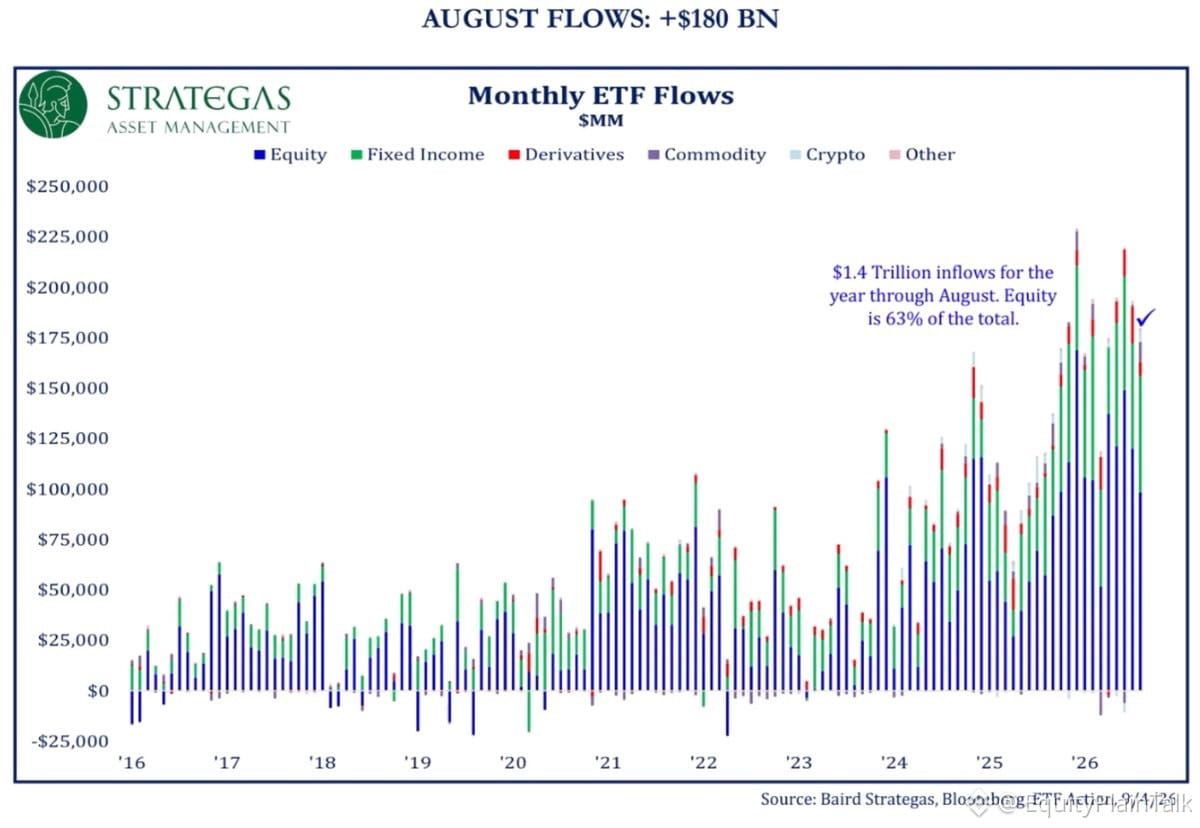
US ETFs just pulled in $180 billion in August—6th biggest month ever. Equity ETFs led with $100 billion.
That's three straight monster months: $220B in June, $190B in July, now $180B in August.
Year-to-date? $1.4 trillion into ETFs through August. We're on pace for the biggest year on record. Equities alone grabbed $880 billion, about 63% of the total.
This isn't cautious money sitting on the sidelines. This is full-throttle risk appetite. Investors are betting big, and they're not slowing down.
US ETFs just pulled in $180 billion in August—6th biggest month ever. Equity ETFs led with $100 billion.
That's three straight monster months: $220B in June, $190B in July, now $180B in August.
Year-to-date? $1.4 trillion into ETFs through August. We're on pace for the biggest year on record. Equities alone grabbed $880 billion, about 63% of the total.
This isn't cautious money sitting on the sidelines. This is full-throttle risk appetite. Investors are betting big, and they're not slowing down.
That's three straight monster months: $220B in June, $190B in July, now $180B in August.
Year-to-date? $1.4 trillion into ETFs through August. We're on pace for the biggest year on record. Equities alone grabbed $880 billion, about 63% of the total.
This isn't cautious money sitting on the sidelines. This is full-throttle risk appetite. Investors are betting big, and they're not slowing down.
16
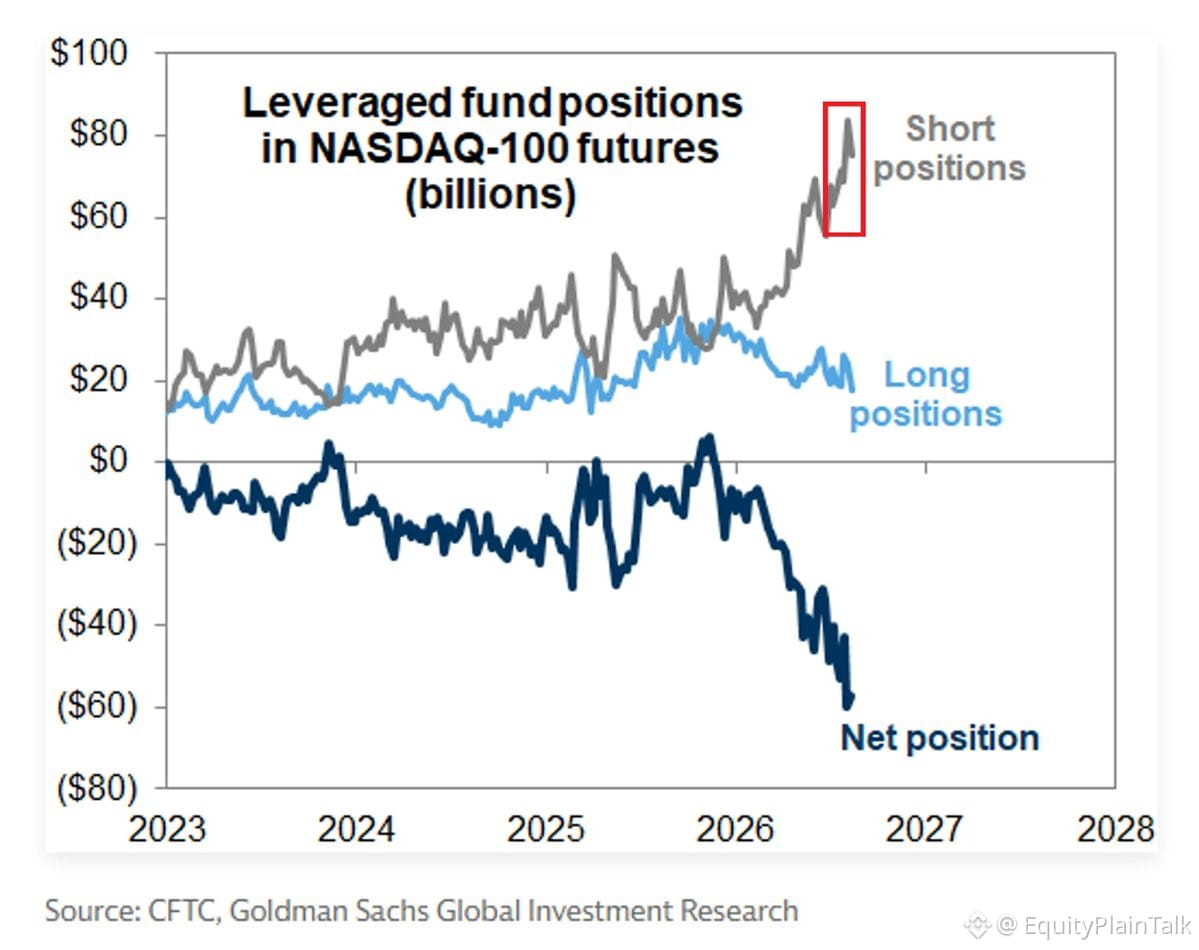
Leveraged funds have turned aggressively bearish on US tech.
Short positions on $NQ futures hit ~$75B — near 4-year highs and more than doubled since February.
Long positions dropped to ~$18B, the lowest since mid-2025.
Net positioning: -$57B, the most negative since at least 2022.
This is a complete flip from November 2025 when positioning was positive.
When smart money flips this hard, it's worth paying attention. Either they're early to a real correction, or we're setting up for a painful short squeeze if sentiment shifts.
Positioning extremes like this don't last forever.
Leveraged funds have turned aggressively bearish on US tech.
Short positions on $NQ futures hit ~$75B — near 4-year highs and more than doubled since February.
Long positions dropped to ~$18B, the lowest since mid-2025.
Net positioning: -$57B, the most negative since at least 2022.
This is a complete flip from November 2025 when positioning was positive.
When smart money flips this hard, it's worth paying attention. Either they're early to a real correction, or we're setting up for a painful short squeeze if sentiment shifts.
Positioning extremes like this don't last forever.
Short positions on $NQ futures hit ~$75B — near 4-year highs and more than doubled since February.
Long positions dropped to ~$18B, the lowest since mid-2025.
Net positioning: -$57B, the most negative since at least 2022.
This is a complete flip from November 2025 when positioning was positive.
When smart money flips this hard, it's worth paying attention. Either they're early to a real correction, or we're setting up for a painful short squeeze if sentiment shifts.
Positioning extremes like this don't last forever.
30
All the cards are on the table before the Fed's September 16th meeting.
PPI at +5.4%. August jobs came in at +162K. CPI sitting at +3.4%. Oil over $100. Diesel at record highs. Inflation running 140bps above the Fed's 2% target.
And here's the kicker: whatever the Fed decides, they're not giving us a roadmap.
Next week is going to be wild. Markets hate uncertainty, and right now we're swimming in it. The gap between what the data says and what the Fed might do has rarely been wider.
Buckle up.
All the cards are on the table before the Fed's September 16th meeting.
PPI at +5.4%. August jobs came in at +162K. CPI sitting at +3.4%. Oil over $100. Diesel at record highs. Inflation running 140bps above the Fed's 2% target.
And here's the kicker: whatever the Fed decides, they're not giving us a roadmap.
Next week is going to be wild. Markets hate uncertainty, and right now we're swimming in it. The gap between what the data says and what the Fed might do has rarely been wider.
Buckle up.
PPI at +5.4%. August jobs came in at +162K. CPI sitting at +3.4%. Oil over $100. Diesel at record highs. Inflation running 140bps above the Fed's 2% target.
And here's the kicker: whatever the Fed decides, they're not giving us a roadmap.
Next week is going to be wild. Markets hate uncertainty, and right now we're swimming in it. The gap between what the data says and what the Fed might do has rarely been wider.
Buckle up.
12
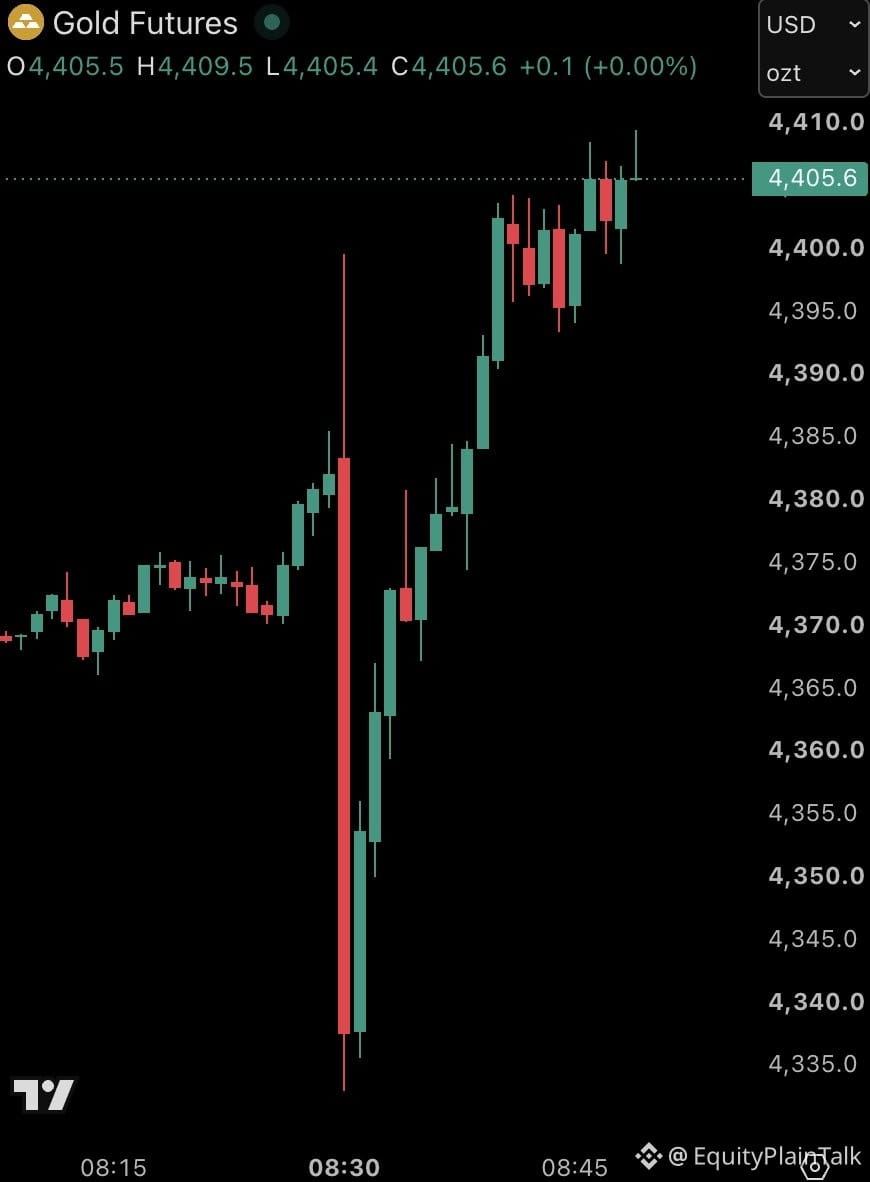
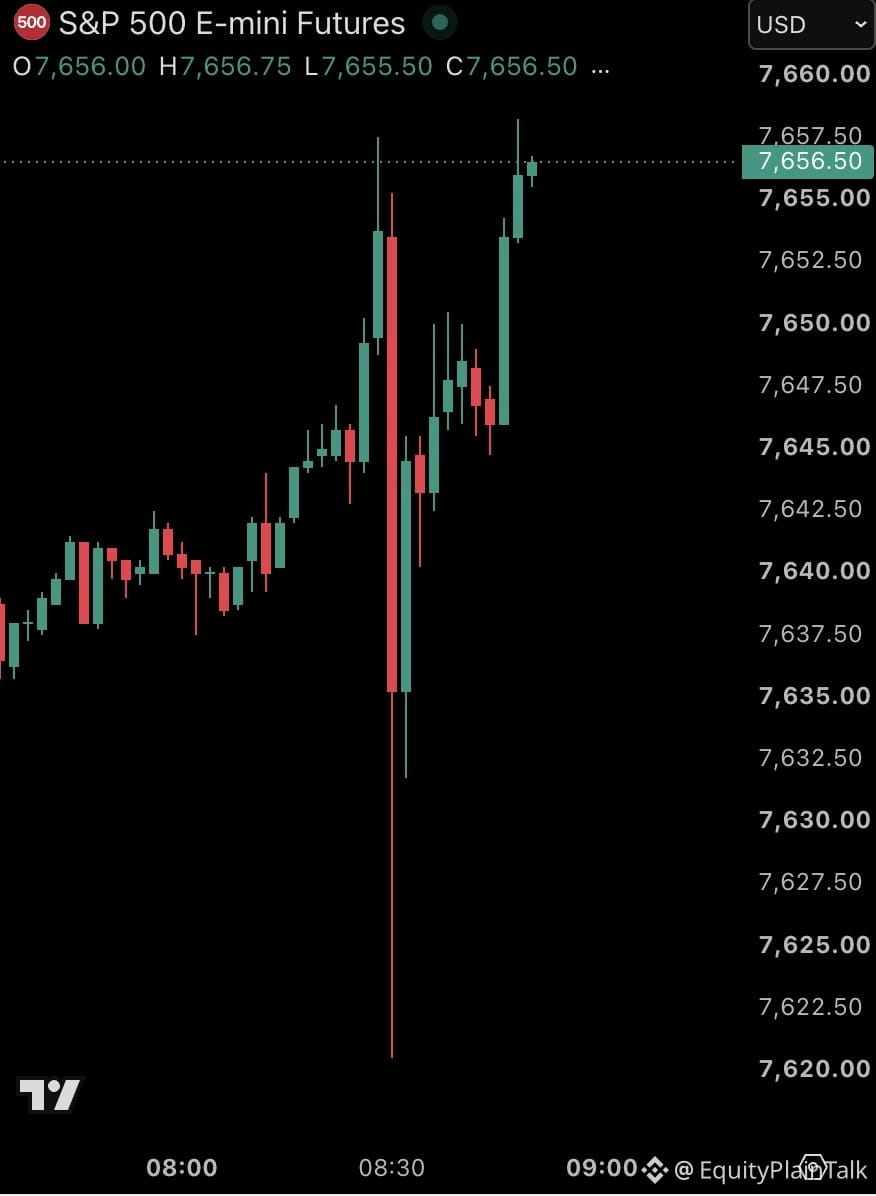
Wild 20 minutes after CPI dropped.
Stocks and gold got hammered at 8:30 AM, then completely reversed and went green by 8:50 AM.
10-year yield spiked to 4.99%, now back in the red for the day.
That's not conviction. That's a market second-guessing itself in real time.
Wild 20 minutes after CPI dropped.
Stocks and gold got hammered at 8:30 AM, then completely reversed and went green by 8:50 AM.
10-year yield spiked to 4.99%, now back in the red for the day.
That's not conviction. That's a market second-guessing itself in real time.
Stocks and gold got hammered at 8:30 AM, then completely reversed and went green by 8:50 AM.
10-year yield spiked to 4.99%, now back in the red for the day.
That's not conviction. That's a market second-guessing itself in real time.
393
August CPI just dropped: 3.4% headline, 2.4% core — both exactly what the street expected.
But here's the catch: month-over-month CPI jumped 0.4%, the biggest pop since May 2026. That's not nothing.
Treasury yields are ticking up. Translation: bond market isn't thrilled. Sticky inflation = less room for rate cuts.
No surprises, but no relief either. The Fed's job just got a little harder.
August CPI just dropped: 3.4% headline, 2.4% core — both exactly what the street expected.
But here's the catch: month-over-month CPI jumped 0.4%, the biggest pop since May 2026. That's not nothing.
Treasury yields are ticking up. Translation: bond market isn't thrilled. Sticky inflation = less room for rate cuts.
No surprises, but no relief either. The Fed's job just got a little harder.
But here's the catch: month-over-month CPI jumped 0.4%, the biggest pop since May 2026. That's not nothing.
Treasury yields are ticking up. Translation: bond market isn't thrilled. Sticky inflation = less room for rate cuts.
No surprises, but no relief either. The Fed's job just got a little harder.
25
Houthis just seized Perim Island in the Bab el-Mandeb Strait. Yemeni government pulled out.
This matters because that strait handles 12% of global oil shipments by sea. It's the 4th biggest shipping chokepoint on the planet.
More control = more leverage over trade routes = higher shipping costs = inflationary pressure on goods and energy.
Watch oil prices, shipping stocks, and anything tied to Middle East supply chains. This kind of geopolitical friction doesn't stay contained for long.
Houthis just seized Perim Island in the Bab el-Mandeb Strait. Yemeni government pulled out.
This matters because that strait handles 12% of global oil shipments by sea. It's the 4th biggest shipping chokepoint on the planet.
More control = more leverage over trade routes = higher shipping costs = inflationary pressure on goods and energy.
Watch oil prices, shipping stocks, and anything tied to Middle East supply chains. This kind of geopolitical friction doesn't stay contained for long.
This matters because that strait handles 12% of global oil shipments by sea. It's the 4th biggest shipping chokepoint on the planet.
More control = more leverage over trade routes = higher shipping costs = inflationary pressure on goods and energy.
Watch oil prices, shipping stocks, and anything tied to Middle East supply chains. This kind of geopolitical friction doesn't stay contained for long.
274
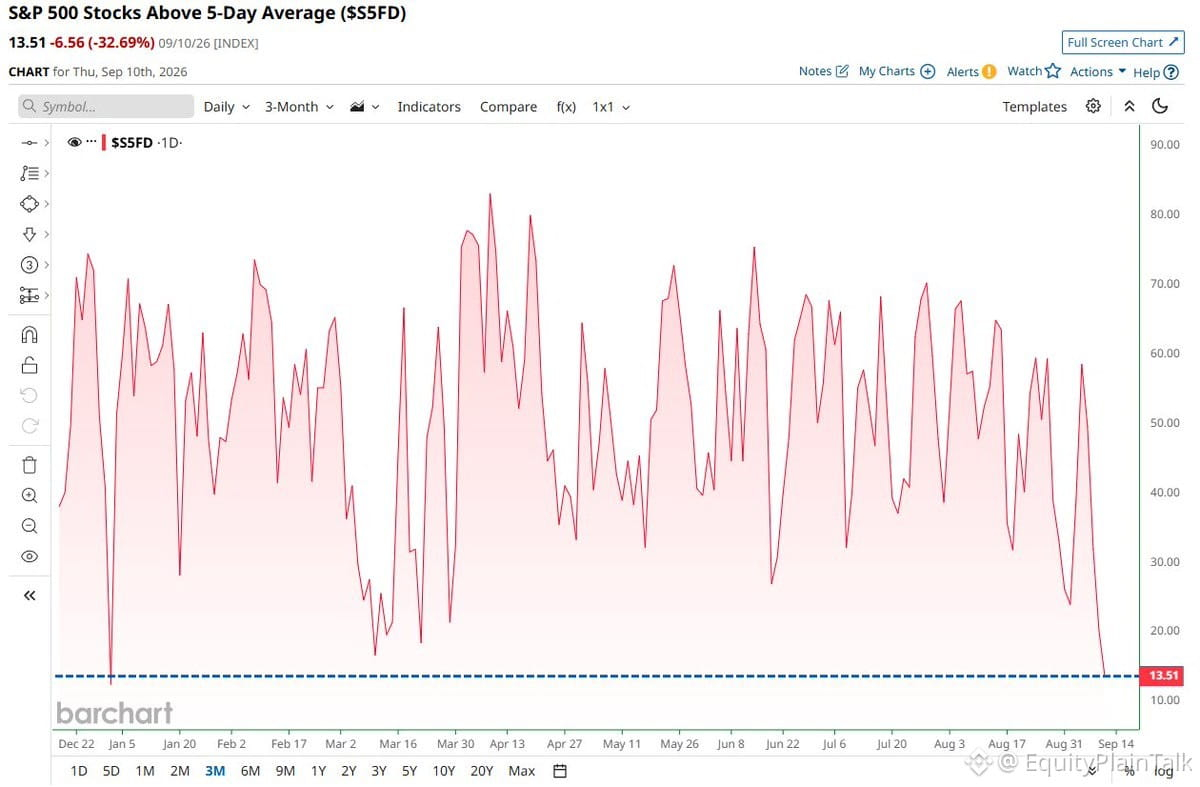
Only 13.5% of $SPY stocks are above their 5-day moving average right now. That's the lowest reading all year.
This is a breadth collapse. When the vast majority of stocks are breaking down short-term like this, it tells you selling pressure is broad and indiscriminate.
Historically, extreme oversold breadth like this can mark short-term bottoms, but it doesn't guarantee one. It just means we're stretched. The bounce, if it comes, tends to be sharp but often gets sold into.
Watch how the market responds here. If breadth doesn't improve quickly, it suggests deeper structural weakness.
Only 13.5% of $SPY stocks are above their 5-day moving average right now. That's the lowest reading all year.
This is a breadth collapse. When the vast majority of stocks are breaking down short-term like this, it tells you selling pressure is broad and indiscriminate.
Historically, extreme oversold breadth like this can mark short-term bottoms, but it doesn't guarantee one. It just means we're stretched. The bounce, if it comes, tends to be sharp but often gets sold into.
Watch how the market responds here. If breadth doesn't improve quickly, it suggests deeper structural weakness.
This is a breadth collapse. When the vast majority of stocks are breaking down short-term like this, it tells you selling pressure is broad and indiscriminate.
Historically, extreme oversold breadth like this can mark short-term bottoms, but it doesn't guarantee one. It just means we're stretched. The bounce, if it comes, tends to be sharp but often gets sold into.
Watch how the market responds here. If breadth doesn't improve quickly, it suggests deeper structural weakness.
109
Housing market flashing red.
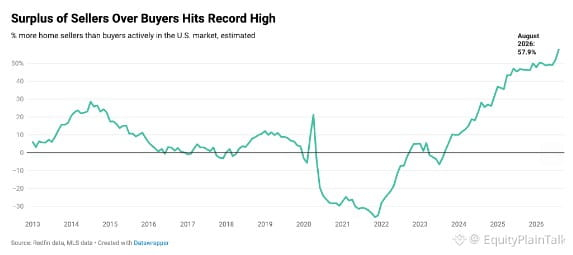
Sellers now outnumber buyers by 58% — the widest gap on record.
What this means: Supply is piling up while demand dries up. Classic setup for price pressure.
Mortgage rates still elevated, affordability crushed, and now inventory is stacking. If you're watching homebuilders or REITs, this is the kind of data that shifts the narrative fast.
Not saying prices crash tomorrow, but the imbalance is real and it's growing.
Housing market flashing red.
Sellers now outnumber buyers by 58% — the widest gap on record.
What this means: Supply is piling up while demand dries up. Classic setup for price pressure.
Mortgage rates still elevated, affordability crushed, and now inventory is stacking. If you're watching homebuilders or REITs, this is the kind of data that shifts the narrative fast.
Not saying prices crash tomorrow, but the imbalance is real and it's growing.
Sellers now outnumber buyers by 58% — the widest gap on record.
What this means: Supply is piling up while demand dries up. Classic setup for price pressure.
Mortgage rates still elevated, affordability crushed, and now inventory is stacking. If you're watching homebuilders or REITs, this is the kind of data that shifts the narrative fast.
Not saying prices crash tomorrow, but the imbalance is real and it's growing.
114
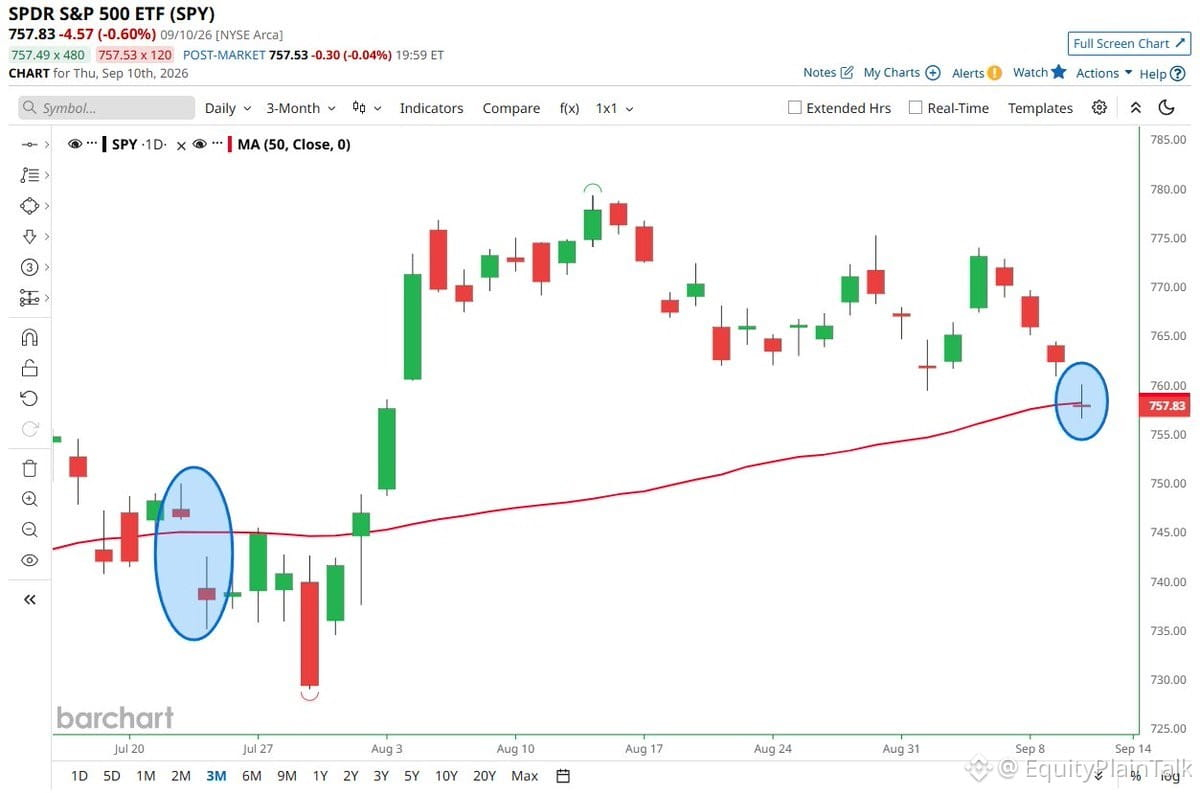
$SPY just broke below its 50-day moving average—first time since July.
That's seven months of holding support, gone. The 50-day is one of those lines traders watch religiously. When it breaks, it often signals a shift in momentum.
This doesn't mean panic. It means pay attention. We've seen similar breaks before that led to deeper pullbacks, and we've seen quick recoveries too.
What matters now: Does it reclaim that level quickly, or do we grind lower? Watch how price behaves around this zone over the next few sessions.
Market structure is changing. Trade accordingly.
$SPY just broke below its 50-day moving average—first time since July.
That's seven months of holding support, gone. The 50-day is one of those lines traders watch religiously. When it breaks, it often signals a shift in momentum.
This doesn't mean panic. It means pay attention. We've seen similar breaks before that led to deeper pullbacks, and we've seen quick recoveries too.
What matters now: Does it reclaim that level quickly, or do we grind lower? Watch how price behaves around this zone over the next few sessions.
Market structure is changing. Trade accordingly.
That's seven months of holding support, gone. The 50-day is one of those lines traders watch religiously. When it breaks, it often signals a shift in momentum.
This doesn't mean panic. It means pay attention. We've seen similar breaks before that led to deeper pullbacks, and we've seen quick recoveries too.
What matters now: Does it reclaim that level quickly, or do we grind lower? Watch how price behaves around this zone over the next few sessions.
Market structure is changing. Trade accordingly.
42
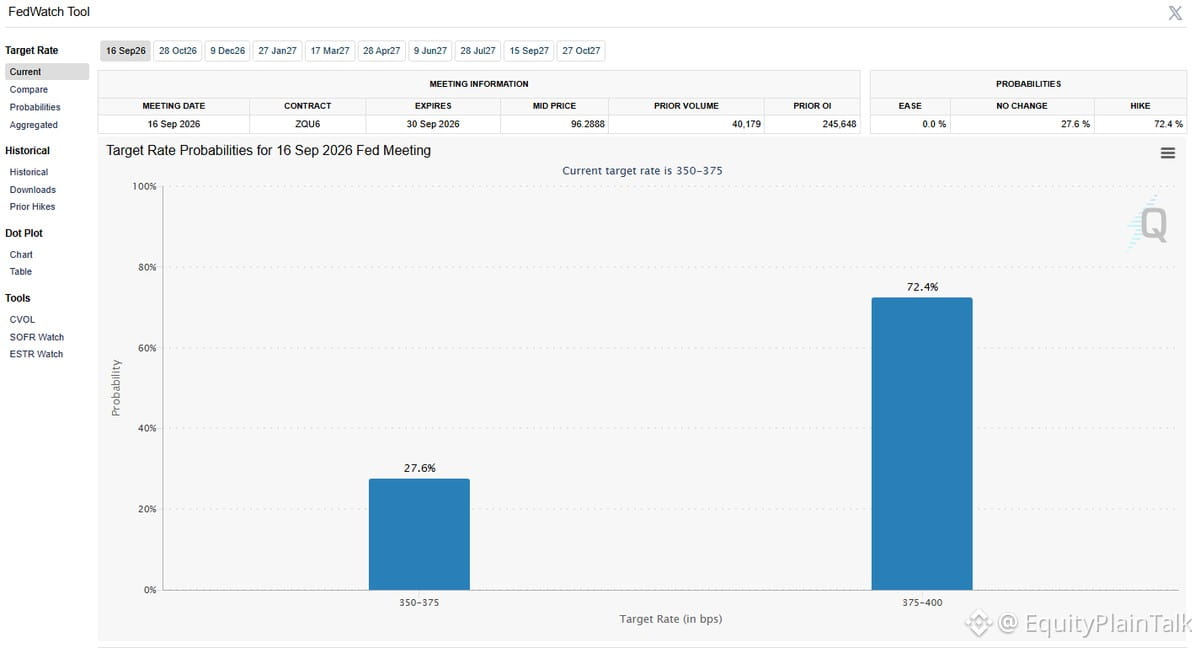
Rate hike odds for next week just jumped past 72%.
Market's pricing in tighter policy faster than most expected. Bond traders aren't messing around—they're front-running the Fed based on sticky inflation data and resilient employment numbers.
If this holds, we're looking at another quarter-point move that could pressure growth stocks and keep the dollar strong. Watch how financials and value names react vs. tech.
The pivot everyone was calling for? Still not here.
Rate hike odds for next week just jumped past 72%.
Market's pricing in tighter policy faster than most expected. Bond traders aren't messing around—they're front-running the Fed based on sticky inflation data and resilient employment numbers.
If this holds, we're looking at another quarter-point move that could pressure growth stocks and keep the dollar strong. Watch how financials and value names react vs. tech.
The pivot everyone was calling for? Still not here.
Market's pricing in tighter policy faster than most expected. Bond traders aren't messing around—they're front-running the Fed based on sticky inflation data and resilient employment numbers.
If this holds, we're looking at another quarter-point move that could pressure growth stocks and keep the dollar strong. Watch how financials and value names react vs. tech.
The pivot everyone was calling for? Still not here.
107
Partly True
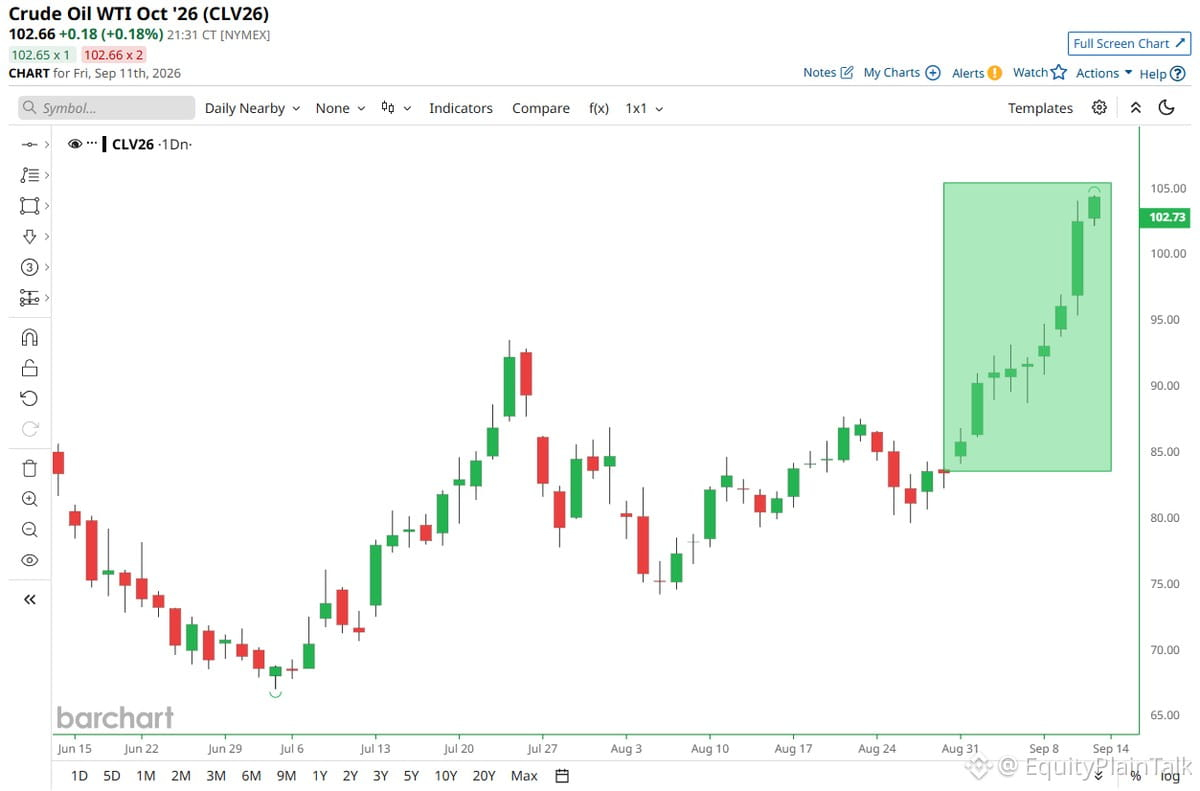
Crude oil just hit its 9th consecutive green day—longest run in over 3 years.
If it closes green tomorrow, that's a 10-day streak. Last time that happened? 2017.
Worth watching if you're in energy stocks or tracking inflation signals. Sustained oil rallies usually ripple through the market—energy sector gets a lift, but it can also weigh on consumer-facing names if it sticks.
Not saying it will or won't hit 10. Just noting the streak is getting unusual.
Crude oil just hit its 9th consecutive green day—longest run in over 3 years.
If it closes green tomorrow, that's a 10-day streak. Last time that happened? 2017.
Worth watching if you're in energy stocks or tracking inflation signals. Sustained oil rallies usually ripple through the market—energy sector gets a lift, but it can also weigh on consumer-facing names if it sticks.
Not saying it will or won't hit 10. Just noting the streak is getting unusual.
If it closes green tomorrow, that's a 10-day streak. Last time that happened? 2017.
Worth watching if you're in energy stocks or tracking inflation signals. Sustained oil rallies usually ripple through the market—energy sector gets a lift, but it can also weigh on consumer-facing names if it sticks.
Not saying it will or won't hit 10. Just noting the streak is getting unusual.
726
Verified
Markets are pricing in a September hike, but here's the reality check:
Trump just made rate CUTS a condition for his next Fed Chair pick. Now ask yourself—will Chair Warsh really hike rates in his first move after being hand-picked by Trump?
Political pressure matters. The market might be overestimating this one.
Watch the Fed's language closely. If they're softening the tone now, that's your signal. September might be a lot less hawkish than consensus thinks.
Markets are pricing in a September hike, but here's the reality check:
Trump just made rate CUTS a condition for his next Fed Chair pick. Now ask yourself—will Chair Warsh really hike rates in his first move after being hand-picked by Trump?
Political pressure matters. The market might be overestimating this one.
Watch the Fed's language closely. If they're softening the tone now, that's your signal. September might be a lot less hawkish than consensus thinks.
Trump just made rate CUTS a condition for his next Fed Chair pick. Now ask yourself—will Chair Warsh really hike rates in his first move after being hand-picked by Trump?
Political pressure matters. The market might be overestimating this one.
Watch the Fed's language closely. If they're softening the tone now, that's your signal. September might be a lot less hawkish than consensus thinks.
1
1
1.1k
The S&P is sitting just 2.5% off all-time highs while bonds are getting crushed. That's wild.
Strip out AI and the index would be half of where it is today. Seriously. The mega-cap tech names propped up by AI hype are doing all the heavy lifting.
Meanwhile, if oil hadn't spiked, we'd probably be looking at S&P 9,000+. Energy's been a drag.
Bottom line: AI isn't just a sector play anymore. It's the backbone holding up the entire market. One theme carrying everything else on its back.
That's your market in 2025. Narrow leadership, massive concentration risk, and a whole lot riding on whether AI can actually deliver on the promises.
The S&P is sitting just 2.5% off all-time highs while bonds are getting crushed. That's wild.
Strip out AI and the index would be half of where it is today. Seriously. The mega-cap tech names propped up by AI hype are doing all the heavy lifting.
Meanwhile, if oil hadn't spiked, we'd probably be looking at S&P 9,000+. Energy's been a drag.
Bottom line: AI isn't just a sector play anymore. It's the backbone holding up the entire market. One theme carrying everything else on its back.
That's your market in 2025. Narrow leadership, massive concentration risk, and a whole lot riding on whether AI can actually deliver on the promises.
Strip out AI and the index would be half of where it is today. Seriously. The mega-cap tech names propped up by AI hype are doing all the heavy lifting.
Meanwhile, if oil hadn't spiked, we'd probably be looking at S&P 9,000+. Energy's been a drag.
Bottom line: AI isn't just a sector play anymore. It's the backbone holding up the entire market. One theme carrying everything else on its back.
That's your market in 2025. Narrow leadership, massive concentration risk, and a whole lot riding on whether AI can actually deliver on the promises.
332
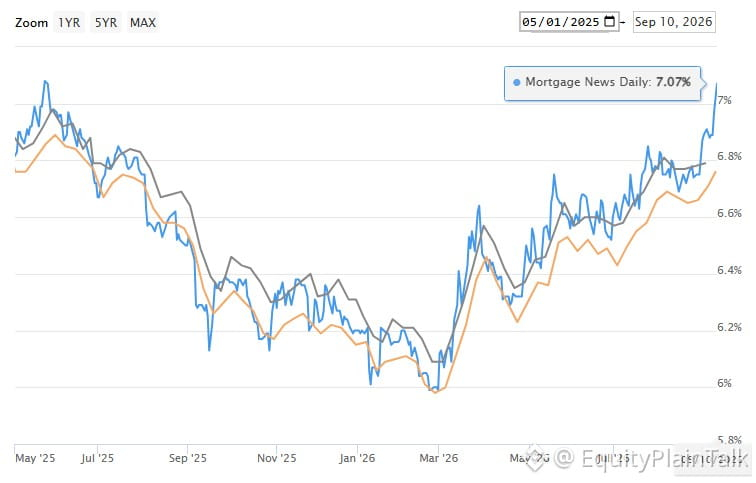
30-year mortgage rates just broke above 7% for the first time since May.
That's a psychological level that matters. When borrowing costs push higher, it directly hits housing affordability and buyer demand. Sellers who locked in 3-4% rates years ago have even less incentive to move now.
This creates a stalemate: inventory stays tight, prices stay sticky, and transaction volume dries up. The housing market isn't crashing—it's freezing.
For stocks, watch homebuilders, mortgage REITs, and anything tied to consumer discretionary spending. Higher rates mean less cash flow for households already stretched thin.
The Fed might be done hiking, but the lag effect is still working through the system. Housing is one of the last dominoes to feel it.
30-year mortgage rates just broke above 7% for the first time since May.
That's a psychological level that matters. When borrowing costs push higher, it directly hits housing affordability and buyer demand. Sellers who locked in 3-4% rates years ago have even less incentive to move now.
This creates a stalemate: inventory stays tight, prices stay sticky, and transaction volume dries up. The housing market isn't crashing—it's freezing.
For stocks, watch homebuilders, mortgage REITs, and anything tied to consumer discretionary spending. Higher rates mean less cash flow for households already stretched thin.
The Fed might be done hiking, but the lag effect is still working through the system. Housing is one of the last dominoes to feel it.
That's a psychological level that matters. When borrowing costs push higher, it directly hits housing affordability and buyer demand. Sellers who locked in 3-4% rates years ago have even less incentive to move now.
This creates a stalemate: inventory stays tight, prices stay sticky, and transaction volume dries up. The housing market isn't crashing—it's freezing.
For stocks, watch homebuilders, mortgage REITs, and anything tied to consumer discretionary spending. Higher rates mean less cash flow for households already stretched thin.
The Fed might be done hiking, but the lag effect is still working through the system. Housing is one of the last dominoes to feel it.
311
Partly True
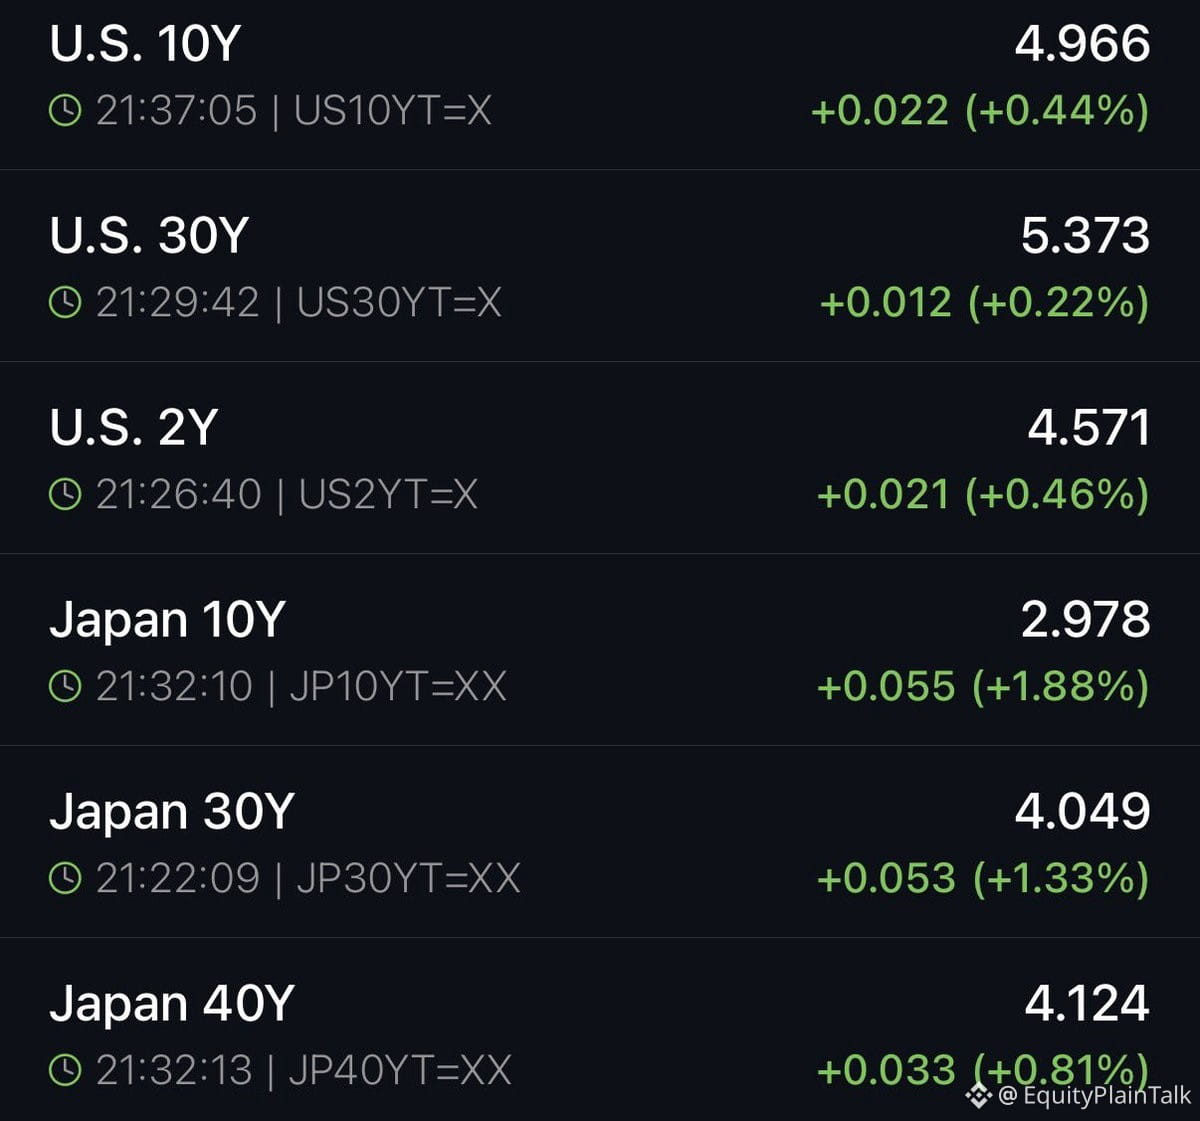
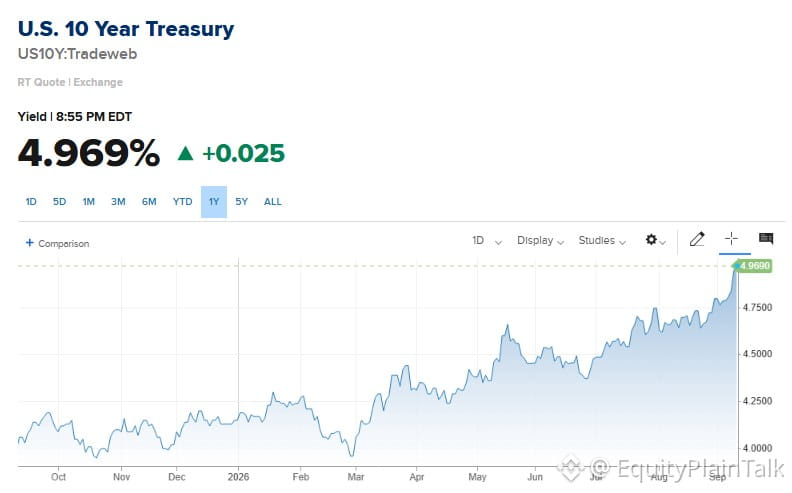
10-year Treasury yield creeping toward 5%. That's a level we haven't seen consistently since 2007.
When borrowing costs hit this range, it ripples everywhere—mortgages get more expensive, corporate debt refinancing becomes painful, and equity valuations start looking stretched. Growth stocks especially feel the pressure since their future cash flows get discounted more heavily.
Market's been pricing in higher-for-longer rates, but 5% is still a psychological threshold. If we break and hold above it, expect more rotation out of high-multiple names and into value plays that can handle the rate environment.
Watch how the next few Fed speakers frame this. They might be fine with it if inflation stays sticky, or they might hint at concern if financial conditions tighten too much too fast.
10-year Treasury yield creeping toward 5%. That's a level we haven't seen consistently since 2007.
When borrowing costs hit this range, it ripples everywhere—mortgages get more expensive, corporate debt refinancing becomes painful, and equity valuations start looking stretched. Growth stocks especially feel the pressure since their future cash flows get discounted more heavily.
Market's been pricing in higher-for-longer rates, but 5% is still a psychological threshold. If we break and hold above it, expect more rotation out of high-multiple names and into value plays that can handle the rate environment.
Watch how the next few Fed speakers frame this. They might be fine with it if inflation stays sticky, or they might hint at concern if financial conditions tighten too much too fast.
When borrowing costs hit this range, it ripples everywhere—mortgages get more expensive, corporate debt refinancing becomes painful, and equity valuations start looking stretched. Growth stocks especially feel the pressure since their future cash flows get discounted more heavily.
Market's been pricing in higher-for-longer rates, but 5% is still a psychological threshold. If we break and hold above it, expect more rotation out of high-multiple names and into value plays that can handle the rate environment.
Watch how the next few Fed speakers frame this. They might be fine with it if inflation stays sticky, or they might hint at concern if financial conditions tighten too much too fast.
1.2k
Diesel just crossed $6/gallon nationally for the first time ever. Up 74% in 9 months.
Some states are already pushing $8. Supply is tight, crude is near $105, and the Iran situation isn't helping.
This matters because diesel moves everything—trucks, trains, factories. When diesel spikes, inflation follows. Consumers feel it in food prices, shipping costs, and basically anything that needs to get from point A to point B.
Inflation expectations are ticking up again. The Fed's job just got harder. Watch transport stocks, energy names, and anything sensitive to input costs.
Diesel just crossed $6/gallon nationally for the first time ever. Up 74% in 9 months.
Some states are already pushing $8. Supply is tight, crude is near $105, and the Iran situation isn't helping.
This matters because diesel moves everything—trucks, trains, factories. When diesel spikes, inflation follows. Consumers feel it in food prices, shipping costs, and basically anything that needs to get from point A to point B.
Inflation expectations are ticking up again. The Fed's job just got harder. Watch transport stocks, energy names, and anything sensitive to input costs.
Some states are already pushing $8. Supply is tight, crude is near $105, and the Iran situation isn't helping.
This matters because diesel moves everything—trucks, trains, factories. When diesel spikes, inflation follows. Consumers feel it in food prices, shipping costs, and basically anything that needs to get from point A to point B.
Inflation expectations are ticking up again. The Fed's job just got harder. Watch transport stocks, energy names, and anything sensitive to input costs.
12
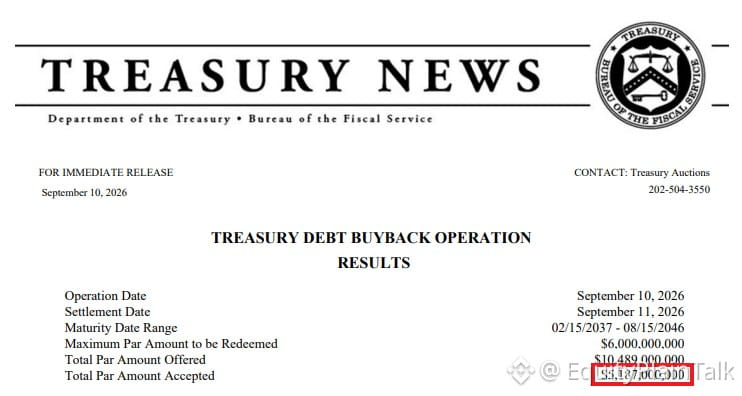
Treasury just bought back $5.18B of its own debt today. That's nearly $18B this week.
Context: These buybacks are part of Treasury's liquidity management program launched in 2024. They're targeting off-the-run securities to improve market functioning.
What it means: When Treasury buys back debt, it removes supply from the market. Less supply can push bond prices up (yields down), all else equal. It's also a sign they're managing the debt pile more actively.
The bigger picture: With $36T+ in total debt outstanding, $18B is a drop in the bucket. But the pace matters. If buybacks accelerate, it could provide modest support to bond prices and influence rate expectations.
Watch how this plays alongside Fed policy and deficit trajectory. Treasury buybacks + Fed QT = competing forces in the bond market right now.
Treasury just bought back $5.18B of its own debt today. That's nearly $18B this week.
Context: These buybacks are part of Treasury's liquidity management program launched in 2024. They're targeting off-the-run securities to improve market functioning.
What it means: When Treasury buys back debt, it removes supply from the market. Less supply can push bond prices up (yields down), all else equal. It's also a sign they're managing the debt pile more actively.
The bigger picture: With $36T+ in total debt outstanding, $18B is a drop in the bucket. But the pace matters. If buybacks accelerate, it could provide modest support to bond prices and influence rate expectations.
Watch how this plays alongside Fed policy and deficit trajectory. Treasury buybacks + Fed QT = competing forces in the bond market right now.
Context: These buybacks are part of Treasury's liquidity management program launched in 2024. They're targeting off-the-run securities to improve market functioning.
What it means: When Treasury buys back debt, it removes supply from the market. Less supply can push bond prices up (yields down), all else equal. It's also a sign they're managing the debt pile more actively.
The bigger picture: With $36T+ in total debt outstanding, $18B is a drop in the bucket. But the pace matters. If buybacks accelerate, it could provide modest support to bond prices and influence rate expectations.
Watch how this plays alongside Fed policy and deficit trajectory. Treasury buybacks + Fed QT = competing forces in the bond market right now.
96
Trump just floated $5,000 checks to every American adult if Republicans take the midterms. Says he doesn't need Congress to approve it.
That's roughly $1.3 trillion if you do the math on 260M adults. Where's it coming from? Tariffs? Spending cuts? Magic?
Markets love free money talk, but this is the kind of promise that either moves policy fast or dies in committee. Either way, watch how equities react to fiscal stimulus headlines over the next few months.
If this actually happens, consumer spending gets a jolt. If it doesn't, it's just campaign noise. Trade accordingly.
Trump just floated $5,000 checks to every American adult if Republicans take the midterms. Says he doesn't need Congress to approve it.
That's roughly $1.3 trillion if you do the math on 260M adults. Where's it coming from? Tariffs? Spending cuts? Magic?
Markets love free money talk, but this is the kind of promise that either moves policy fast or dies in committee. Either way, watch how equities react to fiscal stimulus headlines over the next few months.
If this actually happens, consumer spending gets a jolt. If it doesn't, it's just campaign noise. Trade accordingly.
That's roughly $1.3 trillion if you do the math on 260M adults. Where's it coming from? Tariffs? Spending cuts? Magic?
Markets love free money talk, but this is the kind of promise that either moves policy fast or dies in committee. Either way, watch how equities react to fiscal stimulus headlines over the next few months.
If this actually happens, consumer spending gets a jolt. If it doesn't, it's just campaign noise. Trade accordingly.
2
333
Fed hiking rates next week? That would be wild.
Market's priced in a hold or cut. A hike would flip everything—bonds, equities, the dollar. It'd signal inflation's still a real problem or the Fed sees something we don't.
Would I be mad? No. Surprised? Absolutely. Positioned for it? Probably not, and neither is most of the market.
That's the setup for serious volatility.
Fed hiking rates next week? That would be wild.
Market's priced in a hold or cut. A hike would flip everything—bonds, equities, the dollar. It'd signal inflation's still a real problem or the Fed sees something we don't.
Would I be mad? No. Surprised? Absolutely. Positioned for it? Probably not, and neither is most of the market.
That's the setup for serious volatility.
Market's priced in a hold or cut. A hike would flip everything—bonds, equities, the dollar. It'd signal inflation's still a real problem or the Fed sees something we don't.
Would I be mad? No. Surprised? Absolutely. Positioned for it? Probably not, and neither is most of the market.
That's the setup for serious volatility.
1
427
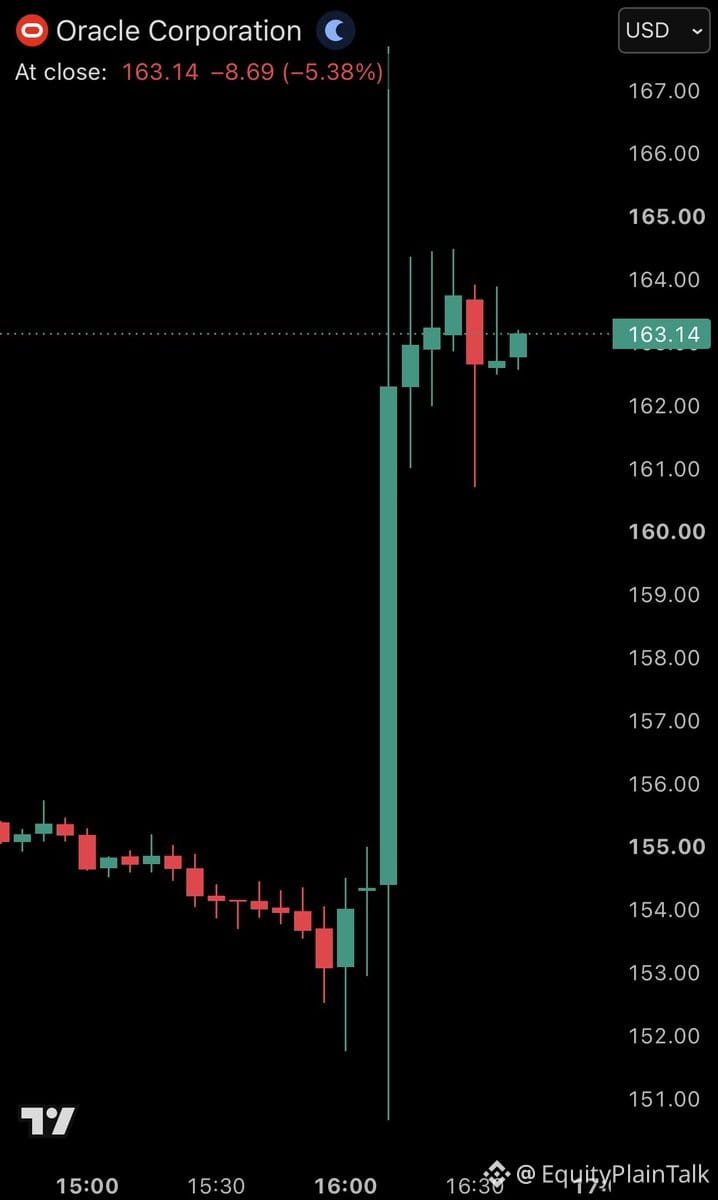
$ORCL just jumped 8%+ after earnings crushed expectations. The driver? AI demand.
Oracle's cloud infrastructure business is seeing serious momentum as companies rush to build out AI capabilities. When enterprise giants start beating because of AI infrastructure spend, it tells you something about where corporate budgets are flowing.
This isn't just an Oracle story. It's a data point on the broader AI buildout cycle. The companies selling picks and shovels to the AI gold rush keep printing money.
$ORCL just jumped 8%+ after earnings crushed expectations. The driver? AI demand.
Oracle's cloud infrastructure business is seeing serious momentum as companies rush to build out AI capabilities. When enterprise giants start beating because of AI infrastructure spend, it tells you something about where corporate budgets are flowing.
This isn't just an Oracle story. It's a data point on the broader AI buildout cycle. The companies selling picks and shovels to the AI gold rush keep printing money.
Oracle's cloud infrastructure business is seeing serious momentum as companies rush to build out AI capabilities. When enterprise giants start beating because of AI infrastructure spend, it tells you something about where corporate budgets are flowing.
This isn't just an Oracle story. It's a data point on the broader AI buildout cycle. The companies selling picks and shovels to the AI gold rush keep printing money.
81
Log in to explore more content
Join global crypto users on Binance Square
⚡️ Get latest and useful information about crypto.
💬 Trusted by the world’s largest crypto exchange.
👍 Discover real insights from verified creators.
Email / Phone number
Trending Topics
CPIWatch
86.5M views
501,358 Discussing
Share & Win Traffic Reward in our Trending Hashtag Campaign
✨Topic: Will CPI Trigger Rate Hike?
👉How to Join:
Publish a short post or article with hashtag #CPIWatch
Create content based on the below two angles:
- Nonfarm payrolls beat expectations and CPI is around the corner, do you think the Fed will hike or hold the rate?
- Bullish or bearish? Share your take and showcase your stocks or gold trade/holdings with our trade sharing widget.
🚀Campaign Period:
- 2026-09-11 3:00 - 2026-09-12 9:00 UTC
🎁Reward:
- Qualified posts that comply with the above guidelines and contain more than 100 words will be reviewed and may receive a random traffic boost of 500 to 3,000 views. You will receive a notification from your feed secretary if your post is selected.
- Get a chance to have your article featured on Binance Square Official
Need ideas for your post? Visit the topic page #CPIWatch or the Square Guide on How to Post for Better Reach.
Binance Square Official
·438 Likes
·983.8k views
BitcoinReboundsAbove$79KAfterCPI
1 views
6 Discussing
BNBTops730USDT
582 views
121 Discussing