
王子路
668 Posts

王子路
Report
Block User
Web3工程师/架构师 帮200项目从0到DEX/链游上线 合约安全Gas优化。每日分享开发干货 市场观察 一起少走弯路,公众号:Crypto DAO投研院
Frequent Trader
4.1 Years
45 Following
579 Followers
495 Liked
Posts
All
Quotes
PINNED
·
--
🚀 The Binance chat room has launched the 【private chat】 feature!
From now on, communication will be smoother, and you won't have to worry about messages being lost!
1. Enter 【chat room】 in the search bar to find the entrance
2. Click “➕” in the upper right corner to add friends
3. Enter your Binance ID 【for example, mine is: 487894105】
4. One-click search 🔍 and you can add me~
Family, first add me, then we can communicate directly about real market policies and upcoming trends and opportunities!
🚀 The Binance chat room has launched the 【private chat】 feature!
From now on, communication will be smoother, and you won't have to worry about messages being lost!
1. Enter 【chat room】 in the search bar to find the entrance
2. Click “➕” in the upper right corner to add friends
3. Enter your Binance ID 【for example, mine is: 487894105】
4. One-click search 🔍 and you can add me~
Family, first add me, then we can communicate directly about real market policies and upcoming trends and opportunities!
🚀 The Binance chat room has launched the 【private chat】 feature!
From now on, communication will be smoother, and you won't have to worry about messages being lost!
1. Enter 【chat room】 in the search bar to find the entrance
2. Click “➕” in the upper right corner to add friends
3. Enter your Binance ID 【for example, mine is: 487894105】
4. One-click search 🔍 and you can add me~
Family, first add me, then we can communicate directly about real market policies and upcoming trends and opportunities!



1
1
77
·
--
Bullish
230
·
--
Bearish
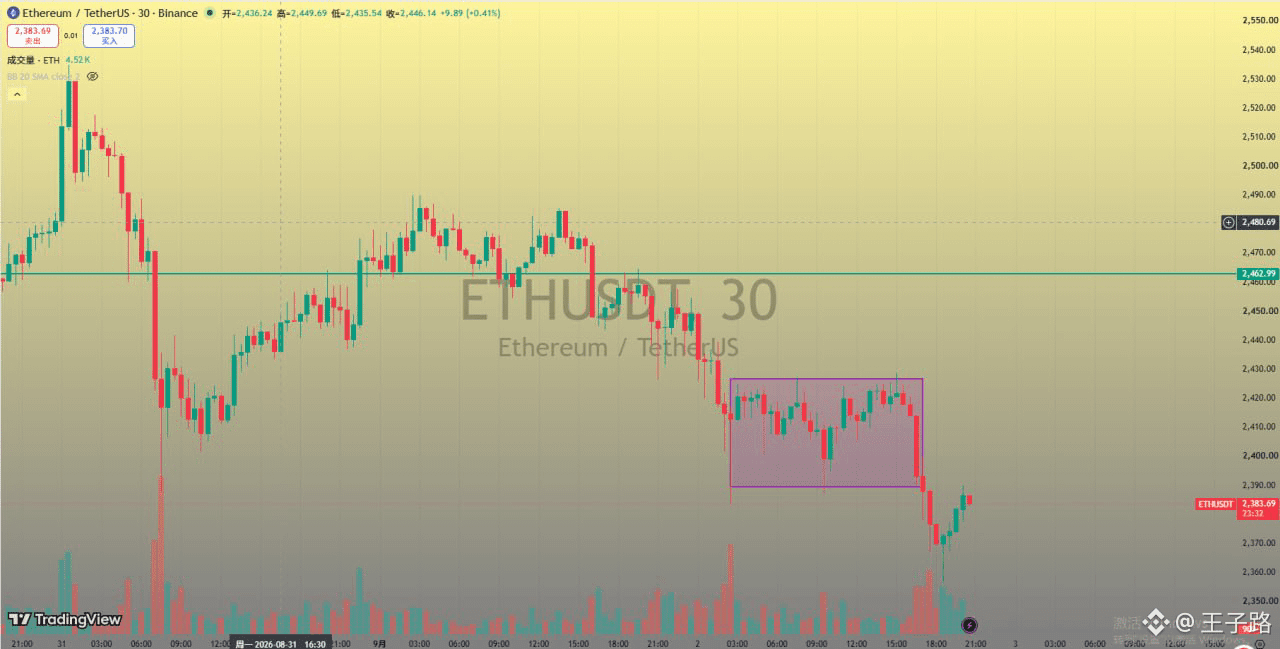
ETH 30-minute current structure
Now the price is around 2387. The most important thing about this chart isn’t “how much it fell,” but rather:
ETH has just broken downward out of a range that had been consolidating. It is now making its first rebound after the break.
The purple area in the chart is roughly: 2390 to 2427.
ETH traded sideways within this range for quite a while.
Then a clearly large-volume bearish candle appeared:
Breaking below 2390 → the low reached about 2368 to 2370 → now it has rebounded back to around 2387.
This is a fairly typical pattern of:
breakout from a box range → panic/stop-losses → a quick rebound.
So you can’t simply interpret it as “it already fell enough, so you should buy the dip right away.”
The first resistance now is: 2390 to 2400.
This is the position I’m paying the most attention to right now.
The original lower boundary of the box range is around 2390.
Now the price has rebounded from around 2370 to about 2387—it's already very close to that level.
What used to be support is now resistance:
Before, 2390 was the “floor.” Now that it has been broken, that floor may turn into a “ceiling.”
So the next step is crucial:
If the rebound reaches 2390 to 2400:
If it can’t get back above it → the bears still have the advantage.
If it shows something like:
Reaching around 2390
A clearly visible upper shadow (long upper wick)
Several consecutive 30-minute candlesticks failing to stand above it
Volume increases but the price can’t move up
That would be a very clear sign that the rebound is running into resistance.$ETH
ETH 30-minute current structure
Now the price is around 2387. The most important thing about this chart isn’t “how much it fell,” but rather:
ETH has just broken downward out of a range that had been consolidating. It is now making its first rebound after the break.
The purple area in the chart is roughly: 2390 to 2427.
ETH traded sideways within this range for quite a while.
Then a clearly large-volume bearish candle appeared:
Breaking below 2390 → the low reached about 2368 to 2370 → now it has rebounded back to around 2387.
This is a fairly typical pattern of:
breakout from a box range → panic/stop-losses → a quick rebound.
So you can’t simply interpret it as “it already fell enough, so you should buy the dip right away.”
The first resistance now is: 2390 to 2400.
This is the position I’m paying the most attention to right now.
The original lower boundary of the box range is around 2390.
Now the price has rebounded from around 2370 to about 2387—it's already very close to that level.
What used to be support is now resistance:
Before, 2390 was the “floor.” Now that it has been broken, that floor may turn into a “ceiling.”
So the next step is crucial:
If the rebound reaches 2390 to 2400:
If it can’t get back above it → the bears still have the advantage.
If it shows something like:
Reaching around 2390
A clearly visible upper shadow (long upper wick)
Several consecutive 30-minute candlesticks failing to stand above it
Volume increases but the price can’t move up
That would be a very clear sign that the rebound is running into resistance.$ETH
Now the price is around 2387. The most important thing about this chart isn’t “how much it fell,” but rather:
ETH has just broken downward out of a range that had been consolidating. It is now making its first rebound after the break.
The purple area in the chart is roughly: 2390 to 2427.
ETH traded sideways within this range for quite a while.
Then a clearly large-volume bearish candle appeared:
Breaking below 2390 → the low reached about 2368 to 2370 → now it has rebounded back to around 2387.
This is a fairly typical pattern of:
breakout from a box range → panic/stop-losses → a quick rebound.
So you can’t simply interpret it as “it already fell enough, so you should buy the dip right away.”
The first resistance now is: 2390 to 2400.
This is the position I’m paying the most attention to right now.
The original lower boundary of the box range is around 2390.
Now the price has rebounded from around 2370 to about 2387—it's already very close to that level.
What used to be support is now resistance:
Before, 2390 was the “floor.” Now that it has been broken, that floor may turn into a “ceiling.”
So the next step is crucial:
If the rebound reaches 2390 to 2400:
If it can’t get back above it → the bears still have the advantage.
If it shows something like:
Reaching around 2390
A clearly visible upper shadow (long upper wick)
Several consecutive 30-minute candlesticks failing to stand above it
Volume increases but the price can’t move up
That would be a very clear sign that the rebound is running into resistance.$ETH
1.8k
·
--
Bearish
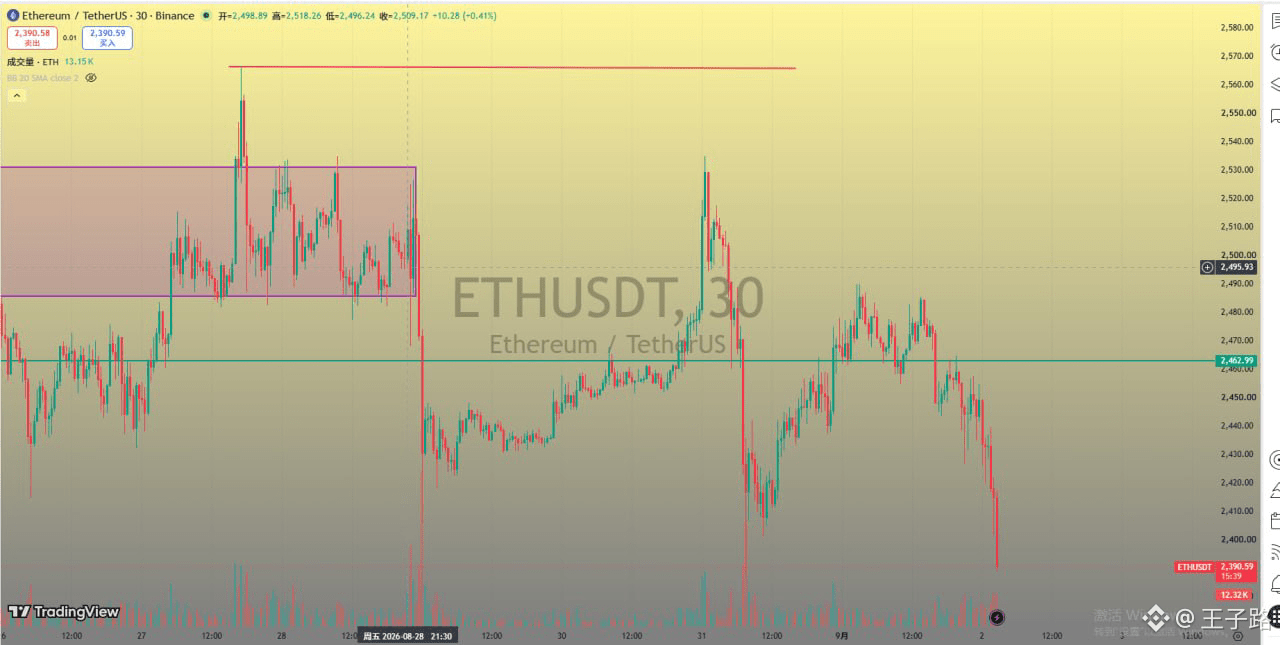
ETH breaks below 2400; this pullback is probably headed toward 2100 next. #eth $ETH
ETH breaks below 2400; this pullback is probably headed toward 2100 next. #eth $ETH
王子路
·
--
BearishNo breakthrough at 2490, and then it started killing again. We'll see if 2460 can hold this rebound failure; we may continue to probe down to 2400! $ETH
1
256
·
--
Bearish
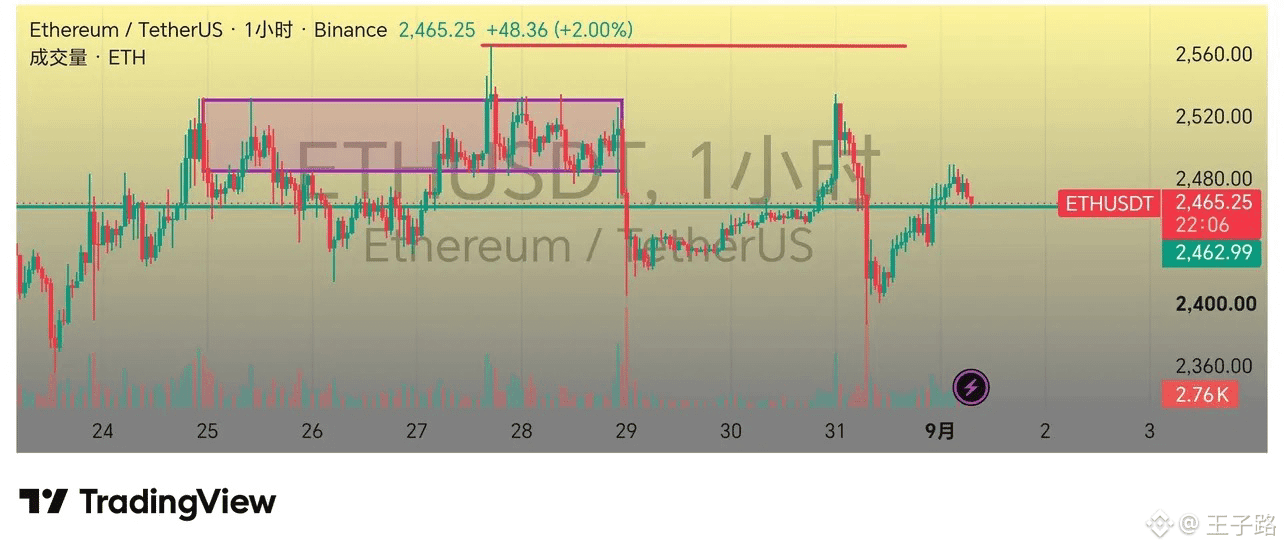
No breakthrough at 2490, and then it started killing again. We'll see if 2460 can hold this rebound failure; we may continue to probe down to 2400! $ETH
No breakthrough at 2490, and then it started killing again. We'll see if 2460 can hold this rebound failure; we may continue to probe down to 2400! $ETH
1
222
·
--
Bullish
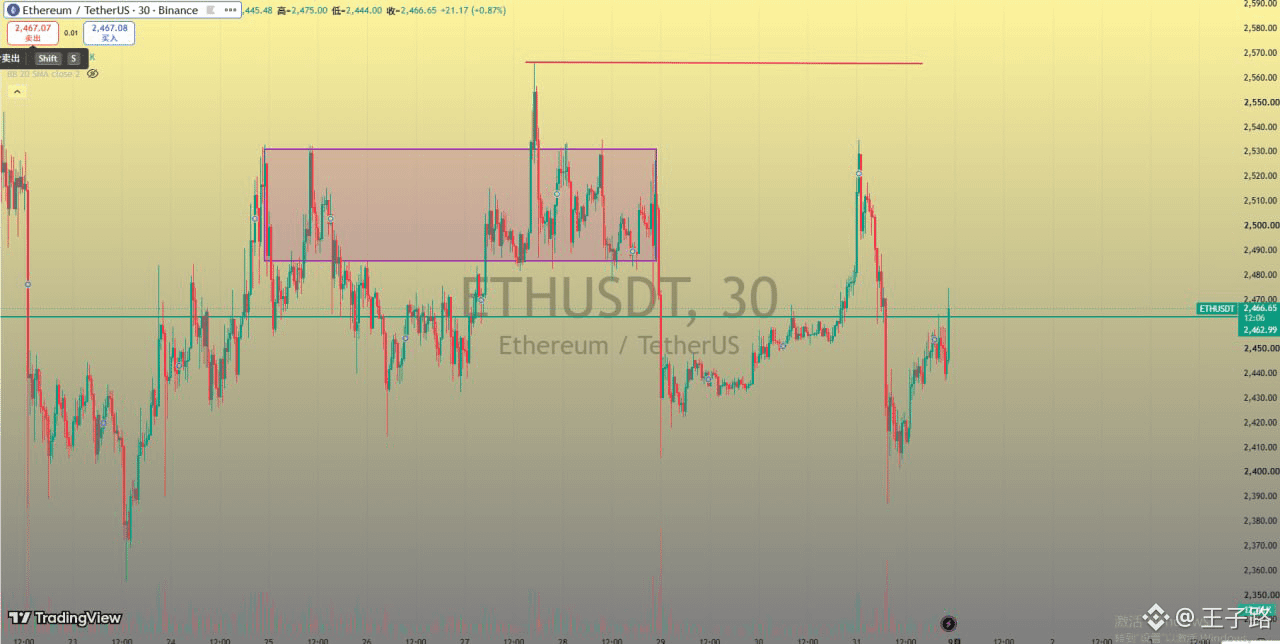
My current assessment of ETH on the 30-minute timeframe is:
Short term: In a rebound phase, with a slightly bullish correction bias.
Structure: It hasn’t fully turned strong again.
The area around 2470 is in a middle zone—it’s not the most ideal spot to chase longs.
What truly determines the next leg is these levels: 2460, 2490, and 2530.
In simple terms:
🟢 Break above 2490 and hold
Then the price action will continue higher to test:
2500 → 2520 → 2530
If 2530 is also effectively broken through by a 30-minute candlestick body, then only then will it truly open up:
2560~2567
range.
Right now, we are in a very typical stage:
a confirmation rebound after a sharp sell-off.
So what we should really watch now is:
Can 2460 hold?
Then:
Can 2490 break through?
Finally:
Can 2530 break through?
If these three levels play out in order as:
2460 holds → 2490 breaks → 2530 breaks
Then ETH’s short-term structure will clearly strengthen, and the prior high at 2566 will come back into view.
On the other hand:
2460 breaks down → 2440 breaks down → 2400 breaks down
Then this rebound will most likely be only a technical bounce within a broader downtrend.
As for the area around 2470, personally, I wouldn’t define it as the best entry point to chase a position. The most valuable approach is to wait until the price gets close to the key levels, then see whether it chooses to break out or gets pushed back down.$ETH
My current assessment of ETH on the 30-minute timeframe is:
Short term: In a rebound phase, with a slightly bullish correction bias.
Structure: It hasn’t fully turned strong again.
The area around 2470 is in a middle zone—it’s not the most ideal spot to chase longs.
What truly determines the next leg is these levels: 2460, 2490, and 2530.
In simple terms:
🟢 Break above 2490 and hold
Then the price action will continue higher to test:
2500 → 2520 → 2530
If 2530 is also effectively broken through by a 30-minute candlestick body, then only then will it truly open up:
2560~2567
range.
Right now, we are in a very typical stage:
a confirmation rebound after a sharp sell-off.
So what we should really watch now is:
Can 2460 hold?
Then:
Can 2490 break through?
Finally:
Can 2530 break through?
If these three levels play out in order as:
2460 holds → 2490 breaks → 2530 breaks
Then ETH’s short-term structure will clearly strengthen, and the prior high at 2566 will come back into view.
On the other hand:
2460 breaks down → 2440 breaks down → 2400 breaks down
Then this rebound will most likely be only a technical bounce within a broader downtrend.
As for the area around 2470, personally, I wouldn’t define it as the best entry point to chase a position. The most valuable approach is to wait until the price gets close to the key levels, then see whether it chooses to break out or gets pushed back down.$ETH
Short term: In a rebound phase, with a slightly bullish correction bias.
Structure: It hasn’t fully turned strong again.
The area around 2470 is in a middle zone—it’s not the most ideal spot to chase longs.
What truly determines the next leg is these levels: 2460, 2490, and 2530.
In simple terms:
🟢 Break above 2490 and hold
Then the price action will continue higher to test:
2500 → 2520 → 2530
If 2530 is also effectively broken through by a 30-minute candlestick body, then only then will it truly open up:
2560~2567
range.
Right now, we are in a very typical stage:
a confirmation rebound after a sharp sell-off.
So what we should really watch now is:
Can 2460 hold?
Then:
Can 2490 break through?
Finally:
Can 2530 break through?
If these three levels play out in order as:
2460 holds → 2490 breaks → 2530 breaks
Then ETH’s short-term structure will clearly strengthen, and the prior high at 2566 will come back into view.
On the other hand:
2460 breaks down → 2440 breaks down → 2400 breaks down
Then this rebound will most likely be only a technical bounce within a broader downtrend.
As for the area around 2470, personally, I wouldn’t define it as the best entry point to chase a position. The most valuable approach is to wait until the price gets close to the key levels, then see whether it chooses to break out or gets pushed back down.$ETH
416
·
--
Bullish
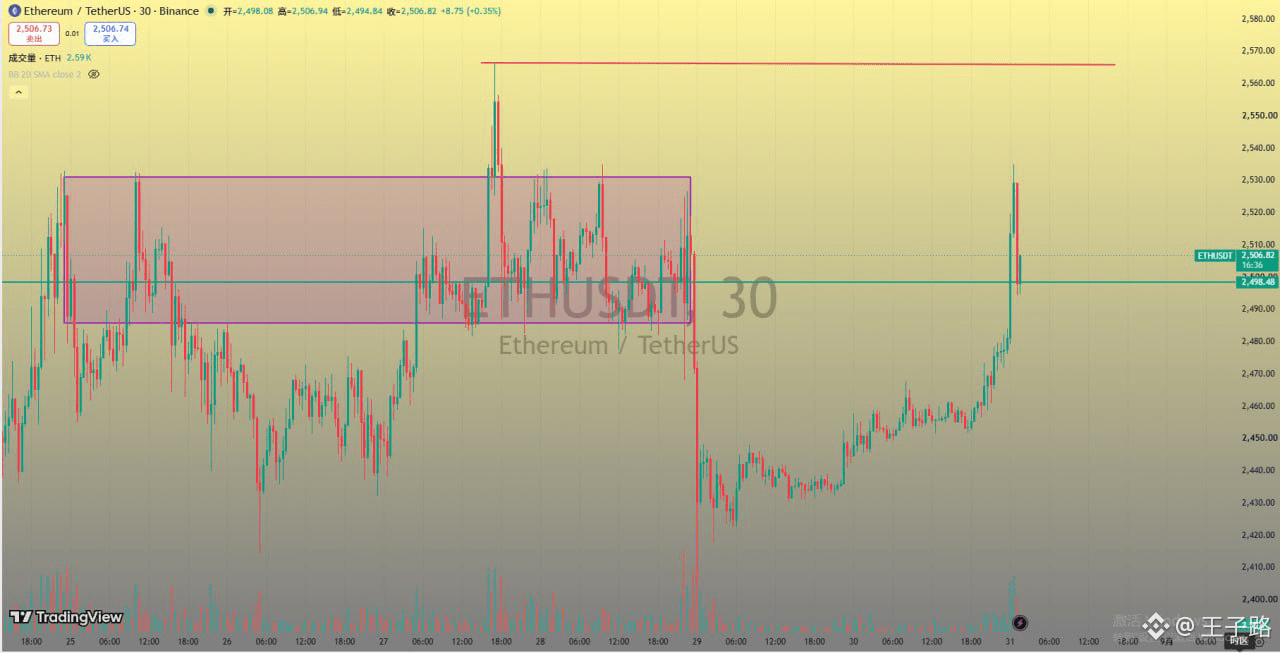
ETH 30 minutes: latest market overview
Current price is approximately:
2505
The most obvious structure on the chart is:
ETH has already broken above the upper boundary of the prior consolidation range, but immediately after the breakout it saw a sharp rise followed by a pullback. Now it is testing whether the breakout is valid.
This is the most critical point right now.
Around 2500 is very important (the green horizontal line on the chart).
This level is crucial right now.
Because just moments ago, the price:
rose to around 2530
then:
fell to 2494
and now it is back to:
2505
That means the market is testing whether:
2500 can turn from “resistance” into “support.”
This is called:
resistance → support conversion
If the next 30-minute candlestick can hold steady above 2500, then the structure will become increasingly beautiful.
Can 2500 hold? + Can 2530 break out again with increased volume?
If:
2500 holds → 2530 breaks through again → the previous high at 2566
then the bullish structure will become more and more complete.
If:
2500 fails → it breaks below 2487 again
then the breakout we just saw should be watched carefully, because it could turn into a false breakout. #ETH $ETH
ETH 30 minutes: latest market overview
Current price is approximately:
2505
The most obvious structure on the chart is:
ETH has already broken above the upper boundary of the prior consolidation range, but immediately after the breakout it saw a sharp rise followed by a pullback. Now it is testing whether the breakout is valid.
This is the most critical point right now.
Around 2500 is very important (the green horizontal line on the chart).
This level is crucial right now.
Because just moments ago, the price:
rose to around 2530
then:
fell to 2494
and now it is back to:
2505
That means the market is testing whether:
2500 can turn from “resistance” into “support.”
This is called:
resistance → support conversion
If the next 30-minute candlestick can hold steady above 2500, then the structure will become increasingly beautiful.
Can 2500 hold? + Can 2530 break out again with increased volume?
If:
2500 holds → 2530 breaks through again → the previous high at 2566
then the bullish structure will become more and more complete.
If:
2500 fails → it breaks below 2487 again
then the breakout we just saw should be watched carefully, because it could turn into a false breakout. #ETH $ETH
Current price is approximately:
2505
The most obvious structure on the chart is:
ETH has already broken above the upper boundary of the prior consolidation range, but immediately after the breakout it saw a sharp rise followed by a pullback. Now it is testing whether the breakout is valid.
This is the most critical point right now.
Around 2500 is very important (the green horizontal line on the chart).
This level is crucial right now.
Because just moments ago, the price:
rose to around 2530
then:
fell to 2494
and now it is back to:
2505
That means the market is testing whether:
2500 can turn from “resistance” into “support.”
This is called:
resistance → support conversion
If the next 30-minute candlestick can hold steady above 2500, then the structure will become increasingly beautiful.
Can 2500 hold? + Can 2530 break out again with increased volume?
If:
2500 holds → 2530 breaks through again → the previous high at 2566
then the bullish structure will become more and more complete.
If:
2500 fails → it breaks below 2487 again
then the breakout we just saw should be watched carefully, because it could turn into a false breakout. #ETH $ETH
2
1.4k
·
--
Bullish
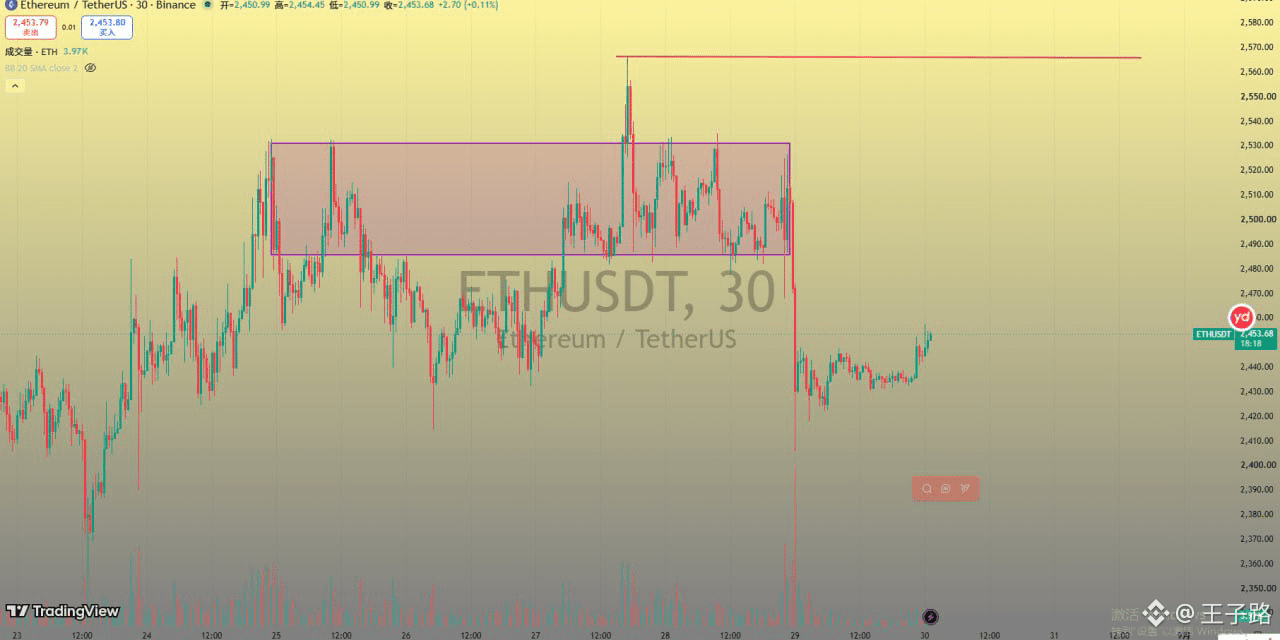
ETH rose steadily from around 2270, reaching a high of:
2566.57
This is a very clear upward move.
But after it reached around 2566, it didn’t continue to break through. Instead, it kept ranging and oscillating between 2500 and 2560.
Then:
2566 → 2520 → 2480 → around 2430
there was a fairly noticeable pullback.
So now you can’t simply understand it as “ETH is still wildly rallying.”
More accurately:
The larger trend was upward at the beginning, and now it’s entering the correction phase after the rally.
On this 30-minute chart, you can see that:
After ETH quickly dropped from above 2500, it began to trade sideways around:
2420–2440.
In other words:
The sellers pushed the price down, but when it got near 2420, the force to keep dumping started to weaken.
This is a positive sign.
However, pay attention:
“Can’t fall further” does not mean “will rise immediately.”
That’s the most common mistake beginners make.
At the moment, we can only say:
The bears haven’t yet continued to clearly expand their advantage.
We still can’t say that:
The bulls have already regained control of the market.
Where does the next upward move need to break?
I will divide the current overhead area into three levels.
First resistance: 2450
This is the most recent short-term resistance.
If ETH can get back above 2450, it would indicate that:
A short-term rebound has started.
Second resistance: 2475
This is the level I’m watching most right now.
You can think of it as:
the short-term long/short line in the sand.
If the price only does:
2430 → 2450 → then falls back again,
it would still count as a weak rebound.
But if it happens:
2430 → 2450 → 2475 → breakout on volume,
then it’s different.
At that point, it would mean:
the bulls are starting to take back short-term control.
Third resistance: 2500
If 2475 can hold, then the next level to watch would be:
around 2500.
2500 is a very obvious integer psychological level, and it’s also within the prior consolidation zone.
If 2500 breaks, the price will move back toward:
2520–2540,
and finally we’ll look again at:
the previous high 2566 $ETH
ETH rose steadily from around 2270, reaching a high of:
2566.57
This is a very clear upward move.
But after it reached around 2566, it didn’t continue to break through. Instead, it kept ranging and oscillating between 2500 and 2560.
Then:
2566 → 2520 → 2480 → around 2430
there was a fairly noticeable pullback.
So now you can’t simply understand it as “ETH is still wildly rallying.”
More accurately:
The larger trend was upward at the beginning, and now it’s entering the correction phase after the rally.
On this 30-minute chart, you can see that:
After ETH quickly dropped from above 2500, it began to trade sideways around:
2420–2440.
In other words:
The sellers pushed the price down, but when it got near 2420, the force to keep dumping started to weaken.
This is a positive sign.
However, pay attention:
“Can’t fall further” does not mean “will rise immediately.”
That’s the most common mistake beginners make.
At the moment, we can only say:
The bears haven’t yet continued to clearly expand their advantage.
We still can’t say that:
The bulls have already regained control of the market.
Where does the next upward move need to break?
I will divide the current overhead area into three levels.
First resistance: 2450
This is the most recent short-term resistance.
If ETH can get back above 2450, it would indicate that:
A short-term rebound has started.
Second resistance: 2475
This is the level I’m watching most right now.
You can think of it as:
the short-term long/short line in the sand.
If the price only does:
2430 → 2450 → then falls back again,
it would still count as a weak rebound.
But if it happens:
2430 → 2450 → 2475 → breakout on volume,
then it’s different.
At that point, it would mean:
the bulls are starting to take back short-term control.
Third resistance: 2500
If 2475 can hold, then the next level to watch would be:
around 2500.
2500 is a very obvious integer psychological level, and it’s also within the prior consolidation zone.
If 2500 breaks, the price will move back toward:
2520–2540,
and finally we’ll look again at:
the previous high 2566 $ETH
2566.57
This is a very clear upward move.
But after it reached around 2566, it didn’t continue to break through. Instead, it kept ranging and oscillating between 2500 and 2560.
Then:
2566 → 2520 → 2480 → around 2430
there was a fairly noticeable pullback.
So now you can’t simply understand it as “ETH is still wildly rallying.”
More accurately:
The larger trend was upward at the beginning, and now it’s entering the correction phase after the rally.
On this 30-minute chart, you can see that:
After ETH quickly dropped from above 2500, it began to trade sideways around:
2420–2440.
In other words:
The sellers pushed the price down, but when it got near 2420, the force to keep dumping started to weaken.
This is a positive sign.
However, pay attention:
“Can’t fall further” does not mean “will rise immediately.”
That’s the most common mistake beginners make.
At the moment, we can only say:
The bears haven’t yet continued to clearly expand their advantage.
We still can’t say that:
The bulls have already regained control of the market.
Where does the next upward move need to break?
I will divide the current overhead area into three levels.
First resistance: 2450
This is the most recent short-term resistance.
If ETH can get back above 2450, it would indicate that:
A short-term rebound has started.
Second resistance: 2475
This is the level I’m watching most right now.
You can think of it as:
the short-term long/short line in the sand.
If the price only does:
2430 → 2450 → then falls back again,
it would still count as a weak rebound.
But if it happens:
2430 → 2450 → 2475 → breakout on volume,
then it’s different.
At that point, it would mean:
the bulls are starting to take back short-term control.
Third resistance: 2500
If 2475 can hold, then the next level to watch would be:
around 2500.
2500 is a very obvious integer psychological level, and it’s also within the prior consolidation zone.
If 2500 breaks, the price will move back toward:
2520–2540,
and finally we’ll look again at:
the previous high 2566 $ETH
1
1.6k
·
--
Bullish
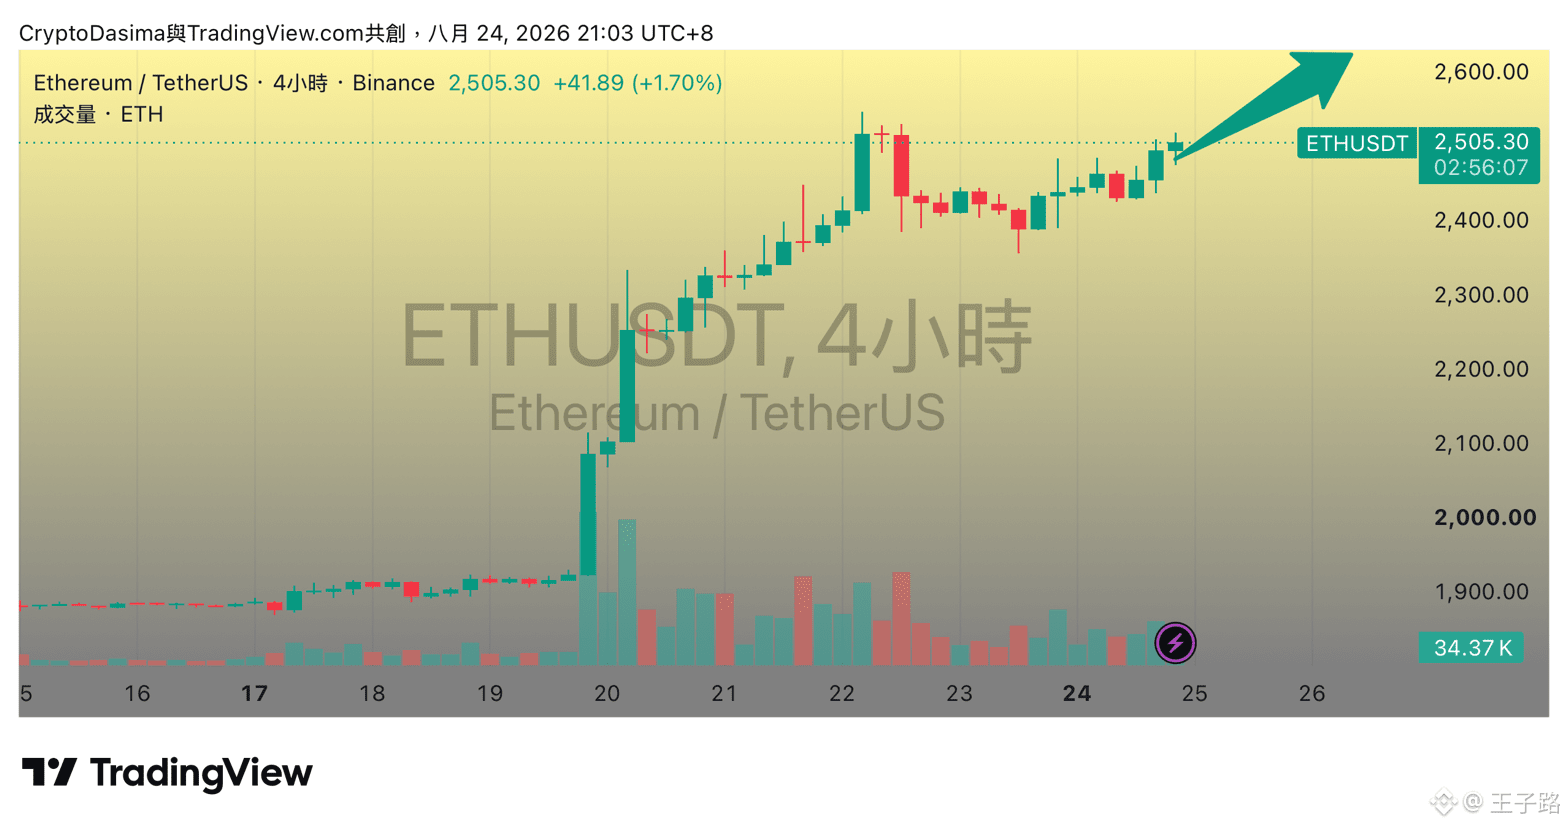
$ETH Ethereum starts sprinting toward 2600!
{future}(ETHUSDT)
$ETH Ethereum starts sprinting toward 2600!
王子路
·
--
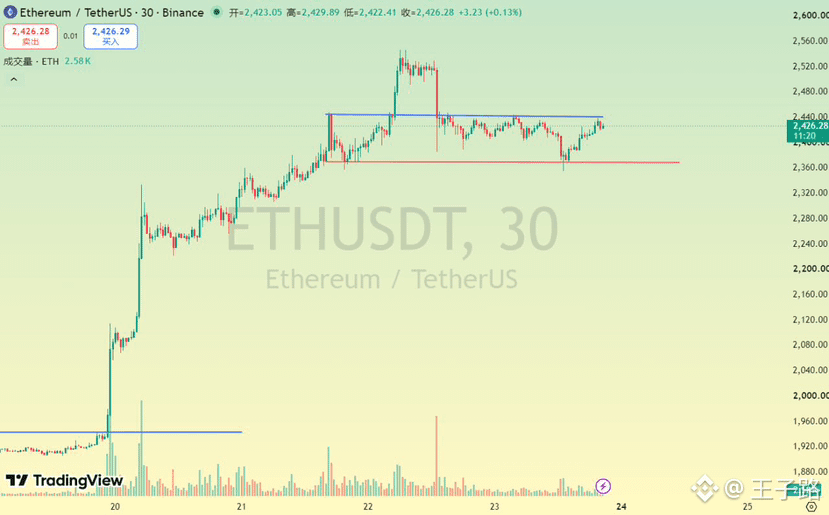
BullishETH’s current trend is a “sideways consolidation after an uptrend”:
From around 2200 it kept rising and quickly surged to about 2520, then a large bearish candle pulled back. Now it’s trading in a range of 2400–2450.
This structure is very typical:
sharp rise → profit-taking → sideways consolidation → then a choice of direction.
So far, there’s no clear breakdown:
✅ Lows: Around 2370 there’s support. After the price retested it, it quickly rebounded.
✅ Highs: The 2440–2450 area has been tested multiple times. Note: sell orders are above, but there are also buy orders absorbing below.
In reality, the 2440–2450 zone has three overlapping resistance layers:
① The top of the prior sideways range
The blue line corresponds to the top of the earlier consolidation area.
After the first breakout attempt fails, price is likely to come back to retest.
② Psychological integer levels
Before 2500:
Around 2450 is the key level that longs must break.
Many:
short-term long positions take profit here, and short sellers’ orders are also likely clustered here.
③ Trapped positions
Those who chased in near 2500:
when the bounce returns here, they will likely choose to sell.
So the resistance here is naturally heavy.
Looking at volume:
When price broke above 2500 on the upside, volume expanded noticeably.
But now, when it rebounds back to 2440, the volume has clearly shrunk.
This suggests that the current rise is more about: short covering + bargain-hunting support,
not yet very strong new incremental capital entering.
If you want an effective breakout, you need:
volume expansion and a bullish candle body breaking above 2450.
The next pullback only counts as confirmation if it does not drop back below 2430.
Key price levels
Long (bullish) zone
First support:
2400—hold it and the structure remains healthy.
Second support:
2360–2380—this is very important (the red line in the chart). A break below means the 4H uptrend rhythm has been disrupted.
Resistance:
First resistance:
2445–2450 (blue line in the chart).
Second resistance:
2500–2520, the prior highs.
Break above 2520: opens up upside room.
Targets: around 2600, and even 2750. $ETH
From around 2200 it kept rising and quickly surged to about 2520, then a large bearish candle pulled back. Now it’s trading in a range of 2400–2450.
This structure is very typical:
sharp rise → profit-taking → sideways consolidation → then a choice of direction.
So far, there’s no clear breakdown:
✅ Lows: Around 2370 there’s support. After the price retested it, it quickly rebounded.
✅ Highs: The 2440–2450 area has been tested multiple times. Note: sell orders are above, but there are also buy orders absorbing below.
In reality, the 2440–2450 zone has three overlapping resistance layers:
① The top of the prior sideways range
The blue line corresponds to the top of the earlier consolidation area.
After the first breakout attempt fails, price is likely to come back to retest.
② Psychological integer levels
Before 2500:
Around 2450 is the key level that longs must break.
Many:
short-term long positions take profit here, and short sellers’ orders are also likely clustered here.
③ Trapped positions
Those who chased in near 2500:
when the bounce returns here, they will likely choose to sell.
So the resistance here is naturally heavy.
Looking at volume:
When price broke above 2500 on the upside, volume expanded noticeably.
But now, when it rebounds back to 2440, the volume has clearly shrunk.
This suggests that the current rise is more about: short covering + bargain-hunting support,
not yet very strong new incremental capital entering.
If you want an effective breakout, you need:
volume expansion and a bullish candle body breaking above 2450.
The next pullback only counts as confirmation if it does not drop back below 2430.
Key price levels
Long (bullish) zone
First support:
2400—hold it and the structure remains healthy.
Second support:
2360–2380—this is very important (the red line in the chart). A break below means the 4H uptrend rhythm has been disrupted.
Resistance:
First resistance:
2445–2450 (blue line in the chart).
Second resistance:
2500–2520, the prior highs.
Break above 2520: opens up upside room.
Targets: around 2600, and even 2750. $ETH
113
·
--
Bullish
ETH’s current trend is a “sideways consolidation after an uptrend”:
From around 2200 it kept rising and quickly surged to about 2520, then a large bearish candle pulled back. Now it’s trading in a range of 2400–2450.
This structure is very typical:
sharp rise → profit-taking → sideways consolidation → then a choice of direction.
So far, there’s no clear breakdown:
✅ Lows: Around 2370 there’s support. After the price retested it, it quickly rebounded.
✅ Highs: The 2440–2450 area has been tested multiple times. Note: sell orders are above, but there are also buy orders absorbing below.
In reality, the 2440–2450 zone has three overlapping resistance layers:
① The top of the prior sideways range
The blue line corresponds to the top of the earlier consolidation area.
After the first breakout attempt fails, price is likely to come back to retest.
② Psychological integer levels
Before 2500:
Around 2450 is the key level that longs must break.
Many:
short-term long positions take profit here, and short sellers’ orders are also likely clustered here.
③ Trapped positions
Those who chased in near 2500:
when the bounce returns here, they will likely choose to sell.
So the resistance here is naturally heavy.
Looking at volume:
When price broke above 2500 on the upside, volume expanded noticeably.
But now, when it rebounds back to 2440, the volume has clearly shrunk.
This suggests that the current rise is more about: short covering + bargain-hunting support,
not yet very strong new incremental capital entering.
If you want an effective breakout, you need:
volume expansion and a bullish candle body breaking above 2450.
The next pullback only counts as confirmation if it does not drop back below 2430.
Key price levels
Long (bullish) zone
First support:
2400—hold it and the structure remains healthy.
Second support:
2360–2380—this is very important (the red line in the chart). A break below means the 4H uptrend rhythm has been disrupted.
Resistance:
First resistance:
2445–2450 (blue line in the chart).
Second resistance:
2500–2520, the prior highs.
Break above 2520: opens up upside room.
Targets: around 2600, and even 2750. $ETH
{future}(ETHUSDT)
ETH’s current trend is a “sideways consolidation after an uptrend”:
From around 2200 it kept rising and quickly surged to about 2520, then a large bearish candle pulled back. Now it’s trading in a range of 2400–2450.
This structure is very typical:
sharp rise → profit-taking → sideways consolidation → then a choice of direction.
So far, there’s no clear breakdown:
✅ Lows: Around 2370 there’s support. After the price retested it, it quickly rebounded.
✅ Highs: The 2440–2450 area has been tested multiple times. Note: sell orders are above, but there are also buy orders absorbing below.
In reality, the 2440–2450 zone has three overlapping resistance layers:
① The top of the prior sideways range
The blue line corresponds to the top of the earlier consolidation area.
After the first breakout attempt fails, price is likely to come back to retest.
② Psychological integer levels
Before 2500:
Around 2450 is the key level that longs must break.
Many:
short-term long positions take profit here, and short sellers’ orders are also likely clustered here.
③ Trapped positions
Those who chased in near 2500:
when the bounce returns here, they will likely choose to sell.
So the resistance here is naturally heavy.
Looking at volume:
When price broke above 2500 on the upside, volume expanded noticeably.
But now, when it rebounds back to 2440, the volume has clearly shrunk.
This suggests that the current rise is more about: short covering + bargain-hunting support,
not yet very strong new incremental capital entering.
If you want an effective breakout, you need:
volume expansion and a bullish candle body breaking above 2450.
The next pullback only counts as confirmation if it does not drop back below 2430.
Key price levels
Long (bullish) zone
First support:
2400—hold it and the structure remains healthy.
Second support:
2360–2380—this is very important (the red line in the chart). A break below means the 4H uptrend rhythm has been disrupted.
Resistance:
First resistance:
2445–2450 (blue line in the chart).
Second resistance:
2500–2520, the prior highs.
Break above 2520: opens up upside room.
Targets: around 2600, and even 2750. $ETH
From around 2200 it kept rising and quickly surged to about 2520, then a large bearish candle pulled back. Now it’s trading in a range of 2400–2450.
This structure is very typical:
sharp rise → profit-taking → sideways consolidation → then a choice of direction.
So far, there’s no clear breakdown:
✅ Lows: Around 2370 there’s support. After the price retested it, it quickly rebounded.
✅ Highs: The 2440–2450 area has been tested multiple times. Note: sell orders are above, but there are also buy orders absorbing below.
In reality, the 2440–2450 zone has three overlapping resistance layers:
① The top of the prior sideways range
The blue line corresponds to the top of the earlier consolidation area.
After the first breakout attempt fails, price is likely to come back to retest.
② Psychological integer levels
Before 2500:
Around 2450 is the key level that longs must break.
Many:
short-term long positions take profit here, and short sellers’ orders are also likely clustered here.
③ Trapped positions
Those who chased in near 2500:
when the bounce returns here, they will likely choose to sell.
So the resistance here is naturally heavy.
Looking at volume:
When price broke above 2500 on the upside, volume expanded noticeably.
But now, when it rebounds back to 2440, the volume has clearly shrunk.
This suggests that the current rise is more about: short covering + bargain-hunting support,
not yet very strong new incremental capital entering.
If you want an effective breakout, you need:
volume expansion and a bullish candle body breaking above 2450.
The next pullback only counts as confirmation if it does not drop back below 2430.
Key price levels
Long (bullish) zone
First support:
2400—hold it and the structure remains healthy.
Second support:
2360–2380—this is very important (the red line in the chart). A break below means the 4H uptrend rhythm has been disrupted.
Resistance:
First resistance:
2445–2450 (blue line in the chart).
Second resistance:
2500–2520, the prior highs.
Break above 2520: opens up upside room.
Targets: around 2600, and even 2750. $ETH
3
1
2
1.5k
·
--
Bullish
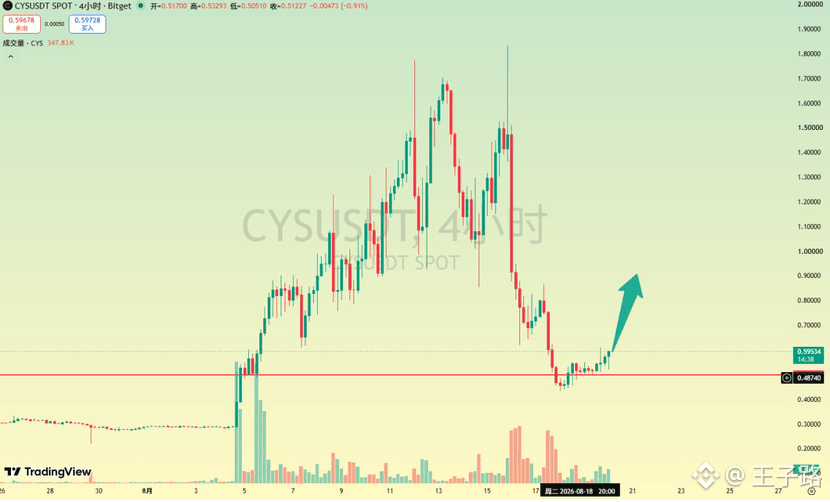
Around September 10, $CYS 8 Upbit listed CYS/USDT and CYS/BTC, which was the main driver. Combined with the ZK/AI computing narrative and a low-float supply mechanism, it triggered a rapid rally from about $0.28–$0.3 up to an ATH of around $1.76–$1.82 (around August 15). Afterwards, a sharp pullback occurred due to profit-taking, leverage liquidations, and market adjustments.
Technically, this is a deep pullback following a big surge, plus a phase of short-term rebound attempts. A new uptrend has not yet been confirmed. In this oversold rebound/consolidation stage (price roughly $0.55–$0.59), I am watching to see whether a higher low will form.
If it can hold firmly above $0.58–$0.60 and break out with increased volume, there may be repair upside toward $0.70+. If it loses $0.50 again, it will remain weak.
Resistance: $0.65–$0.75 (prior period heavy trading/withdrawal levels). Further targets: $0.85–$1.00.
Support: $0.50–$0.52 (recent lows and the horizontal line). If support breaks, it could test $0.40–$0.45 and even lower to build a deeper accumulation zone. $CYS
Around September 10, $CYS 8 Upbit listed CYS/USDT and CYS/BTC, which was the main driver. Combined with the ZK/AI computing narrative and a low-float supply mechanism, it triggered a rapid rally from about $0.28–$0.3 up to an ATH of around $1.76–$1.82 (around August 15). Afterwards, a sharp pullback occurred due to profit-taking, leverage liquidations, and market adjustments.
Technically, this is a deep pullback following a big surge, plus a phase of short-term rebound attempts. A new uptrend has not yet been confirmed. In this oversold rebound/consolidation stage (price roughly $0.55–$0.59), I am watching to see whether a higher low will form.
If it can hold firmly above $0.58–$0.60 and break out with increased volume, there may be repair upside toward $0.70+. If it loses $0.50 again, it will remain weak.
Resistance: $0.65–$0.75 (prior period heavy trading/withdrawal levels). Further targets: $0.85–$1.00.
Support: $0.50–$0.52 (recent lows and the horizontal line). If support breaks, it could test $0.40–$0.45 and even lower to build a deeper accumulation zone. $CYS
Technically, this is a deep pullback following a big surge, plus a phase of short-term rebound attempts. A new uptrend has not yet been confirmed. In this oversold rebound/consolidation stage (price roughly $0.55–$0.59), I am watching to see whether a higher low will form.
If it can hold firmly above $0.58–$0.60 and break out with increased volume, there may be repair upside toward $0.70+. If it loses $0.50 again, it will remain weak.
Resistance: $0.65–$0.75 (prior period heavy trading/withdrawal levels). Further targets: $0.85–$1.00.
Support: $0.50–$0.52 (recent lows and the horizontal line). If support breaks, it could test $0.40–$0.45 and even lower to build a deeper accumulation zone. $CYS
230
·
--
Bullish
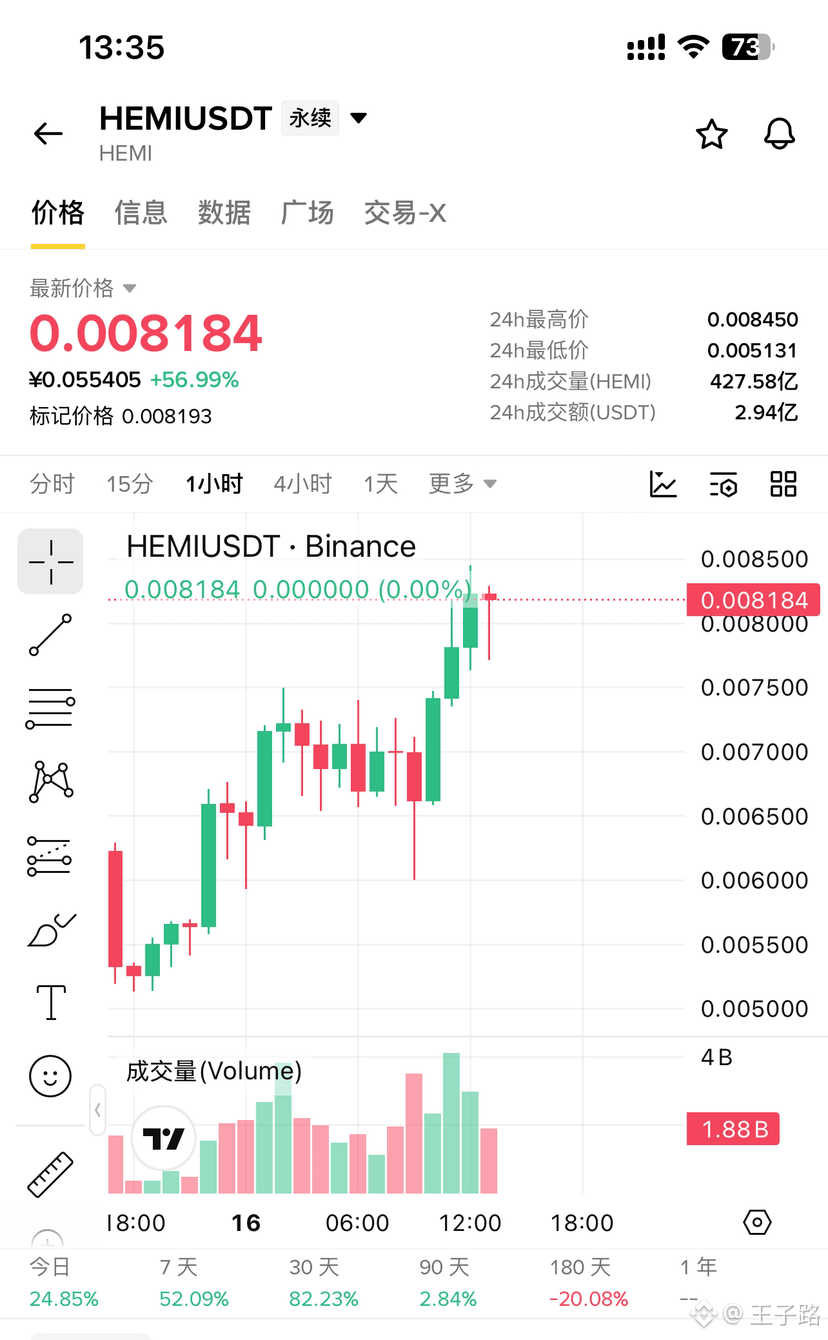
232
·
--
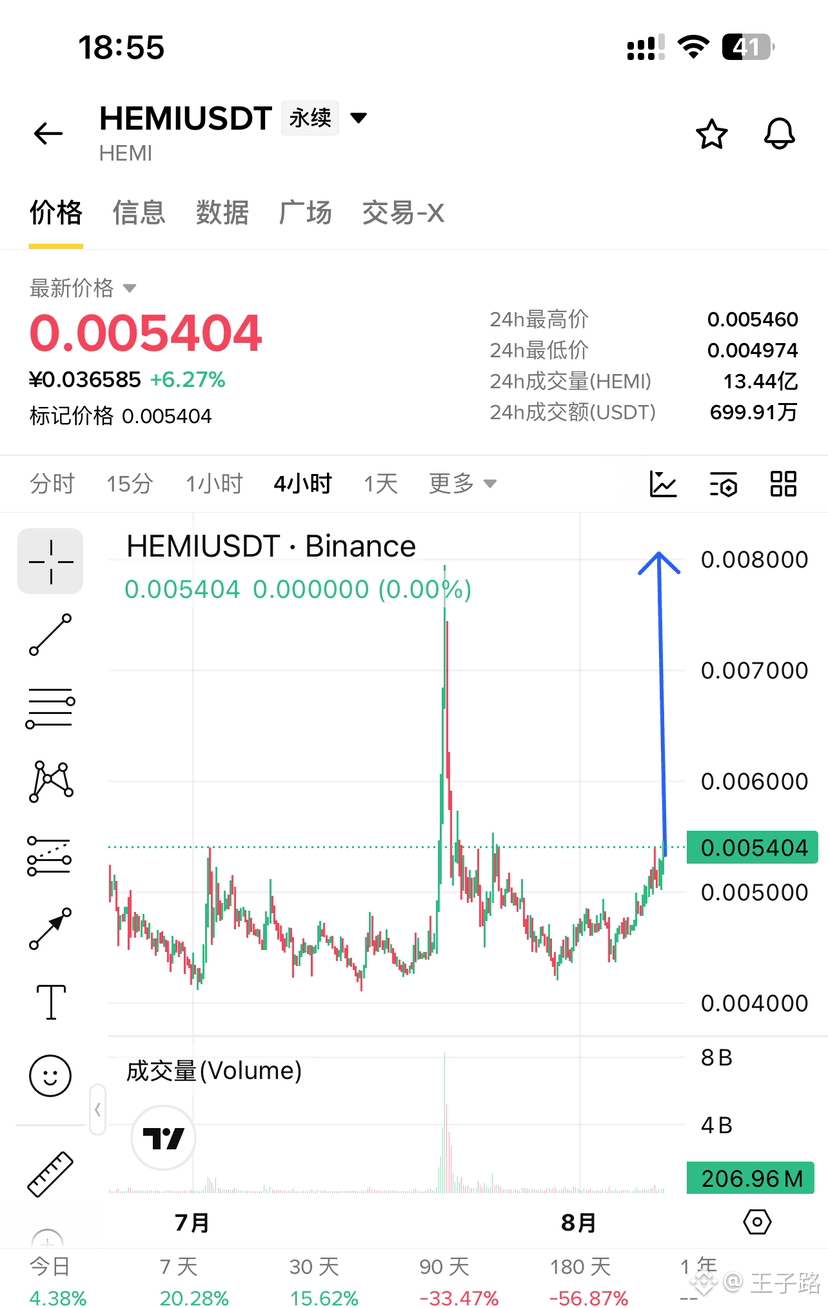
1
322
·
--
The old playbook for Japan to support the yen was simple: sell the U.S. Treasuries it held, switch into U.S. dollars, and then use those dollars to buy yen to prop up the exchange rate. If the yen kept falling, Japan would have to keep making large, continuous sales of U.S. Treasuries.
Now, the pressure on U.S. Treasuries themselves is already huge. Once Japan hits them hard in a coordinated sell-off, the yields on U.S. Treasuries would surge further, eventually dragging down U.S. stocks and creating a vicious cycle:
Yen falls → Japan sells U.S. Treasuries → U.S. Treasury yields jump → the U.S.-Japan interest-rate spread widens → the yen keeps falling, forming a negative-trend feedback loop.
To prevent large-scale dumping of U.S. Treasuries, Japan used FIMA repo. Instead of directly selling the U.S. Treasuries it holds, Japan first pledges the Treasuries to the Federal Reserve, then borrows U.S. dollars to support the yen. This can stabilize the yen in the short term and temporarily ease the concentrated selling pressure on Treasuries. However, it is essentially just a way to hold back the risk rather than solve the underlying problem—it only delays it.
The old playbook for Japan to support the yen was simple: sell the U.S. Treasuries it held, switch into U.S. dollars, and then use those dollars to buy yen to prop up the exchange rate. If the yen kept falling, Japan would have to keep making large, continuous sales of U.S. Treasuries.
Now, the pressure on U.S. Treasuries themselves is already huge. Once Japan hits them hard in a coordinated sell-off, the yields on U.S. Treasuries would surge further, eventually dragging down U.S. stocks and creating a vicious cycle:
Yen falls → Japan sells U.S. Treasuries → U.S. Treasury yields jump → the U.S.-Japan interest-rate spread widens → the yen keeps falling, forming a negative-trend feedback loop.
To prevent large-scale dumping of U.S. Treasuries, Japan used FIMA repo. Instead of directly selling the U.S. Treasuries it holds, Japan first pledges the Treasuries to the Federal Reserve, then borrows U.S. dollars to support the yen. This can stabilize the yen in the short term and temporarily ease the concentrated selling pressure on Treasuries. However, it is essentially just a way to hold back the risk rather than solve the underlying problem—it only delays it.
Now, the pressure on U.S. Treasuries themselves is already huge. Once Japan hits them hard in a coordinated sell-off, the yields on U.S. Treasuries would surge further, eventually dragging down U.S. stocks and creating a vicious cycle:
Yen falls → Japan sells U.S. Treasuries → U.S. Treasury yields jump → the U.S.-Japan interest-rate spread widens → the yen keeps falling, forming a negative-trend feedback loop.
To prevent large-scale dumping of U.S. Treasuries, Japan used FIMA repo. Instead of directly selling the U.S. Treasuries it holds, Japan first pledges the Treasuries to the Federal Reserve, then borrows U.S. dollars to support the yen. This can stabilize the yen in the short term and temporarily ease the concentrated selling pressure on Treasuries. However, it is essentially just a way to hold back the risk rather than solve the underlying problem—it only delays it.
119
·
--
Bullish
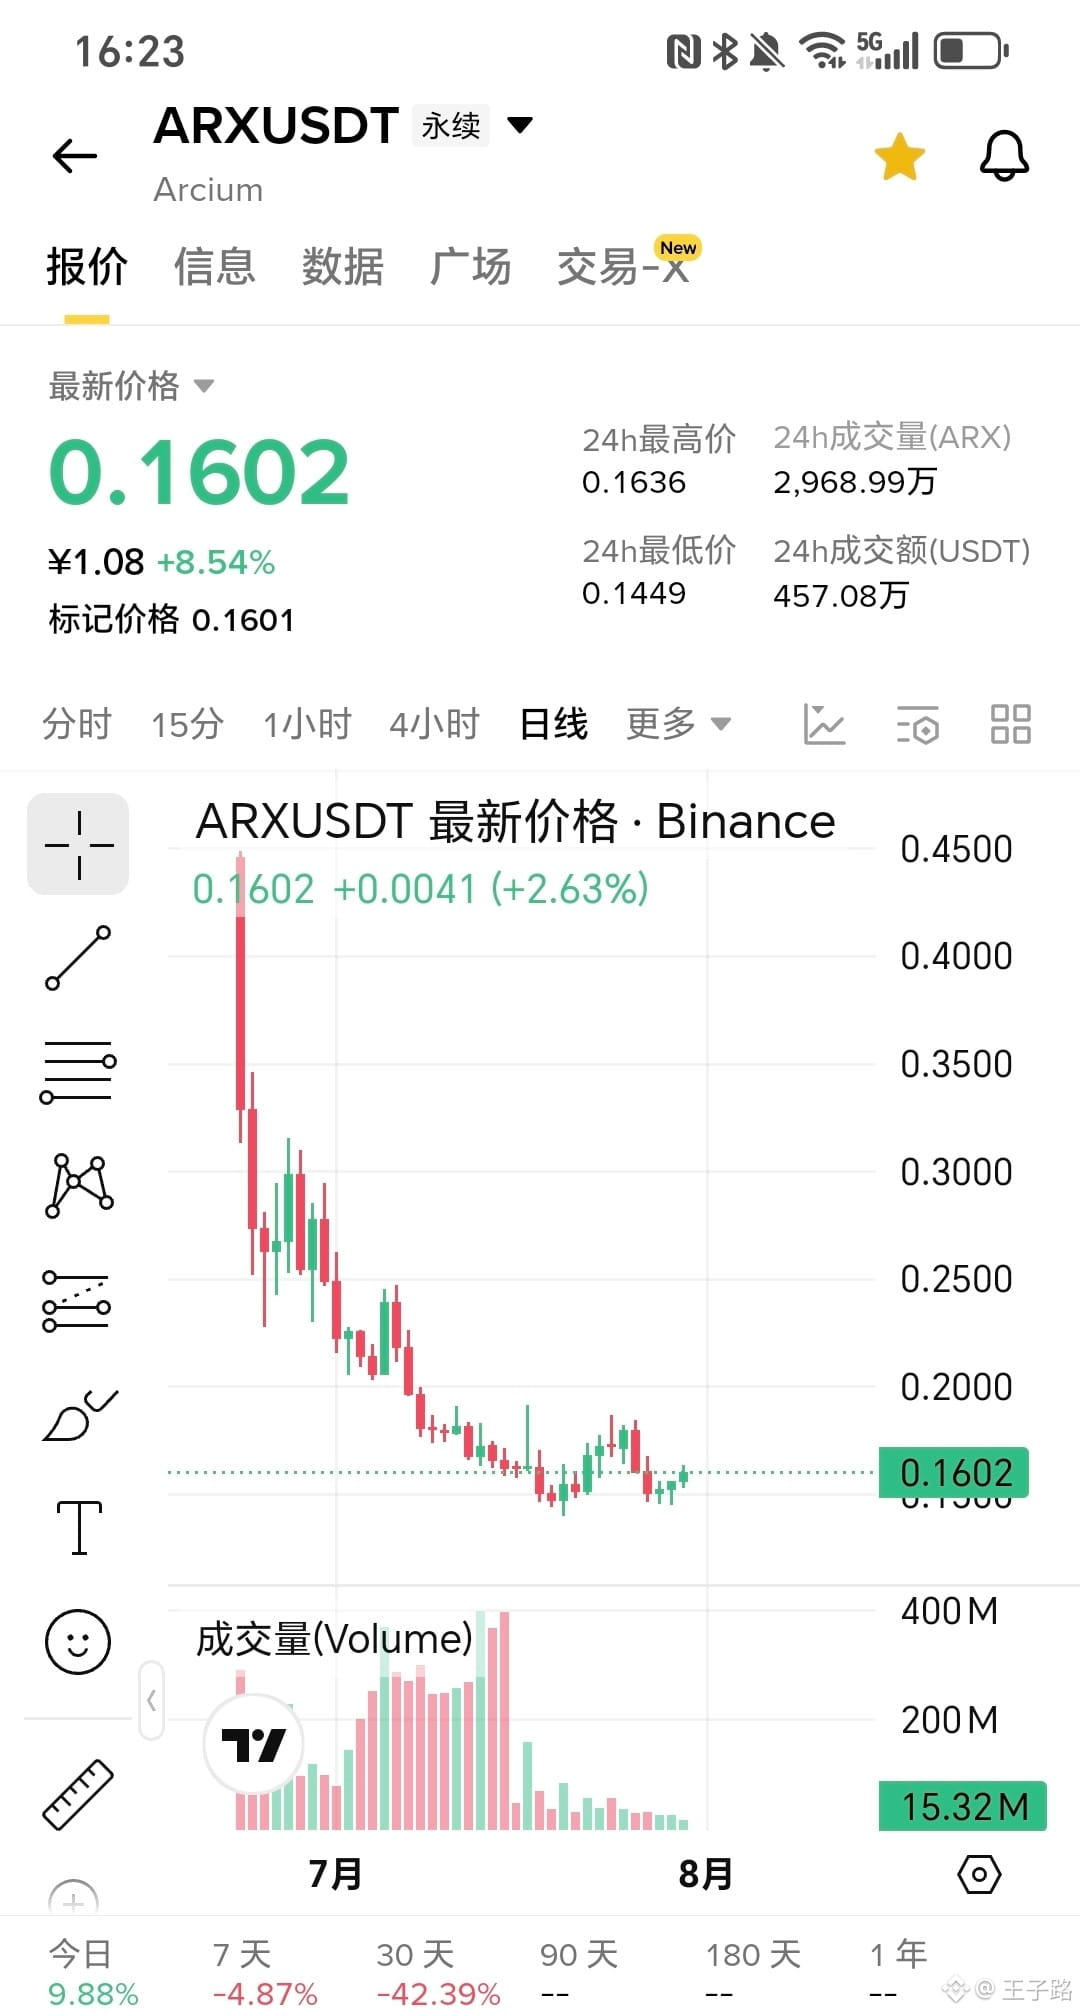
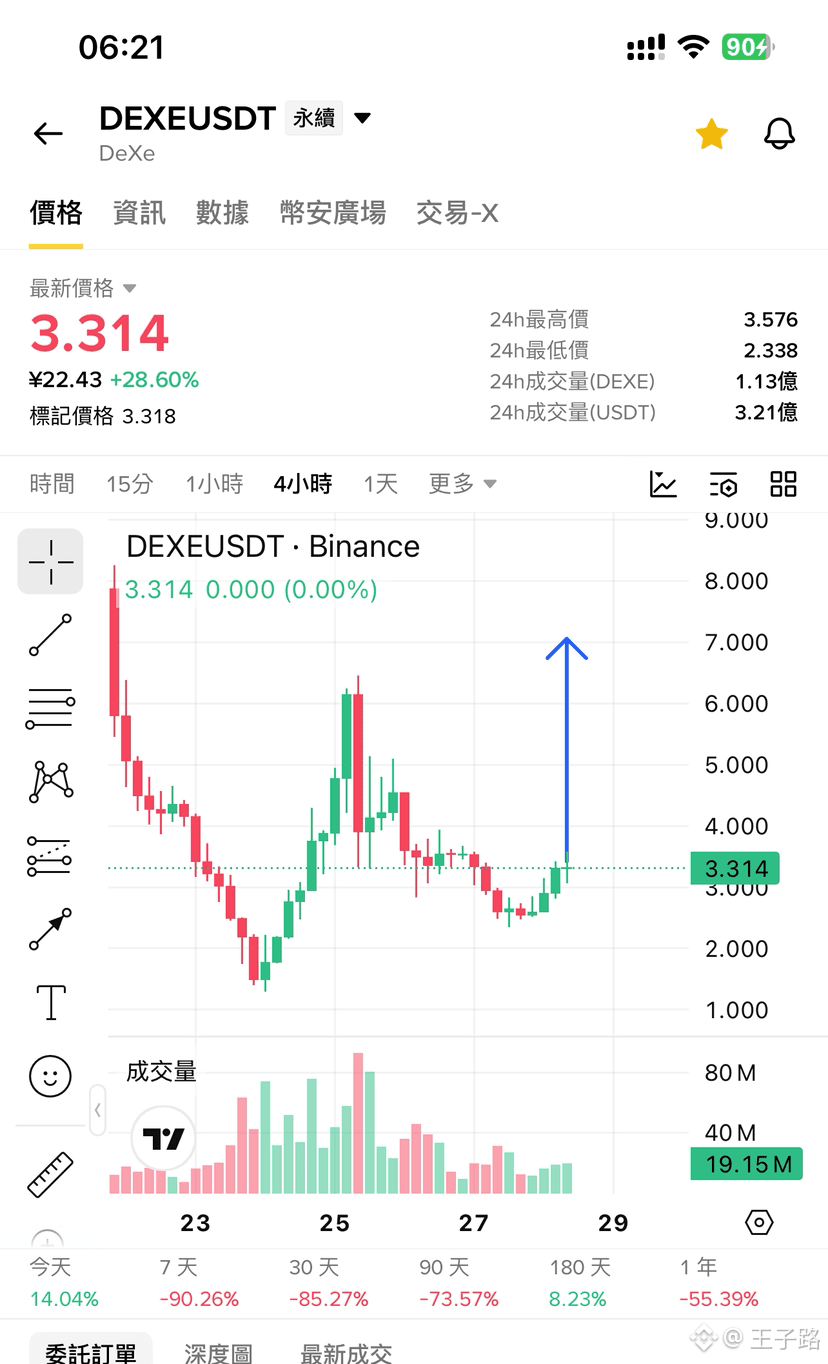
$DEXE This crop has a great pattern of ambition.
$DEXE This crop has a great pattern of ambition.
228
·
--
Bullish
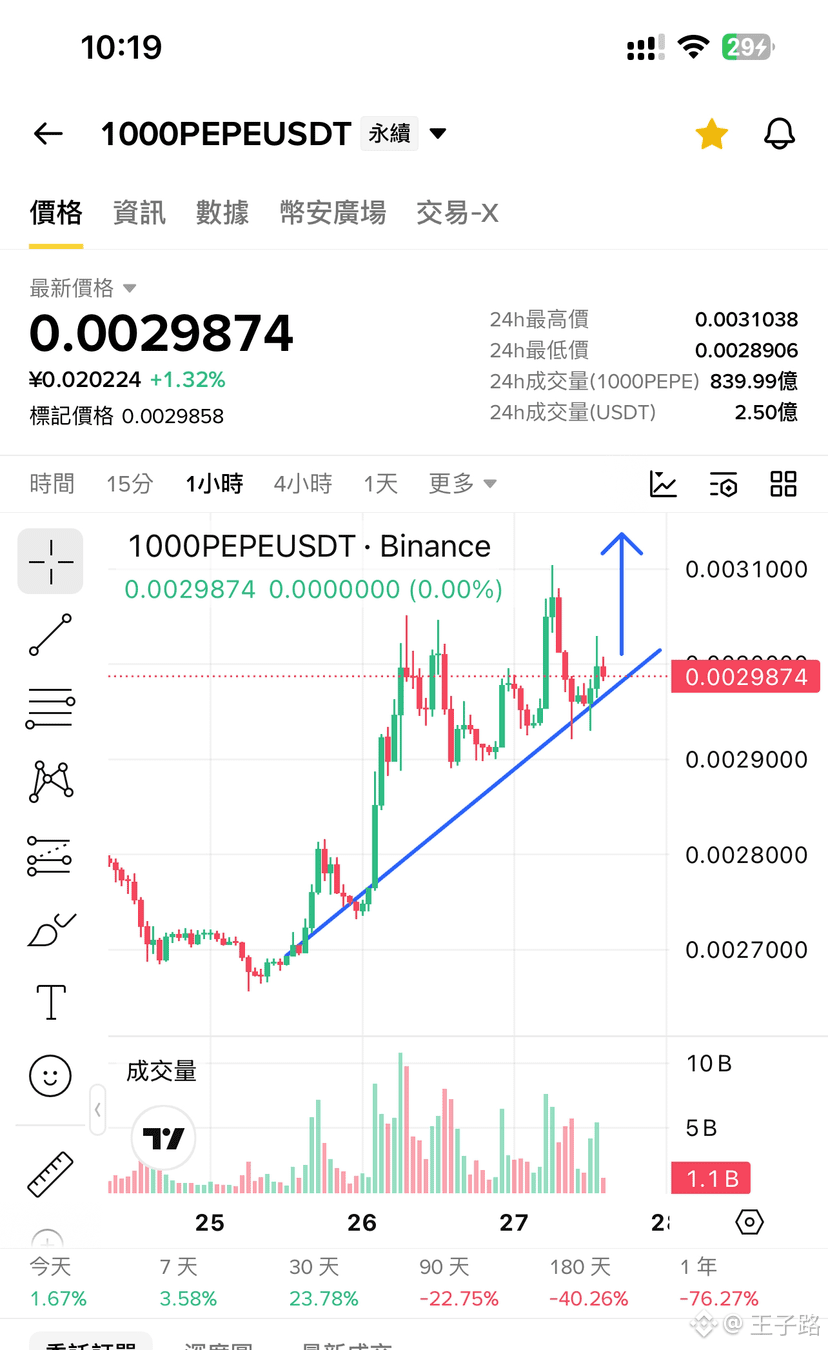
$people has already taken off. Will $pepe still be far away? Breaking the previous high this time! $PEPE
$people has already taken off. Will $pepe still be far away? Breaking the previous high this time! $PEPE
502
·
--
Bullish
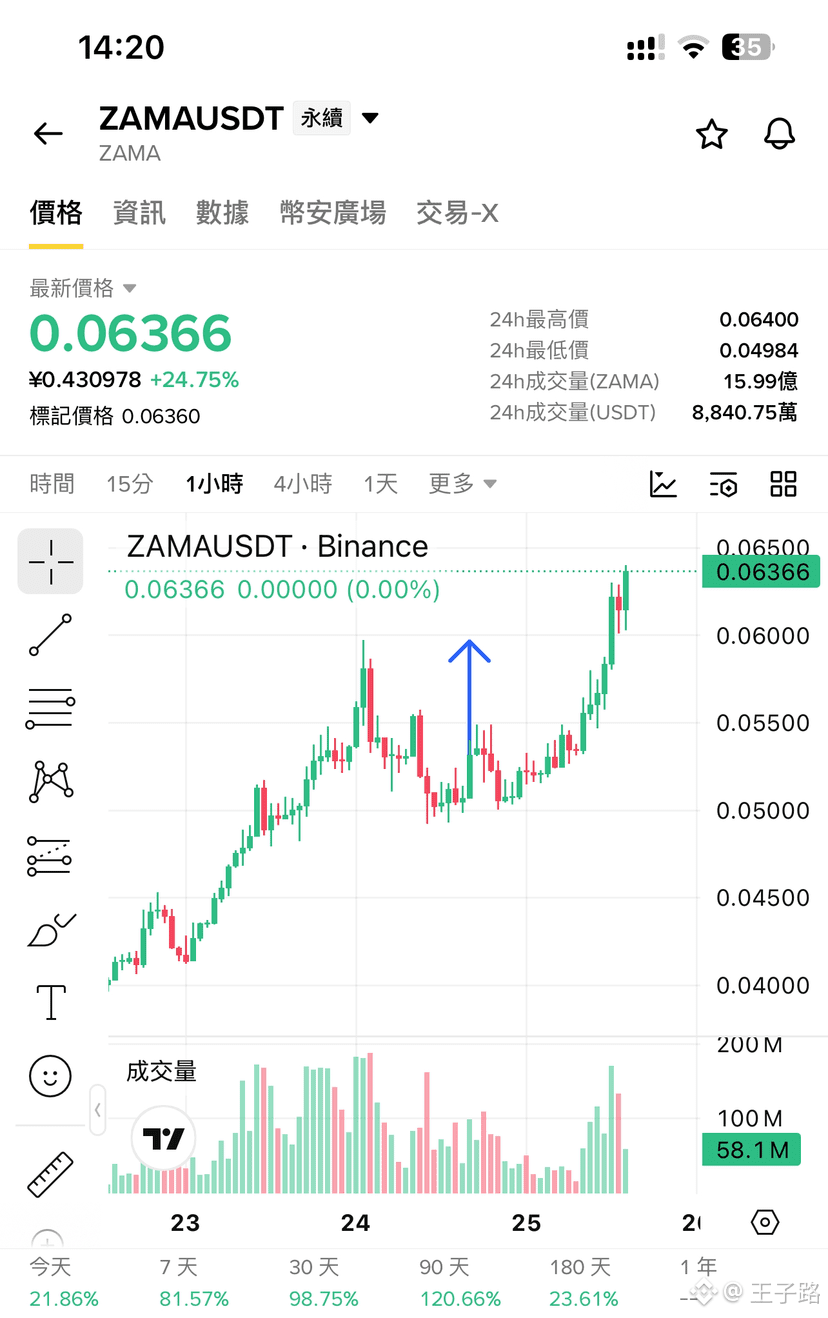
$ZAMA successfully breaks through the previous high $ZAMA
$ZAMA successfully breaks through the previous high $ZAMA
王子路
·
--
Bullish$ZAMA can it rise again and break the previous high at 0.05973?$zama
76
Log in to explore more content
Join global crypto users on Binance Square
⚡️ Get latest and useful information about crypto.
💬 Trusted by the world’s largest crypto exchange.
👍 Discover real insights from verified creators.
Email / Phone number
Trending Topics
USAugustPPIRisesLessThanExpected
35,078 views
655 Discussing
🚨 US AUG PPI: Rises LESS Than Expected! Bullish for Crypto? 🚀
PPI +0.4% MoM as expected, but CORE PPI only +0.2% vs +0.3% expected - cooling!
What it means:
• Wholesale inflation softer than feared
• Fed rate hike chance now 62% - but dovish signals coming
• Core PCE revisions expected downward - bullish
• BTC usually pumps on softer PPI
Fed meeting Sep 15-16 - Market now expects pause, not hike?
Is this the green light for Q4 rally?
#Bitcoin #PPI #Fed #CryptoNews #BTC#usaugustppiriseslessthanexpected
True News
·1 Likes
·1.3k views
SECApprovesNasdaqTexasCommodityTrustRule
20,892 views
490 Discussing
ECBRaisesRatesSecondTimeTo2.5%
18,634 views
366 Discussing