
川哥研报
373 Posts

川哥研报
每日分享币圈资讯和做单策略,关注公众号:《大川说币》,你能找到我
3 Following
1.3K+ Followers
741 Liked
Posts
All
Quotes
Videos
Live
Share stocks later
Sustained and stable projects—community leaders are welcome to connect
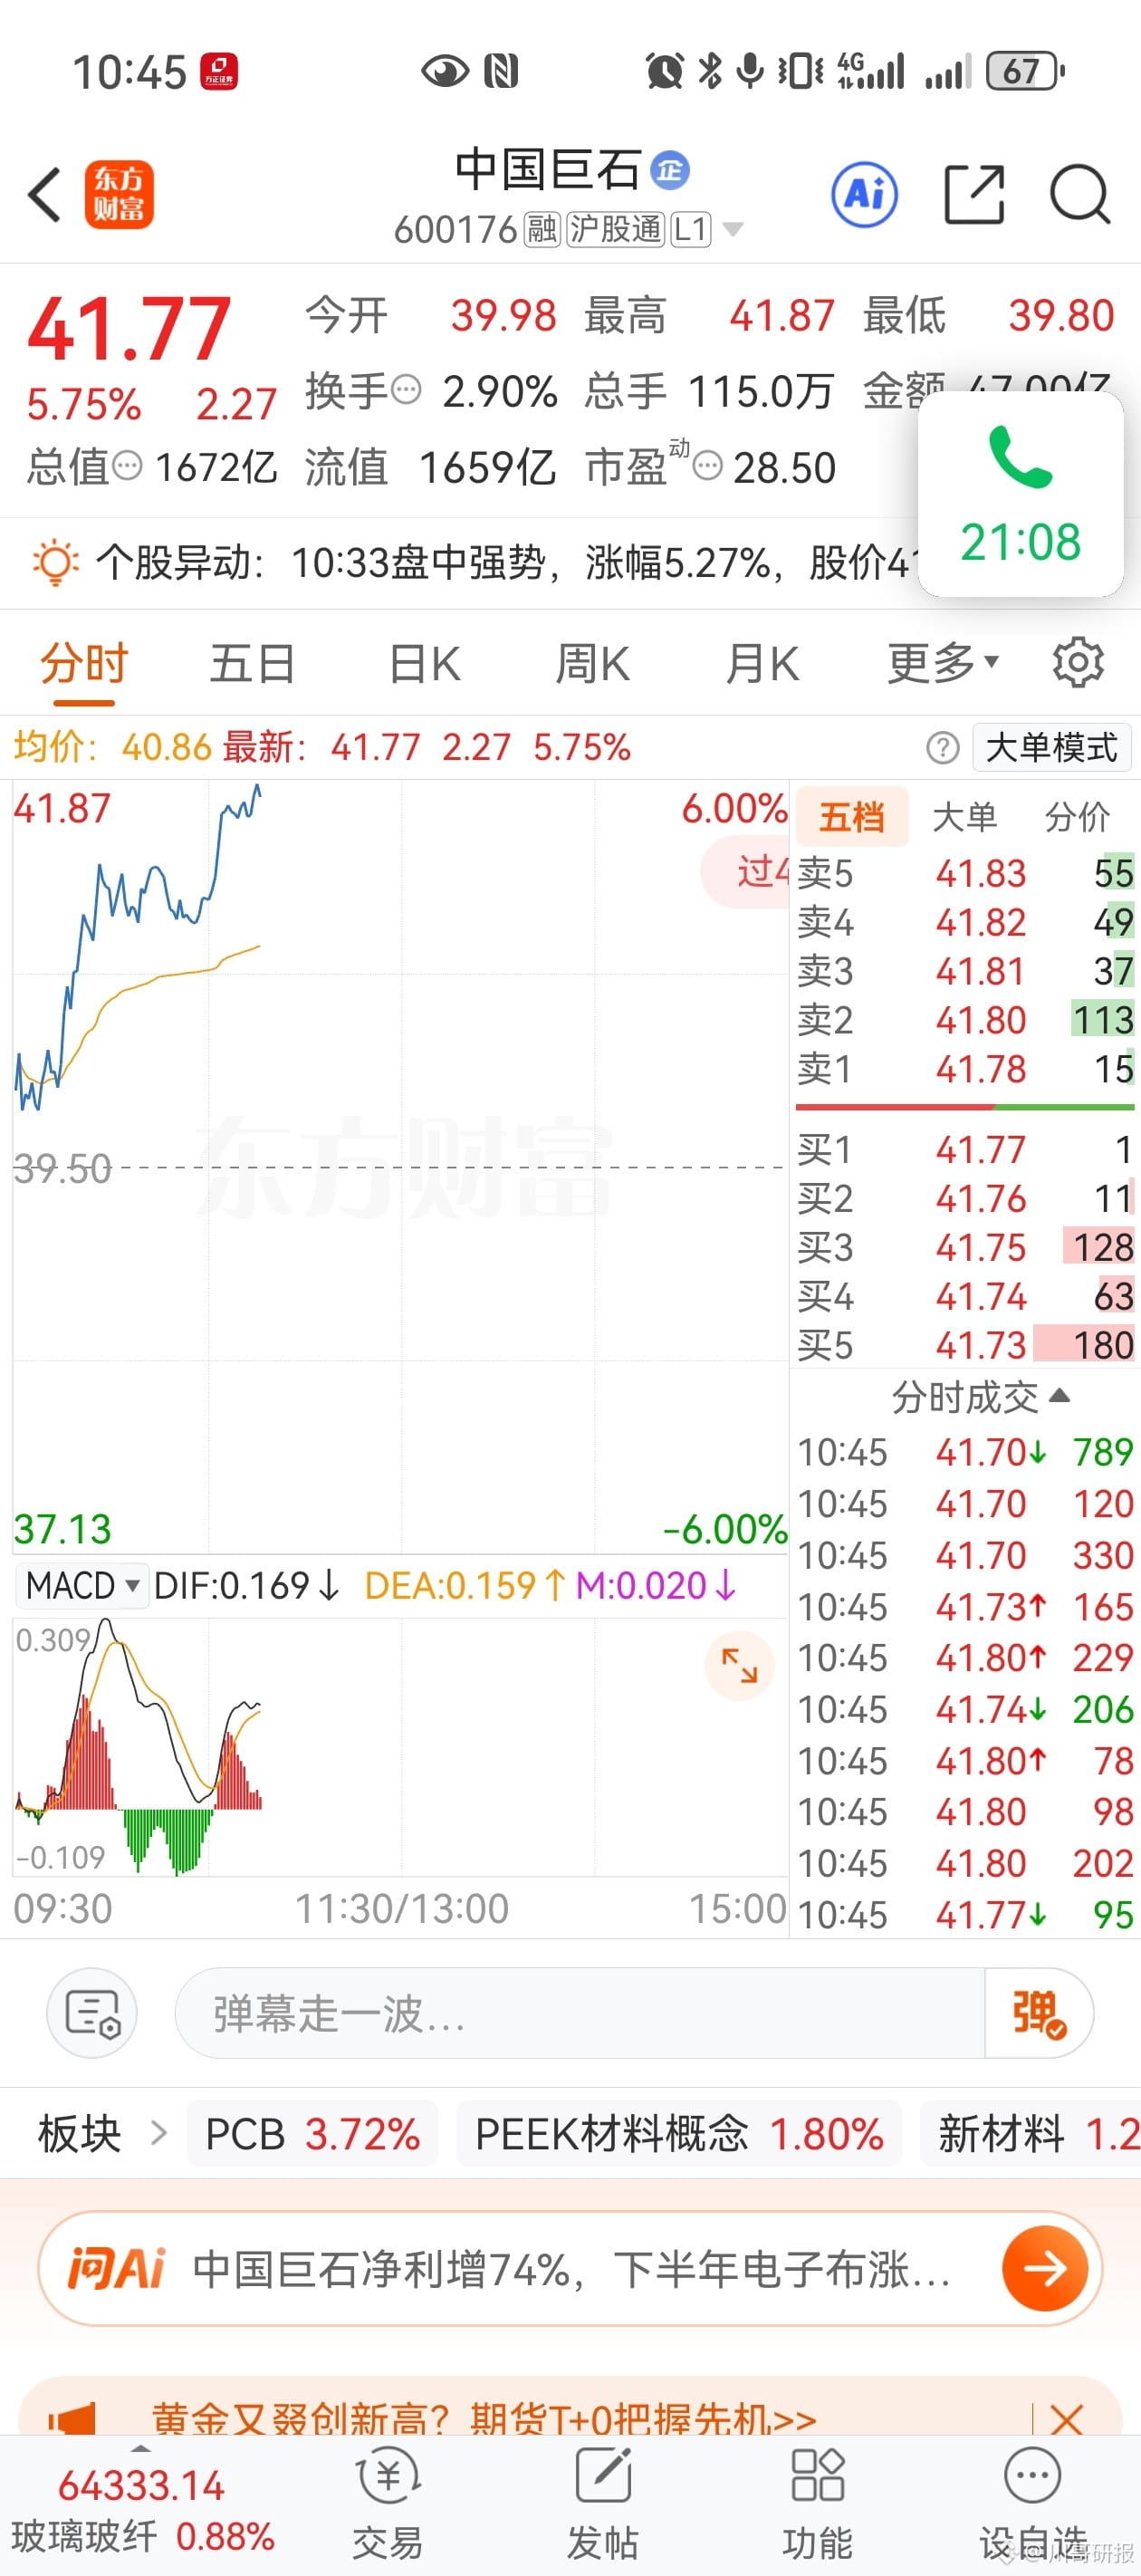
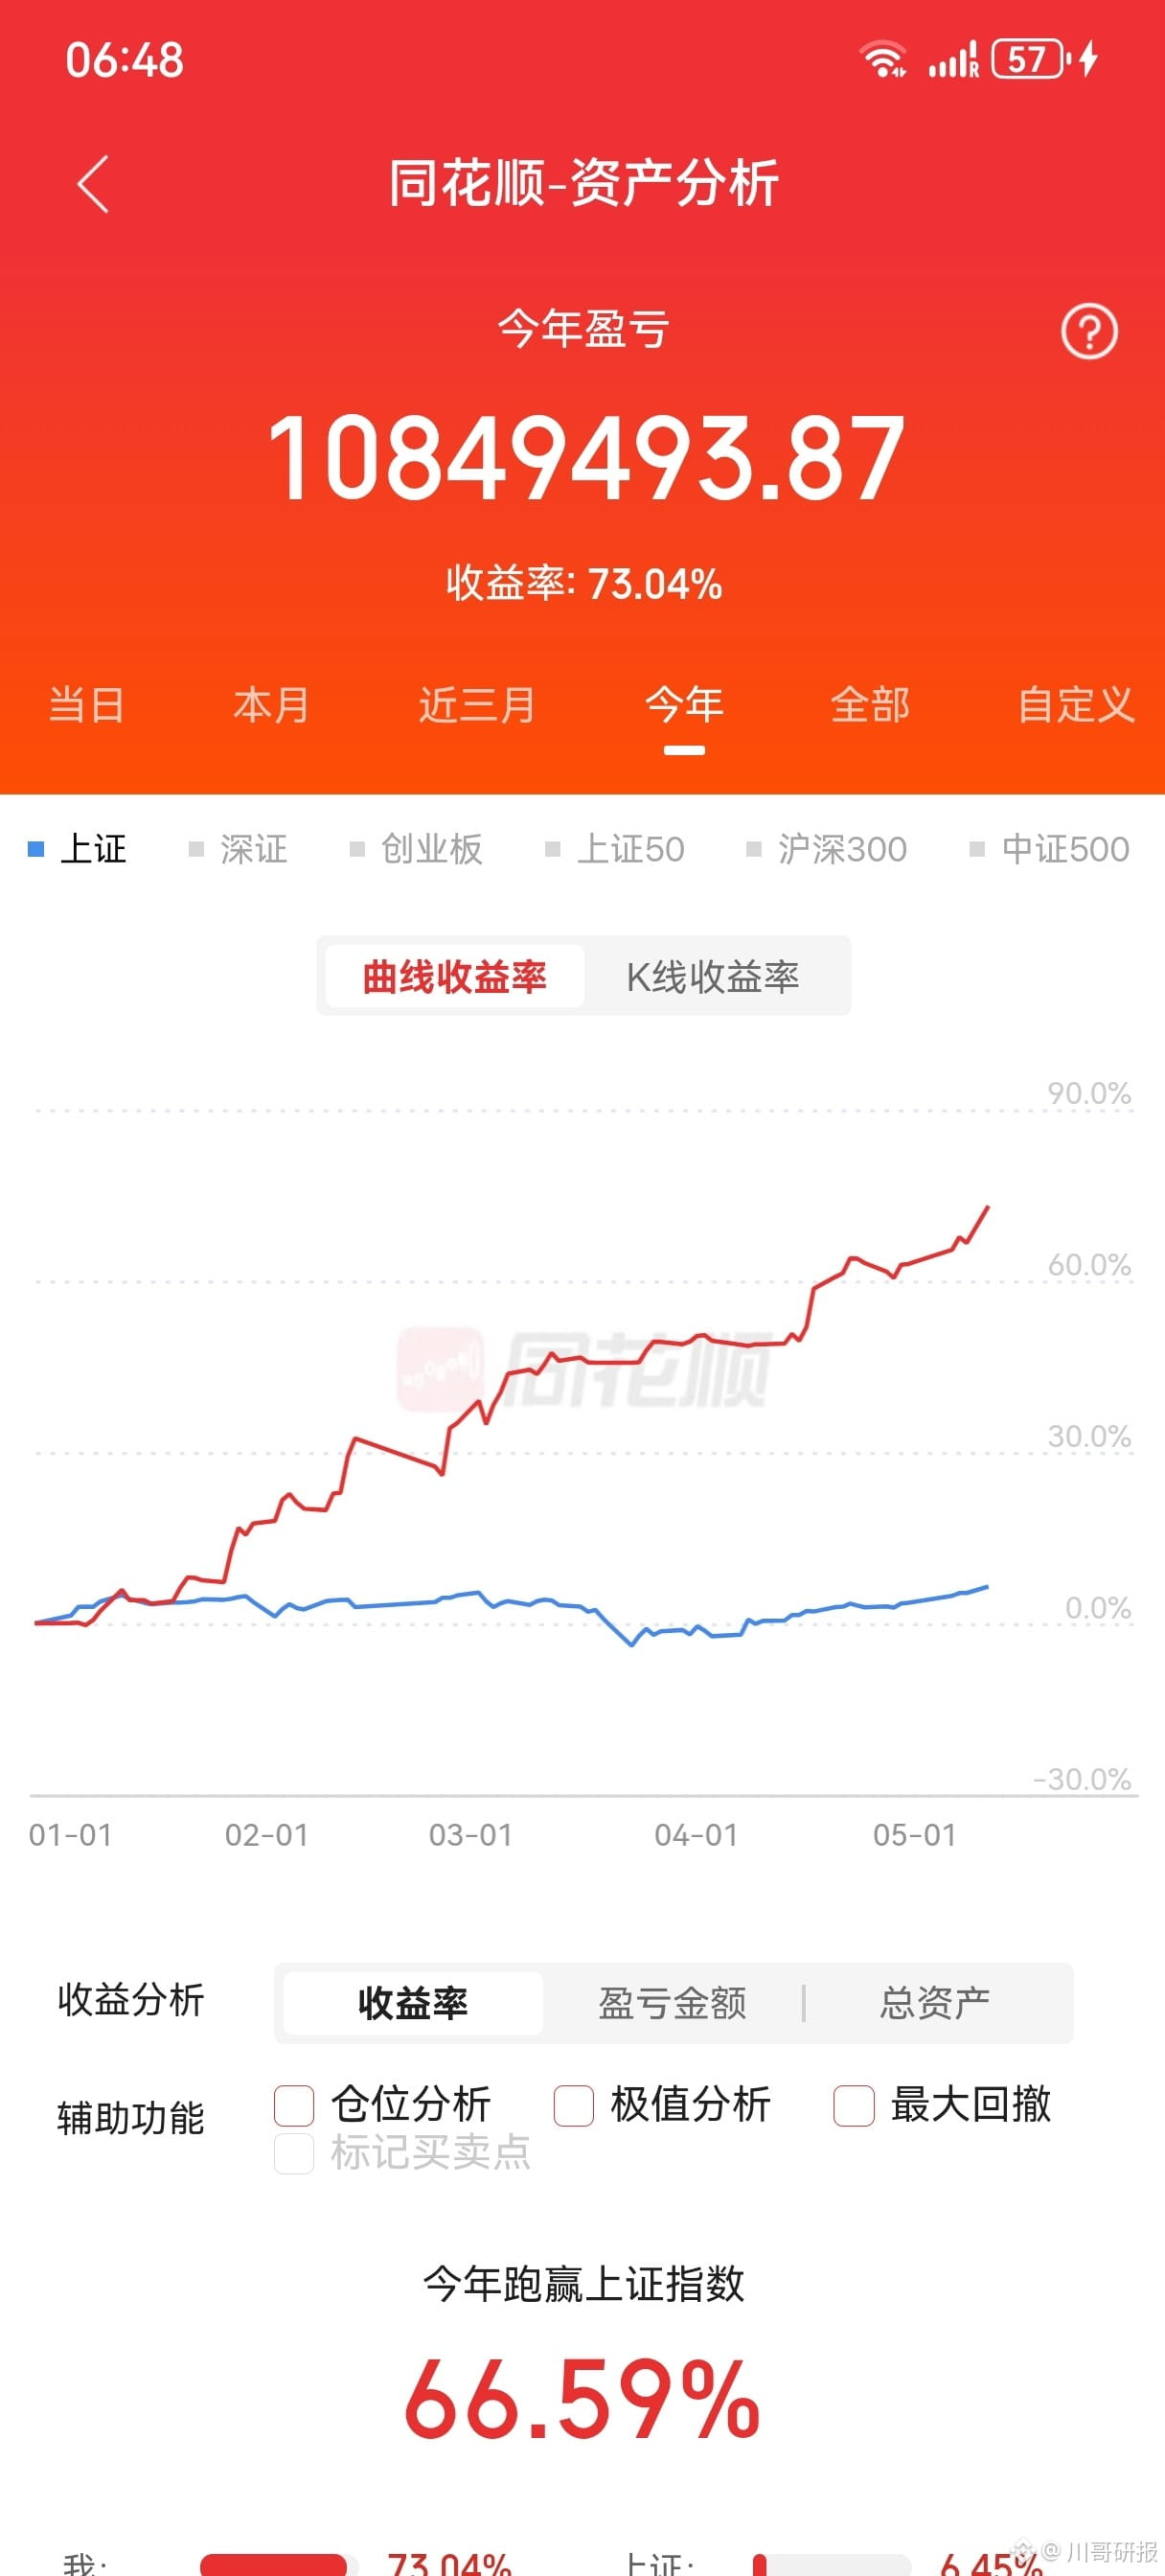
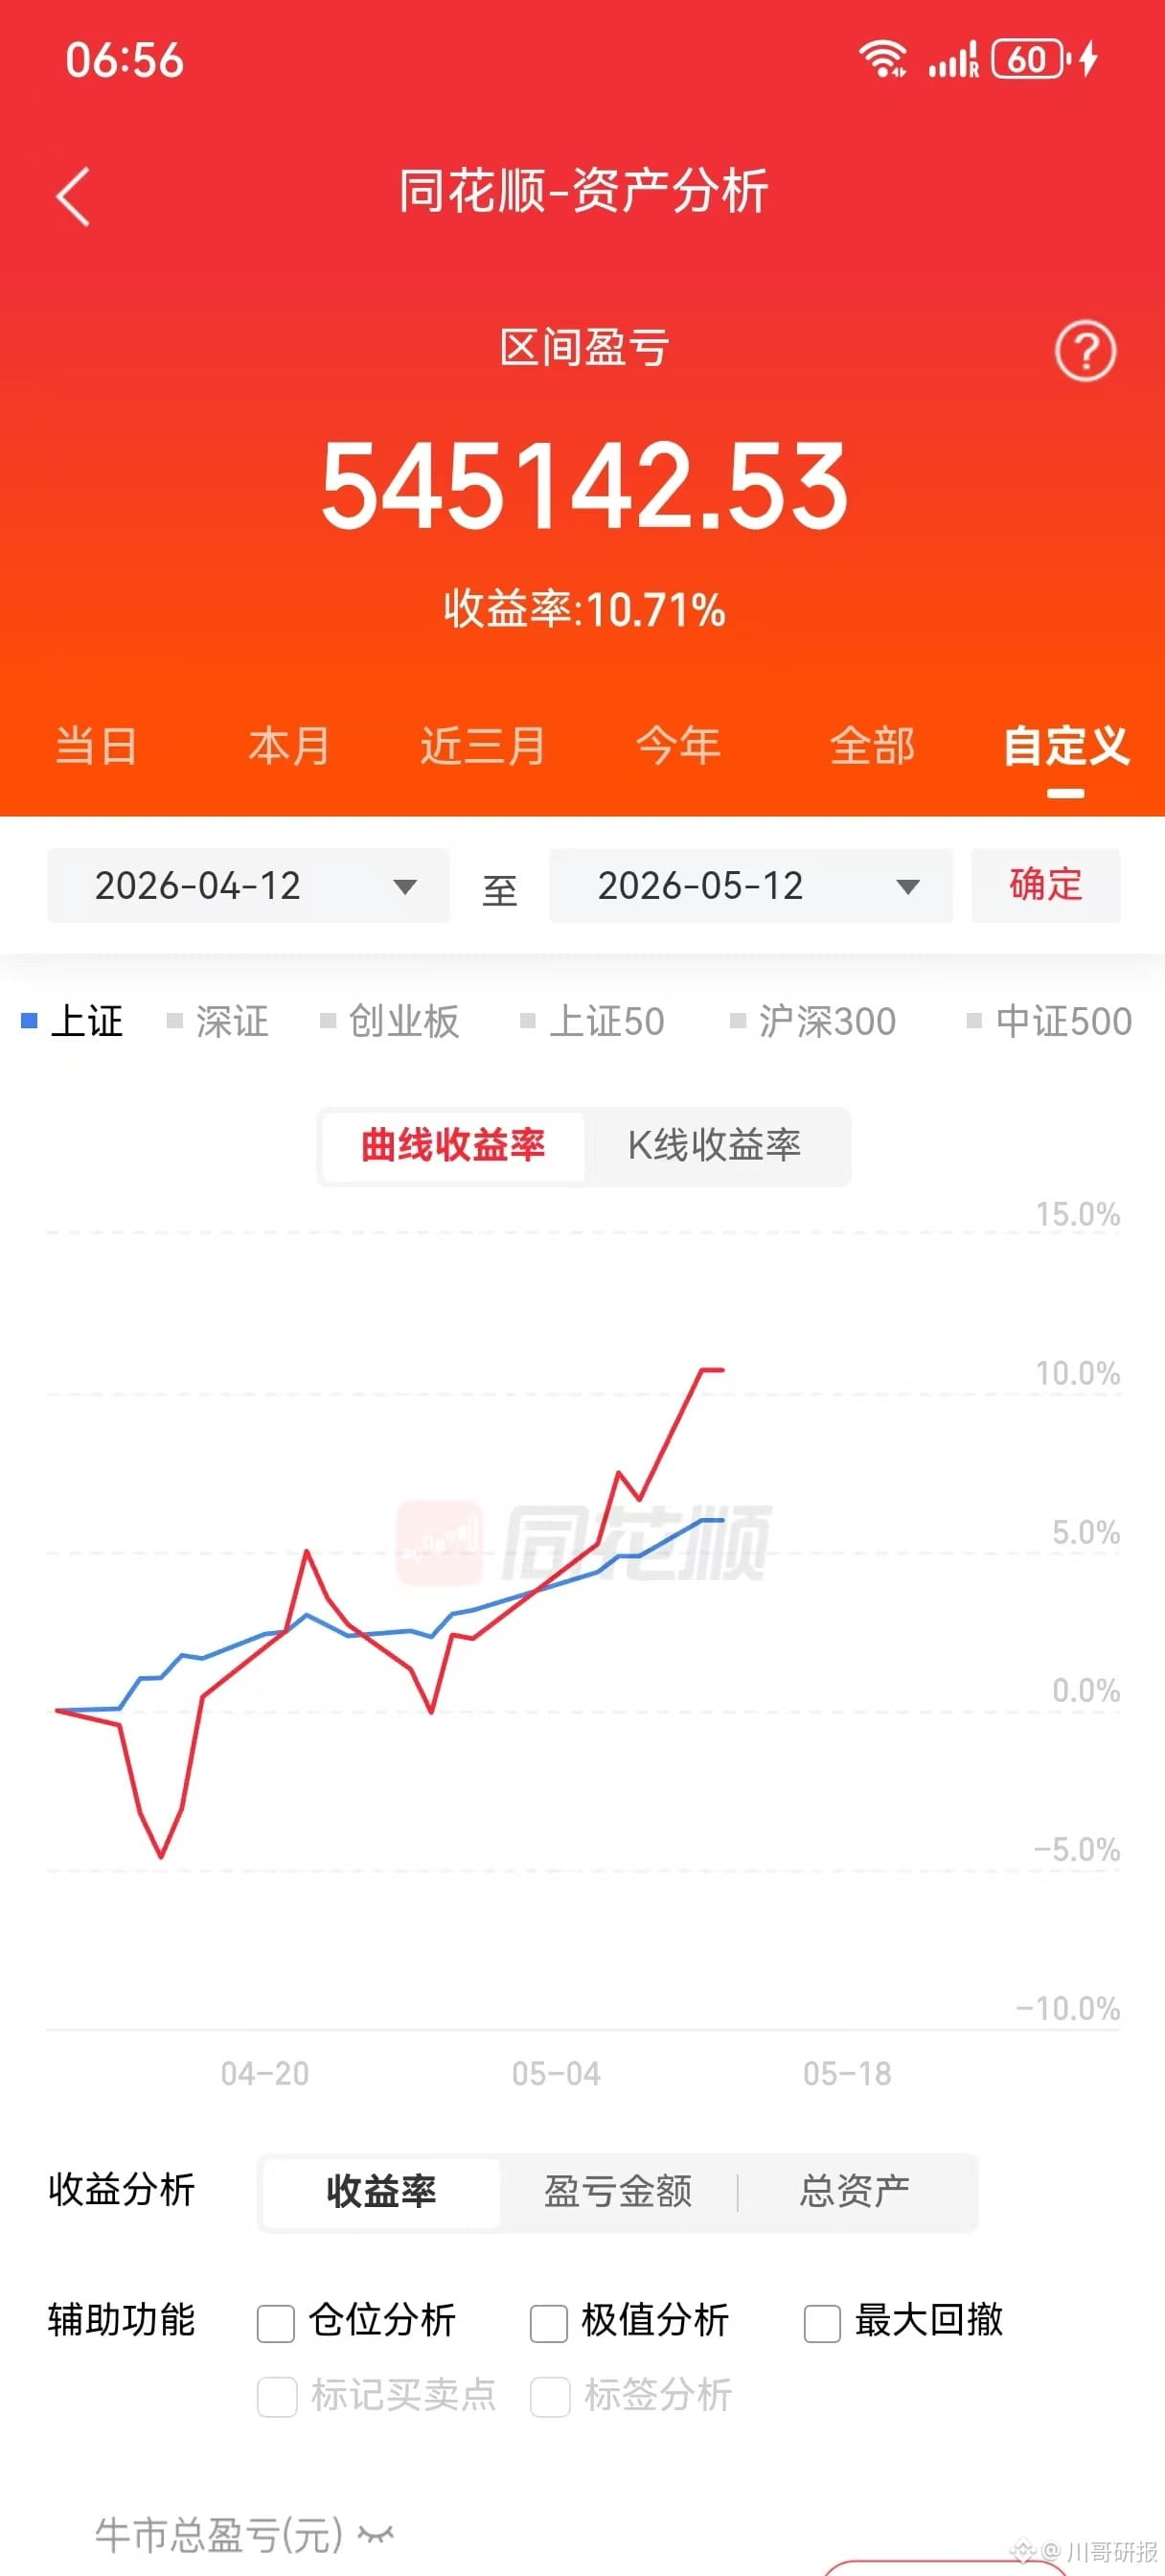
Hey folks, good morning! Starting today, this account will be sharing stock insights. Yesterday, our main account used 65% of its position to rake in 3.88%, while the smaller account, leveraging about 80% of its capital, scored around 5%, far outpacing the ChiNext. Long-time friends know we’ve been maintaining about 50% exposure this year, employing a rolling strategy. It wasn't until April, when the market stabilized, that we began to build up to 60-80% positions for the medium to long term. Recently, we're keeping our holdings down to four stocks max—always ready to strike but also to retreat! The pace of change is rapid, and for older friends, I recommend steering clear of alcohol and heavy leverage; it can lead to mental laziness, which might be why some miss out on investment opportunities. My strategies: ① Be a man standing in the light, focusing on optical modules, optical chips, and optical fibers. Zhongji Xuchuang is the global leader in optical modules, and Langmeitong surged 16% last night, with Gao Yi up 13% and Corning at 10%. I'm bullish on the domestic leaders in optical modules, optical chips, and optical fibers, such as Xiangtong Optoelectronics and Guangxun Technology. We’re reallocating part of our positions to big-cap absolute leaders primarily for safety reasons. ② AI storage—Korea's exports increased by 40%, mainly due to rising storage prices. The operational difficulty is high because there are currently no non-cyclical industries; everything is cyclical, and storage isn't favored either, so we need to keep a close watch on product price trends. ③ AI computing power, optical modules, and fiber reorganization. We can see that Yongding Co. and Litong Electronics transitioned from traditional sectors into optical modules, optical chips, and computing power leasing, skyrocketing more than tenfold over the past year. Gradually, we'll shift some of our large-cap absolute leader positions over. Last year’s hot stock, Hongjing Technology, is topping the AI charts this year, mainly due to high capital efficiency.
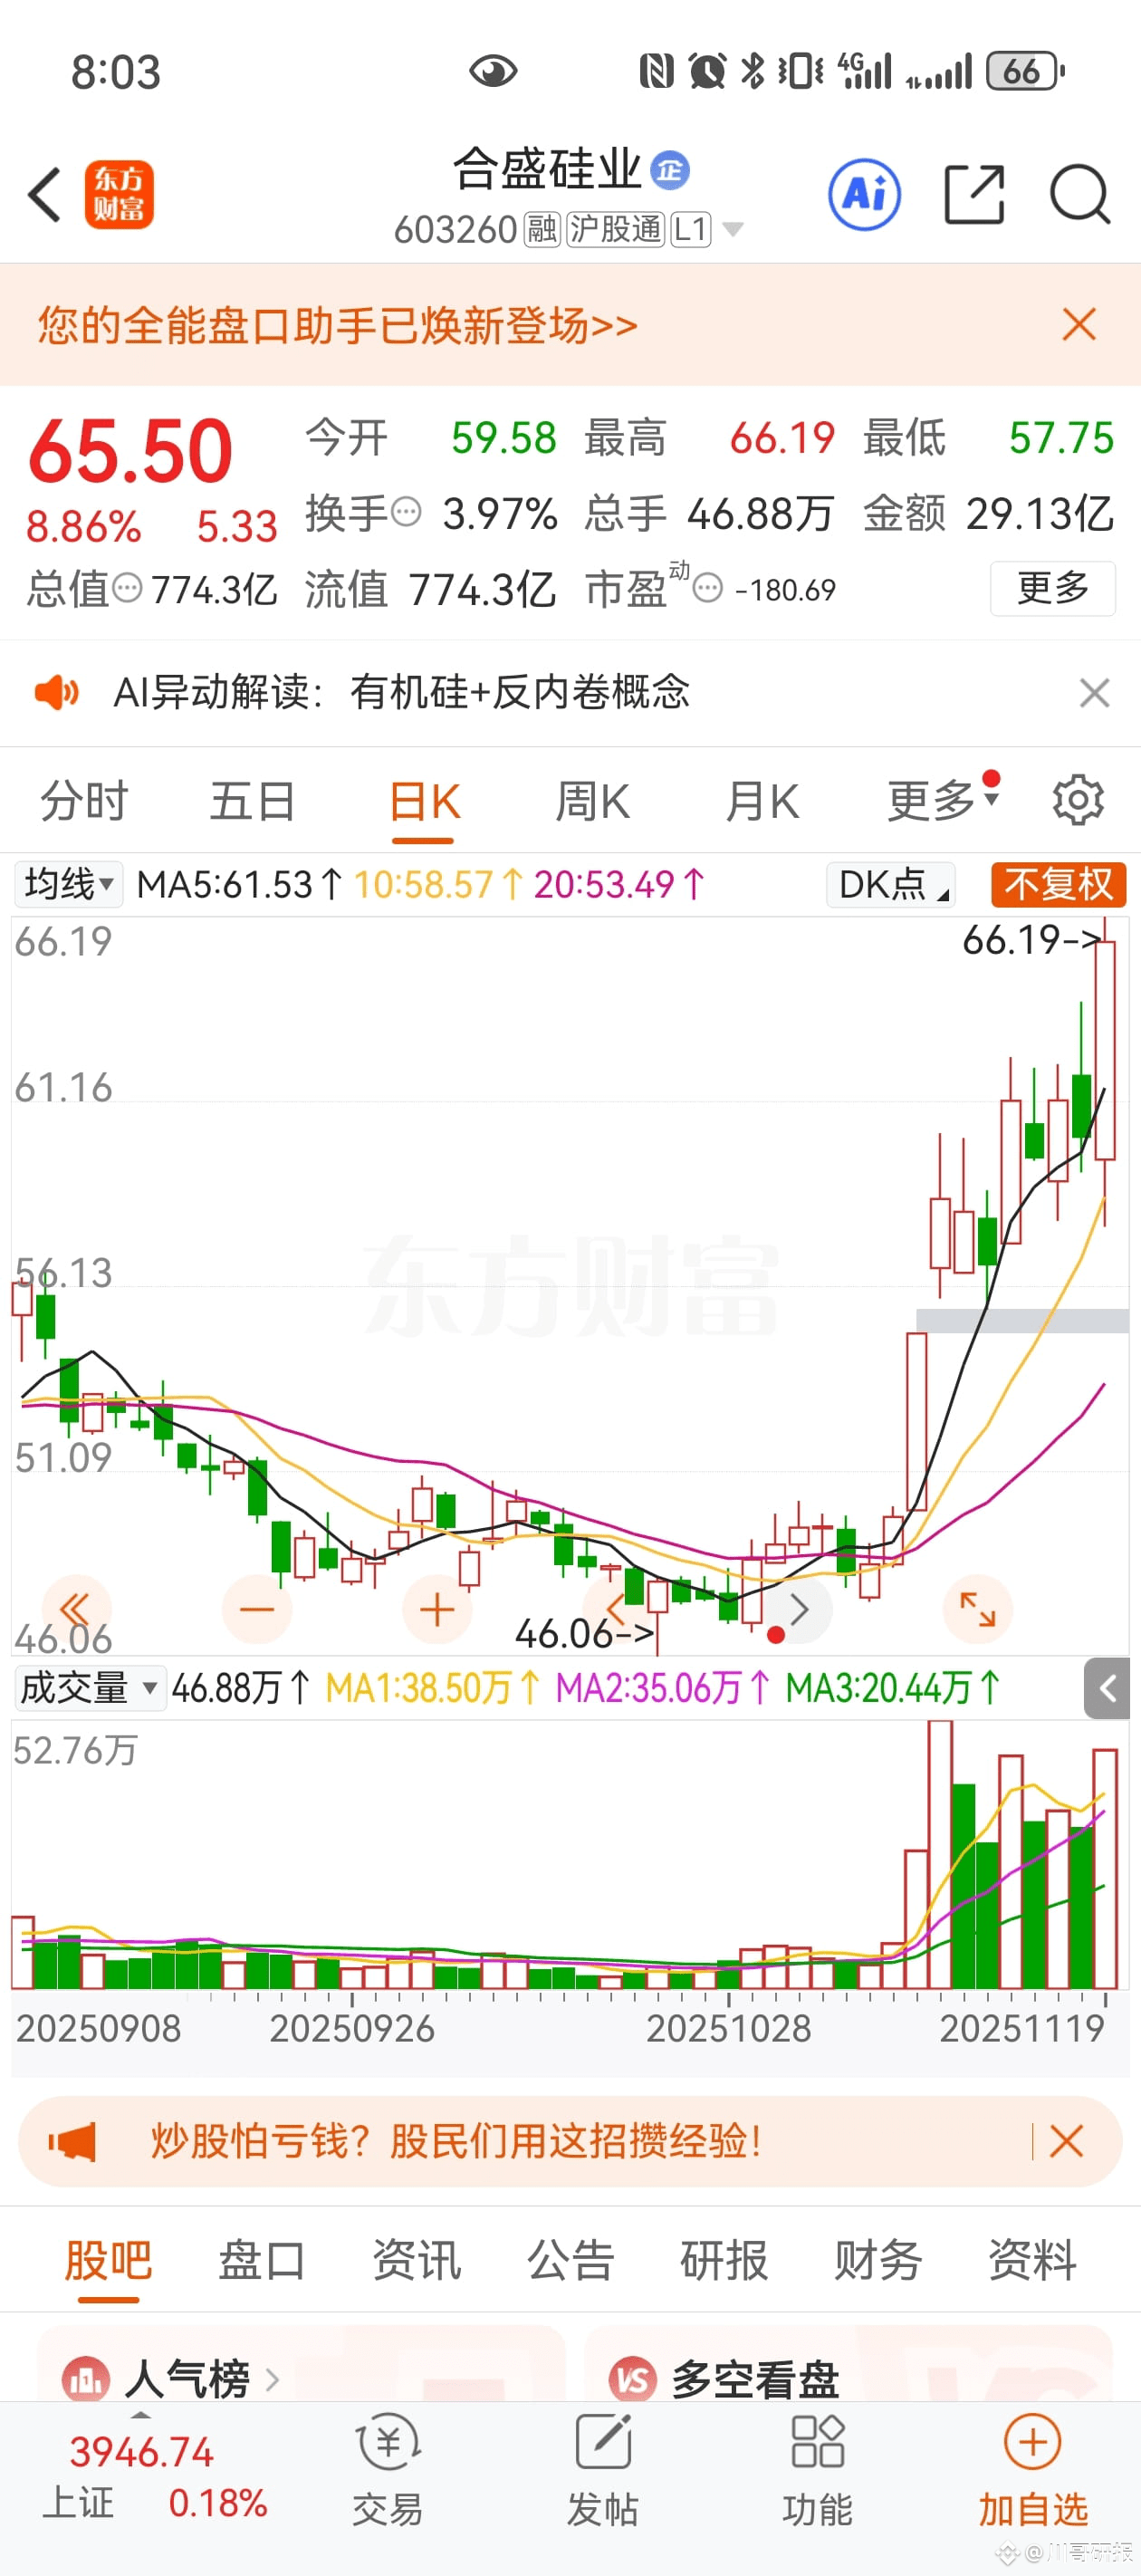
The current market situation is not workable, is there anyone playing with ancient tickets? I will create a camp.
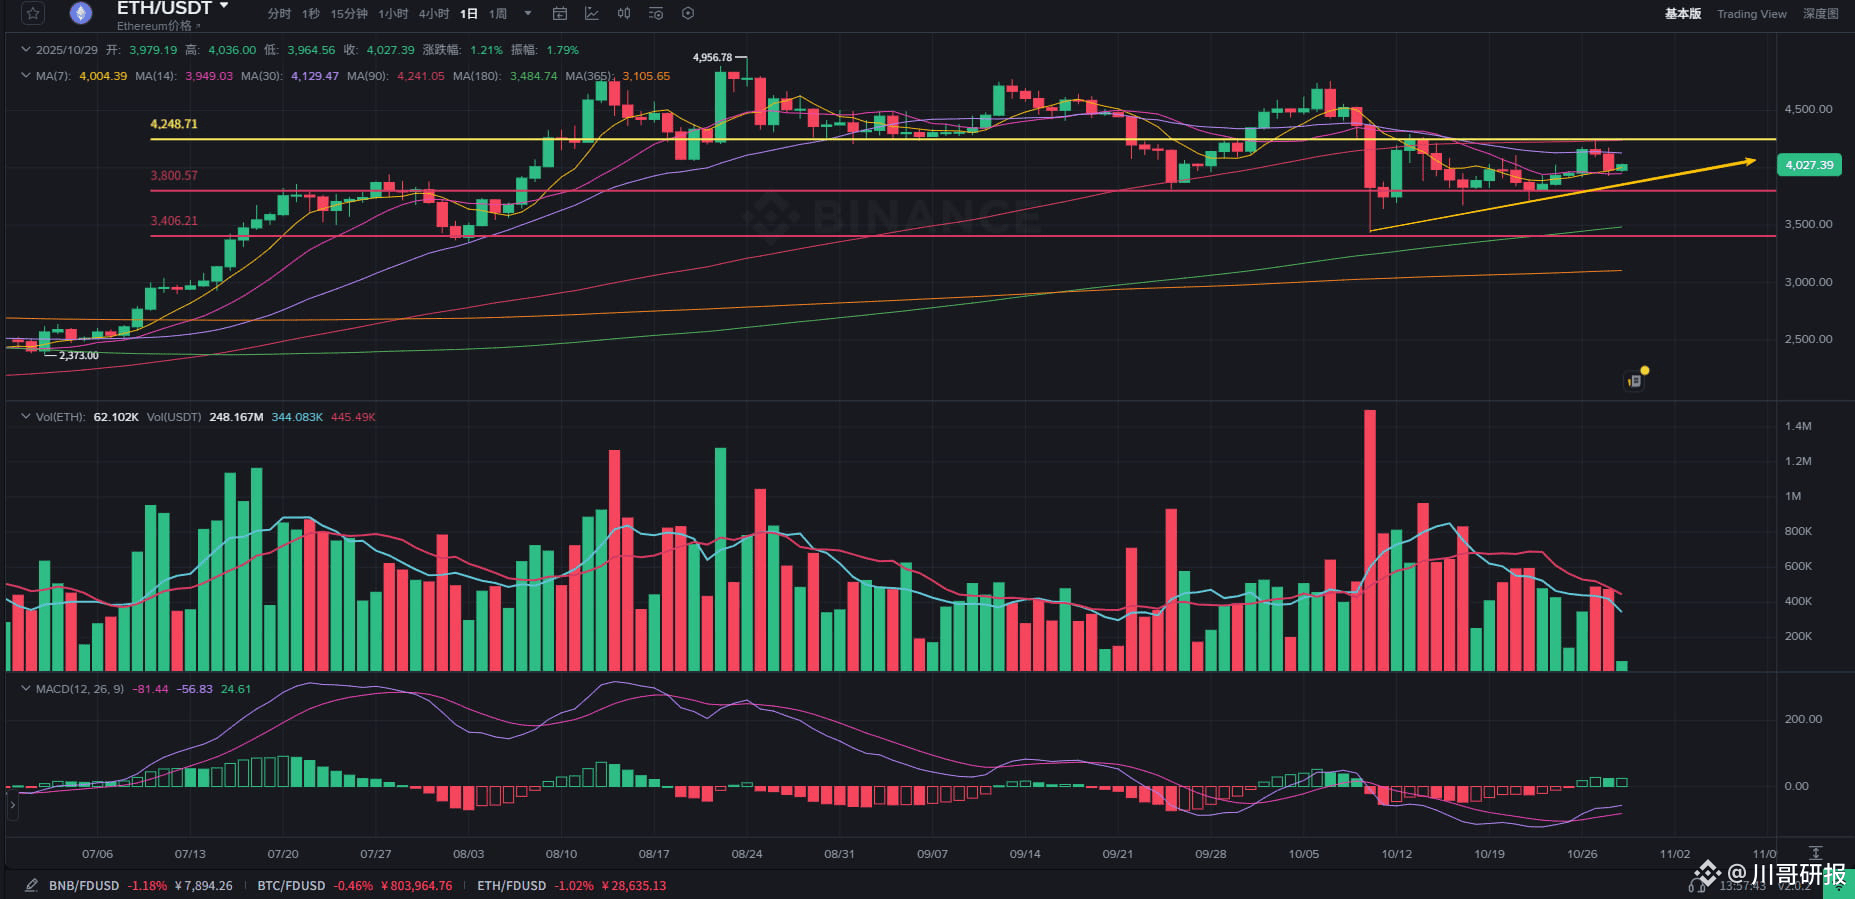
October 29th ETH Market Interpretation and Trading Suggestions:
Ethereum is currently in a short-term consolidation period under a mid-term upward trend framework. During the recent two trading days' pullback, the K-line retreated to the short-term moving average (MA7/MA14) area, successfully filling the technical gap left by the weekend's upward trend, completing a phase repair.
The short-term moving averages maintain a golden cross extending upward, and the K-line overall keeps a fluctuating upward rhythm, with the core upward structure showing no substantial damage. From a volume perspective, recent trading volume continues to contract, especially during the rebound, where the volume support is insufficient, reflecting a heavy market sentiment of caution and indicating that the current market lacks the momentum support to drive a main upward wave.
The MACD indicator shows a low-position golden cross pattern, with the histogram's positive value range gradually expanding, releasing signals of slowly recovering rebound momentum; however, as the indicator overall is still operating below the zero axis, this golden cross is of a weak repair nature, and the market has not entered a clear strong trend zone.
Regarding future trends, it is crucial to focus on whether the coin price can break through the 4250 level in the short term over the next 1-3 trading days: if successfully broken, it will form a small double bottom technical structure, and the upper space is expected to open further, with targets looking towards the 4500-4700 range. In terms of intraday operations, attention should be paid to the effectiveness of support in the 3970-4010 range, which is a key reference point for bullish strategies; above, one should note the pressure intensity in the 4100-4150 range.
Ethereum is currently in a short-term consolidation period under a mid-term upward trend framework. During the recent two trading days' pullback, the K-line retreated to the short-term moving average (MA7/MA14) area, successfully filling the technical gap left by the weekend's upward trend, completing a phase repair.
The short-term moving averages maintain a golden cross extending upward, and the K-line overall keeps a fluctuating upward rhythm, with the core upward structure showing no substantial damage. From a volume perspective, recent trading volume continues to contract, especially during the rebound, where the volume support is insufficient, reflecting a heavy market sentiment of caution and indicating that the current market lacks the momentum support to drive a main upward wave.
The MACD indicator shows a low-position golden cross pattern, with the histogram's positive value range gradually expanding, releasing signals of slowly recovering rebound momentum; however, as the indicator overall is still operating below the zero axis, this golden cross is of a weak repair nature, and the market has not entered a clear strong trend zone.
Regarding future trends, it is crucial to focus on whether the coin price can break through the 4250 level in the short term over the next 1-3 trading days: if successfully broken, it will form a small double bottom technical structure, and the upper space is expected to open further, with targets looking towards the 4500-4700 range. In terms of intraday operations, attention should be paid to the effectiveness of support in the 3970-4010 range, which is a key reference point for bullish strategies; above, one should note the pressure intensity in the 4100-4150 range.
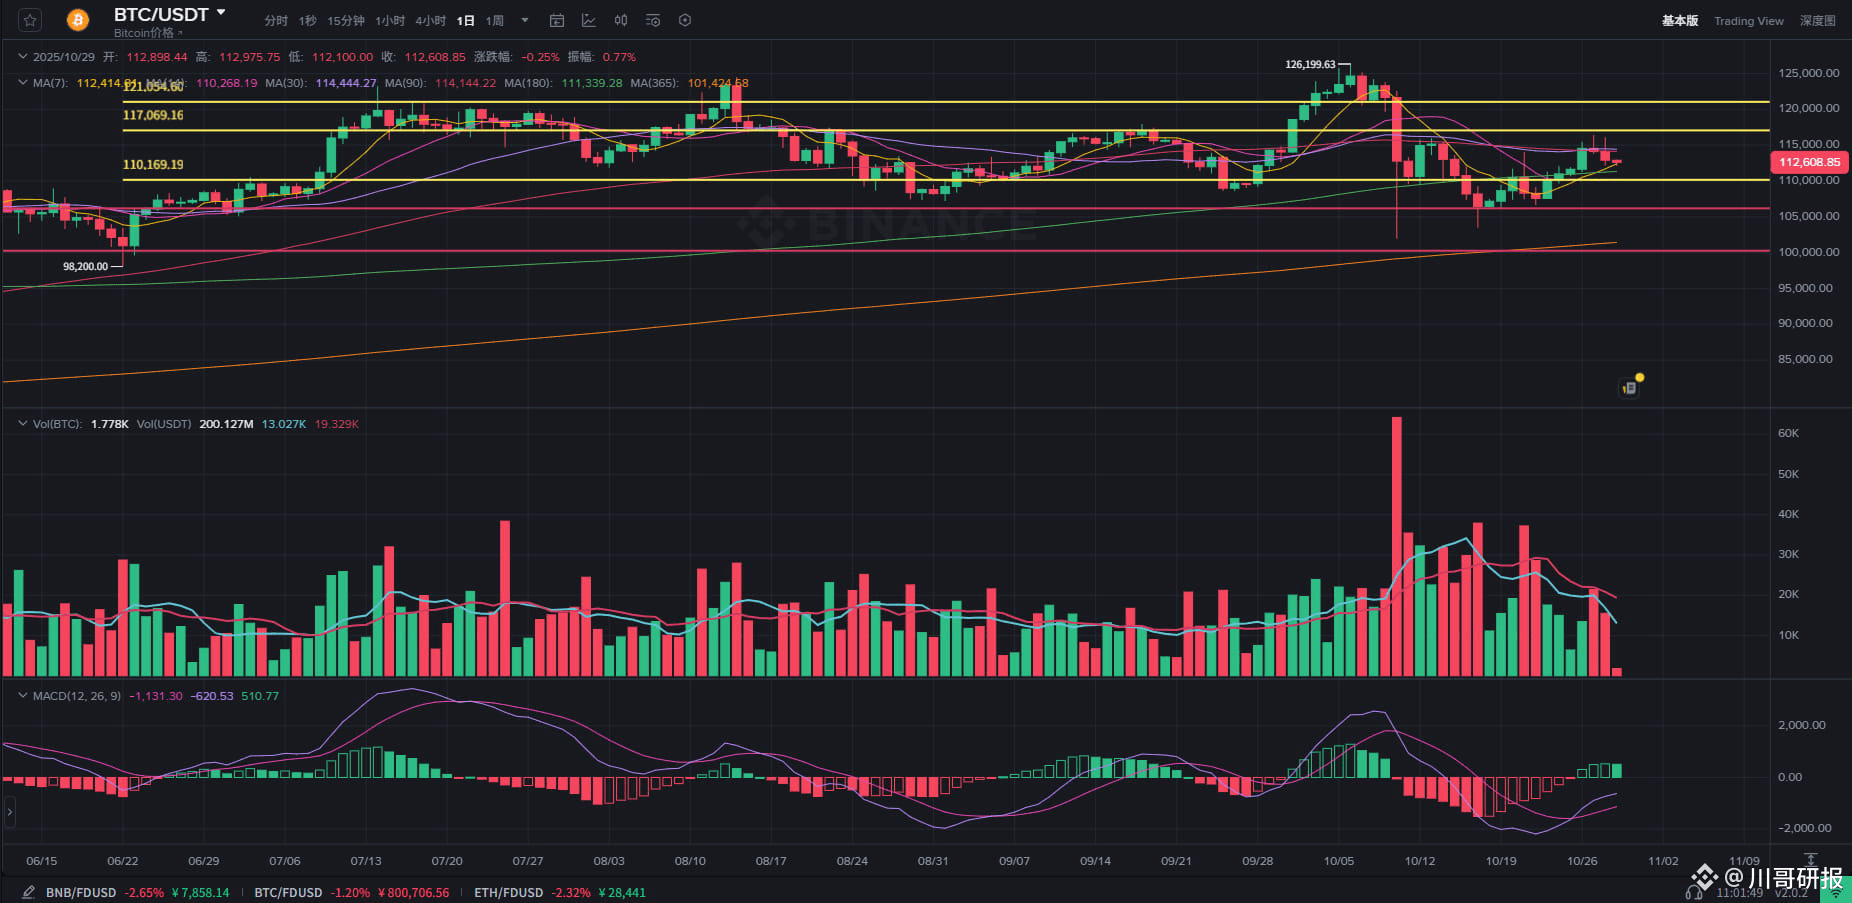
October 29th BTC Market Interpretation and Trading Suggestions:
The Bitcoin daily chart shows a pattern of two consecutive trading days with a high followed by a pullback and closing in the red. This price behavior reflects a conservative market sentiment, with insufficient rebound momentum and a lack of new funds entering to support the price, indicating that the market has entered a phase of consolidation.
The short-term moving average (MA7) maintains a bullish arrangement, with the current K-line operating above the MA7 average. This signal indicates that the short-term upward trend has not fundamentally changed. The medium-term averages (MA30 and MA90) are flattening out, forming the main resistance barrier in the recent price upward process.
Trading volume shows a continuous shrinking trend, and the buying power in the market has significantly weakened, highlighting a strong wait-and-see sentiment from the capital side. In terms of the MACD indicator, the histogram's positive area is gradually expanding, but since the golden cross formed below the zero axis and is diverging upwards, it represents a typical weak rebound golden cross signal.
At 2 AM today, the Federal Reserve will announce its interest rate decision, with the market widely expecting a 25 basis point rate cut. Under this macroeconomic support of liquidity easing, if the market can achieve a volume increase and stabilize above the 115K mark, then the price adjustment of the past two days can be defined as a normal technical correction, seen as a washout action to clear floating capital before the market rises, and subsequent prices are expected to launch a new round of assault towards the resistance zone of 121-125K.
In terms of intraday trading strategy, it is essential to focus on the support strength in the 111.5-112.5K range below; this area can serve as a core observation point for bullish opportunities. Above, attention should be paid to the pressure situation in the 114.5-115.5K range.
The Bitcoin daily chart shows a pattern of two consecutive trading days with a high followed by a pullback and closing in the red. This price behavior reflects a conservative market sentiment, with insufficient rebound momentum and a lack of new funds entering to support the price, indicating that the market has entered a phase of consolidation.
The short-term moving average (MA7) maintains a bullish arrangement, with the current K-line operating above the MA7 average. This signal indicates that the short-term upward trend has not fundamentally changed. The medium-term averages (MA30 and MA90) are flattening out, forming the main resistance barrier in the recent price upward process.
Trading volume shows a continuous shrinking trend, and the buying power in the market has significantly weakened, highlighting a strong wait-and-see sentiment from the capital side. In terms of the MACD indicator, the histogram's positive area is gradually expanding, but since the golden cross formed below the zero axis and is diverging upwards, it represents a typical weak rebound golden cross signal.
At 2 AM today, the Federal Reserve will announce its interest rate decision, with the market widely expecting a 25 basis point rate cut. Under this macroeconomic support of liquidity easing, if the market can achieve a volume increase and stabilize above the 115K mark, then the price adjustment of the past two days can be defined as a normal technical correction, seen as a washout action to clear floating capital before the market rises, and subsequent prices are expected to launch a new round of assault towards the resistance zone of 121-125K.
In terms of intraday trading strategy, it is essential to focus on the support strength in the 111.5-112.5K range below; this area can serve as a core observation point for bullish opportunities. Above, attention should be paid to the pressure situation in the 114.5-115.5K range.
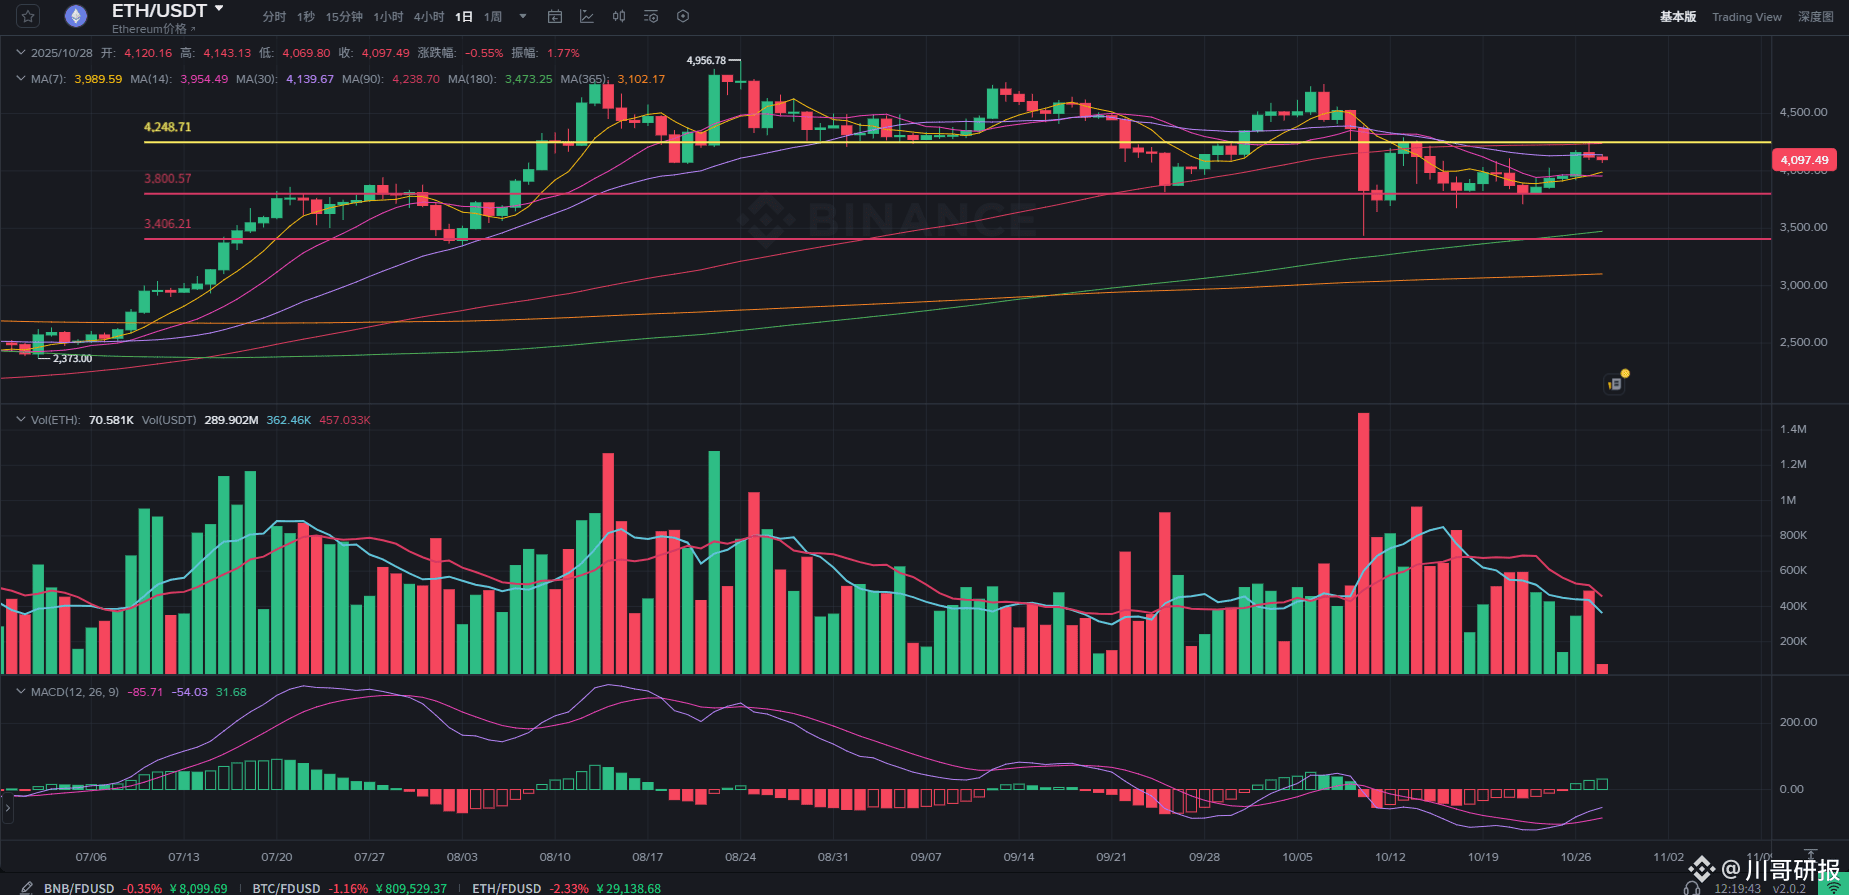
October 28th ETH Market Analysis and Trading Suggestions:
Ethereum (ETH) closed yesterday with a small bearish candle with an upper shadow on the daily chart, reaching a maximum price of 4250 before retreating. This movement not only confirms the significant resistance at the lower boundary of the range around 4250 established in early September but also reflects the current market's lack of upward momentum. However, the overall decline has been orderly, with no panic selling observed.
From a structural perspective, the core support area for ETH is located in the 3800-3950 range. If the market can break through the key resistance at 4250 with increased volume, it will confirm the formation of a double bottom reversal pattern, with an upward target range set at 4500-4700 points. Conversely, if the rebound lacks strength and momentum decreases, the price may retest the support zone of 3950-3800, confirming the bottom area a second time.
From a short-term technical perspective, although the moving averages have formed a golden cross and are moving upward, the price has been oscillating below the moving average convergence zone, indicating that the current trend has not yet completed a thorough reversal. In the short term, only by breaking through the resistance zone formed by the MA30 to MA60 moving averages (4150-4250 range) can the continuation of the rebound trend be formally established.
In terms of trading volume, the recent market volume has shown a significant shrinking trend, which intuitively reflects the current cautious and wait-and-see sentiment of investors. It is particularly important to note that to effectively break through the 4200-4250 resistance range, it must be accompanied by a significant increase in trading volume to be considered a valid breakout signal; otherwise, false breakout scenarios may easily occur.
Regarding the MACD technical indicator, it has completed a golden cross below the 0 axis and is continuously diverging upward, with the red energy bars steadily expanding, and the volume performance is acceptable. This provides some technical support for the continuation of the rebound trend. However, due to the lack of strong volume to support it, the current rebound strength has not yet reached a strong level.
For the subsequent short-term market in the next 1-3 trading days, if the ETH price can stabilize above the 4000 round number and simultaneously break through the 4250 resistance level with increased volume, it will formally confirm the right-side reversal signal, with the potential to advance towards the target range of 4500-4700 points.
In terms of intraday trading strategy, it is crucial to focus on the effectiveness of support in the 4080-4030 range, as this area can serve as an important reference for bullish positioning; on the upper side, close attention should be paid to the pressure situation in the 4150-4200 range, which is a key node for whether the intraday market can further expand upward.
Ethereum (ETH) closed yesterday with a small bearish candle with an upper shadow on the daily chart, reaching a maximum price of 4250 before retreating. This movement not only confirms the significant resistance at the lower boundary of the range around 4250 established in early September but also reflects the current market's lack of upward momentum. However, the overall decline has been orderly, with no panic selling observed.
From a structural perspective, the core support area for ETH is located in the 3800-3950 range. If the market can break through the key resistance at 4250 with increased volume, it will confirm the formation of a double bottom reversal pattern, with an upward target range set at 4500-4700 points. Conversely, if the rebound lacks strength and momentum decreases, the price may retest the support zone of 3950-3800, confirming the bottom area a second time.
From a short-term technical perspective, although the moving averages have formed a golden cross and are moving upward, the price has been oscillating below the moving average convergence zone, indicating that the current trend has not yet completed a thorough reversal. In the short term, only by breaking through the resistance zone formed by the MA30 to MA60 moving averages (4150-4250 range) can the continuation of the rebound trend be formally established.
In terms of trading volume, the recent market volume has shown a significant shrinking trend, which intuitively reflects the current cautious and wait-and-see sentiment of investors. It is particularly important to note that to effectively break through the 4200-4250 resistance range, it must be accompanied by a significant increase in trading volume to be considered a valid breakout signal; otherwise, false breakout scenarios may easily occur.
Regarding the MACD technical indicator, it has completed a golden cross below the 0 axis and is continuously diverging upward, with the red energy bars steadily expanding, and the volume performance is acceptable. This provides some technical support for the continuation of the rebound trend. However, due to the lack of strong volume to support it, the current rebound strength has not yet reached a strong level.
For the subsequent short-term market in the next 1-3 trading days, if the ETH price can stabilize above the 4000 round number and simultaneously break through the 4250 resistance level with increased volume, it will formally confirm the right-side reversal signal, with the potential to advance towards the target range of 4500-4700 points.
In terms of intraday trading strategy, it is crucial to focus on the effectiveness of support in the 4080-4030 range, as this area can serve as an important reference for bullish positioning; on the upper side, close attention should be paid to the pressure situation in the 4150-4200 range, which is a key node for whether the intraday market can further expand upward.
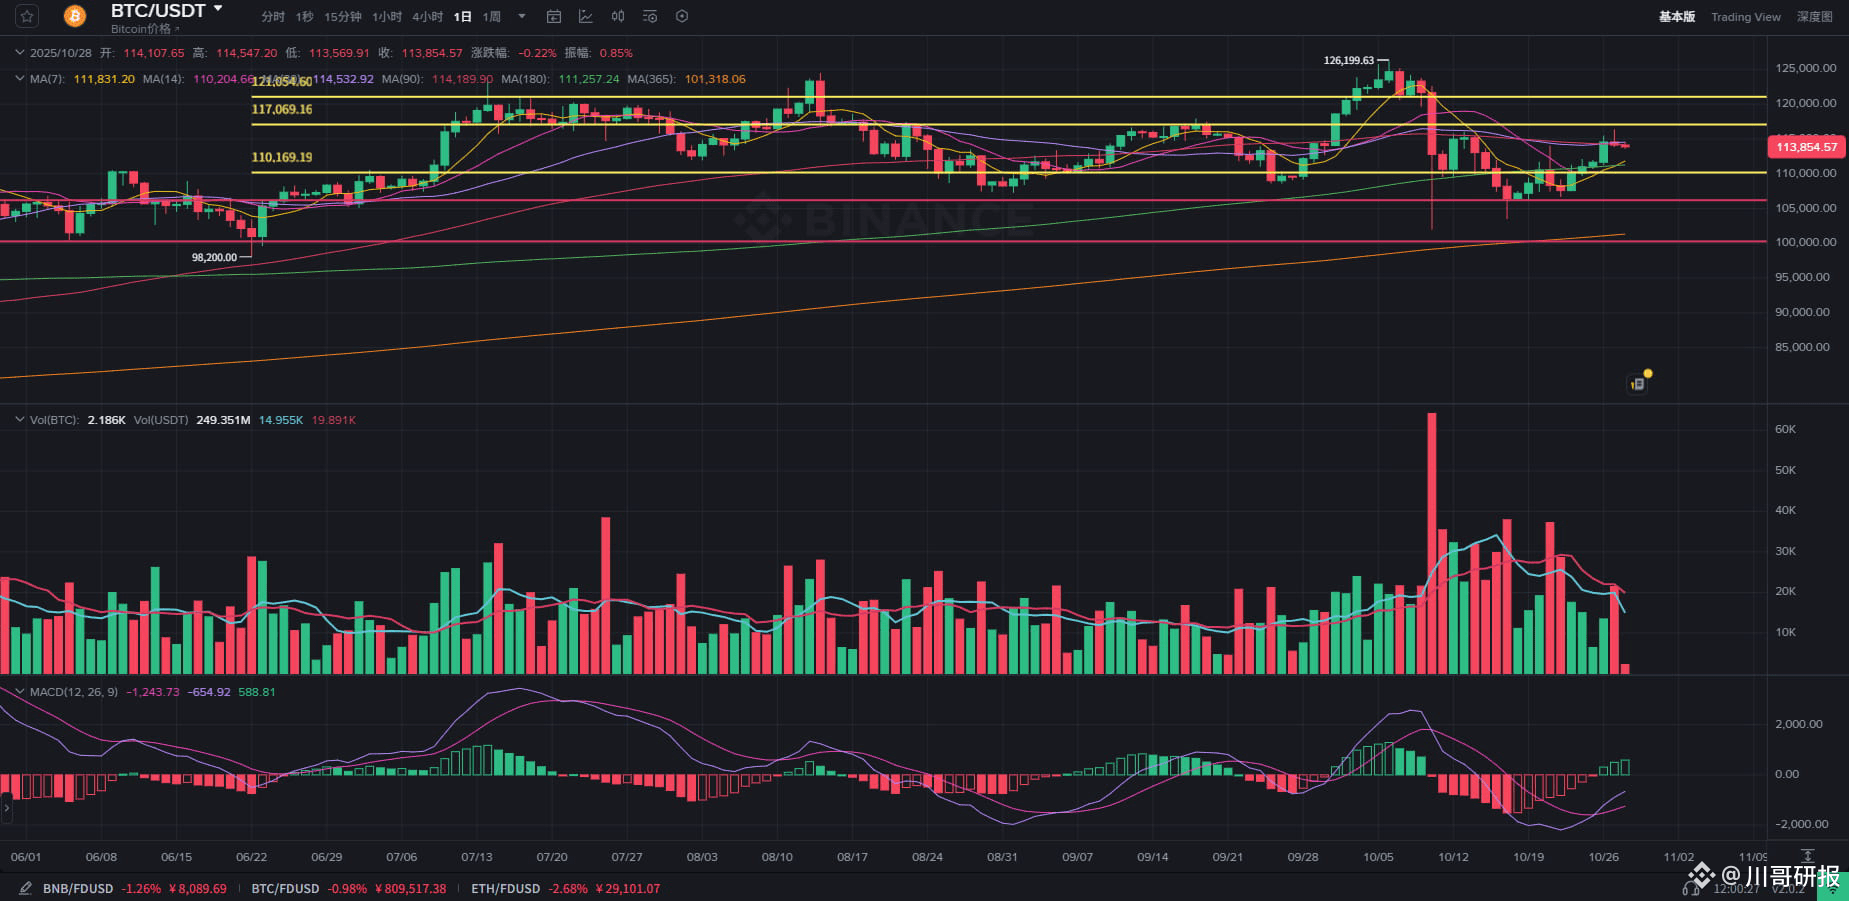
October 28th BTC Market Analysis and Trading Suggestions:
Bitcoin (BTC) showed a high-to-low trend on the daily chart yesterday, ultimately closing with a long upper shadow in a bearish candlestick pattern. This trend clearly indicates that both bulls and bears engaged in a fierce battle at the 116,000 level, with competition being exceptionally apparent. The current daily level has entered the final stage of a medium-term adjustment, and the overall market is in a process of consolidating and building a bottom. After effectively confirming the support below, the price is gradually beginning to recover; however, the resistance from above should not be ignored, and the overall market pattern leans towards a neutral to bullish stance.
Short-term moving averages (MA7 and MA14) continue to extend upward, with the K-line price consistently relying on the short-term averages for upward movement, indicating that a short-term recovery trend has already formed. However, the current price is being pressured by the MA30 average (approximately 114,500), and once this key resistance level is broken, the market is likely to open up new upward space.
In terms of trading volume, after the previous increase in bearish volume, the volume has shown a gradual decline, signaling that the panic selling in the market has largely been exhausted. From the recent volume-price coordination, prices are steadily rising under shrinking volume, while in the downtrend, trading volume has moderately increased, reflecting that bottom-fishing funds are gradually entering the market.
The MACD technical indicator completed a golden cross below the zero axis and is showing an upward divergence trend, with the values of the red energy bars continuously expanding, indicating that the rebound momentum in the short-term market is steadily accumulating.
For the subsequent market trend, within the short-term 1-3 trading days, if the price can break through the 115,000 whole number level with increasing volume, it will officially establish a short-term upward structure, with upward targets looking towards the 121,000-125,000 range. Conversely, if there is no effective breakthrough over three consecutive trading days, it is highly probable that the sideways consolidation in the 111,000-115,000 range will continue.
In terms of intraday trading strategies, it is essential to focus on the support strength in the 113,500-112,500 range below, as this area can serve as a key reference for bullish positioning; above, it is crucial to pay attention to the pressure situation in the 115,000-116,000 range, as this position is the core node for whether the short-term market can further open up space.
Bitcoin (BTC) showed a high-to-low trend on the daily chart yesterday, ultimately closing with a long upper shadow in a bearish candlestick pattern. This trend clearly indicates that both bulls and bears engaged in a fierce battle at the 116,000 level, with competition being exceptionally apparent. The current daily level has entered the final stage of a medium-term adjustment, and the overall market is in a process of consolidating and building a bottom. After effectively confirming the support below, the price is gradually beginning to recover; however, the resistance from above should not be ignored, and the overall market pattern leans towards a neutral to bullish stance.
Short-term moving averages (MA7 and MA14) continue to extend upward, with the K-line price consistently relying on the short-term averages for upward movement, indicating that a short-term recovery trend has already formed. However, the current price is being pressured by the MA30 average (approximately 114,500), and once this key resistance level is broken, the market is likely to open up new upward space.
In terms of trading volume, after the previous increase in bearish volume, the volume has shown a gradual decline, signaling that the panic selling in the market has largely been exhausted. From the recent volume-price coordination, prices are steadily rising under shrinking volume, while in the downtrend, trading volume has moderately increased, reflecting that bottom-fishing funds are gradually entering the market.
The MACD technical indicator completed a golden cross below the zero axis and is showing an upward divergence trend, with the values of the red energy bars continuously expanding, indicating that the rebound momentum in the short-term market is steadily accumulating.
For the subsequent market trend, within the short-term 1-3 trading days, if the price can break through the 115,000 whole number level with increasing volume, it will officially establish a short-term upward structure, with upward targets looking towards the 121,000-125,000 range. Conversely, if there is no effective breakthrough over three consecutive trading days, it is highly probable that the sideways consolidation in the 111,000-115,000 range will continue.
In terms of intraday trading strategies, it is essential to focus on the support strength in the 113,500-112,500 range below, as this area can serve as a key reference for bullish positioning; above, it is crucial to pay attention to the pressure situation in the 115,000-116,000 range, as this position is the core node for whether the short-term market can further open up space.
October 27 ETH Market Interpretation and Trading Strategy:
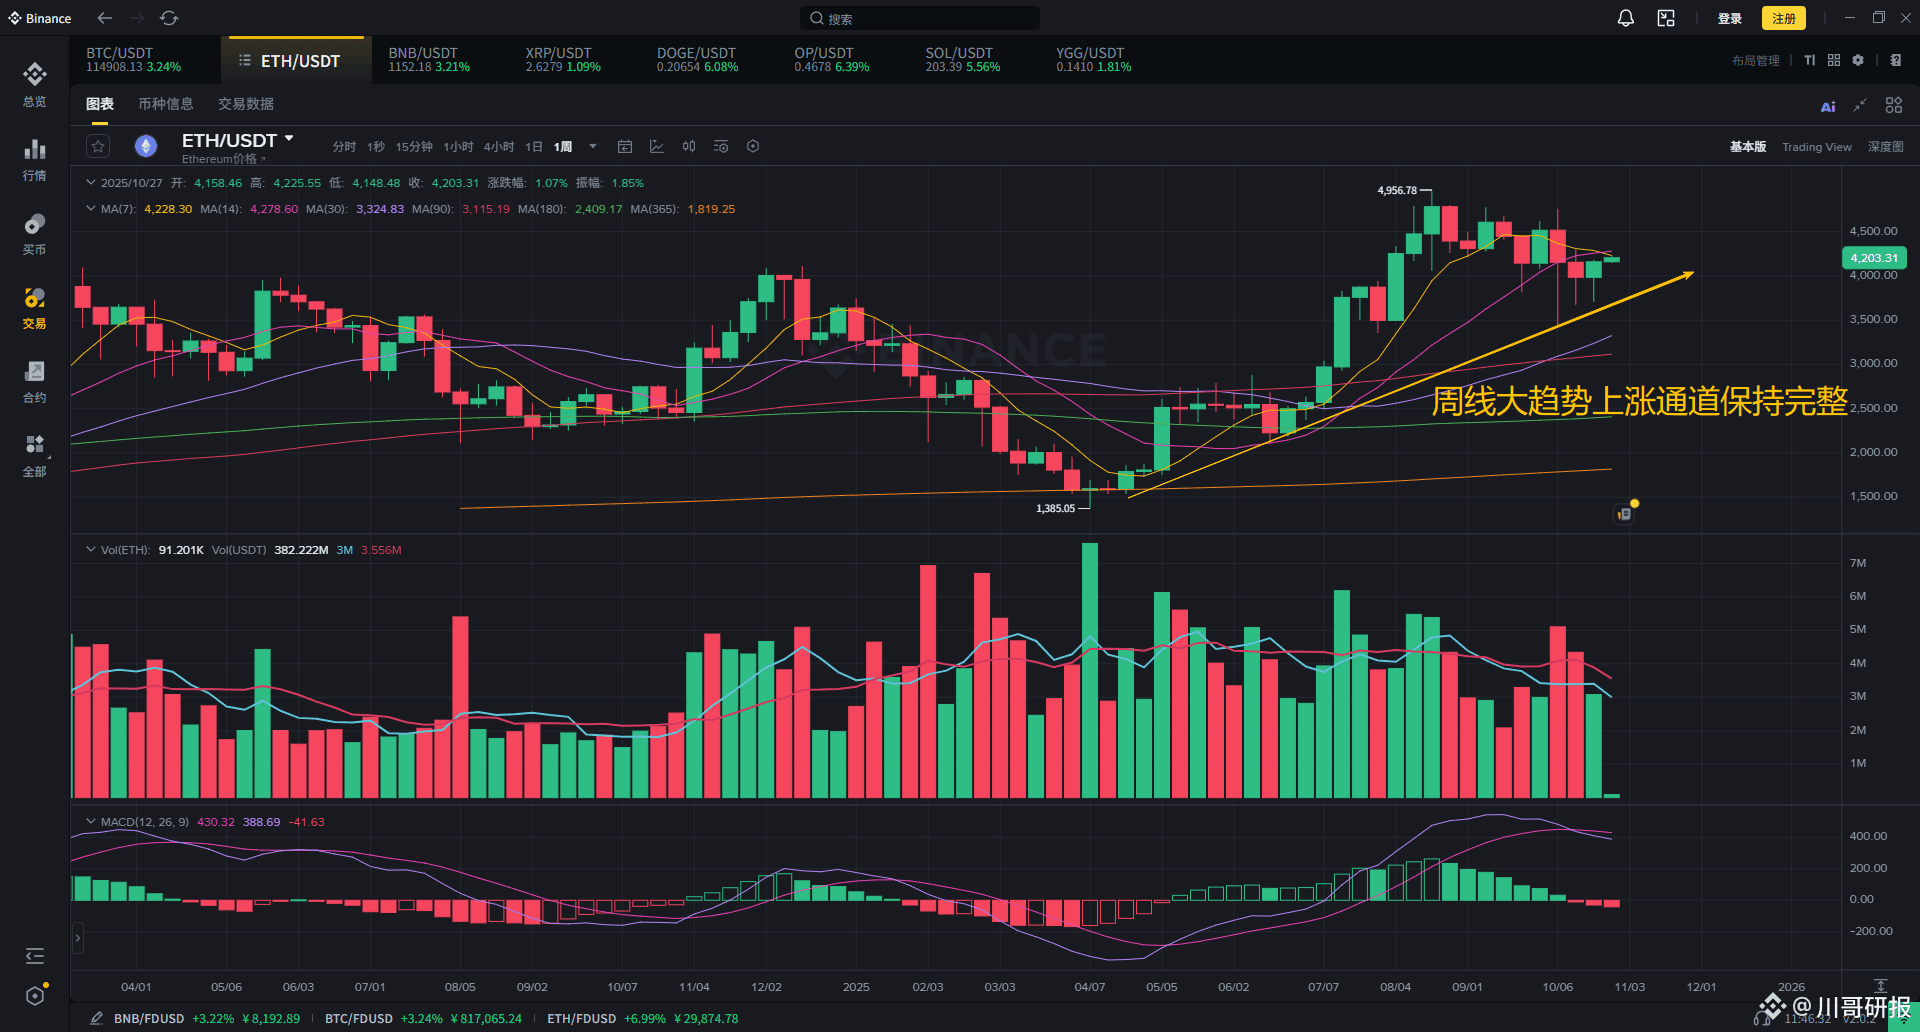
The weekly chart shows a three-pin bottoming pattern, and last week closed with a long lower shadow bullish candle; although the previously emphasized 4250 point reversal level has not yet been broken, the current trend indicates that the probability of a breakout has significantly increased, and the overall weekly candlestick pattern remains in an upward channel without signs of trend failure.
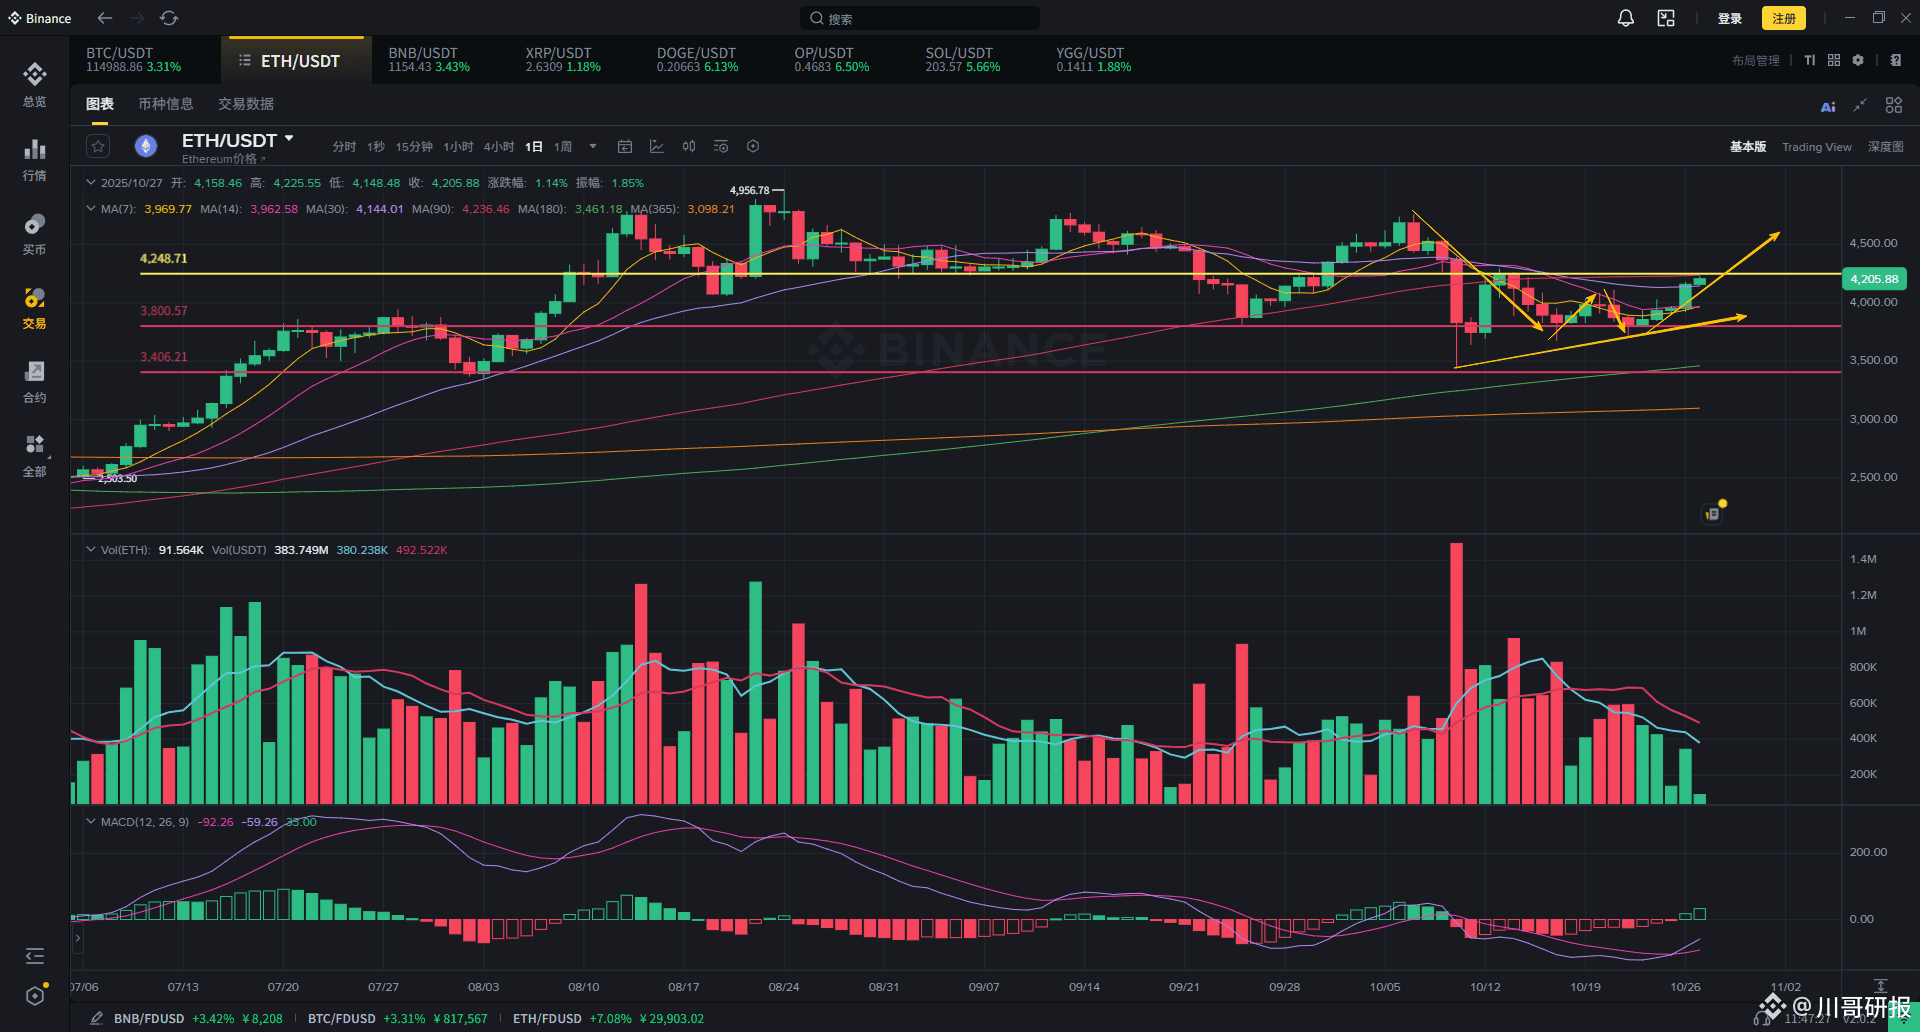
From a daily chart perspective, the technical indicators are signaling a strong repair and trend restart, and the market has entered a rebound confirmation phase, possessing mid-term potential for a renewed upward attack. Since the large bearish candle drop on October 11, ETH has tested the 3800 point level twice without breaking it, successfully forming a standard V-shaped rebound prototype, and the current pattern is approaching the preparatory phase for a right-side breakout of a double bottom structure. If a breakout occurs with increased trading volume above 4250 points, it will officially establish a double bottom neckline breakout, with technical targets looking towards 4500 points; the 4500-4700 range will form a key resistance band, and if this range can be further broken, ETH is likely to see prices enter the 5000 point range.
Short-term moving averages (MA7/14) have both turned upwards and completed a golden cross, and the candlestick has stabilized above the short-term moving average, which is a typical rebound confirmation signal. Although the current trading volume has not yet reached the standard for a main upward wave explosion, there has been a significant increase compared to the bottom phase, reflecting that market participants are actively buying the dip. In terms of the MACD indicator, the two lines have formed a golden cross below the zero axis, with the histogram turning from negative to positive, indicating that bearish momentum has basically dissipated, and the short-term rebound structure is officially established; if the indicator histogram can continue to expand in the next three days, it will further confirm a mid-term trend reversal.
In the subsequent market, the 4250 point level is the core confirmation line for the reversal trend, and the 4500-4700 range is the key obstacle for ETH to advance towards the 5000 point level. For intra-day operations, pay close attention to the support strength in the 4180-4130 point range below; when it stabilizes during a pullback, bullish opportunities can be seized; above, focus on the pressure in the 4250-4300 point range, as the breakout situation will determine the height of the intra-day rebound.
The weekly chart shows a three-pin bottoming pattern, and last week closed with a long lower shadow bullish candle; although the previously emphasized 4250 point reversal level has not yet been broken, the current trend indicates that the probability of a breakout has significantly increased, and the overall weekly candlestick pattern remains in an upward channel without signs of trend failure.
From a daily chart perspective, the technical indicators are signaling a strong repair and trend restart, and the market has entered a rebound confirmation phase, possessing mid-term potential for a renewed upward attack. Since the large bearish candle drop on October 11, ETH has tested the 3800 point level twice without breaking it, successfully forming a standard V-shaped rebound prototype, and the current pattern is approaching the preparatory phase for a right-side breakout of a double bottom structure. If a breakout occurs with increased trading volume above 4250 points, it will officially establish a double bottom neckline breakout, with technical targets looking towards 4500 points; the 4500-4700 range will form a key resistance band, and if this range can be further broken, ETH is likely to see prices enter the 5000 point range.
Short-term moving averages (MA7/14) have both turned upwards and completed a golden cross, and the candlestick has stabilized above the short-term moving average, which is a typical rebound confirmation signal. Although the current trading volume has not yet reached the standard for a main upward wave explosion, there has been a significant increase compared to the bottom phase, reflecting that market participants are actively buying the dip. In terms of the MACD indicator, the two lines have formed a golden cross below the zero axis, with the histogram turning from negative to positive, indicating that bearish momentum has basically dissipated, and the short-term rebound structure is officially established; if the indicator histogram can continue to expand in the next three days, it will further confirm a mid-term trend reversal.
In the subsequent market, the 4250 point level is the core confirmation line for the reversal trend, and the 4500-4700 range is the key obstacle for ETH to advance towards the 5000 point level. For intra-day operations, pay close attention to the support strength in the 4180-4130 point range below; when it stabilizes during a pullback, bullish opportunities can be seized; above, focus on the pressure in the 4250-4300 point range, as the breakout situation will determine the height of the intra-day rebound.

October 27th BTC market analysis and trading strategy:
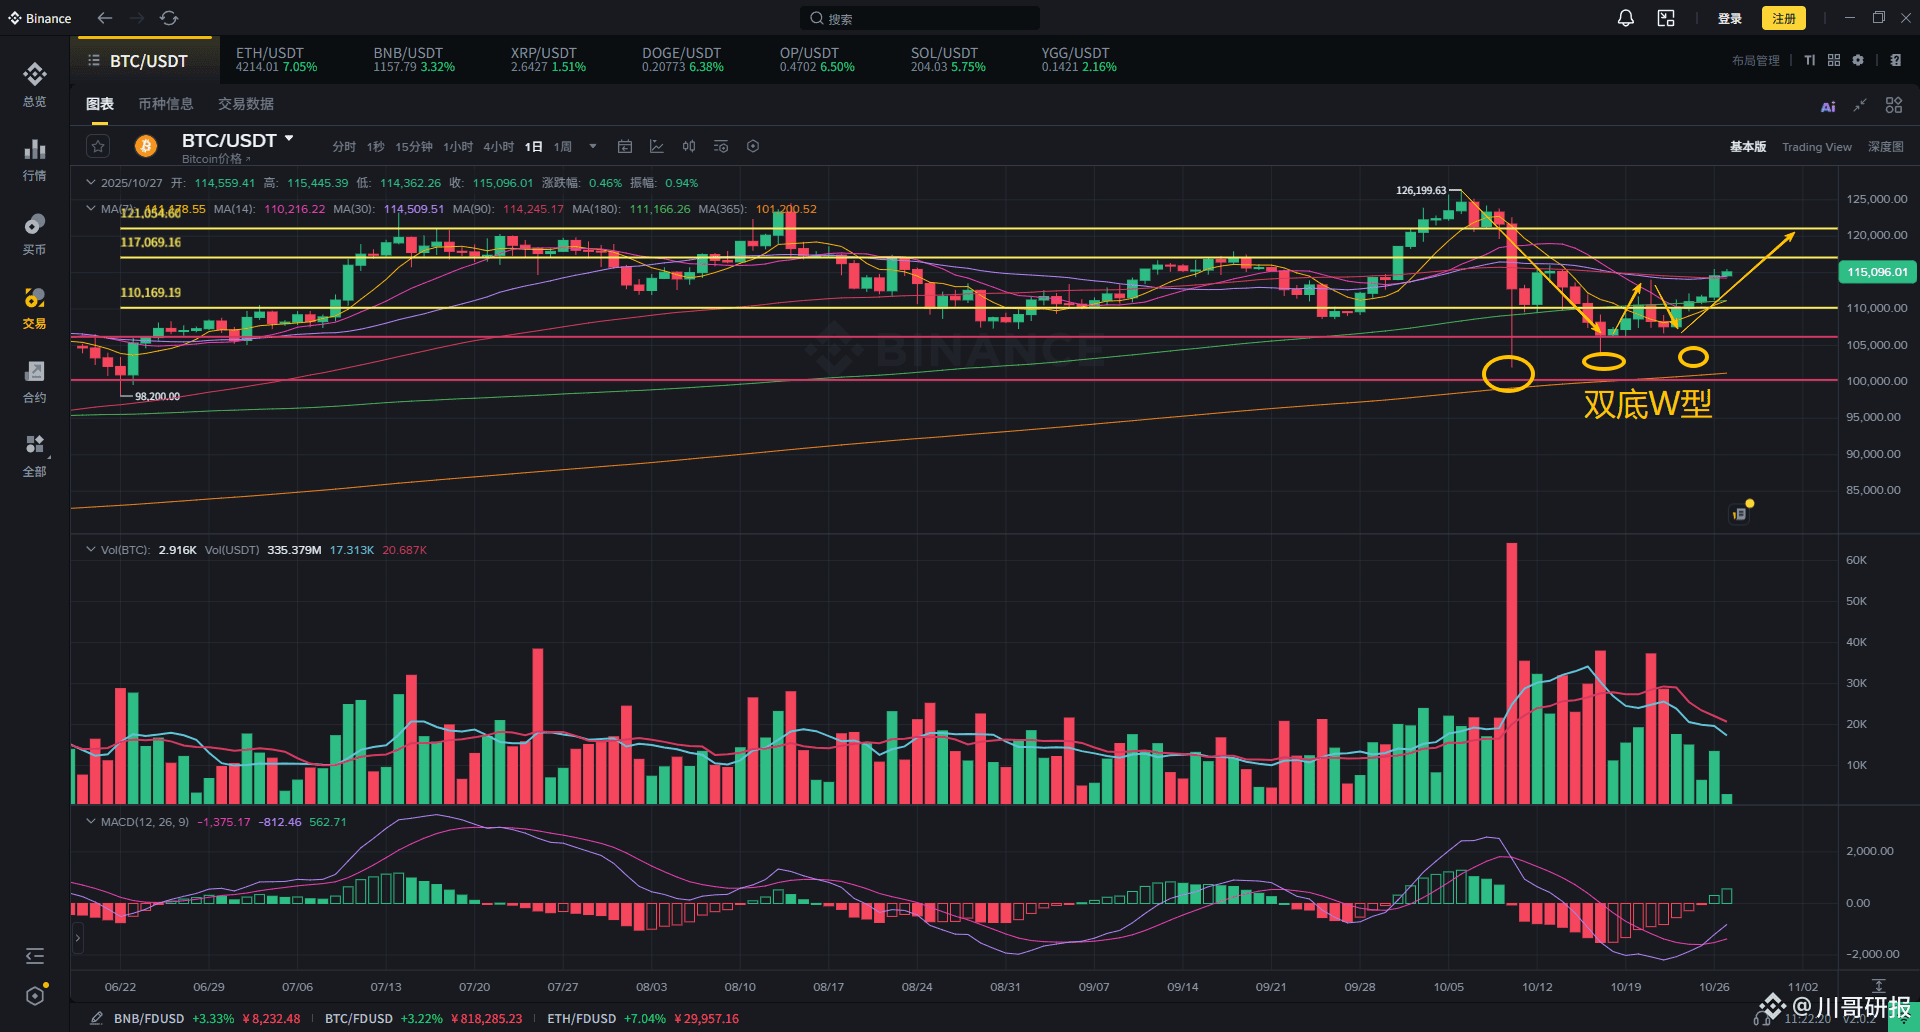
The weekly line closed with a solid bullish candle, with MA30 daily moving average support being strong, and the overall upward trend remains unchanged. The previously mentioned key resistance level of 115K is nearing a breakout. On the daily level, the rebound has entered the confirmation phase, and 115K has become a key point of contention. If it can break out with volume, it will formally establish a reversal trend. From the daily structure observation, the 105K position has confirmed a stage bottom, and the support is effective. After several pullbacks without breaking, a rebound has begun, and a 'W-shaped reversal' pattern has formed. Currently, the K line has broken through the moving average resistance, and the short-term moving averages are turning upwards, with MA7 and MA14 golden cross established. Although the mid-term moving averages (MA30/60) show signs of upward movement, the pace is slowing down, and the market has entered the 'initial phase of a second attack after mid-term adjustment'.
Although the recent trading volume has not significantly increased, the price rise is considerable, reflecting a return of main funds, and bearish momentum continues to weaken. The MACD indicator shows a standard phase reversal signal: the dual lines form a golden cross below the zero axis, the histogram turns positive and momentum continues to expand. If the subsequent MACD and volume confirm the rebound, there is hope to test the 121-125K resistance range in the short term.
Future market movements need to pay close attention to the 115.5K breakout situation (high probability of breakout). Once stabilized, it can look towards 117K, and then launch an attack on the strong resistance zone of 121-125K. The intensity of resistance in this range is particularly critical. In daily operations, focus on the support range of 114.8-113.8K below, and when it stabilizes after a pullback, bullish opportunities can be grasped; above, first pay attention to the pressure near 115.5K, and after breaking through, then look at the target of 117.5K.
The weekly line closed with a solid bullish candle, with MA30 daily moving average support being strong, and the overall upward trend remains unchanged. The previously mentioned key resistance level of 115K is nearing a breakout. On the daily level, the rebound has entered the confirmation phase, and 115K has become a key point of contention. If it can break out with volume, it will formally establish a reversal trend. From the daily structure observation, the 105K position has confirmed a stage bottom, and the support is effective. After several pullbacks without breaking, a rebound has begun, and a 'W-shaped reversal' pattern has formed. Currently, the K line has broken through the moving average resistance, and the short-term moving averages are turning upwards, with MA7 and MA14 golden cross established. Although the mid-term moving averages (MA30/60) show signs of upward movement, the pace is slowing down, and the market has entered the 'initial phase of a second attack after mid-term adjustment'.
Although the recent trading volume has not significantly increased, the price rise is considerable, reflecting a return of main funds, and bearish momentum continues to weaken. The MACD indicator shows a standard phase reversal signal: the dual lines form a golden cross below the zero axis, the histogram turns positive and momentum continues to expand. If the subsequent MACD and volume confirm the rebound, there is hope to test the 121-125K resistance range in the short term.
Future market movements need to pay close attention to the 115.5K breakout situation (high probability of breakout). Once stabilized, it can look towards 117K, and then launch an attack on the strong resistance zone of 121-125K. The intensity of resistance in this range is particularly critical. In daily operations, focus on the support range of 114.8-113.8K below, and when it stabilizes after a pullback, bullish opportunities can be grasped; above, first pay attention to the pressure near 115.5K, and after breaking through, then look at the target of 117.5K.
Shanzhai: A whale (gold) falls, and everything comes to life. Is it our turn now? With trade easing, gold has temporarily lost its allure, risk market preferences are warming up, and the crypto market is beginning to stir. The Shanzhai market shows signs of recovery, but is still in the "lurking + identification" stage. Only projects that truly possess technology, ecology, and capital coordination may become the starting point of the next wave. The previously mentioned Ethereum ecosystem L2 and staking are all following the upward trend, and the SOL ecosystem shows a strong bullish trend. Next, we will focus on privacy chains, with the leading ZEC welcoming the halving narrative, potentially leading to a tenfold market performance, reflecting the market's rekindled demand for "privacy + on-chain freedom." Infrastructure/Layer 1-2/Cross-chain hubs: With main chain congestion and rising demand for expansion, projects with ecological attractiveness have a higher chance of capital lurking opportunities. Unlocking/theme-driven projects: Although there are unlocking risks, once the unlocking period passes, if combined with "new narratives + technology realization," it may welcome a window for capital entry!

10.24BTC Intraday Market Analysis and Trading Strategy:
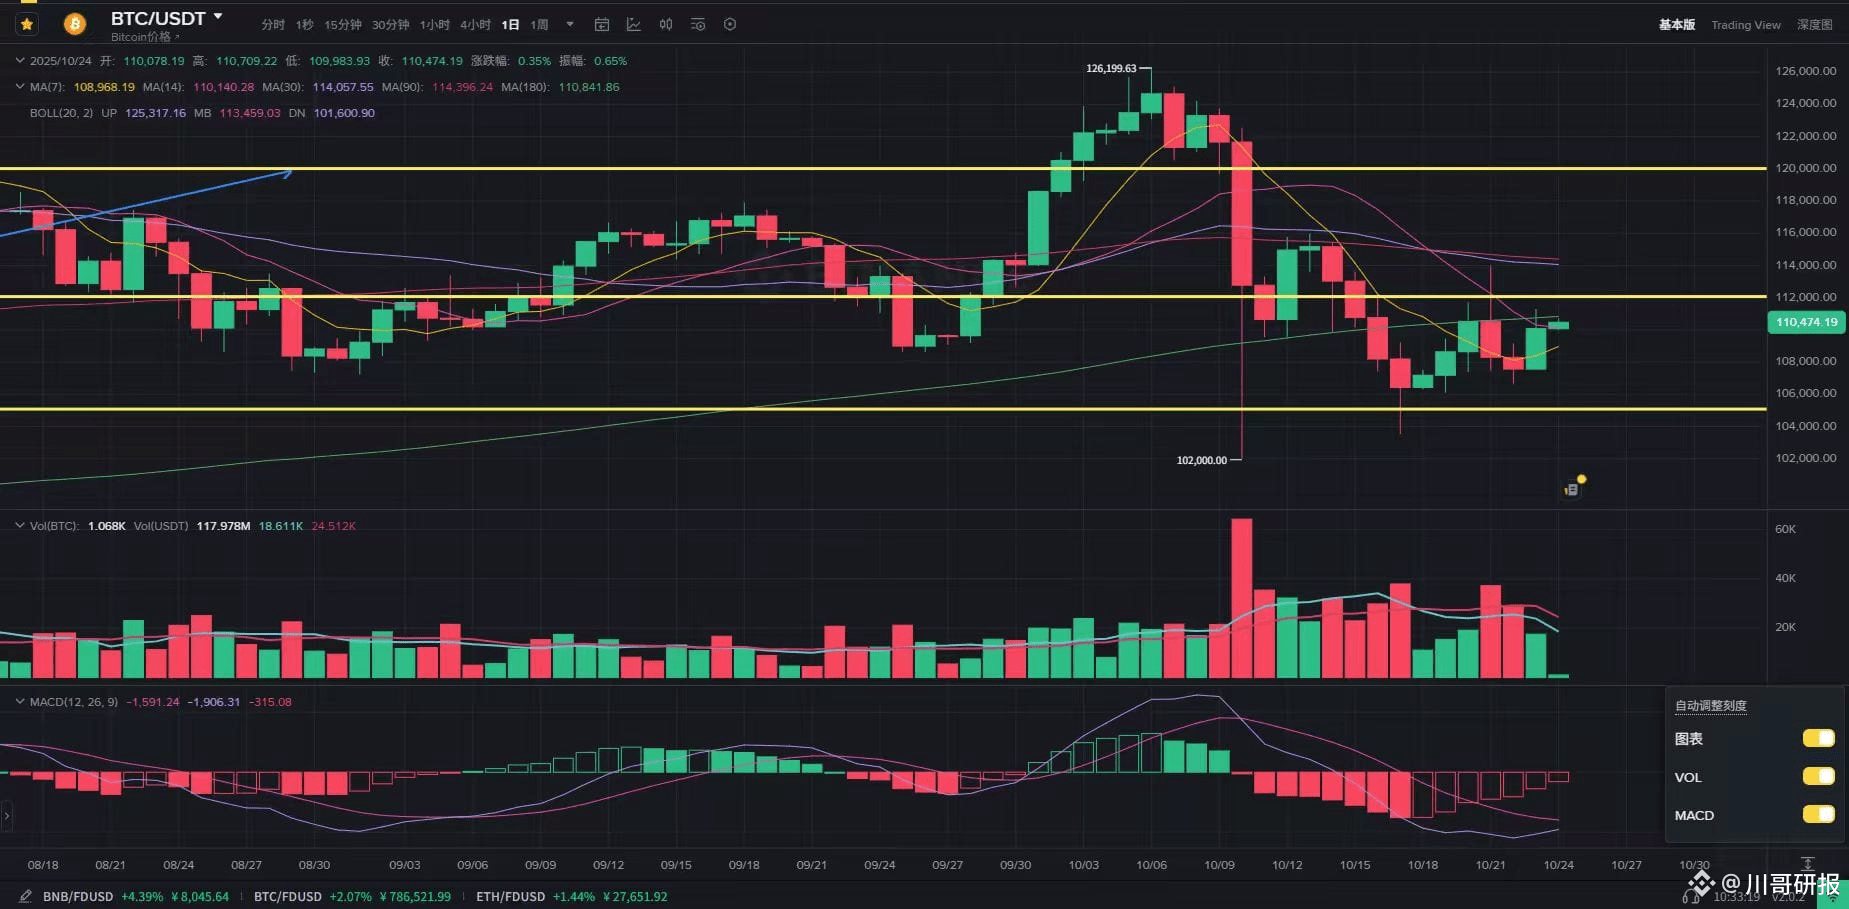
Yesterday's research report clearly indicated that in the short term (1-3 days), there is a high probability of oscillating in the range of $107,000 - $110,000, and it is important to pay attention to the resistance level at $110,300. From the actual trend, yesterday BTC reached a high near $111,000, then fell back to stabilize around $109,000, and currently has regained the $110,000 threshold, showing a tendency to continue its upward movement; from a technical perspective, the short-term 7-day moving average has turned upwards, the 14-day moving average remains flat, and the short-term bullish and bearish forces are in a delicate balance, but the resistance from the half-year line above is still strong. The previous three attempts to break through have not been able to close firmly, and the current rebound and recent rising process have always seen a shrinking volume, especially the small bullish candle trend has not been accompanied by effective volume expansion, reflecting weak bullish strength and a lack of funds to support the rebound. Meanwhile, the MACD has not shown any significant bottom divergence signal, indicating that the short-term trend reversal structure is incomplete. Overall, it is judged that Bitcoin is likely to continue oscillating in the range of $110,000 - $113,000 in the short term, with a focus on whether there will be a volume breakout from the range and a clear direction of the breakout.
In terms of intraday trading strategy, it is important to focus on the strength of support at $109,300 - $108,300 below. When the price retraces to this range and shows stabilization signals, bullish opportunities can be seized; on the upper side, attention should be paid to the pressure situation at $113,500 - $114,500. The effectiveness of breaking through this range will directly determine the intraday market's upward space.
Yesterday's research report clearly indicated that in the short term (1-3 days), there is a high probability of oscillating in the range of $107,000 - $110,000, and it is important to pay attention to the resistance level at $110,300. From the actual trend, yesterday BTC reached a high near $111,000, then fell back to stabilize around $109,000, and currently has regained the $110,000 threshold, showing a tendency to continue its upward movement; from a technical perspective, the short-term 7-day moving average has turned upwards, the 14-day moving average remains flat, and the short-term bullish and bearish forces are in a delicate balance, but the resistance from the half-year line above is still strong. The previous three attempts to break through have not been able to close firmly, and the current rebound and recent rising process have always seen a shrinking volume, especially the small bullish candle trend has not been accompanied by effective volume expansion, reflecting weak bullish strength and a lack of funds to support the rebound. Meanwhile, the MACD has not shown any significant bottom divergence signal, indicating that the short-term trend reversal structure is incomplete. Overall, it is judged that Bitcoin is likely to continue oscillating in the range of $110,000 - $113,000 in the short term, with a focus on whether there will be a volume breakout from the range and a clear direction of the breakout.
In terms of intraday trading strategy, it is important to focus on the strength of support at $109,300 - $108,300 below. When the price retraces to this range and shows stabilization signals, bullish opportunities can be seized; on the upper side, attention should be paid to the pressure situation at $113,500 - $114,500. The effectiveness of breaking through this range will directly determine the intraday market's upward space.
October 24 ETH Technical Analysis and Trading Strategy:
The daily chart shows that the long-term trend remains bullish, but the price is constrained by the medium-term moving averages, and is in a high-level consolidation. The MACD is weak, indicating insufficient momentum. The 4-hour chart shows a range consolidation, with the current price operating in the 3,850-3,980 range. The short-term MACD has formed a golden cross signal, suggesting there is rebound momentum, but the trading volume has not effectively increased, which may limit the rebound space. Key resistance is located in the 3,970-3,980 area, and key support is in the 3,840-3,850 area.
Trading Advice
It is recommended to adopt a cautious bullish strategy during the day, with a light long position in the 3,850-3,860 range, setting a stop loss below 3,840. The first target is aimed at the 3,970-3,980 resistance zone, and the second target looks at the psychological level of 4,000. If the price rebounds to the resistance zone and shows signs of stagnation, consider reducing positions; if it breaks through, hold the position. It is essential to keep the position light and strictly adhere to stop losses, noting that daily chart pressure may limit the rebound height.
The daily chart shows that the long-term trend remains bullish, but the price is constrained by the medium-term moving averages, and is in a high-level consolidation. The MACD is weak, indicating insufficient momentum. The 4-hour chart shows a range consolidation, with the current price operating in the 3,850-3,980 range. The short-term MACD has formed a golden cross signal, suggesting there is rebound momentum, but the trading volume has not effectively increased, which may limit the rebound space. Key resistance is located in the 3,970-3,980 area, and key support is in the 3,840-3,850 area.
Trading Advice
It is recommended to adopt a cautious bullish strategy during the day, with a light long position in the 3,850-3,860 range, setting a stop loss below 3,840. The first target is aimed at the 3,970-3,980 resistance zone, and the second target looks at the psychological level of 4,000. If the price rebounds to the resistance zone and shows signs of stagnation, consider reducing positions; if it breaks through, hold the position. It is essential to keep the position light and strictly adhere to stop losses, noting that daily chart pressure may limit the rebound height.
《Market Waiting for Breakthrough, Dogecoin Struggles at Resistance Level of $0.21》
Dogecoin is currently at a critical price point, facing strong resistance at $0.21 while receiving support at $0.19. Its core trend can be summarized as follows:
Resistance Pressure: The resistance level at $0.21 forms a "supply wall," with many investors looking to sell at this cost line, leading to multiple failed breakthroughs.
Key Support: If it falls below the support at $0.194, it may accelerate down to $0.16-$0.13; if it holds above $0.21, it could push up to the $0.24-$0.26 range.
Market Dynamics: Grayscale's launch of the Dogecoin Trust is driving institutional participation, but unlimited supply (annual increase of 5 billion coins) continues to exert selling pressure, requiring more demand to offset.
Technical Signals: The current narrow range fluctuations are unsustainable; breakthroughs need to be accompanied by trading volume, otherwise false breakthroughs are likely to occur.
In summary, Dogecoin is facing a directional choice, and attention needs to be paid to changes in trading volume and the defensive and offensive situations at key price levels.
Dogecoin is currently at a critical price point, facing strong resistance at $0.21 while receiving support at $0.19. Its core trend can be summarized as follows:
Resistance Pressure: The resistance level at $0.21 forms a "supply wall," with many investors looking to sell at this cost line, leading to multiple failed breakthroughs.
Key Support: If it falls below the support at $0.194, it may accelerate down to $0.16-$0.13; if it holds above $0.21, it could push up to the $0.24-$0.26 range.
Market Dynamics: Grayscale's launch of the Dogecoin Trust is driving institutional participation, but unlimited supply (annual increase of 5 billion coins) continues to exert selling pressure, requiring more demand to offset.
Technical Signals: The current narrow range fluctuations are unsustainable; breakthroughs need to be accompanied by trading volume, otherwise false breakthroughs are likely to occur.
In summary, Dogecoin is facing a directional choice, and attention needs to be paid to changes in trading volume and the defensive and offensive situations at key price levels.

"U.S. National Debt Surpasses $38 Trillion"\nFor the cryptocurrency market, its long-term impact far outweighs short-term fluctuations. This event itself does not directly drive coin prices, but it reinforces the core macro narrative that promotes the development of cryptocurrencies.\nFundamentally, the ever-expanding national debt reveals the deep structural risks of the traditional fiat currency system. The market is concerned that such a huge debt may eventually be absorbed through inflation or a devaluation of the dollar, which continues to undermine trust in centralized financial systems. In this context, Bitcoin, as a limited supply and decentralized "digital gold," has its core assertions of anti-inflation and value storage strongly validated. It is seen as an ideal tool to hedge against the erosion of fiat currency credit.\nMoreover, the enormous debt burden may tie the Federal Reserve's hands, forcing it to turn to interest rate cuts and easing policies earlier under economic pressure. The market's expectation of long-term liquidity will provide a favorable environment for risk assets such as cryptocurrencies.\nTherefore, this debt milestone is not just financial news; it is also a reminder of the reasons for the existence of cryptocurrencies. It prompts more investors to view crypto assets as a necessary financial hedge and a bet on paradigm shifts, although the short-term market will still be dominated by emotions and liquidity, the fundamental logic driving its long-term development is thus continuously strengthened.

XRP Interpretation:
1. Technical Analysis
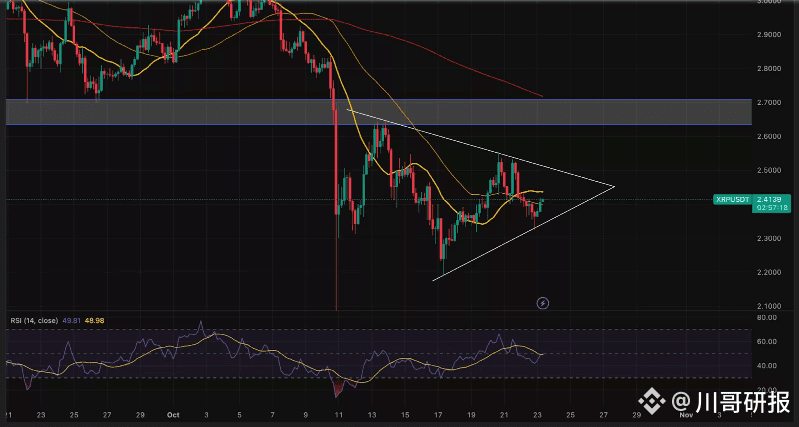
Currently, XRP is in a key consolidation phase, with the chart forming a symmetrical triangle pattern, reflecting a temporary balance between bulls and bears, and also indicating that a breakout is near. Short-term technical signals show a positive inclination: the 20-day Simple Moving Average (SMA) has crossed above the 50-day SMA, forming a 'golden cross', which is an early signal that the trend may turn bullish, and the price is currently stabilizing around the key support level of $2.40, indicating that buyers are gradually stepping in. On the resistance side, $2.45-$2.50 is the primary pressure zone in the short term, and once broken, it will face strong resistance at $2.70 (this level has transformed from the previous support after the crash on October 10, exerting strong pressure); on the support end, if the price falls below $2.40, the next key support will be $2.30. If the closing price drops below this level, the bullish structure will fail, likely triggering a pullback to $2.10. In terms of momentum indicators, the Relative Strength Index (RSI) hovers around 49 in the neutral zone, with no signs of overbought or oversold conditions. Whether subsequent trading volume can cooperate with directional breakouts will become the core basis for trend confirmation — a volume breakout above resistance will strengthen bullish signals, while a volume pullback breaking support will increase bearish risks.
2. Operational Suggestions
Bullish Strategy: If XRP breaks out of the $2.45-$2.50 range with volume (daily trading volume exceeds the average of the last 3 days by more than 30%), a small position can be taken. The first target is to look towards the resistance level of $2.70. After breaking through, an appropriate increase in position can be made, with a stop-loss set below the breakout level at $2.38 (to avoid false breakout risks). If the price retraces and finds support near $2.40 and the RSI does not break 45, a small position can also be tried for a long, with a stop-loss reference at $2.30.
Bearish Strategy: Only when the closing price is below $2.30 and accompanied by increased trading volume, a small position can be taken for a short, targeting $2.10, with a stop-loss set at $2.35 (to prevent being caught in a rebound). If the $2.30 support is not broken, blindly shorting is not recommended to avoid counter-trend operations.
Risk Warning: Currently in a sensitive stage before the triangle breakout, if continuous shrinking volume occurs (trading volume declines by more than 50% compared to the average of the last 3 days), new positions should be paused while waiting for a clear breakout signal; during the holding process, closely monitor the gains and losses of the $2.70 resistance and $2.30 support. Once key price levels are breached, adjust positions in a timely manner to control risk exposure.
1. Technical Analysis
Currently, XRP is in a key consolidation phase, with the chart forming a symmetrical triangle pattern, reflecting a temporary balance between bulls and bears, and also indicating that a breakout is near. Short-term technical signals show a positive inclination: the 20-day Simple Moving Average (SMA) has crossed above the 50-day SMA, forming a 'golden cross', which is an early signal that the trend may turn bullish, and the price is currently stabilizing around the key support level of $2.40, indicating that buyers are gradually stepping in. On the resistance side, $2.45-$2.50 is the primary pressure zone in the short term, and once broken, it will face strong resistance at $2.70 (this level has transformed from the previous support after the crash on October 10, exerting strong pressure); on the support end, if the price falls below $2.40, the next key support will be $2.30. If the closing price drops below this level, the bullish structure will fail, likely triggering a pullback to $2.10. In terms of momentum indicators, the Relative Strength Index (RSI) hovers around 49 in the neutral zone, with no signs of overbought or oversold conditions. Whether subsequent trading volume can cooperate with directional breakouts will become the core basis for trend confirmation — a volume breakout above resistance will strengthen bullish signals, while a volume pullback breaking support will increase bearish risks.
2. Operational Suggestions
Bullish Strategy: If XRP breaks out of the $2.45-$2.50 range with volume (daily trading volume exceeds the average of the last 3 days by more than 30%), a small position can be taken. The first target is to look towards the resistance level of $2.70. After breaking through, an appropriate increase in position can be made, with a stop-loss set below the breakout level at $2.38 (to avoid false breakout risks). If the price retraces and finds support near $2.40 and the RSI does not break 45, a small position can also be tried for a long, with a stop-loss reference at $2.30.
Bearish Strategy: Only when the closing price is below $2.30 and accompanied by increased trading volume, a small position can be taken for a short, targeting $2.10, with a stop-loss set at $2.35 (to prevent being caught in a rebound). If the $2.30 support is not broken, blindly shorting is not recommended to avoid counter-trend operations.
Risk Warning: Currently in a sensitive stage before the triangle breakout, if continuous shrinking volume occurs (trading volume declines by more than 50% compared to the average of the last 3 days), new positions should be paused while waiting for a clear breakout signal; during the holding process, closely monitor the gains and losses of the $2.70 resistance and $2.30 support. Once key price levels are breached, adjust positions in a timely manner to control risk exposure.

"Interpretation of ETH Market Trends on October 23 and Intraday Trading Strategies"
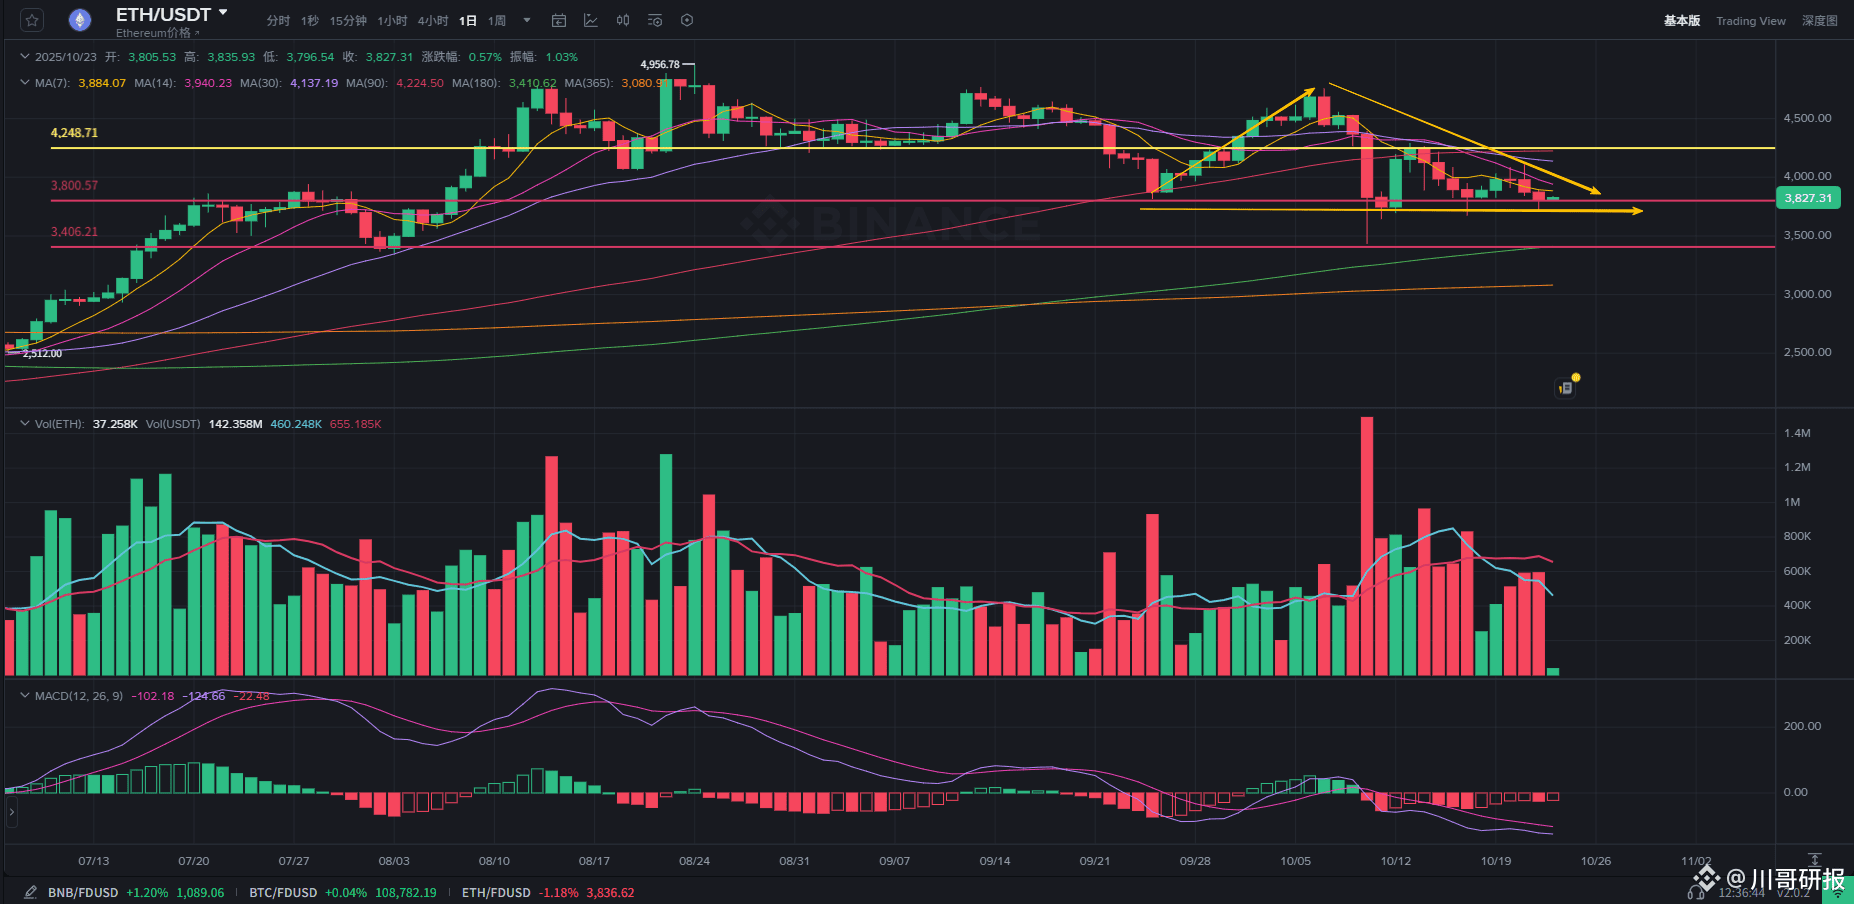
Currently, Ethereum is in a phase of correction within a medium-term uptrend, with the weekly chart still operating within a bullish macro framework, but the short-term has entered a weak consolidation pattern. On the daily chart, the short-term moving averages (MA7/14) have formed a death cross and are moving downward, creating short-term pressure, while the medium-term moving averages (MA30/60) are beginning to turn downward, indicating that the medium-term trend has entered a consolidation range; however, the long-term moving averages (MA180/365) remain in an upward trend, providing fundamental support for the market, with 3400 points being a core defensive line for the bulls.
From the recent candlestick patterns, the daily chart shows a continuous alternation of small bearish and bullish candles, with rebound momentum significantly weakening, reflecting a strong sense of panic in the market. At the same time, the daily market has reached the end of a converging triangle, with limited horizontal adjustment space, and the market's directional decision window is gradually narrowing.
Future market movements need to focus on two key price levels: if the coin price breaks through the 4000-point integer level with increased volume, it can be regarded as a signal for the initiation of a phase rebound; if it breaks down below the 3700-point support level with increased volume, the probability of a pullback near the 3400-point level will significantly increase.
In terms of trading volume, there has recently been a characteristic of "increased volume with slight declines, reduced volume with weak rebounds," indicating an overall cold trading sentiment, suggesting that both bulls and bears are in a wait-and-see state and have not yet formed a consensus on trading operations.
Regarding the MACD indicator, it is currently operating below the zero axis, but the fast and slow lines are tending to flatten, and the negative values of the histogram are continuously shrinking, indicating a weakening of bearish momentum and early signs of a bottom divergence. It should be noted that if Bitcoin breaks out with increased volume subsequently, Ethereum is likely to follow suit and initiate a rebound.
In terms of intraday trading strategies, focus on the support range of 3800-3750 points below; when the price pulls back and stabilizes, look for buying opportunities; above, pay attention to the resistance range of 3880-3930 points, as its breakthrough effect directly determines the intraday rebound space and strength."
Currently, Ethereum is in a phase of correction within a medium-term uptrend, with the weekly chart still operating within a bullish macro framework, but the short-term has entered a weak consolidation pattern. On the daily chart, the short-term moving averages (MA7/14) have formed a death cross and are moving downward, creating short-term pressure, while the medium-term moving averages (MA30/60) are beginning to turn downward, indicating that the medium-term trend has entered a consolidation range; however, the long-term moving averages (MA180/365) remain in an upward trend, providing fundamental support for the market, with 3400 points being a core defensive line for the bulls.
From the recent candlestick patterns, the daily chart shows a continuous alternation of small bearish and bullish candles, with rebound momentum significantly weakening, reflecting a strong sense of panic in the market. At the same time, the daily market has reached the end of a converging triangle, with limited horizontal adjustment space, and the market's directional decision window is gradually narrowing.
Future market movements need to focus on two key price levels: if the coin price breaks through the 4000-point integer level with increased volume, it can be regarded as a signal for the initiation of a phase rebound; if it breaks down below the 3700-point support level with increased volume, the probability of a pullback near the 3400-point level will significantly increase.
In terms of trading volume, there has recently been a characteristic of "increased volume with slight declines, reduced volume with weak rebounds," indicating an overall cold trading sentiment, suggesting that both bulls and bears are in a wait-and-see state and have not yet formed a consensus on trading operations.
Regarding the MACD indicator, it is currently operating below the zero axis, but the fast and slow lines are tending to flatten, and the negative values of the histogram are continuously shrinking, indicating a weakening of bearish momentum and early signs of a bottom divergence. It should be noted that if Bitcoin breaks out with increased volume subsequently, Ethereum is likely to follow suit and initiate a rebound.
In terms of intraday trading strategies, focus on the support range of 3800-3750 points below; when the price pulls back and stabilizes, look for buying opportunities; above, pay attention to the resistance range of 3880-3930 points, as its breakthrough effect directly determines the intraday rebound space and strength."
Log in to explore more content