

Cryptocurrency Professional
413 Posts

Cryptocurrency Professional
Report
Block User
i dont pump coins, i buy them before they go up a lot
29 Following
128 Followers
500 Liked
Posts
All
Quotes
·
--
Bullish
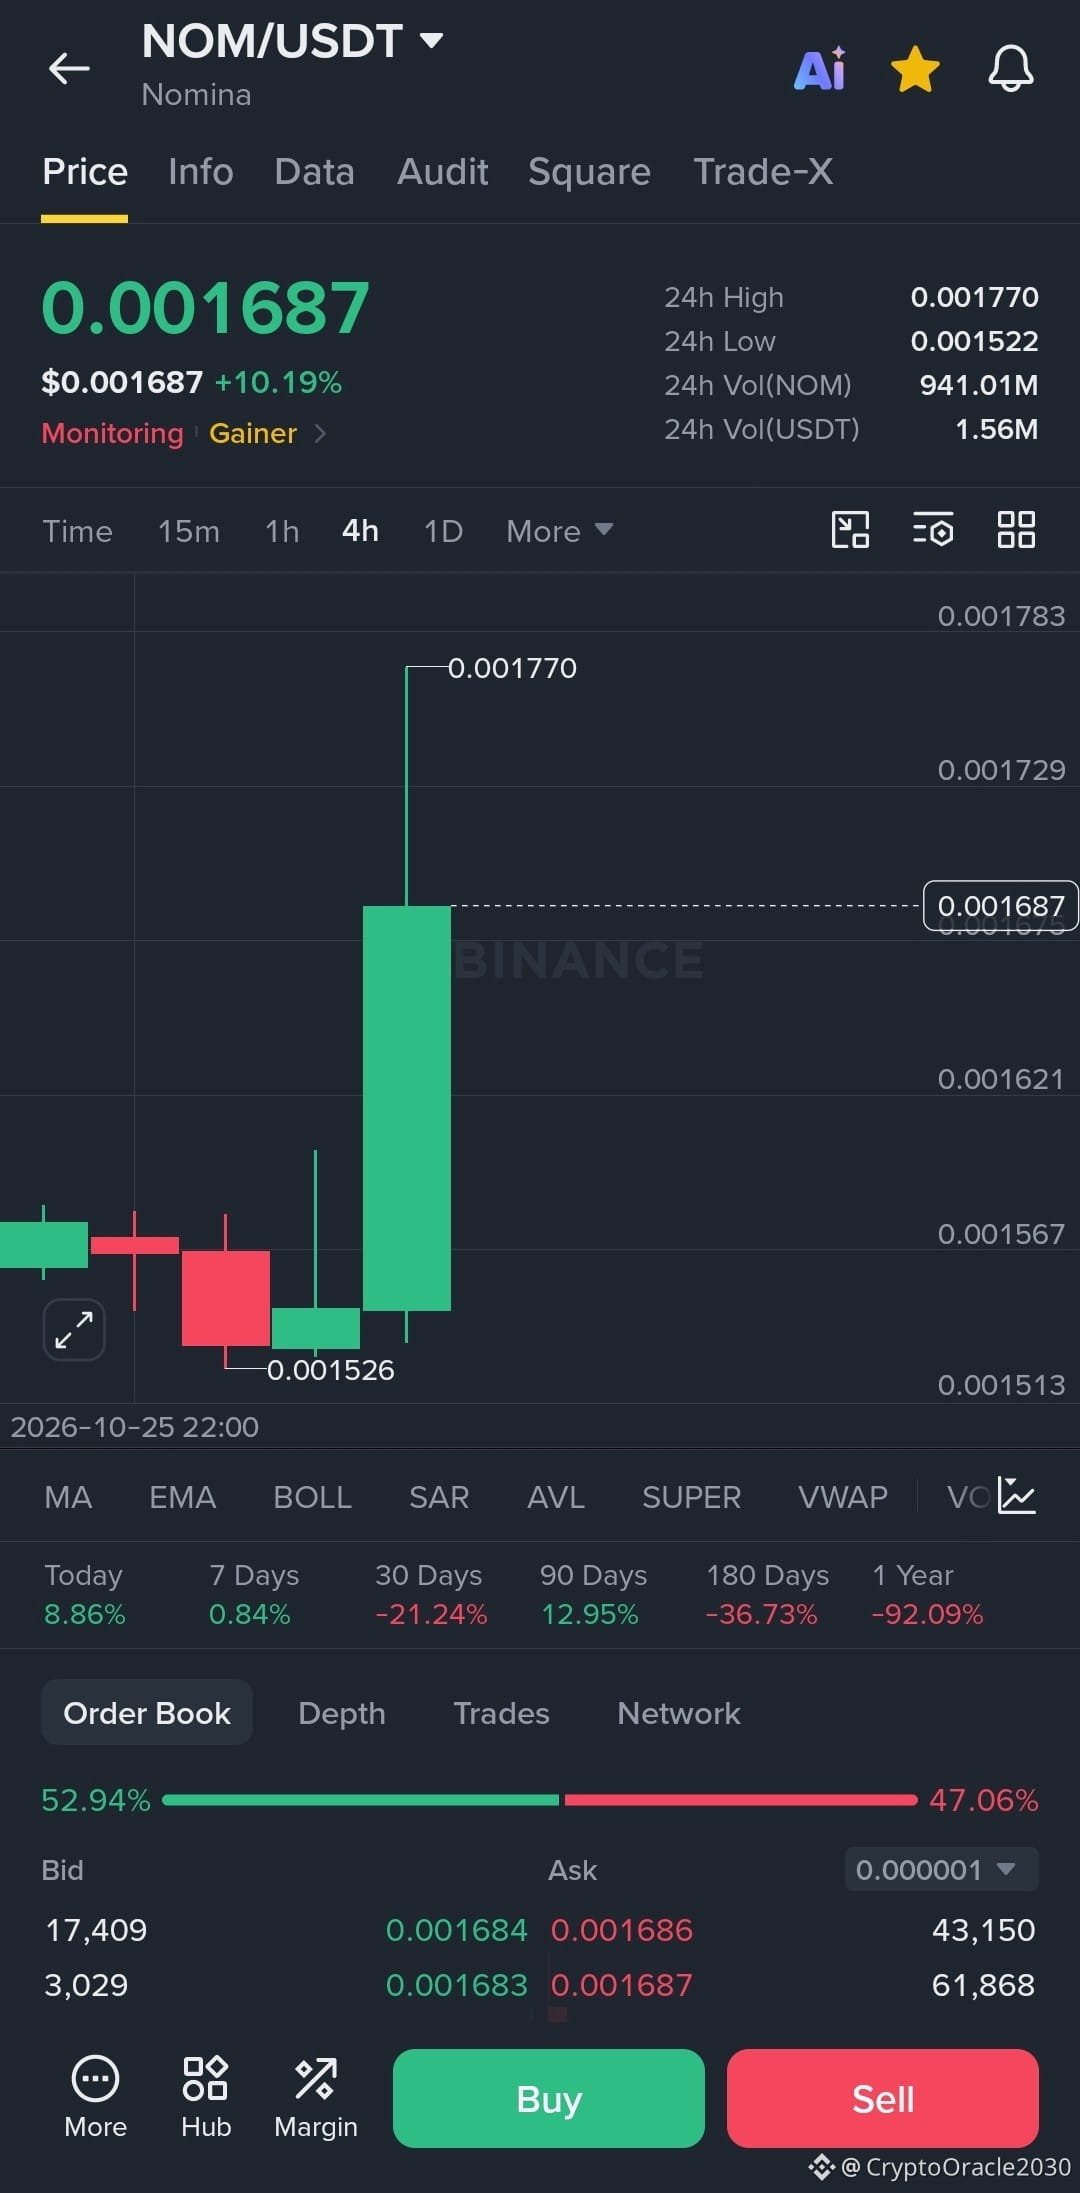
🚨 $NOM/USDT — A green candle is igniting momentum! 🚀🔥
💵 Price: $0.001687 | +10.19% 📈
🔝 24-hour high: $0.001770
💥 Trading volume: $1.56M USDT
🎯 Direction: LONG 🟢
🟢 Entry zone: $0.001660–$0.001690
🛑 SL: $0.001610
💰 TP1: $0.001730
💰 TP2: $0.001770
💰 TP3: $0.001850
⚡ $NOM posted a strong upward surge on the 4-hour timeframe after bouncing from $0.001526! A breakout above $0.001770 could give the price an additional push toward the next target. 📈🔥
#nom #nomina #crypto #altcoins #binance
{future}(NOMUSDT)
🚨 $NOM/USDT — A green candle is igniting momentum! 🚀🔥
💵 Price: $0.001687 | +10.19% 📈
🔝 24-hour high: $0.001770
💥 Trading volume: $1.56M USDT
🎯 Direction: LONG 🟢
🟢 Entry zone: $0.001660–$0.001690
🛑 SL: $0.001610
💰 TP1: $0.001730
💰 TP2: $0.001770
💰 TP3: $0.001850
⚡ $NOM posted a strong upward surge on the 4-hour timeframe after bouncing from $0.001526! A breakout above $0.001770 could give the price an additional push toward the next target. 📈🔥
#nom #nomina #crypto #altcoins #binance
36
·
--
Bullish
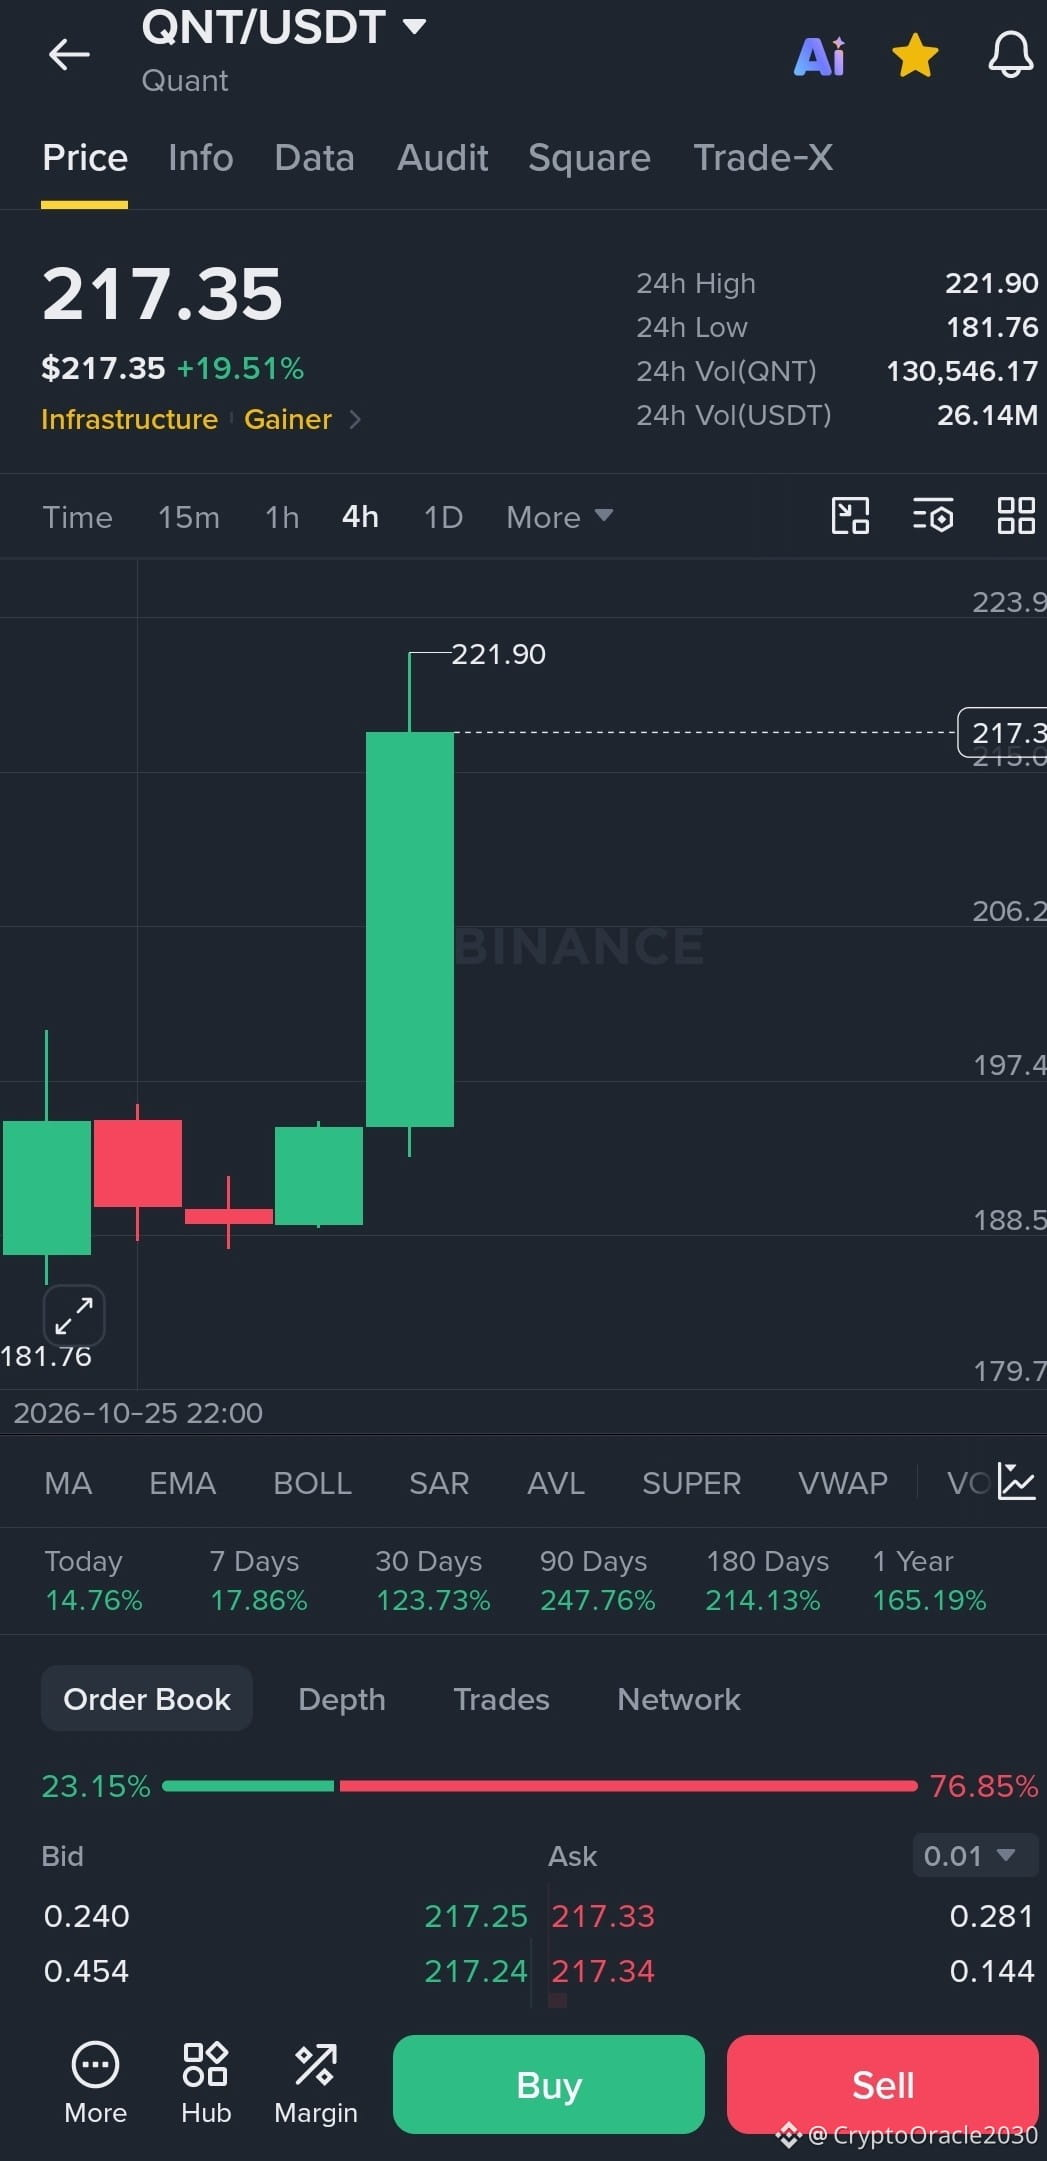
🚨 $QNT /USDT — The bullish rocket strikes again! 🚀🔥
💵 Price: $217.35 | +19.51% 📈
🔝 24-hour high: $221.90
💥 Trading volume: $26.14M USDT
🎯 Trend: LONG 🟢
🟢 Entry zone: $213–218
🛑 SL: $205
💰 TP1: $225
💰 TP2: $235
💰 TP3: $250
⚡ A strong bullish 4-hour candle pushed QNT toward $221.90! A breakout above the high could pave the way for a new bullish wave toward higher targets. 🚀
#qnt #quant #crypto #altcoins #binance
{future}(QNTUSDT)
🚨 $QNT /USDT — The bullish rocket strikes again! 🚀🔥
💵 Price: $217.35 | +19.51% 📈
🔝 24-hour high: $221.90
💥 Trading volume: $26.14M USDT
🎯 Trend: LONG 🟢
🟢 Entry zone: $213–218
🛑 SL: $205
💰 TP1: $225
💰 TP2: $235
💰 TP3: $250
⚡ A strong bullish 4-hour candle pushed QNT toward $221.90! A breakout above the high could pave the way for a new bullish wave toward higher targets. 🚀
#qnt #quant #crypto #altcoins #binance
149
·
--
Bullish
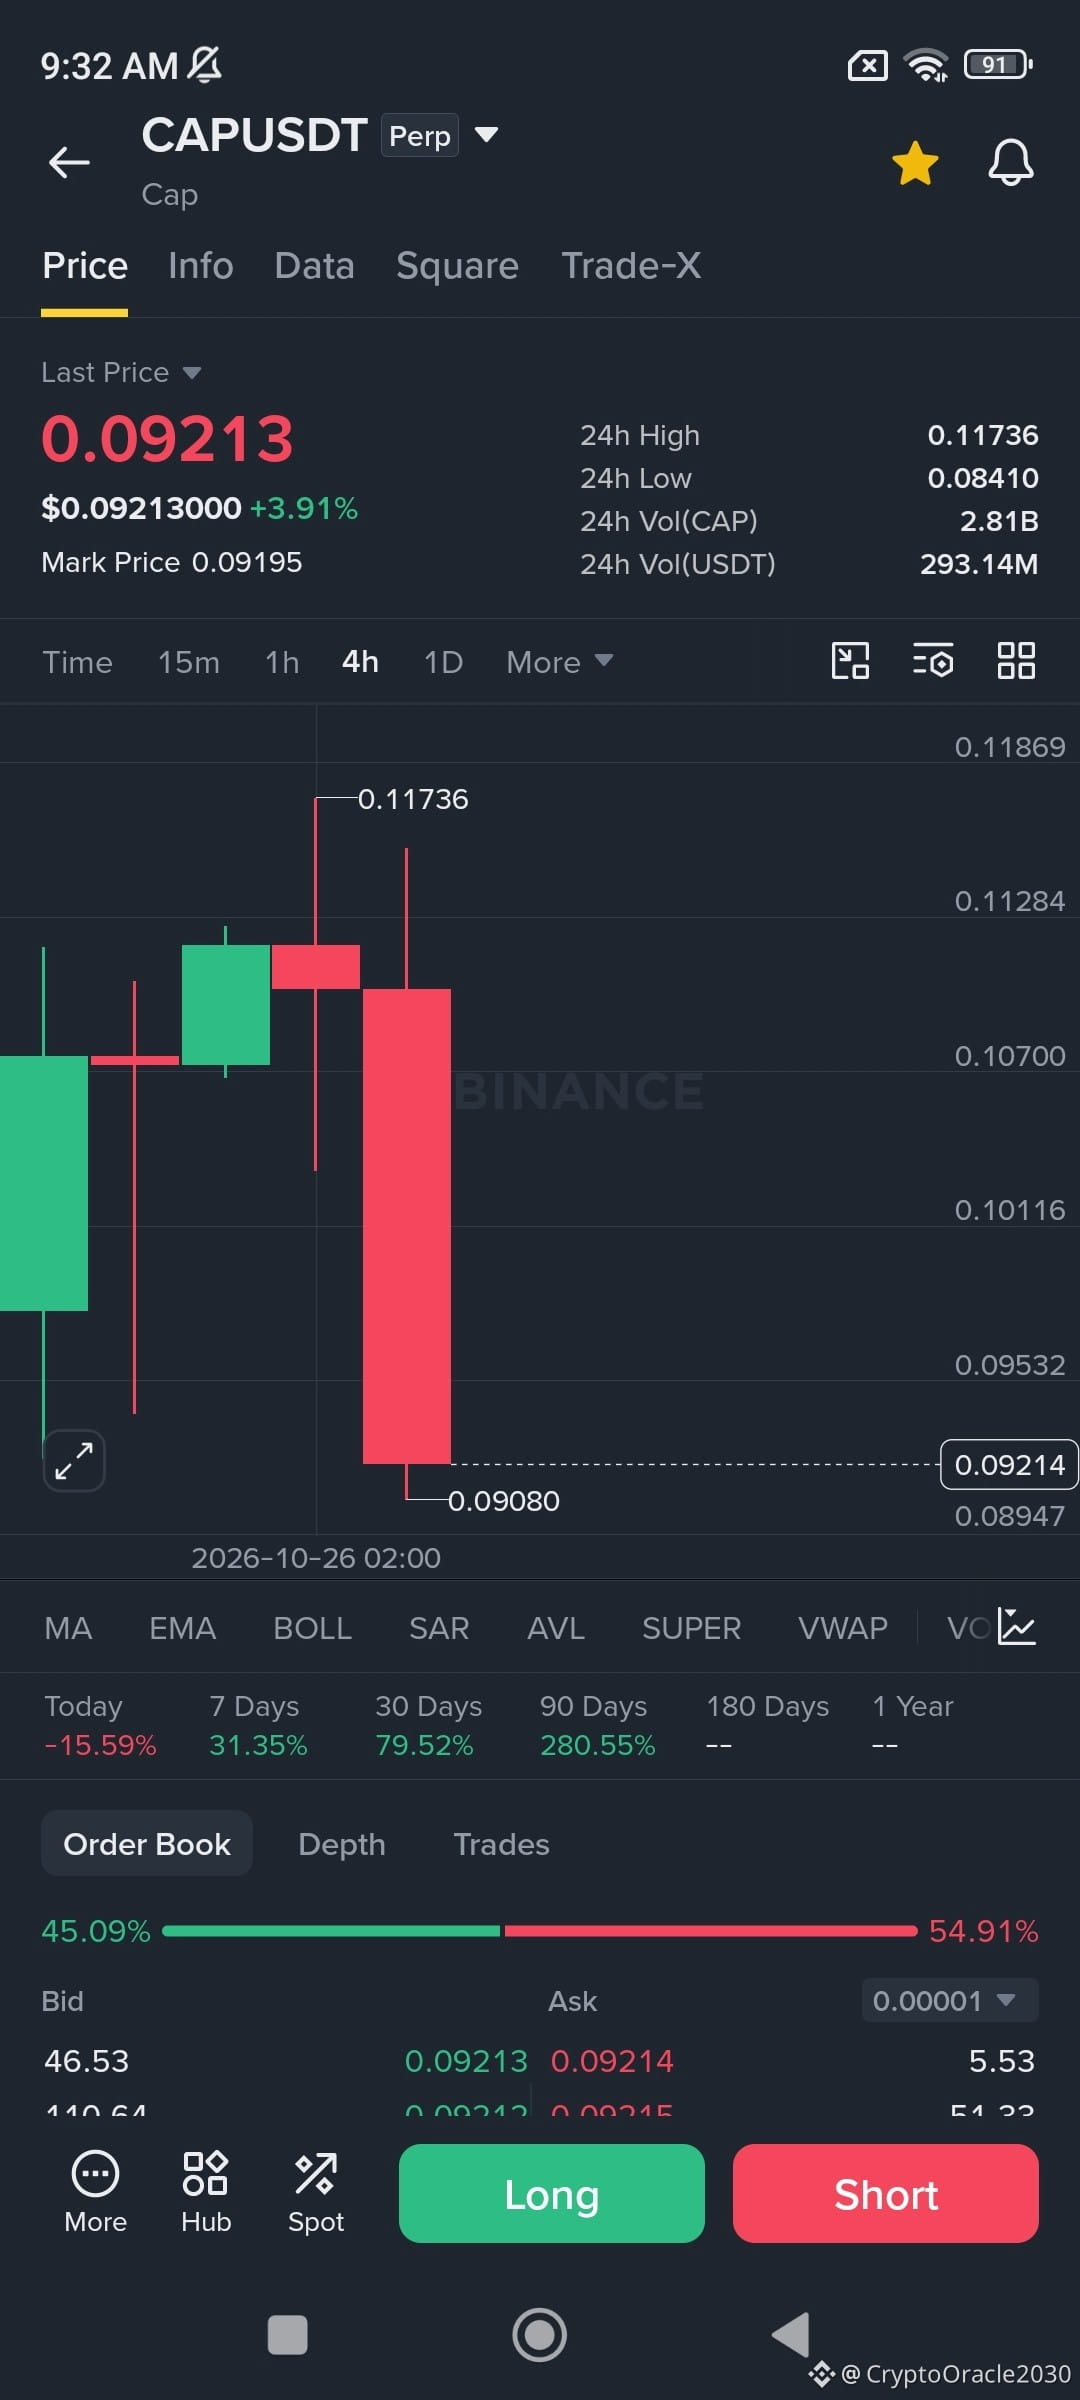
🚨 $CAP /USDT — Is a rebound starting after the sharp drop? ⚡
💵 Price: $0.09213 | +3.91%
📉 24-hour high: $0.11736
💥 Trading volume: $293.14M USDT
🎯 Trade: SHORT 🔴
🔴 Entry zone: $0.0930–$0.0950
🛑 SL: $0.0980
💰 TP1: $0.0908
💰 TP2: $0.0880
🚀 TP3: $0.0845
⚠️ A strong bearish candle has formed on the 4-hour timeframe, and the price is close to support at $0.0908; a break below it could push CAP to lower levels.
#cap #crypto #trading #altcoins #binance
{future}(CAPUSDT)
🚨 $CAP /USDT — Is a rebound starting after the sharp drop? ⚡
💵 Price: $0.09213 | +3.91%
📉 24-hour high: $0.11736
💥 Trading volume: $293.14M USDT
🎯 Trade: SHORT 🔴
🔴 Entry zone: $0.0930–$0.0950
🛑 SL: $0.0980
💰 TP1: $0.0908
💰 TP2: $0.0880
🚀 TP3: $0.0845
⚠️ A strong bearish candle has formed on the 4-hour timeframe, and the price is close to support at $0.0908; a break below it could push CAP to lower levels.
#cap #crypto #trading #altcoins #binance
62
·
--
Bullish
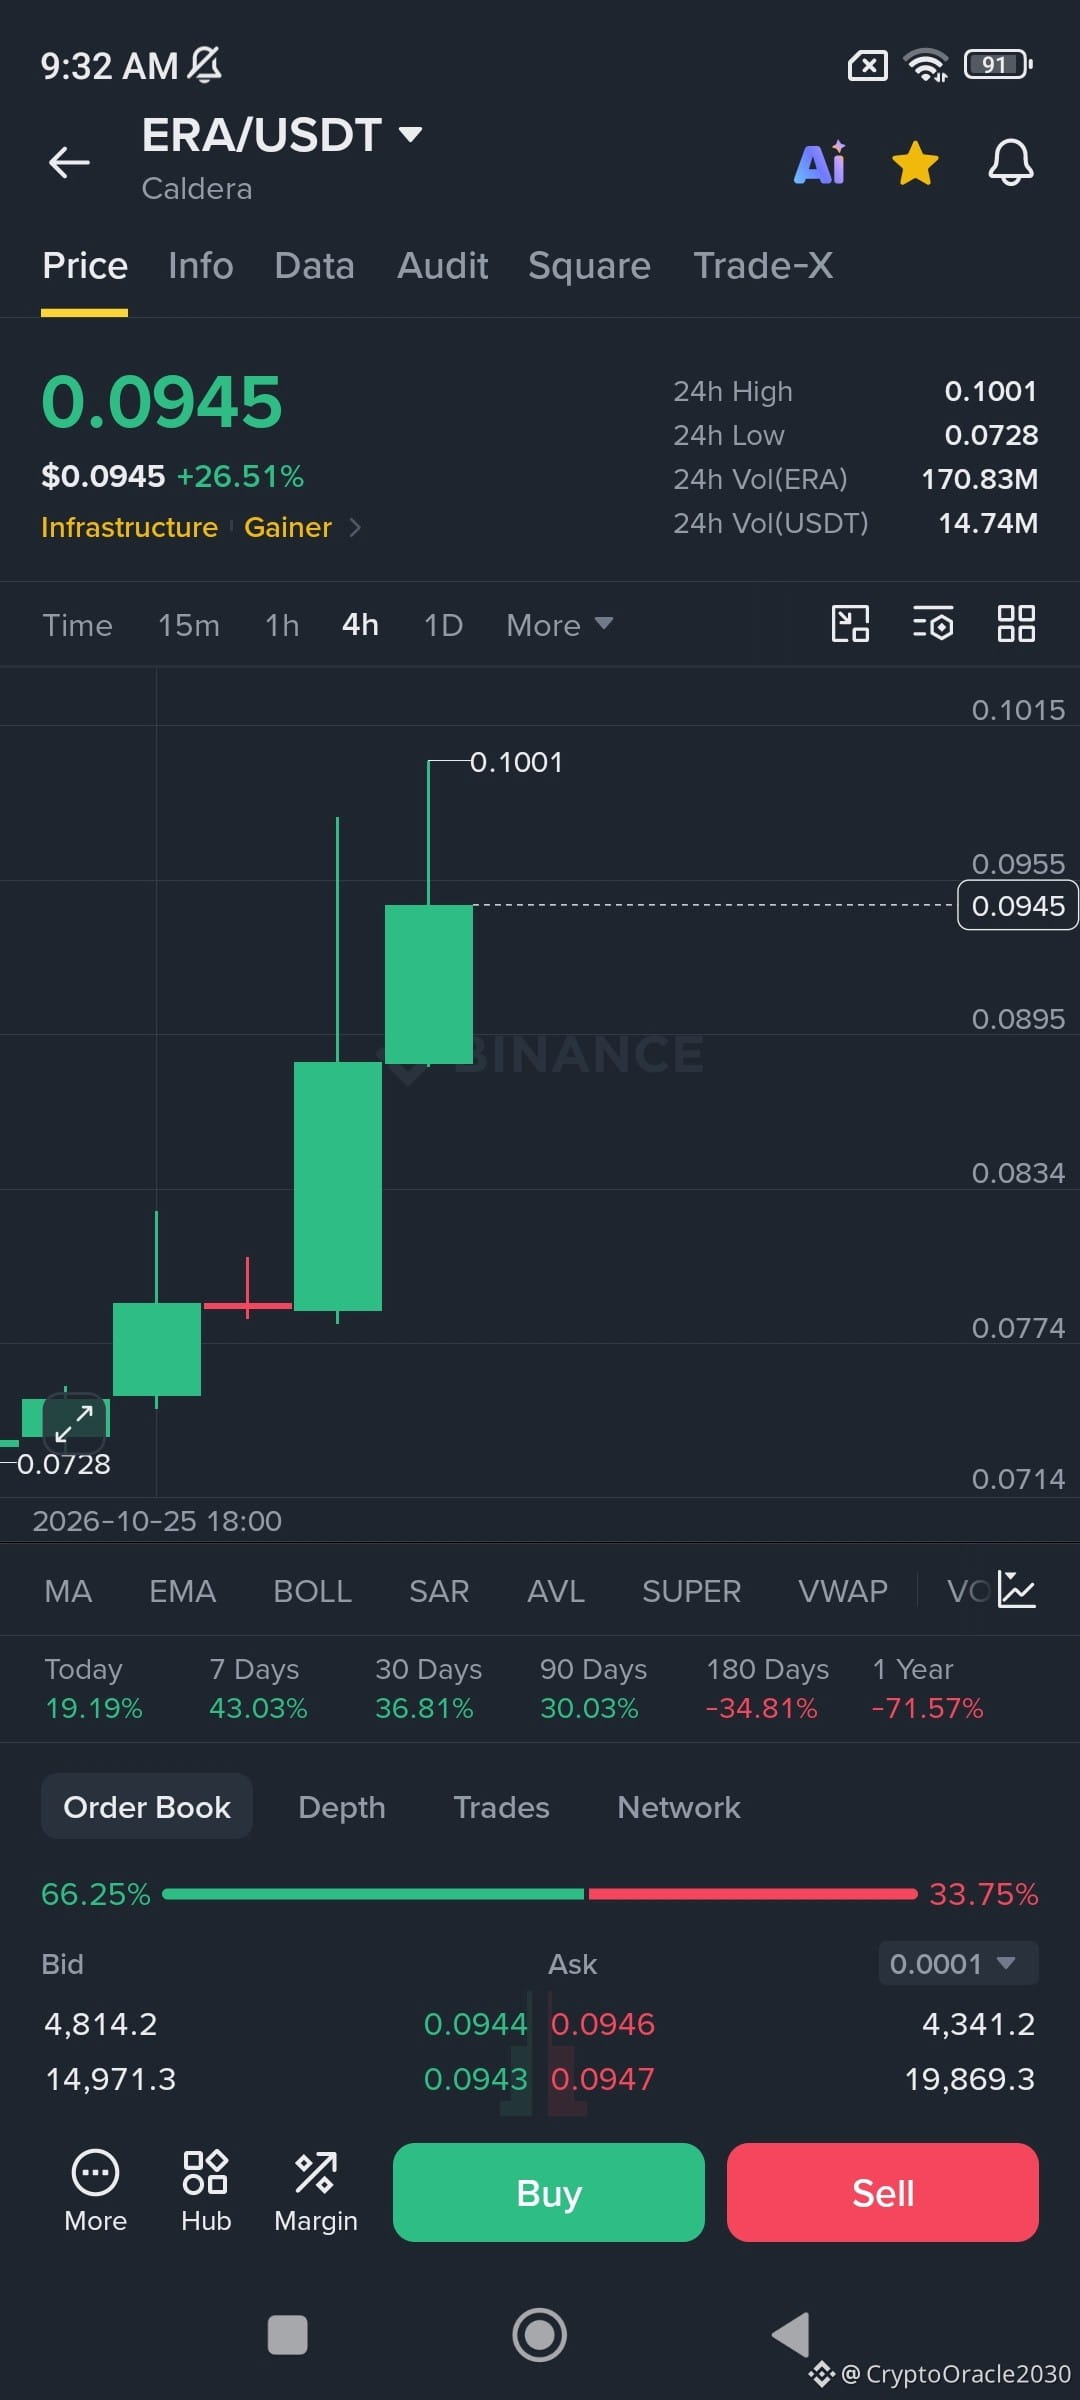
🚨 $ERA /USDT — Buyers are pushing the price up strongly! 📈🔥
💵 Price: $0.0945 | +26.51%
📊 24-hour high: $0.1001
💥 Trading volume: $14.74M USDT
🎯 Trade: LONG 🟢
🟢 Entry zone: $0.0925–$0.0945
🛑 SL: $0.0890
💰 TP1: $0.0975
💰 TP2: $0.1000
🚀 TP3: $0.1050
🔥 $ERA is maintaining clear upward momentum; breaking above the $0.1001 high could give the move more room to climb! 👀
#era #caldera #crypto #altcoins #binance
{future}(ERAUSDT)
🚨 $ERA /USDT — Buyers are pushing the price up strongly! 📈🔥
💵 Price: $0.0945 | +26.51%
📊 24-hour high: $0.1001
💥 Trading volume: $14.74M USDT
🎯 Trade: LONG 🟢
🟢 Entry zone: $0.0925–$0.0945
🛑 SL: $0.0890
💰 TP1: $0.0975
💰 TP2: $0.1000
🚀 TP3: $0.1050
🔥 $ERA is maintaining clear upward momentum; breaking above the $0.1001 high could give the move more room to climb! 👀
#era #caldera #crypto #altcoins #binance
84
·
--
Bullish
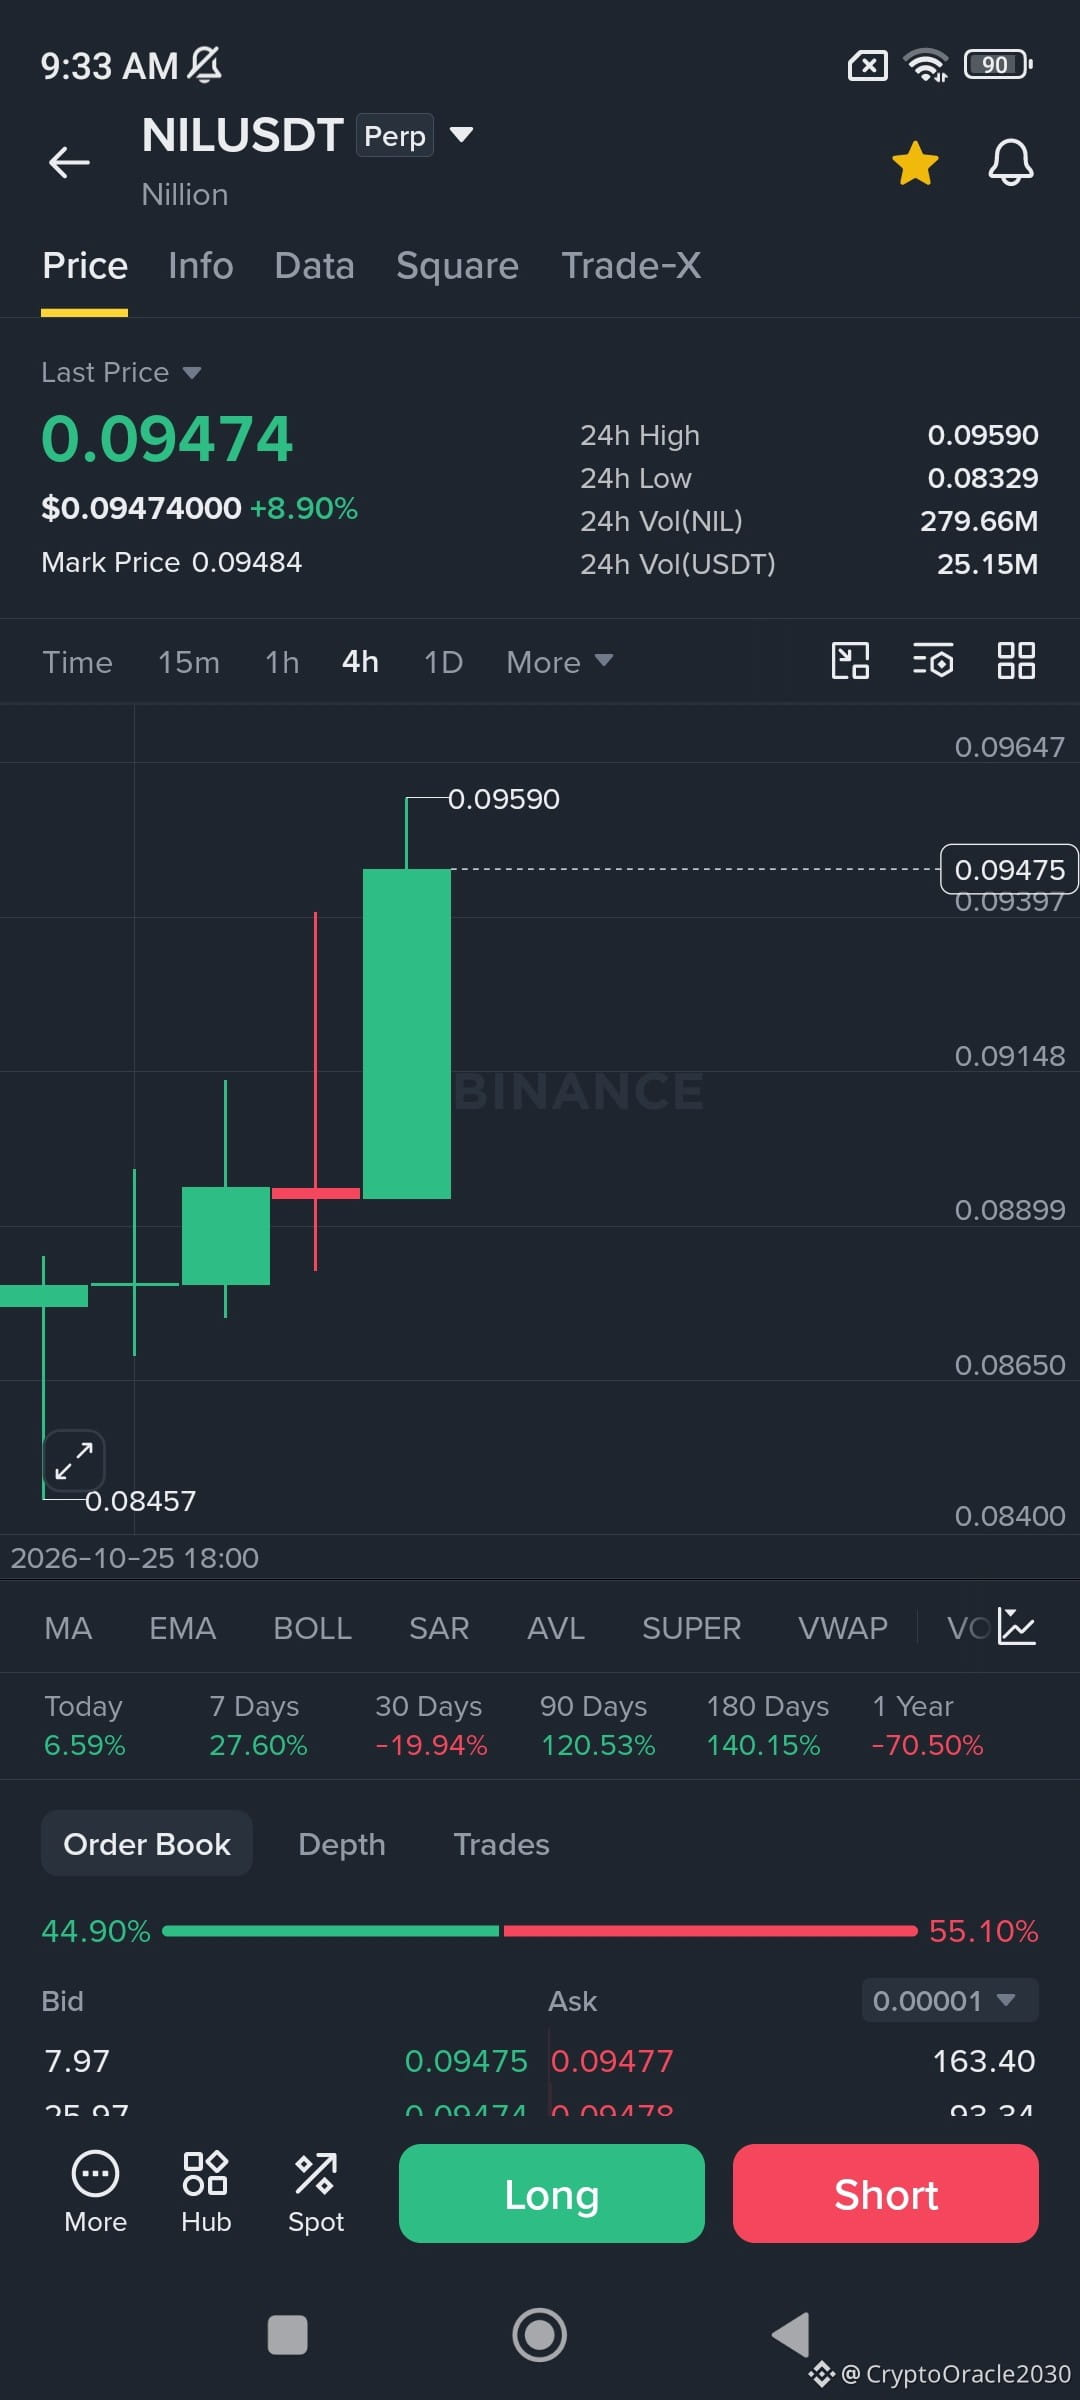
🚨 $NIL /USDT — Bullish momentum is nearing its peak! 🚀🔥
📈 Price: $0.09474 | +8.90%
📊 24-hour high: $0.09590
💥 Trading volume: $25.15M USDT
🎯 Trade: LONG 🟢
🟢 Entry zone: $0.0935–$0.0948
🛑 SL: $0.0910
💰 TP1: $0.0970
💰 TP2: $0.1000
🚀 TP3: $0.1040
⚡ A strong bullish candle on the 4-hour timeframe; a breakout above $0.09590 could pave the way toward $0.1000 and beyond! 📈
#nil #nillion #crypto #altcoins #binance
{future}(NILUSDT)
🚨 $NIL /USDT — Bullish momentum is nearing its peak! 🚀🔥
📈 Price: $0.09474 | +8.90%
📊 24-hour high: $0.09590
💥 Trading volume: $25.15M USDT
🎯 Trade: LONG 🟢
🟢 Entry zone: $0.0935–$0.0948
🛑 SL: $0.0910
💰 TP1: $0.0970
💰 TP2: $0.1000
🚀 TP3: $0.1040
⚡ A strong bullish candle on the 4-hour timeframe; a breakout above $0.09590 could pave the way toward $0.1000 and beyond! 📈
#nil #nillion #crypto #altcoins #binance
104
·
--
Bullish
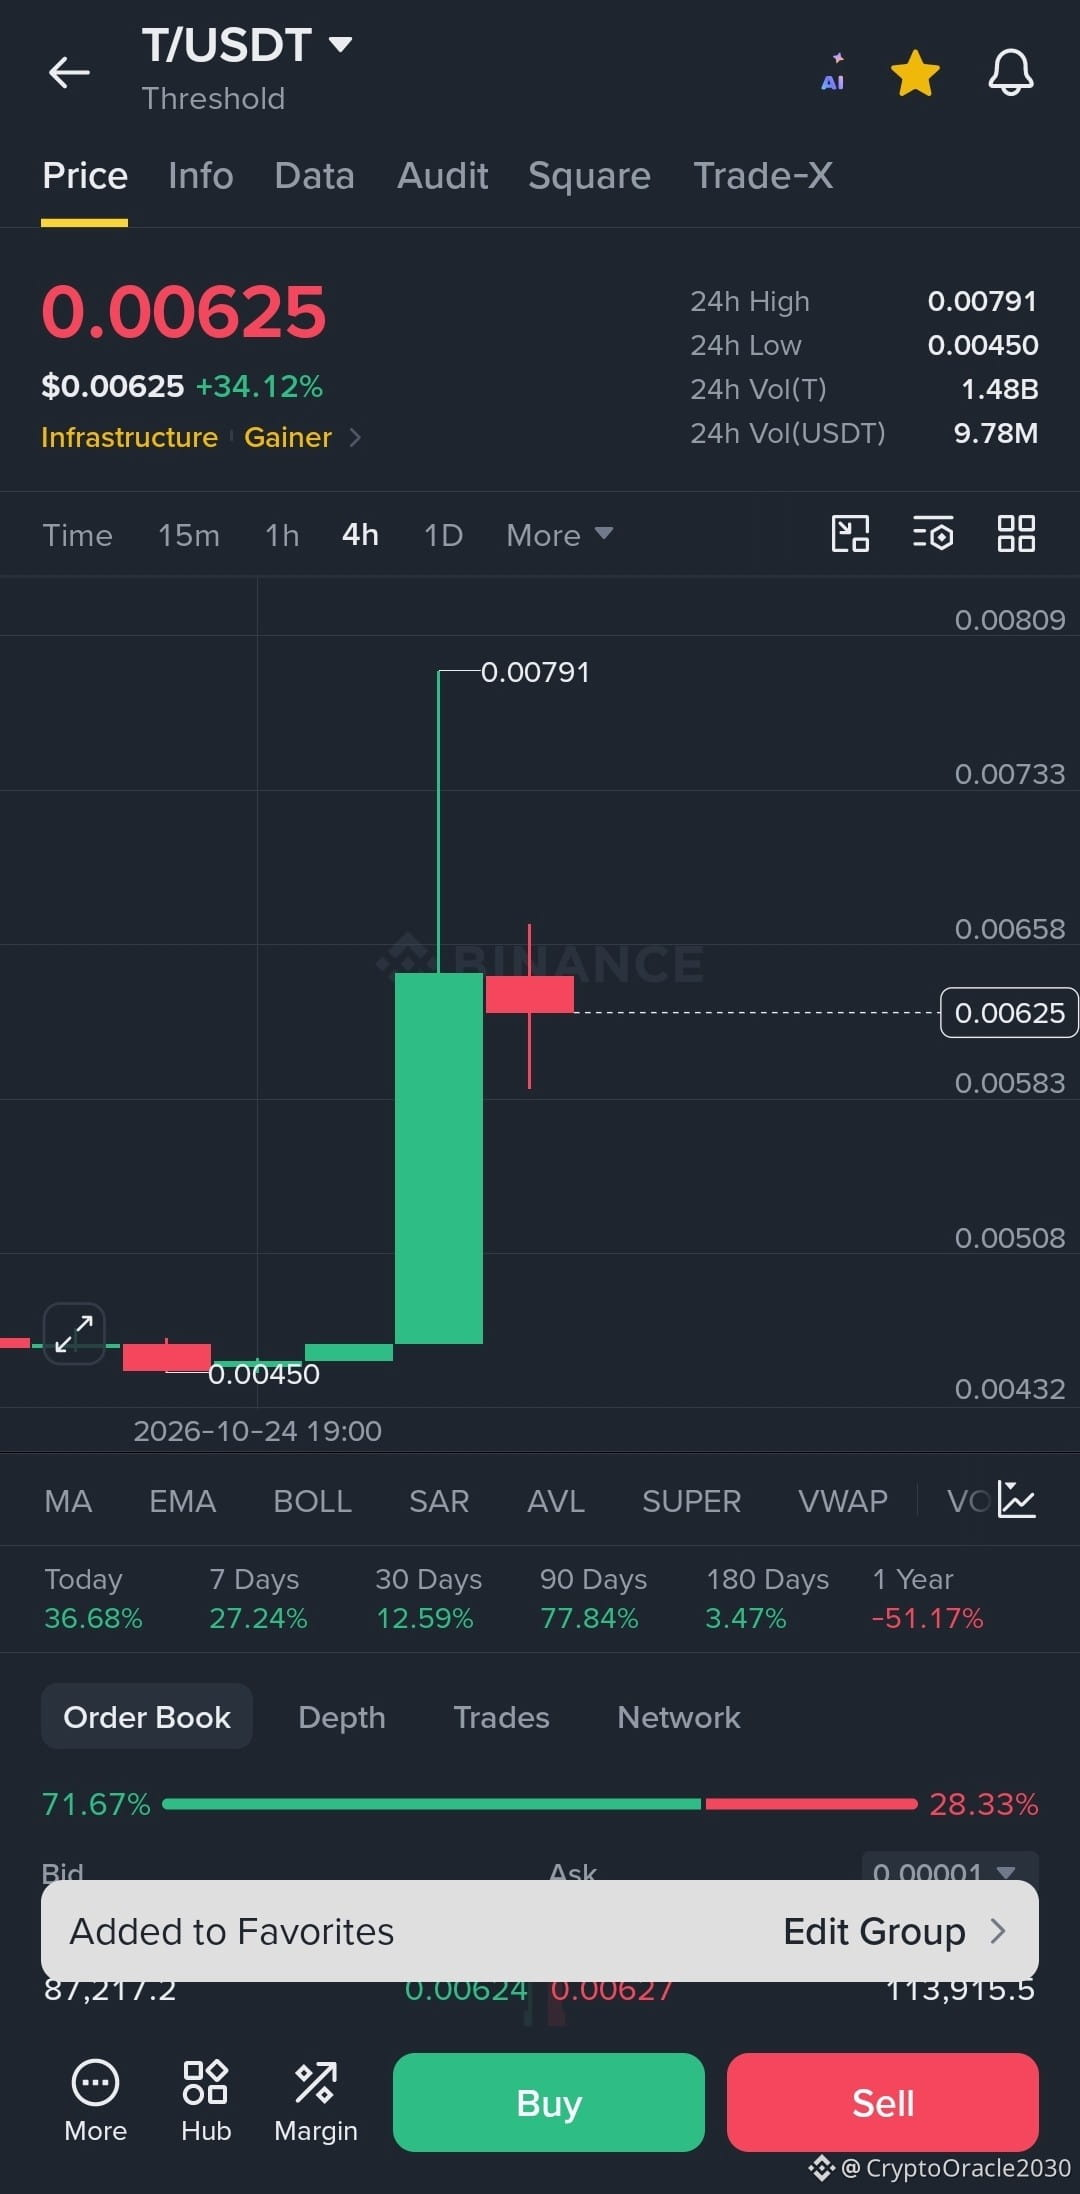
🚨 $T /USDT — Is the price preparing for a new rally? 🚀📈
💵 Current price: $0.00625
📈 24-hour change: +34.12%
📊 High: $0.00791
📉 Low: $0.00450
💥 Trading volume: $9.78M USDT
🎯 Trade: LONG 🟢 — Conditional breakout
🟢 Entry zone: $0.00590–$0.00620
🛑 Stop loss (SL): $0.00560
💰 TP1: $0.00660 — +6.5%
💰 TP2: $0.00700 — +12.9%
🚀 TP3: $0.00780 — +25.8%
⚡ $T surged by more than 34% in 24 hours, climbing from $0.00450 to a high of $0.00791. A massive bullish candle on the 4-hour chart signals strong momentum, but the appearance of a red candle after the rally hints at the possibility of a brief correction.
👀 Buyers need to hold the $0.00590–$0.00620 zone to regain momentum, while a breakout above $0.00660 could open the way toward $0.00700 and then a retest of the previous high. A conditional entry after confirmation of a bounce or breakout offers greater clarity for the trade.
#t #threshold #crypto #long #binance
{spot}(TUSDT)
🚨 $T /USDT — Is the price preparing for a new rally? 🚀📈
💵 Current price: $0.00625
📈 24-hour change: +34.12%
📊 High: $0.00791
📉 Low: $0.00450
💥 Trading volume: $9.78M USDT
🎯 Trade: LONG 🟢 — Conditional breakout
🟢 Entry zone: $0.00590–$0.00620
🛑 Stop loss (SL): $0.00560
💰 TP1: $0.00660 — +6.5%
💰 TP2: $0.00700 — +12.9%
🚀 TP3: $0.00780 — +25.8%
⚡ $T surged by more than 34% in 24 hours, climbing from $0.00450 to a high of $0.00791. A massive bullish candle on the 4-hour chart signals strong momentum, but the appearance of a red candle after the rally hints at the possibility of a brief correction.
👀 Buyers need to hold the $0.00590–$0.00620 zone to regain momentum, while a breakout above $0.00660 could open the way toward $0.00700 and then a retest of the previous high. A conditional entry after confirmation of a bounce or breakout offers greater clarity for the trade.
#t #threshold #crypto #long #binance
57
·
--
Bullish
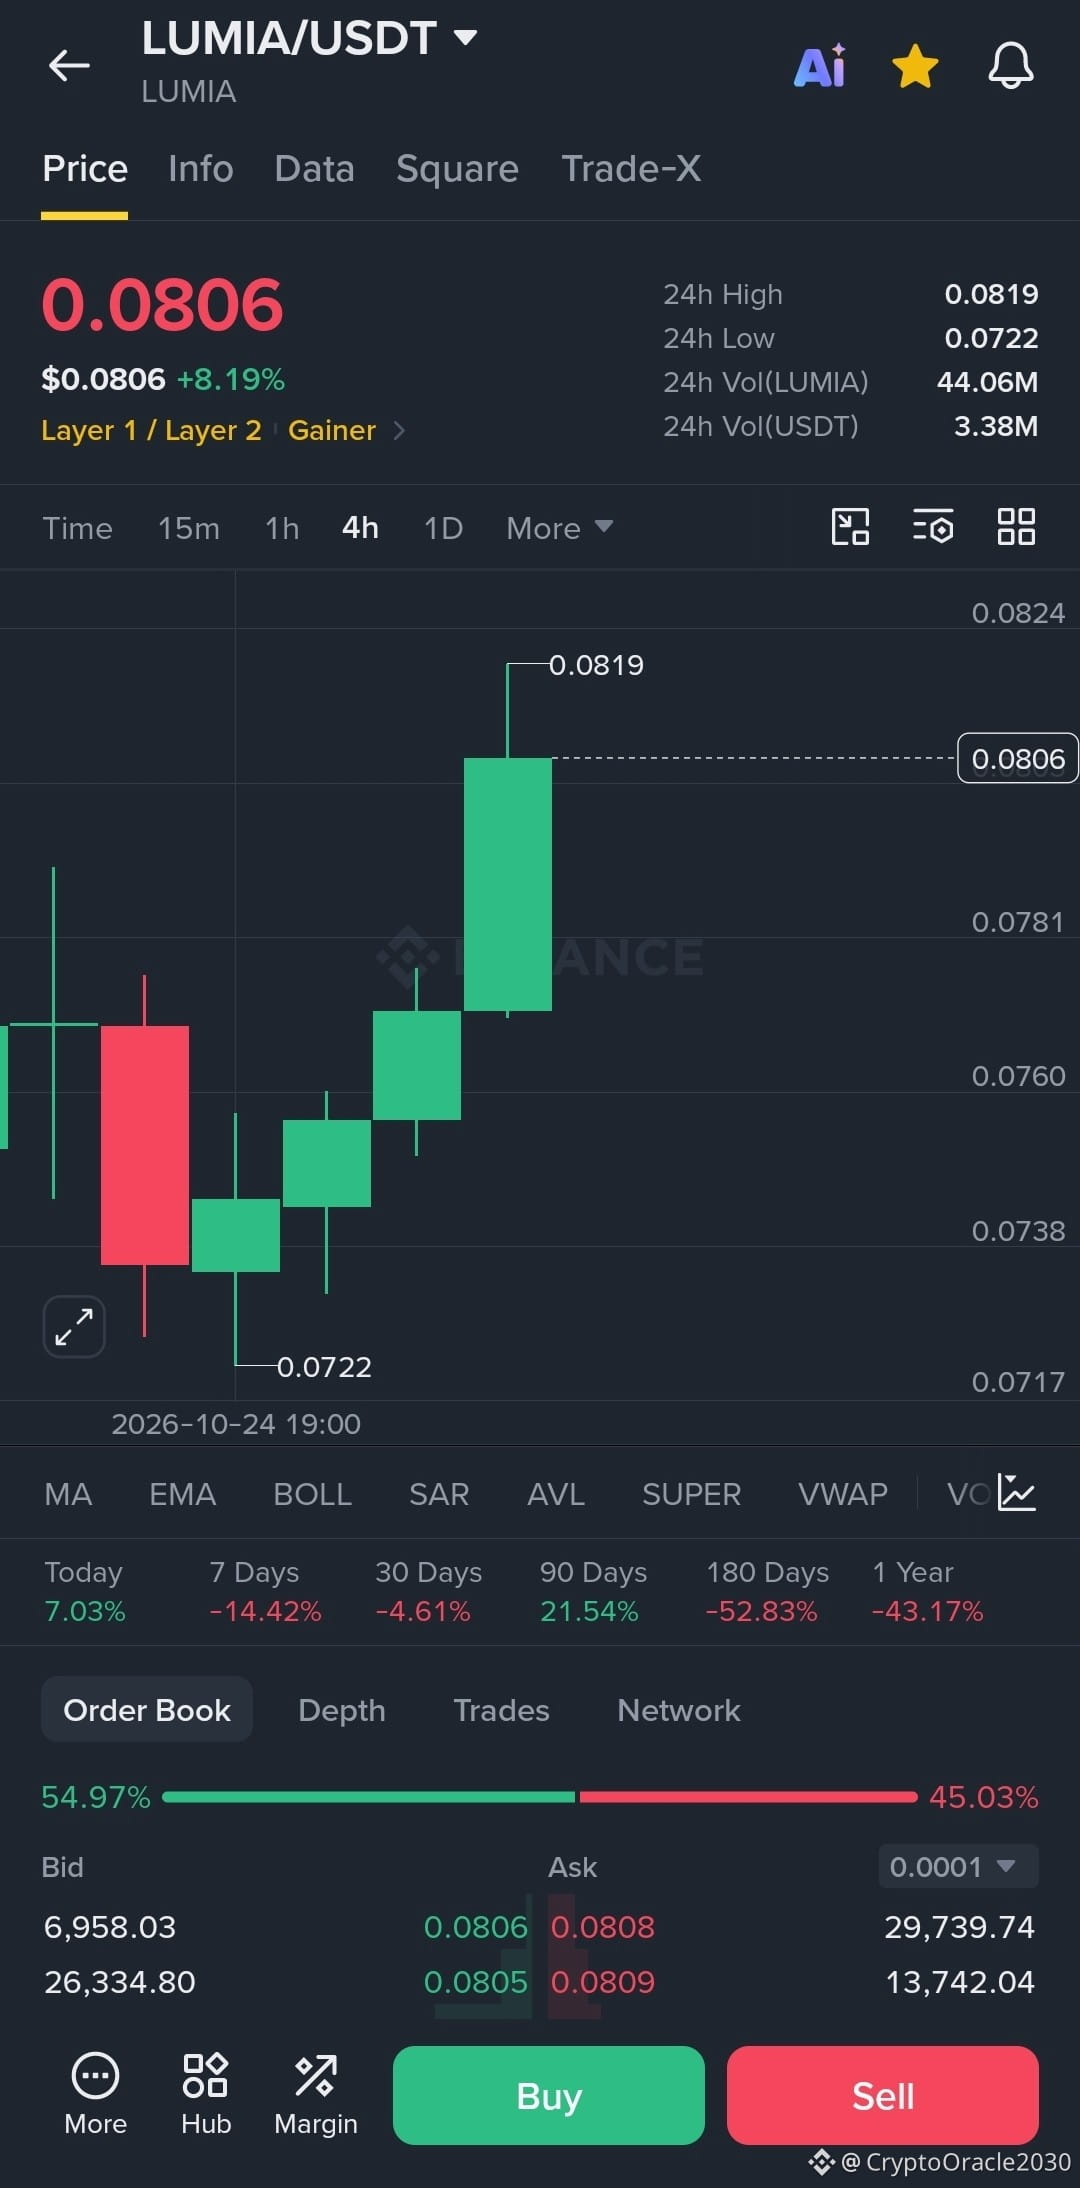
🚨 $LUMIA /USDT — Buyers are pushing the price toward a key resistance level! 🔥📈
💵 Current price: $0.0806
📈 24-hour change: +8.19%
📊 High: $0.0819
📉 Low: $0.0722
💥 Trading volume: $3.38M USDT
🎯 Trade: LONG 🟢 — Conditional breakout
🟢 Entry zone: $0.0785–$0.0800
🛑 Stop loss (SL): $0.0768
💰 TP1: $0.0820 — +2.5%
💰 TP2: $0.0845 — +5.6%
🚀 TP3: $0.0870 — +8.8%
⚡ $LUMIA bounced strongly from $0.0722, forming a series of bullish 4-hour candles before reaching $0.0806. The price is now nearing resistance at $0.0819, a level that could determine the direction of the next move.
👀 A breakout above $0.0819 and holding above it could open the way toward $0.0845 and then $0.0870. However, rejection at resistance could push the price to retest the entry zone before another attempt to move higher.
#lumia #crypto #altcoins #long #binance
{future}(LUMIAUSDT)
🚨 $LUMIA /USDT — Buyers are pushing the price toward a key resistance level! 🔥📈
💵 Current price: $0.0806
📈 24-hour change: +8.19%
📊 High: $0.0819
📉 Low: $0.0722
💥 Trading volume: $3.38M USDT
🎯 Trade: LONG 🟢 — Conditional breakout
🟢 Entry zone: $0.0785–$0.0800
🛑 Stop loss (SL): $0.0768
💰 TP1: $0.0820 — +2.5%
💰 TP2: $0.0845 — +5.6%
🚀 TP3: $0.0870 — +8.8%
⚡ $LUMIA bounced strongly from $0.0722, forming a series of bullish 4-hour candles before reaching $0.0806. The price is now nearing resistance at $0.0819, a level that could determine the direction of the next move.
👀 A breakout above $0.0819 and holding above it could open the way toward $0.0845 and then $0.0870. However, rejection at resistance could push the price to retest the entry zone before another attempt to move higher.
#lumia #crypto #altcoins #long #binance
125
·
--
Bullish
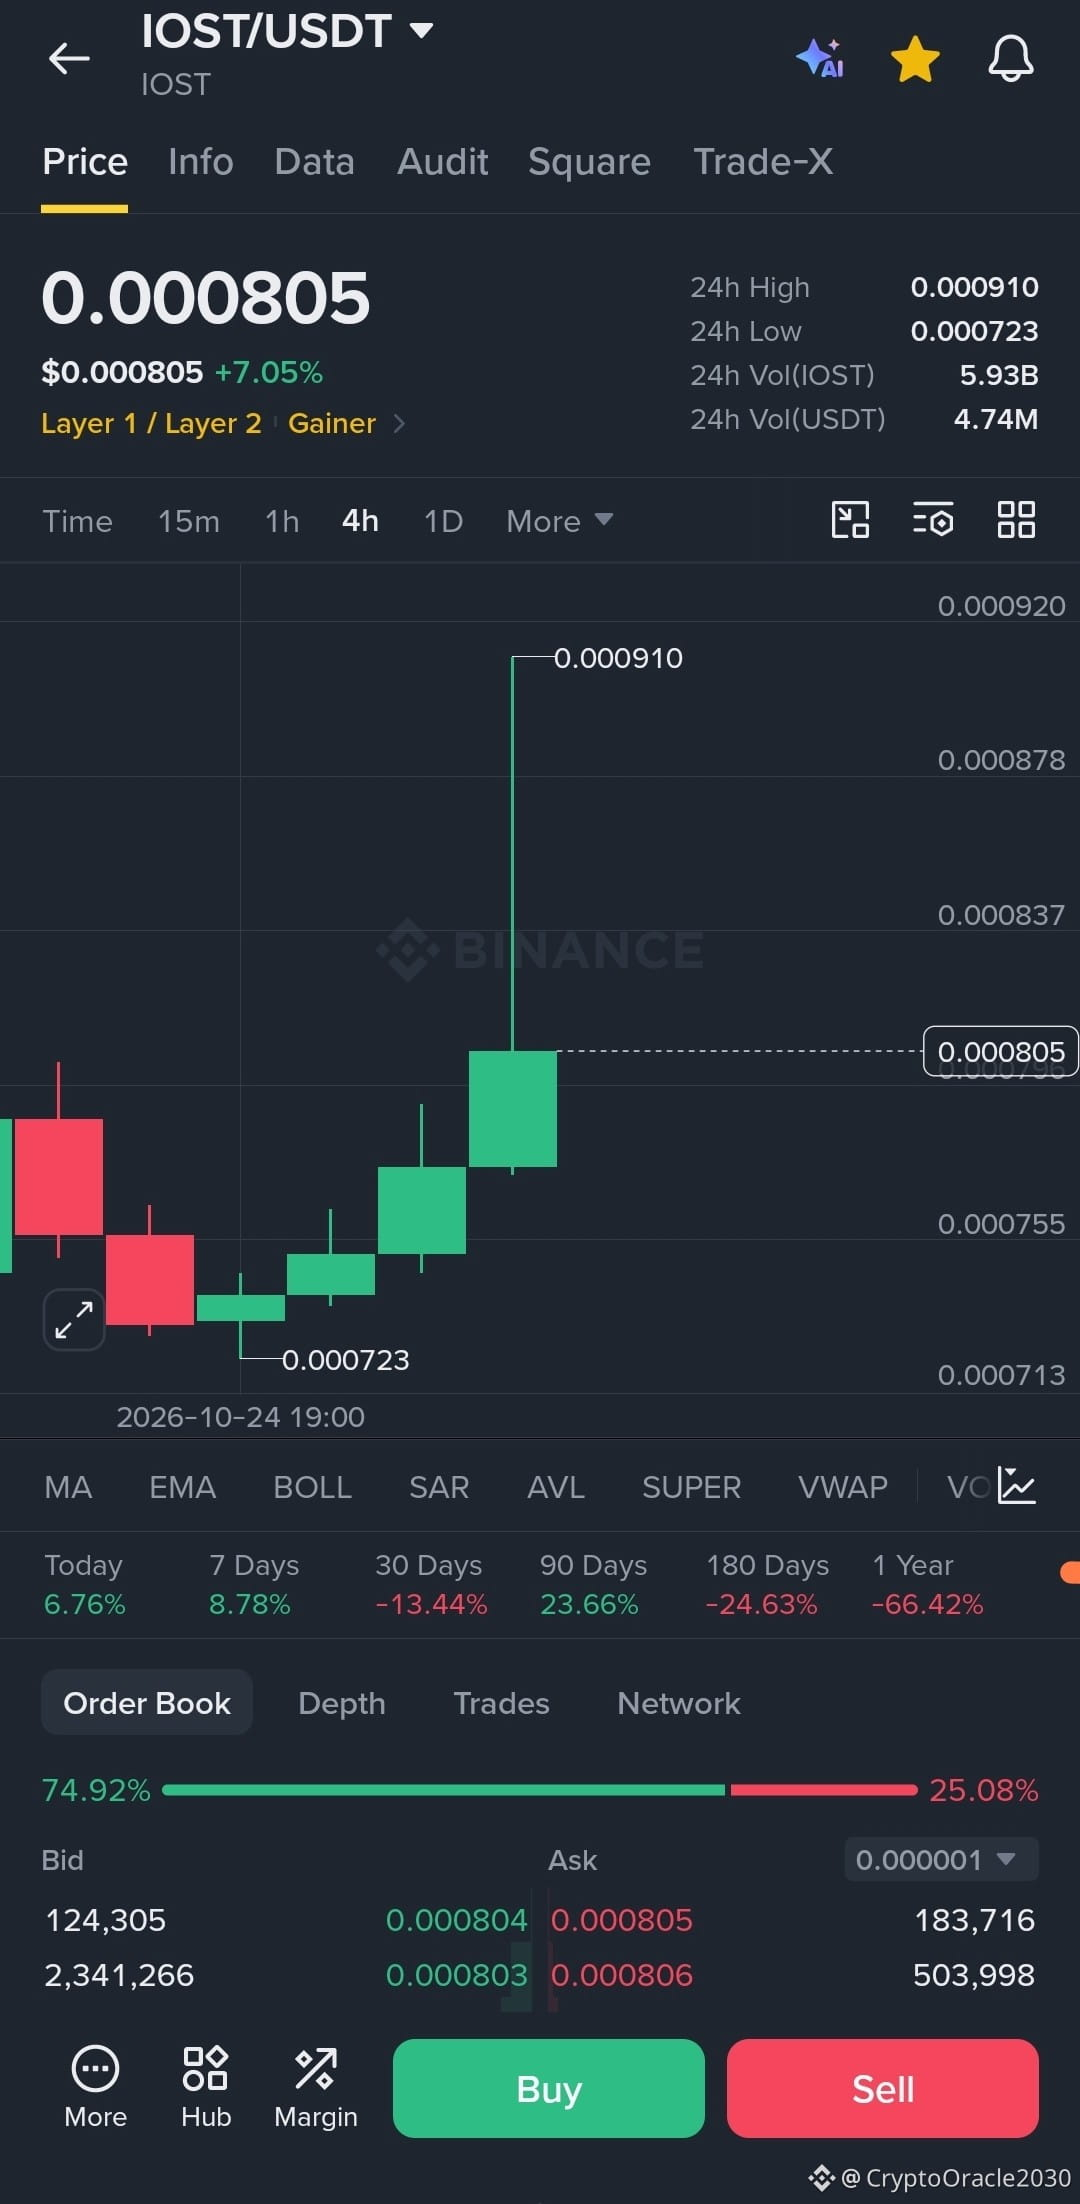
🚨 $IOST /USDT — Is it nearing a breakout above the high? 🚀📈
💵 Current price: $0.000805
📈 24-hour change: +7.05%
📊 High: $0.000910
📉 Low: $0.000723
💥 Trading volume: $4.74M USDT
🎯 Trade: LONG 🟢 — Conditional breakout
🟢 Entry zone: $0.000785–$0.000805
🛑 Stop loss (SL): $0.000765
💰 TP1: $0.000837 — +4.0%
💰 TP2: $0.000878 — +9.1%
🚀 TP3: $0.000905 — +12.4%
⚡ $IOST is showing a clear recovery on the 4-hour timeframe, with consecutive green candles and a bounce from $0.000723 to $0.000805. Reaching $0.000910 remains the key test for the continuation of bullish momentum.
👀 Holding above the $0.000785–$0.000805 zone could support another attempt to move higher, while a break above $0.000837 could pave the way toward $0.000878, followed by a retest of the high. Failure to hold support, however, could lead to a correction before the move continues.
#iost #crypto #altcoins #long #binance
{future}(IOSTUSDT)
🚨 $IOST /USDT — Is it nearing a breakout above the high? 🚀📈
💵 Current price: $0.000805
📈 24-hour change: +7.05%
📊 High: $0.000910
📉 Low: $0.000723
💥 Trading volume: $4.74M USDT
🎯 Trade: LONG 🟢 — Conditional breakout
🟢 Entry zone: $0.000785–$0.000805
🛑 Stop loss (SL): $0.000765
💰 TP1: $0.000837 — +4.0%
💰 TP2: $0.000878 — +9.1%
🚀 TP3: $0.000905 — +12.4%
⚡ $IOST is showing a clear recovery on the 4-hour timeframe, with consecutive green candles and a bounce from $0.000723 to $0.000805. Reaching $0.000910 remains the key test for the continuation of bullish momentum.
👀 Holding above the $0.000785–$0.000805 zone could support another attempt to move higher, while a break above $0.000837 could pave the way toward $0.000878, followed by a retest of the high. Failure to hold support, however, could lead to a correction before the move continues.
#iost #crypto #altcoins #long #binance
397
·
--
Bullish
🚨$KAT /USDT — Is Katana preparing for another breakout? 🟢🔥
💵 Current price: $0.00447
📈 24-hour change: +10.92%
📊 High: $0.00636
📉 Low: $0.00399
💥 Trading volume: $12.24M USDT
🎯 Trade: LONG 🟢 — Potential recovery setup
🟢 Entry zone: $0.00435–$0.00448
🛑 Stop loss (SL): $0.00420
💰 TP1: $0.00466 — +4.3%
💰 TP2: $0.00490 — +9.6%
🚀 TP3: $0.00515 — +15.2%
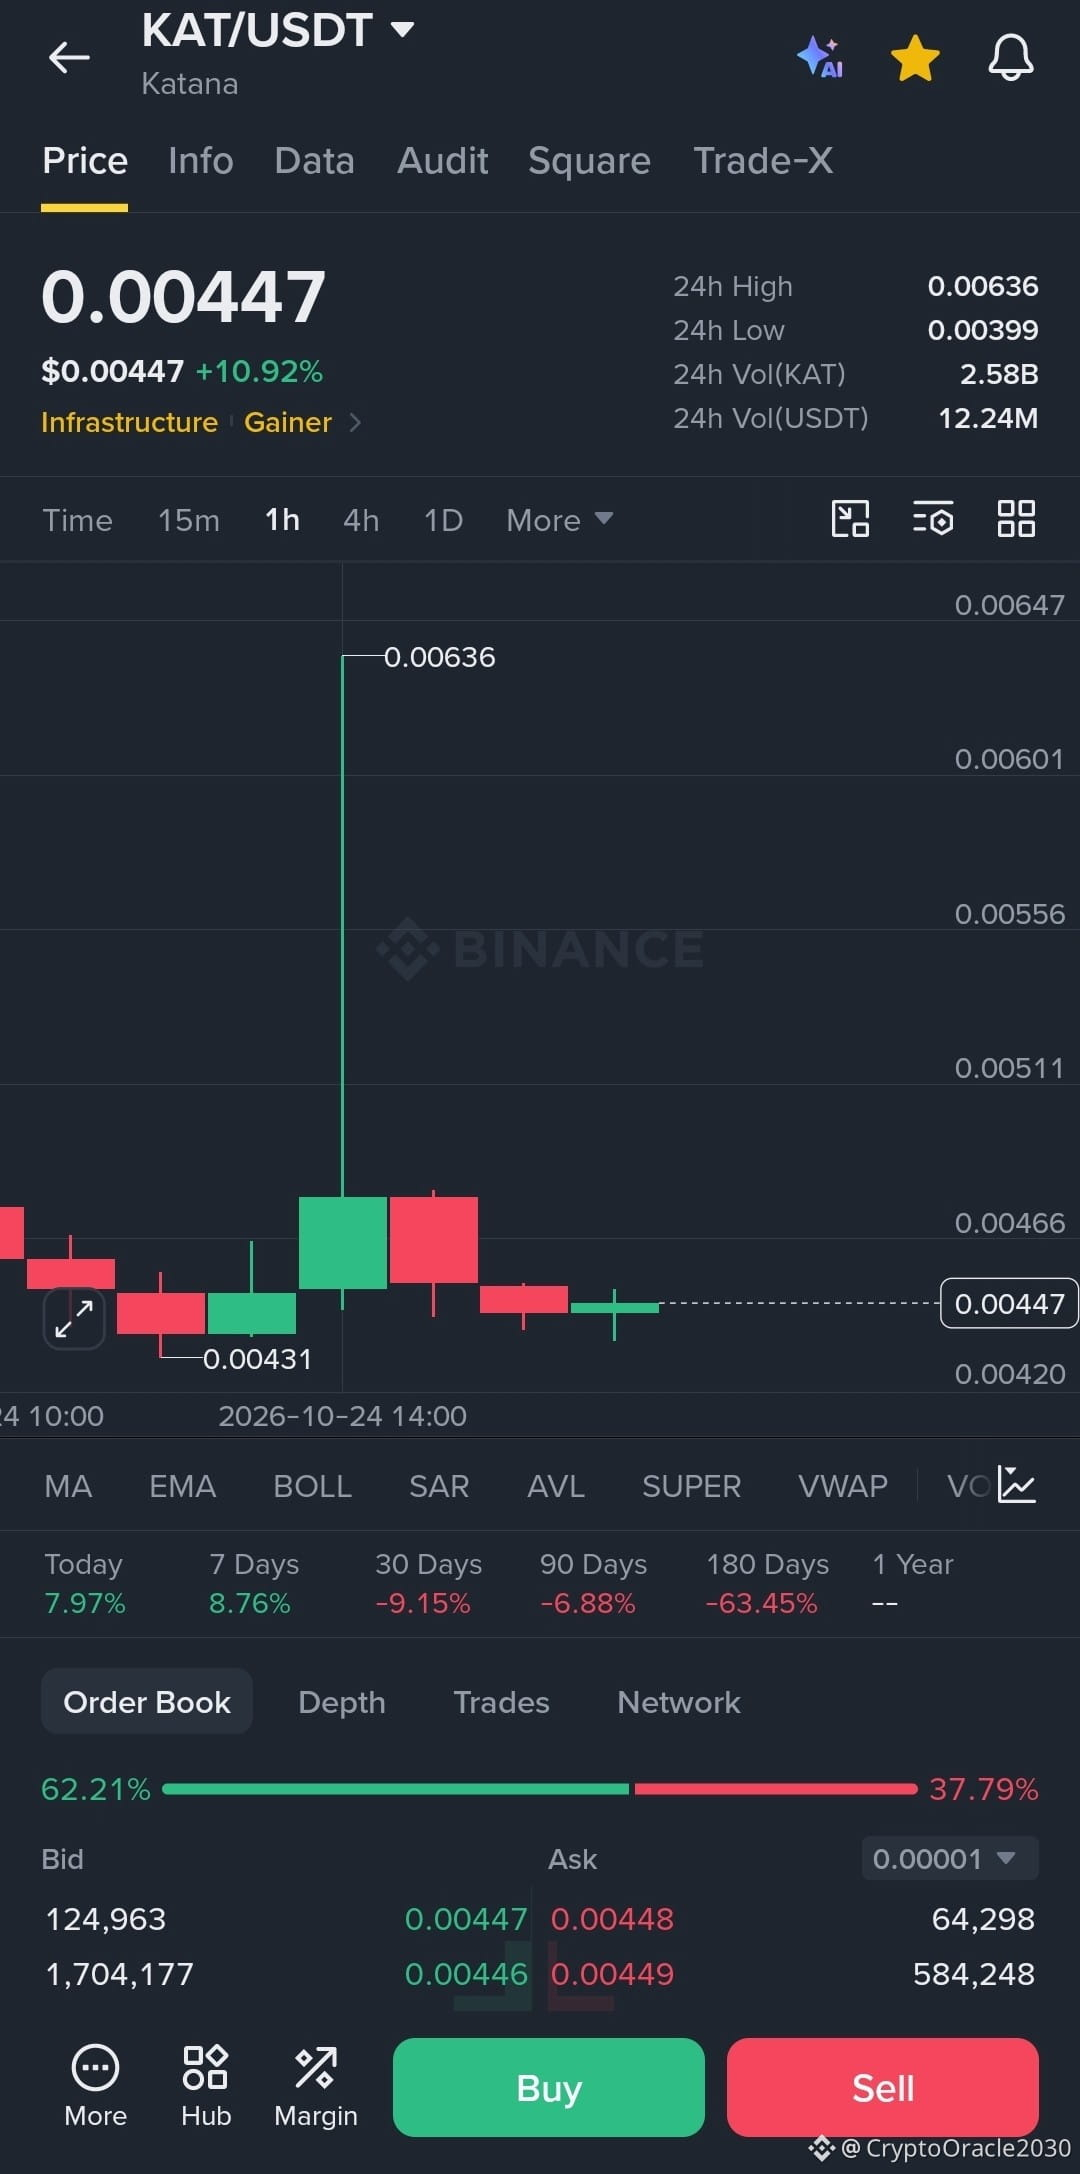
⚡ $KAT remains above its 24-hour low of $0.00399 after a sharp wick toward $0.00636. The price is consolidating around $0.00447, and buyers currently account for 62.21% of the displayed order book.
👀 A break above $0.00466 could open the way toward the next resistance levels. However, the long upper wick signals strong rejection at higher prices. A drop below $0.00431 would weaken the recovery scenario.
#KAT #Katana #Crypto #LONG #Binance
{future}(KATUSDT)
🚨$KAT /USDT — Is Katana preparing for another breakout? 🟢🔥
💵 Current price: $0.00447
📈 24-hour change: +10.92%
📊 High: $0.00636
📉 Low: $0.00399
💥 Trading volume: $12.24M USDT
🎯 Trade: LONG 🟢 — Potential recovery setup
🟢 Entry zone: $0.00435–$0.00448
🛑 Stop loss (SL): $0.00420
💰 TP1: $0.00466 — +4.3%
💰 TP2: $0.00490 — +9.6%
🚀 TP3: $0.00515 — +15.2%
⚡ $KAT remains above its 24-hour low of $0.00399 after a sharp wick toward $0.00636. The price is consolidating around $0.00447, and buyers currently account for 62.21% of the displayed order book.
👀 A break above $0.00466 could open the way toward the next resistance levels. However, the long upper wick signals strong rejection at higher prices. A drop below $0.00431 would weaken the recovery scenario.
#KAT #Katana #Crypto #LONG #Binance
270
·
--
Bullish
🚨$ERA /USDT — Bulls are fighting to extend the rebound! 🟢📈
💵 Current price: $0.0884
📈 24-hour change: +21.26%
📊 High: $0.1031
📉 Low: $0.0709
💥 Trading volume: $26.97M USDT
🎯 Trade: LONG 🟢 — Conditional bullish continuation
🟢 Entry zone: $0.0865–$0.0885
🛑 Stop loss (SL): $0.0828
💰 TP1: $0.0910 — +2.9%
💰 TP2: $0.0960 — +8.5%
🚀 TP3: $0.1031 — +16.6%
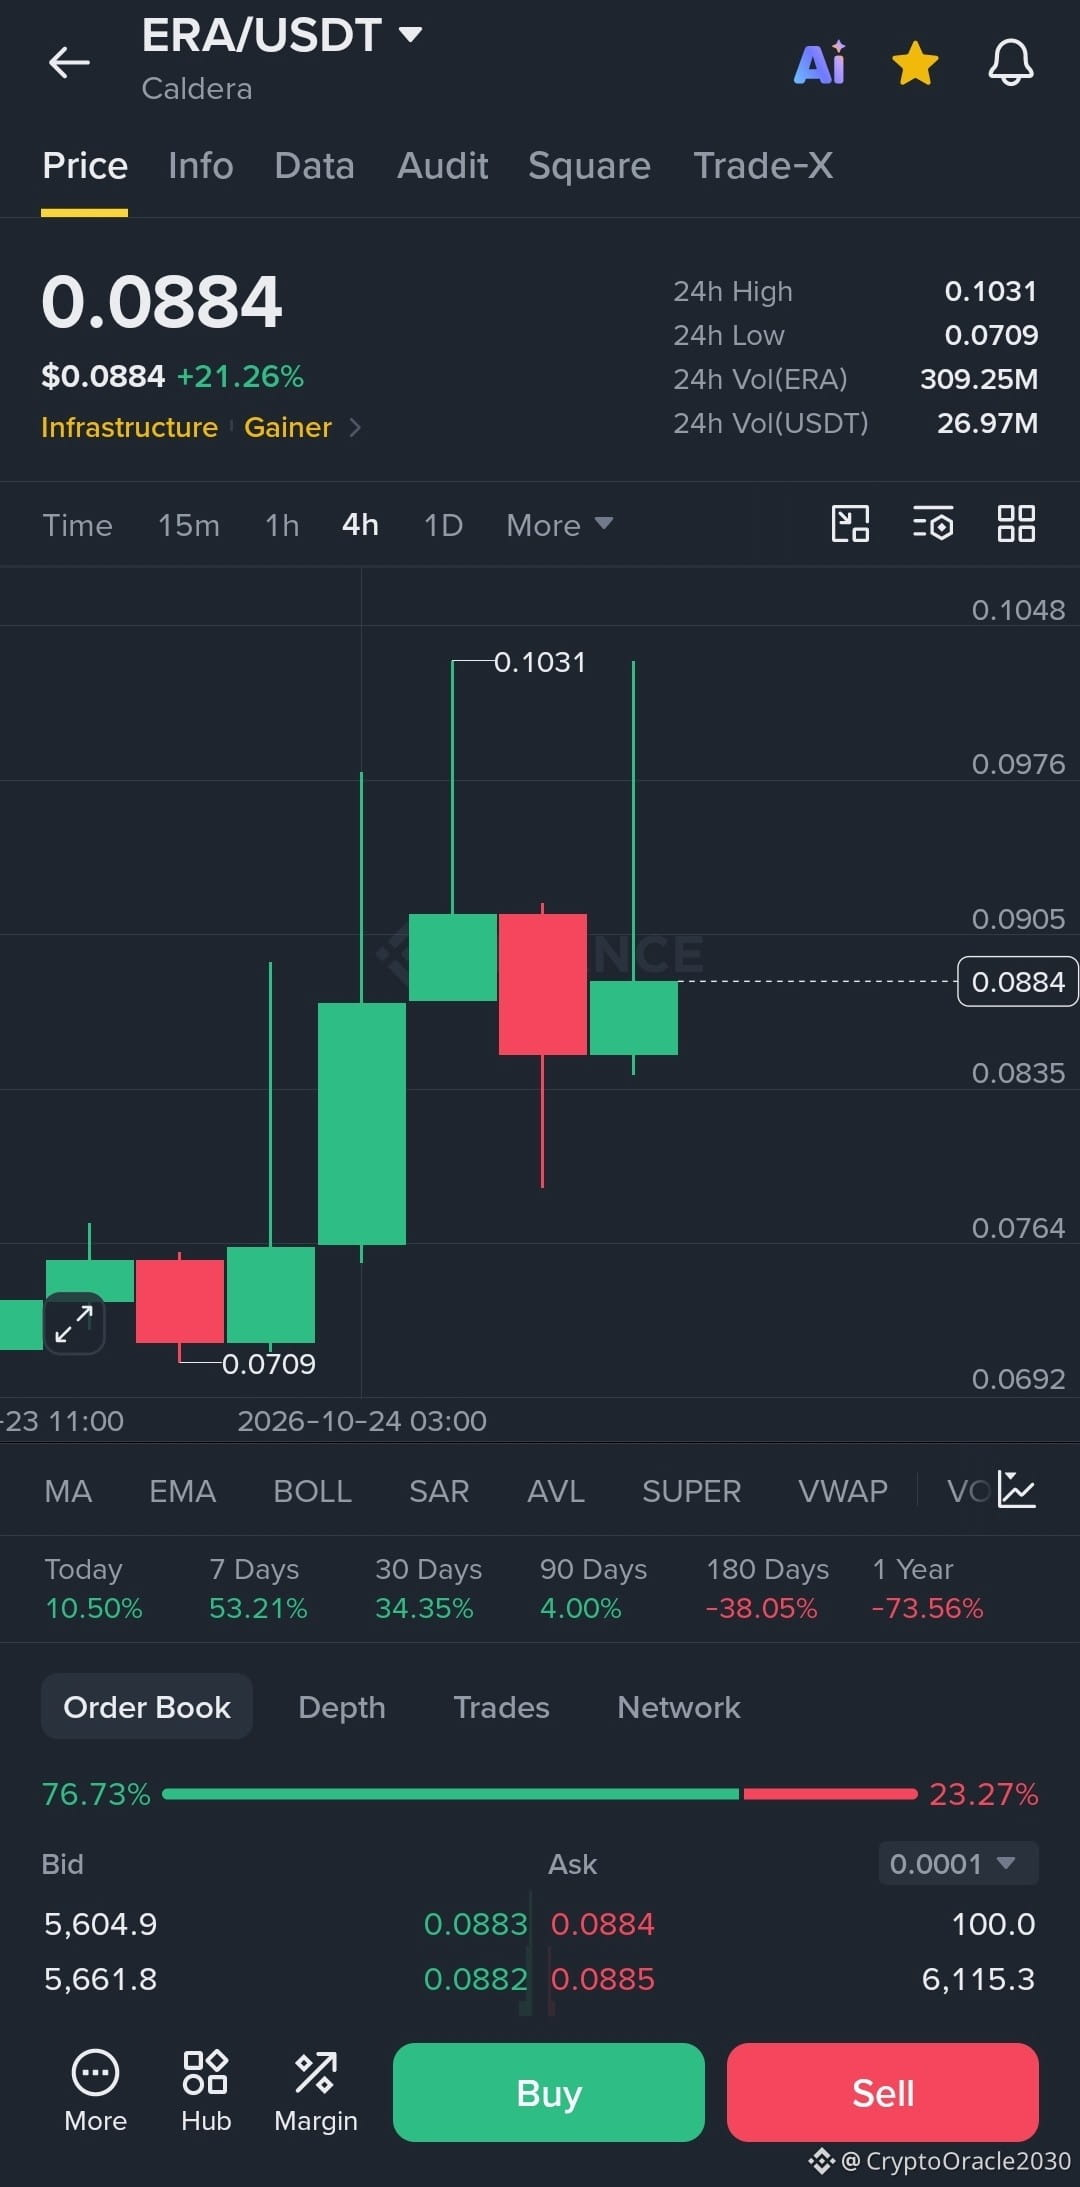
⚡ $ERA has rebounded strongly from $0.0709 and is attempting to stabilize around $0.0884 after reaching $0.1031. The 4-hour chart shows renewed buying interest, while the order book favors buyers at 76.73%.
👀 A sustained move above $0.0905 could support another push higher. Failure to hold the $0.0835–$0.0865 area may weaken the bullish setup. Wait for confirmation rather than chasing the spike.
#ERA #Caldera #Crypto #LONG #Binance
{future}(ERAUSDT)
🚨$ERA /USDT — Bulls are fighting to extend the rebound! 🟢📈
💵 Current price: $0.0884
📈 24-hour change: +21.26%
📊 High: $0.1031
📉 Low: $0.0709
💥 Trading volume: $26.97M USDT
🎯 Trade: LONG 🟢 — Conditional bullish continuation
🟢 Entry zone: $0.0865–$0.0885
🛑 Stop loss (SL): $0.0828
💰 TP1: $0.0910 — +2.9%
💰 TP2: $0.0960 — +8.5%
🚀 TP3: $0.1031 — +16.6%
⚡ $ERA has rebounded strongly from $0.0709 and is attempting to stabilize around $0.0884 after reaching $0.1031. The 4-hour chart shows renewed buying interest, while the order book favors buyers at 76.73%.
👀 A sustained move above $0.0905 could support another push higher. Failure to hold the $0.0835–$0.0865 area may weaken the bullish setup. Wait for confirmation rather than chasing the spike.
#ERA #Caldera #Crypto #LONG #Binance
39
·
--
Bullish
🚨$NEWT /USDT — Can the bullish rally continue? 🟢🚀
💵 Current price: $0.04873
📈 24-hour change: +15.39%
📊 24h High: $0.05049
📉 24h Low: $0.04150
💥 Trading volume: $1.34M USDT
🎯 Trade: LONG 🟢 — Momentum continuation setup
🟢 Entry zone: $0.04780–$0.04880
🛑 Stop loss (SL): $0.04580
💰 TP1: $0.04980 — +2.2%
💰 TP2: $0.05049 — +3.6%
🚀 TP3: $0.05200 — +6.7%
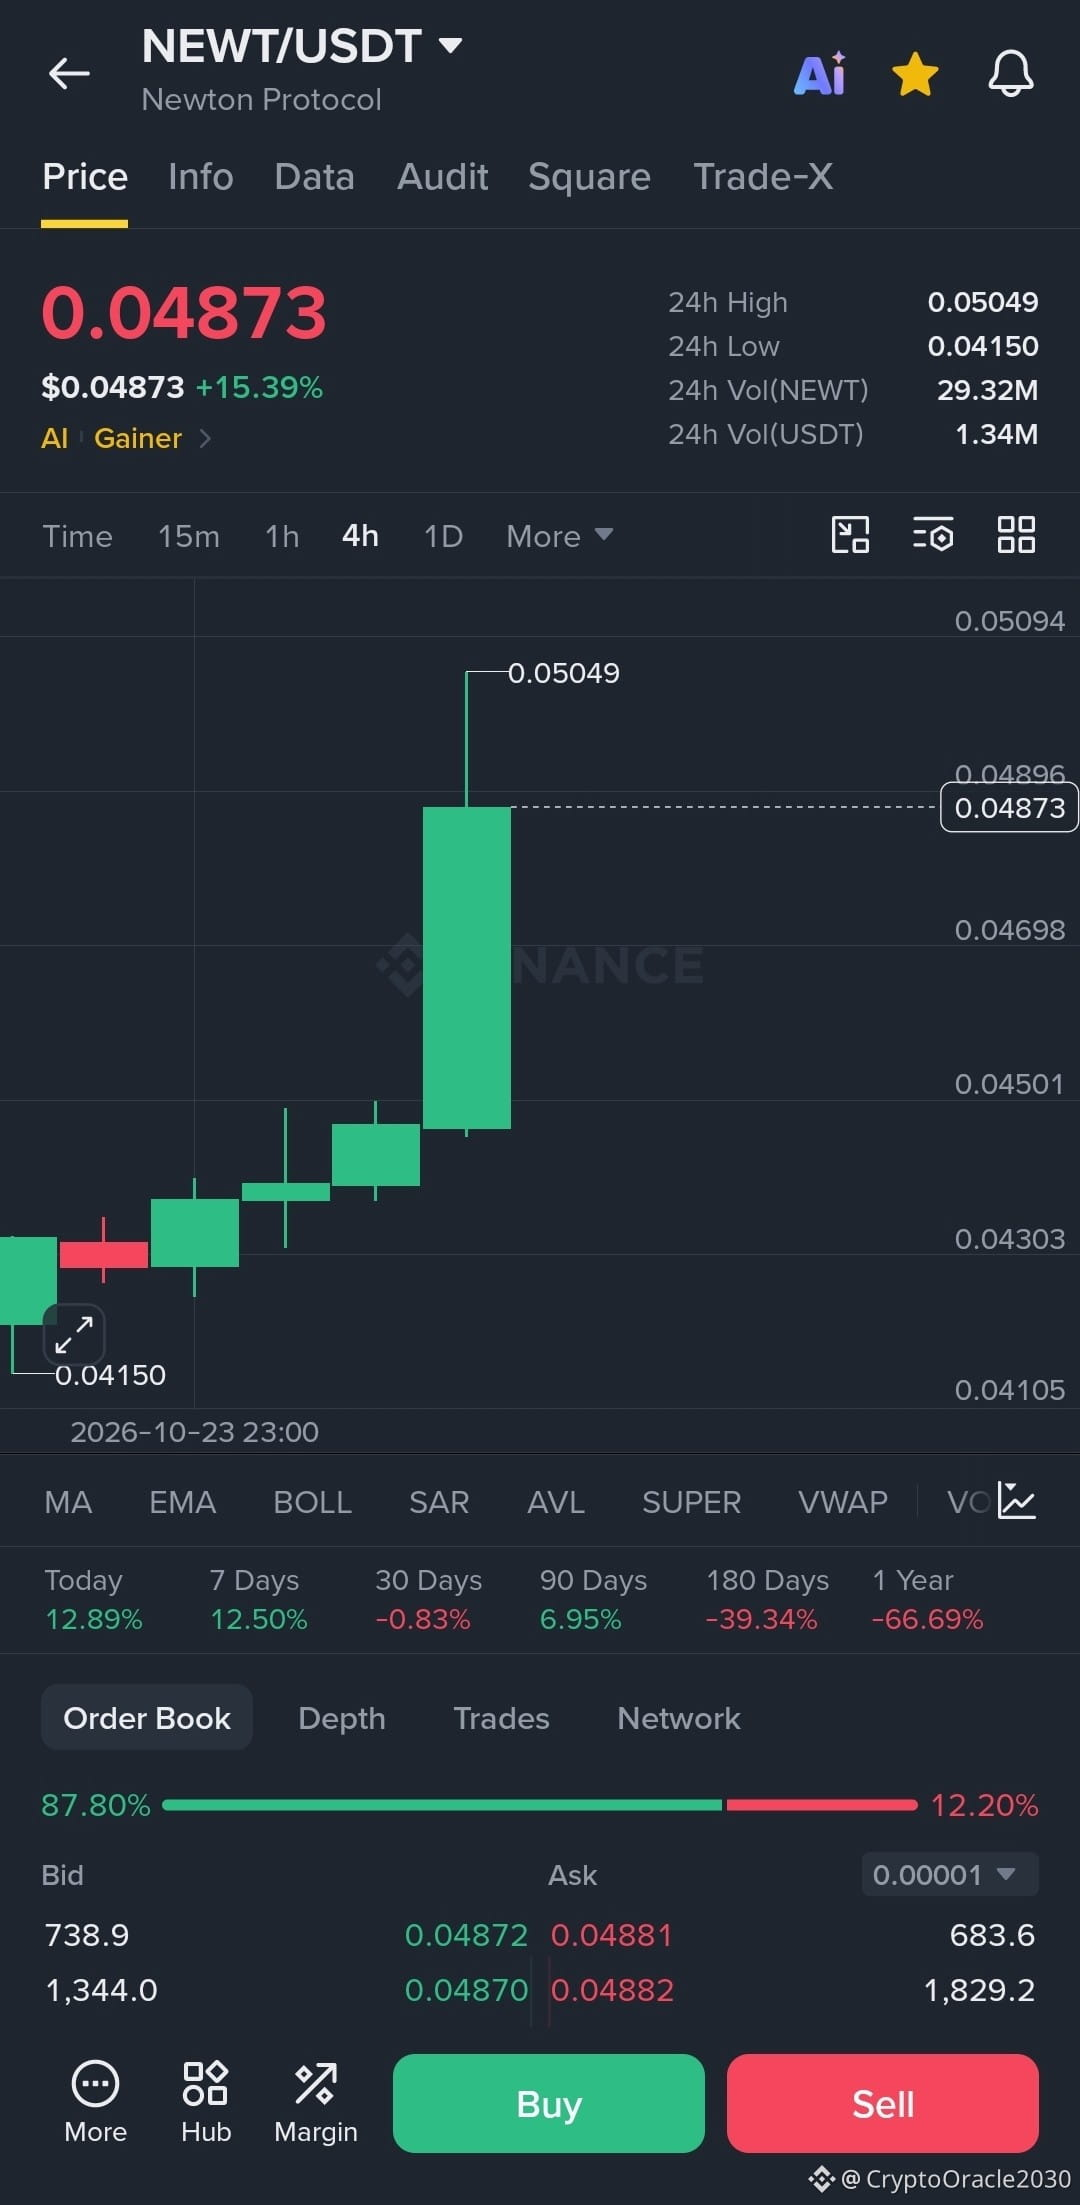
⚡ $NEWT has surged from $0.04150 and is trading near its 24-hour high, signaling strong short-term bullish momentum. The latest 4-hour candle shows a sharp upward move, while the order book displays 87.80% buy-side interest.
👀 Watch for a breakout above $0.05049 to confirm further upside. A rejection at resistance or a drop below the entry zone could trigger a pullback. Avoid chasing the price after a sharp rally.
#NEWT #NewtonProtocol #Crypto #LONG #Binance
{future}(NEWTUSDT)
🚨$NEWT /USDT — Can the bullish rally continue? 🟢🚀
💵 Current price: $0.04873
📈 24-hour change: +15.39%
📊 24h High: $0.05049
📉 24h Low: $0.04150
💥 Trading volume: $1.34M USDT
🎯 Trade: LONG 🟢 — Momentum continuation setup
🟢 Entry zone: $0.04780–$0.04880
🛑 Stop loss (SL): $0.04580
💰 TP1: $0.04980 — +2.2%
💰 TP2: $0.05049 — +3.6%
🚀 TP3: $0.05200 — +6.7%
⚡ $NEWT has surged from $0.04150 and is trading near its 24-hour high, signaling strong short-term bullish momentum. The latest 4-hour candle shows a sharp upward move, while the order book displays 87.80% buy-side interest.
👀 Watch for a breakout above $0.05049 to confirm further upside. A rejection at resistance or a drop below the entry zone could trigger a pullback. Avoid chasing the price after a sharp rally.
#NEWT #NewtonProtocol #Crypto #LONG #Binance
52
·
--
Bullish
🚨$LA /USDT — Is the rally targeting a fresh breakout? 🟢🚀
💵 Current price: $0.06645
📈 24-hour change: +18.72%
📊 High: $0.07019
📉 Low: $0.05516
💥 Trading volume: $41.43M USDT
🎯 Trade: LONG 🟢 — Conditional bullish continuation
🟢 Entry zone: $0.06450–$0.06600
🛑 Stop loss (SL): $0.06200
💰 TP1: $0.06800 — +3.0%
💰 TP2: $0.07000 — +6.0%
🚀 TP3: $0.07300 — +10.5%
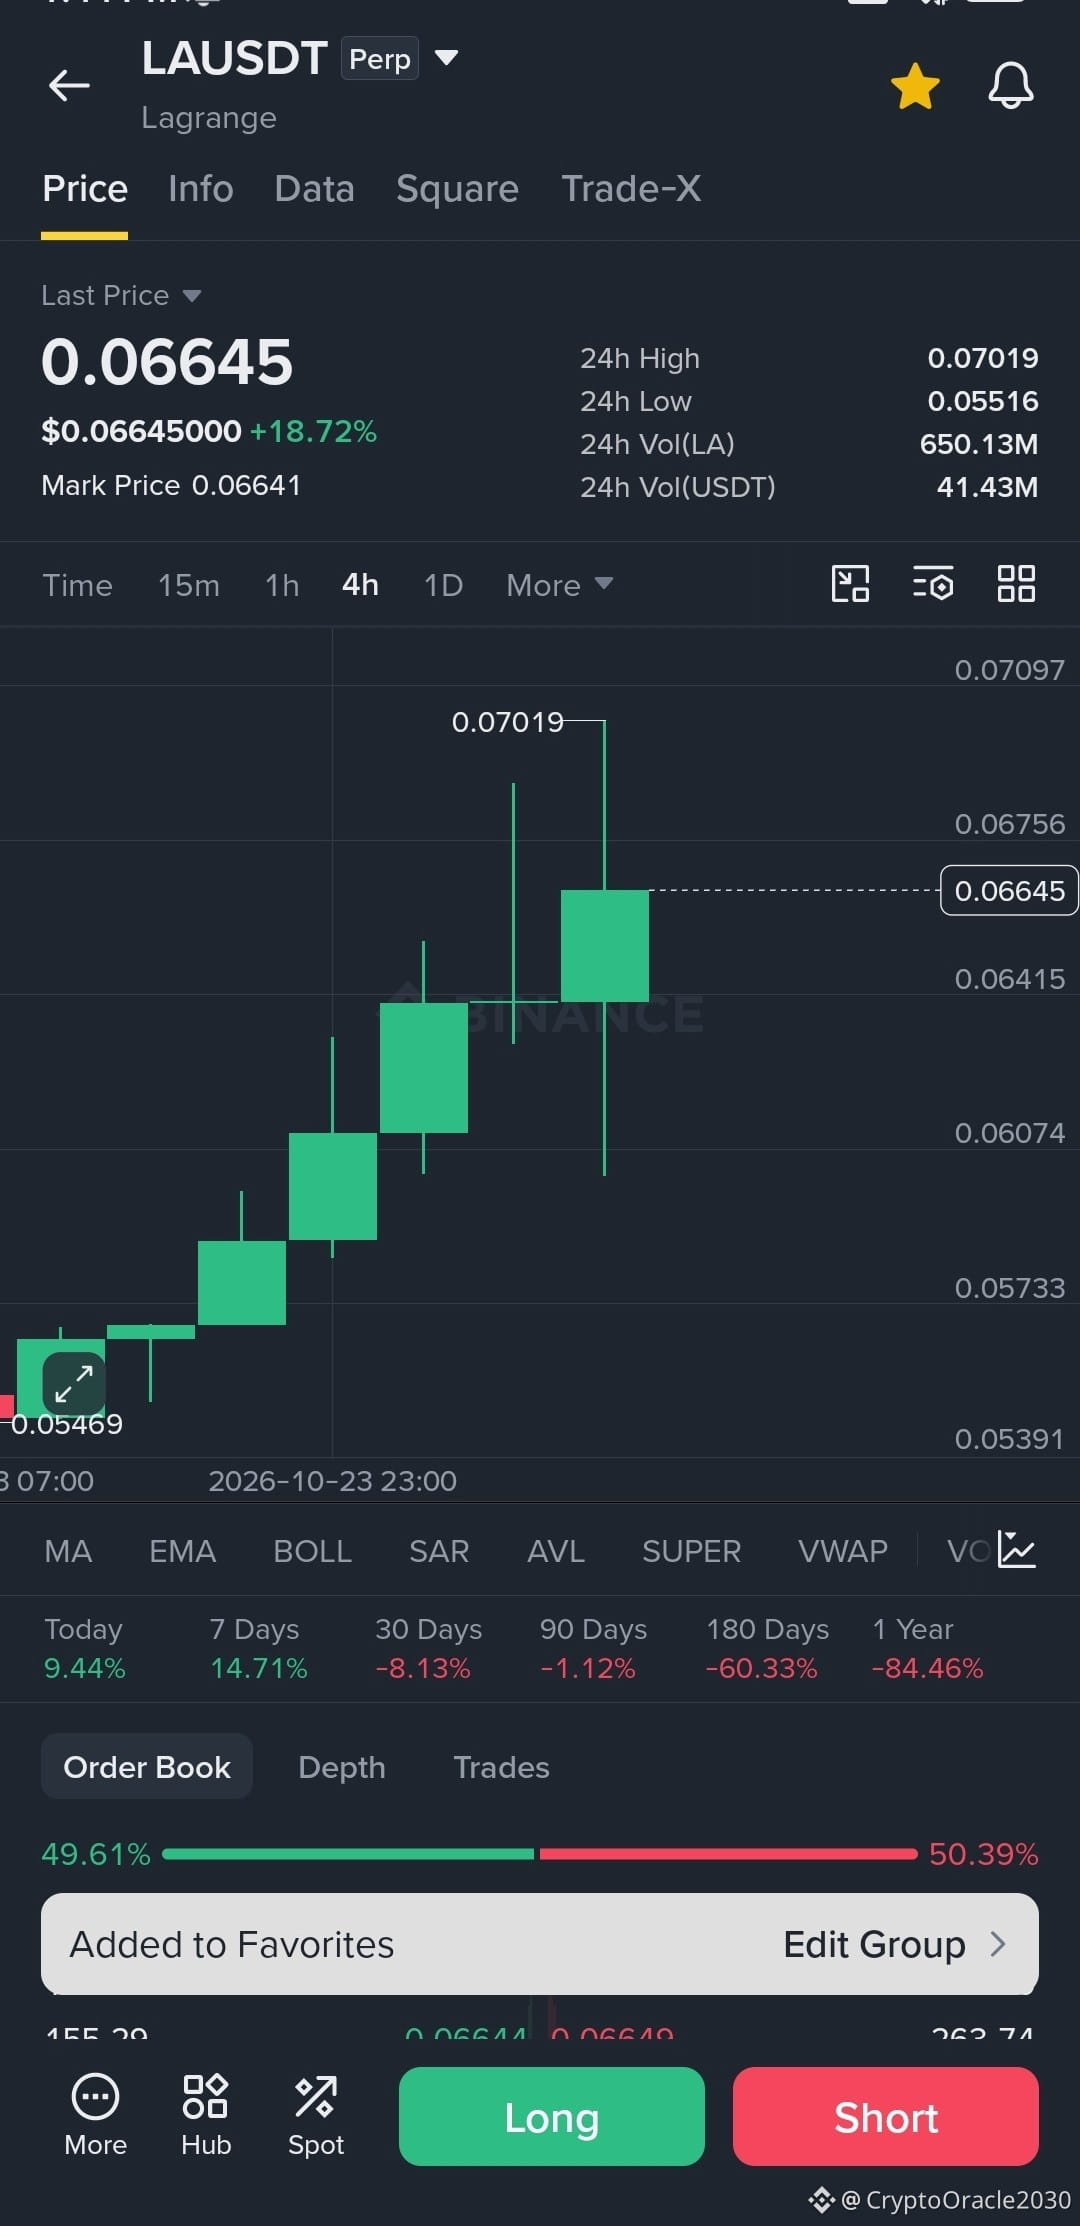
⚡ $LA has climbed from $0.05516 toward the $0.07019 resistance, with consecutive bullish 4-hour candles showing strong upward momentum. However, the latest candle's long wicks suggest volatility and possible selling pressure near the recent high.
👀 A sustained hold above $0.06450 could support another attempt at $0.07019. A confirmed breakout may open the way toward $0.07300, while a drop below $0.06200 would invalidate this setup. Avoid chasing an extended move.
#LA #Lagrange #Crypto #LONG #Binance
{future}(LAUSDT)
🚨$LA /USDT — Is the rally targeting a fresh breakout? 🟢🚀
💵 Current price: $0.06645
📈 24-hour change: +18.72%
📊 High: $0.07019
📉 Low: $0.05516
💥 Trading volume: $41.43M USDT
🎯 Trade: LONG 🟢 — Conditional bullish continuation
🟢 Entry zone: $0.06450–$0.06600
🛑 Stop loss (SL): $0.06200
💰 TP1: $0.06800 — +3.0%
💰 TP2: $0.07000 — +6.0%
🚀 TP3: $0.07300 — +10.5%
⚡ $LA has climbed from $0.05516 toward the $0.07019 resistance, with consecutive bullish 4-hour candles showing strong upward momentum. However, the latest candle's long wicks suggest volatility and possible selling pressure near the recent high.
👀 A sustained hold above $0.06450 could support another attempt at $0.07019. A confirmed breakout may open the way toward $0.07300, while a drop below $0.06200 would invalidate this setup. Avoid chasing an extended move.
#LA #Lagrange #Crypto #LONG #Binance
76
·
--
Bearish
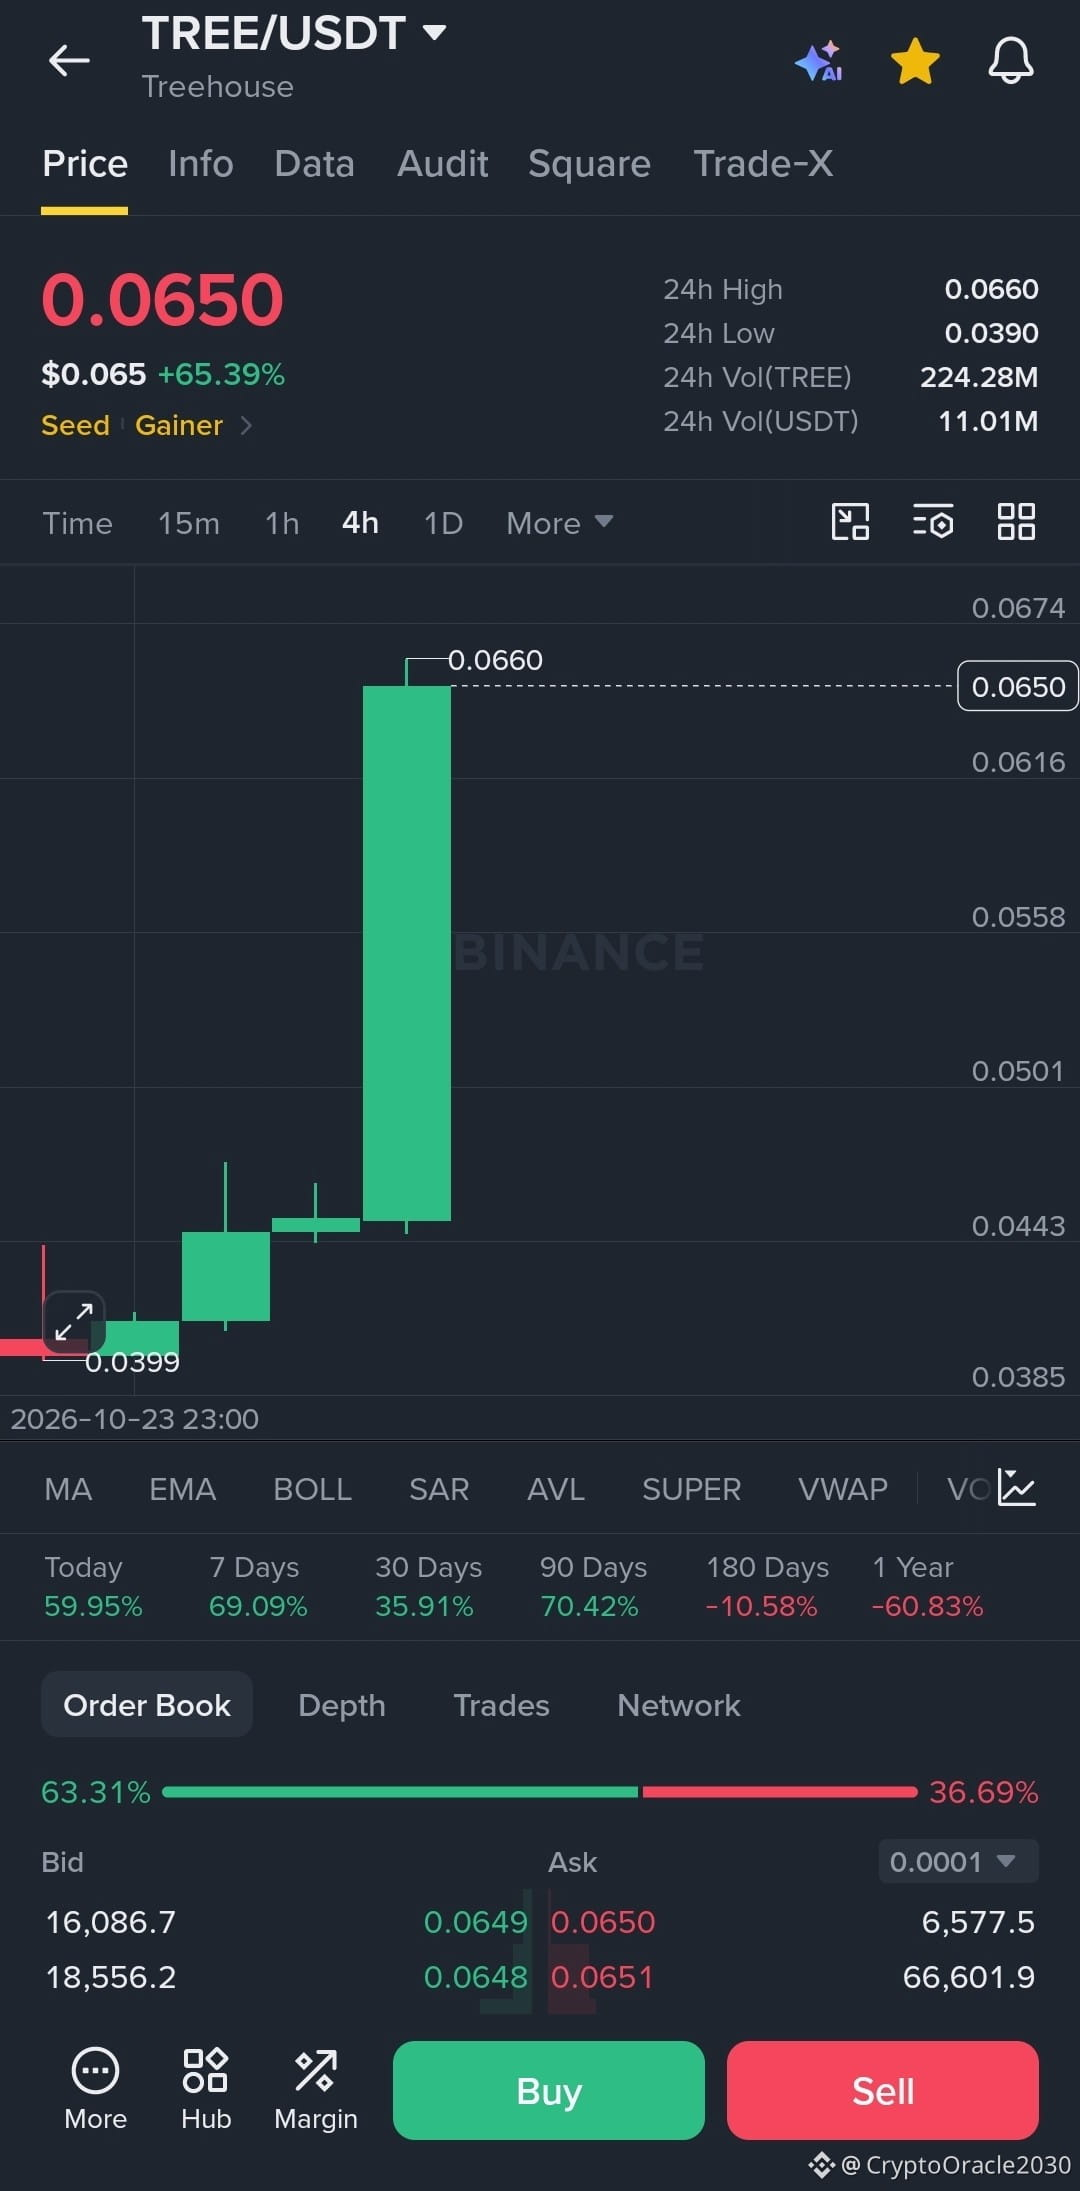
🚨$TREE /USDT — Is the massive rally running out of steam? 🔴📉
💵 Current price: $0.0650
📈 24-hour change: +65.39%
📊 High: $0.0660
📉 Low: $0.0390
💥 Trading volume: $11.01M USDT
🎯 Trade: SHORT 🔴 — Conditional pullback
🔴 Entry zone: $0.0645–$0.0660
🛑 Stop loss (SL): $0.0685
💰 TP1: $0.0610 — +5.4%
💰 TP2: $0.0570 — +11.5%
🚀 TP3: $0.0520 — +19.2%
⚡ $TREE has surged more than 65% in 24 hours and is trading close to its $0.0660 high. After such a sharp move, profit-taking could trigger a correction, particularly if the price fails to break above resistance.
👀 A rejection around $0.0650–$0.0660 followed by a break below $0.0640 would strengthen the bearish setup. If buyers push decisively above $0.0660, the short scenario weakens. Wait for confirmation rather than entering blindly after the rally.
#TREE #Treehouse #Crypto #SHORT #Binance
{future}(TREEUSDT)
🚨$TREE /USDT — Is the massive rally running out of steam? 🔴📉
💵 Current price: $0.0650
📈 24-hour change: +65.39%
📊 High: $0.0660
📉 Low: $0.0390
💥 Trading volume: $11.01M USDT
🎯 Trade: SHORT 🔴 — Conditional pullback
🔴 Entry zone: $0.0645–$0.0660
🛑 Stop loss (SL): $0.0685
💰 TP1: $0.0610 — +5.4%
💰 TP2: $0.0570 — +11.5%
🚀 TP3: $0.0520 — +19.2%
⚡ $TREE has surged more than 65% in 24 hours and is trading close to its $0.0660 high. After such a sharp move, profit-taking could trigger a correction, particularly if the price fails to break above resistance.
👀 A rejection around $0.0650–$0.0660 followed by a break below $0.0640 would strengthen the bearish setup. If buyers push decisively above $0.0660, the short scenario weakens. Wait for confirmation rather than entering blindly after the rally.
#TREE #Treehouse #Crypto #SHORT #Binance
1
245
·
--
Bullish
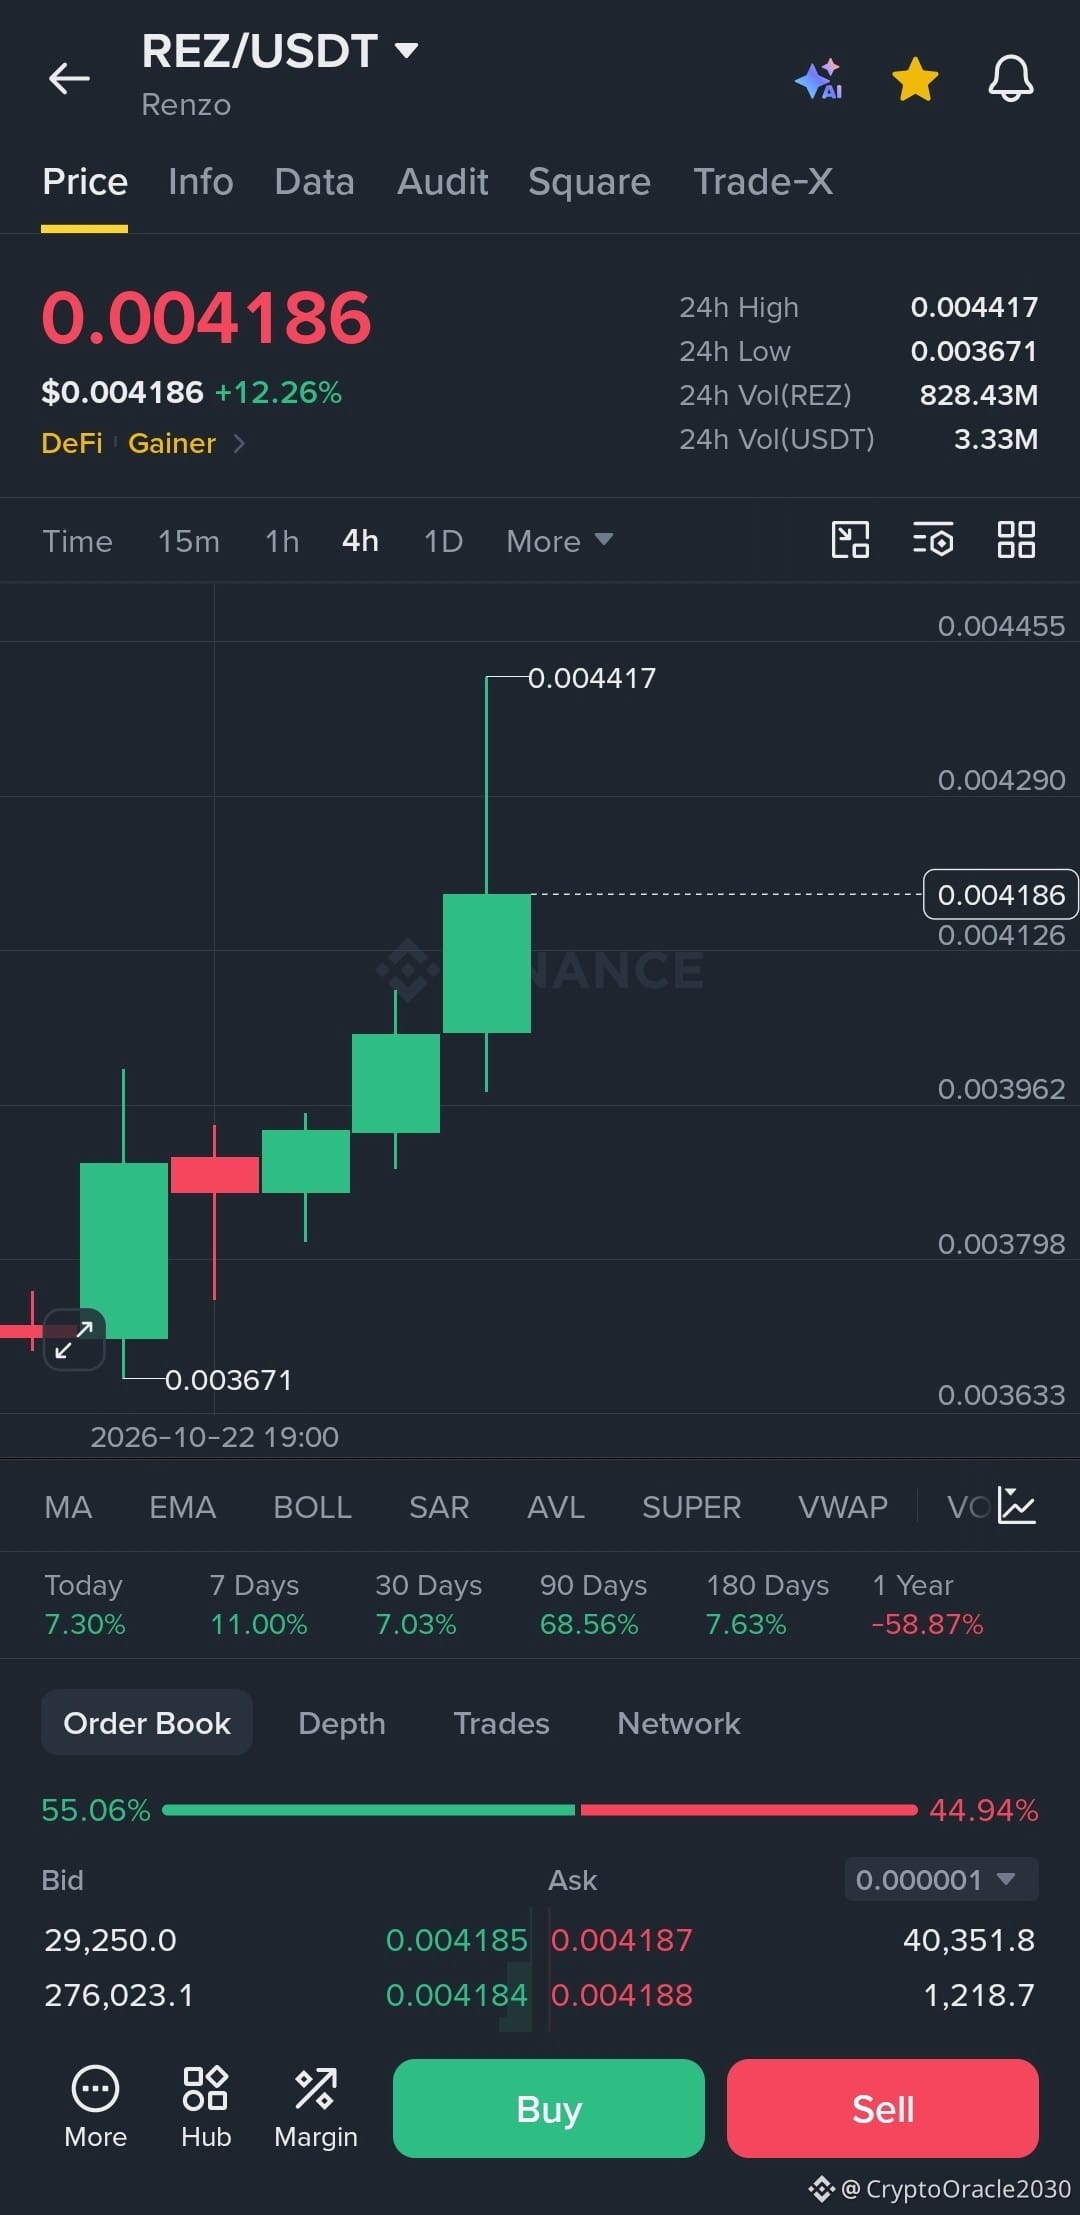
🚨 $REZ /USDT — Is this rally preparing for another breakout? 🚀📈
💵 Current price: $0.004186
📈 24-hour change: +12.26%
📊 High: $0.004417
📉 Low: $0.003671
💥 Trading volume: $3.33M USDT
🎯 Trade: LONG 🟢 — Conditional breakout
🟢 Entry zone: $0.00410–$0.00418
🛑 Stop loss (SL): $0.00395
💰 TP1: $0.00430 — +2.9%
💰 TP2: $0.00442 — +5.7%
🚀 TP3: $0.00460 — +10.0%
⚡ $REZ continues to climb, with consecutive green candles appearing on the 4-hour timeframe. The price is approaching resistance at $0.004417 after rebounding from $0.003671.
👀 A breakout above $0.004417 and holding above it could open the way toward $0.00460. However, rejection at resistance could lead to a pullback toward the entry zone before the move resumes.
#rez #renzo #crypto #long #binance
{future}(REZUSDT)
🚨 $REZ /USDT — Is this rally preparing for another breakout? 🚀📈
💵 Current price: $0.004186
📈 24-hour change: +12.26%
📊 High: $0.004417
📉 Low: $0.003671
💥 Trading volume: $3.33M USDT
🎯 Trade: LONG 🟢 — Conditional breakout
🟢 Entry zone: $0.00410–$0.00418
🛑 Stop loss (SL): $0.00395
💰 TP1: $0.00430 — +2.9%
💰 TP2: $0.00442 — +5.7%
🚀 TP3: $0.00460 — +10.0%
⚡ $REZ continues to climb, with consecutive green candles appearing on the 4-hour timeframe. The price is approaching resistance at $0.004417 after rebounding from $0.003671.
👀 A breakout above $0.004417 and holding above it could open the way toward $0.00460. However, rejection at resistance could lead to a pullback toward the entry zone before the move resumes.
#rez #renzo #crypto #long #binance
35
·
--
Bullish
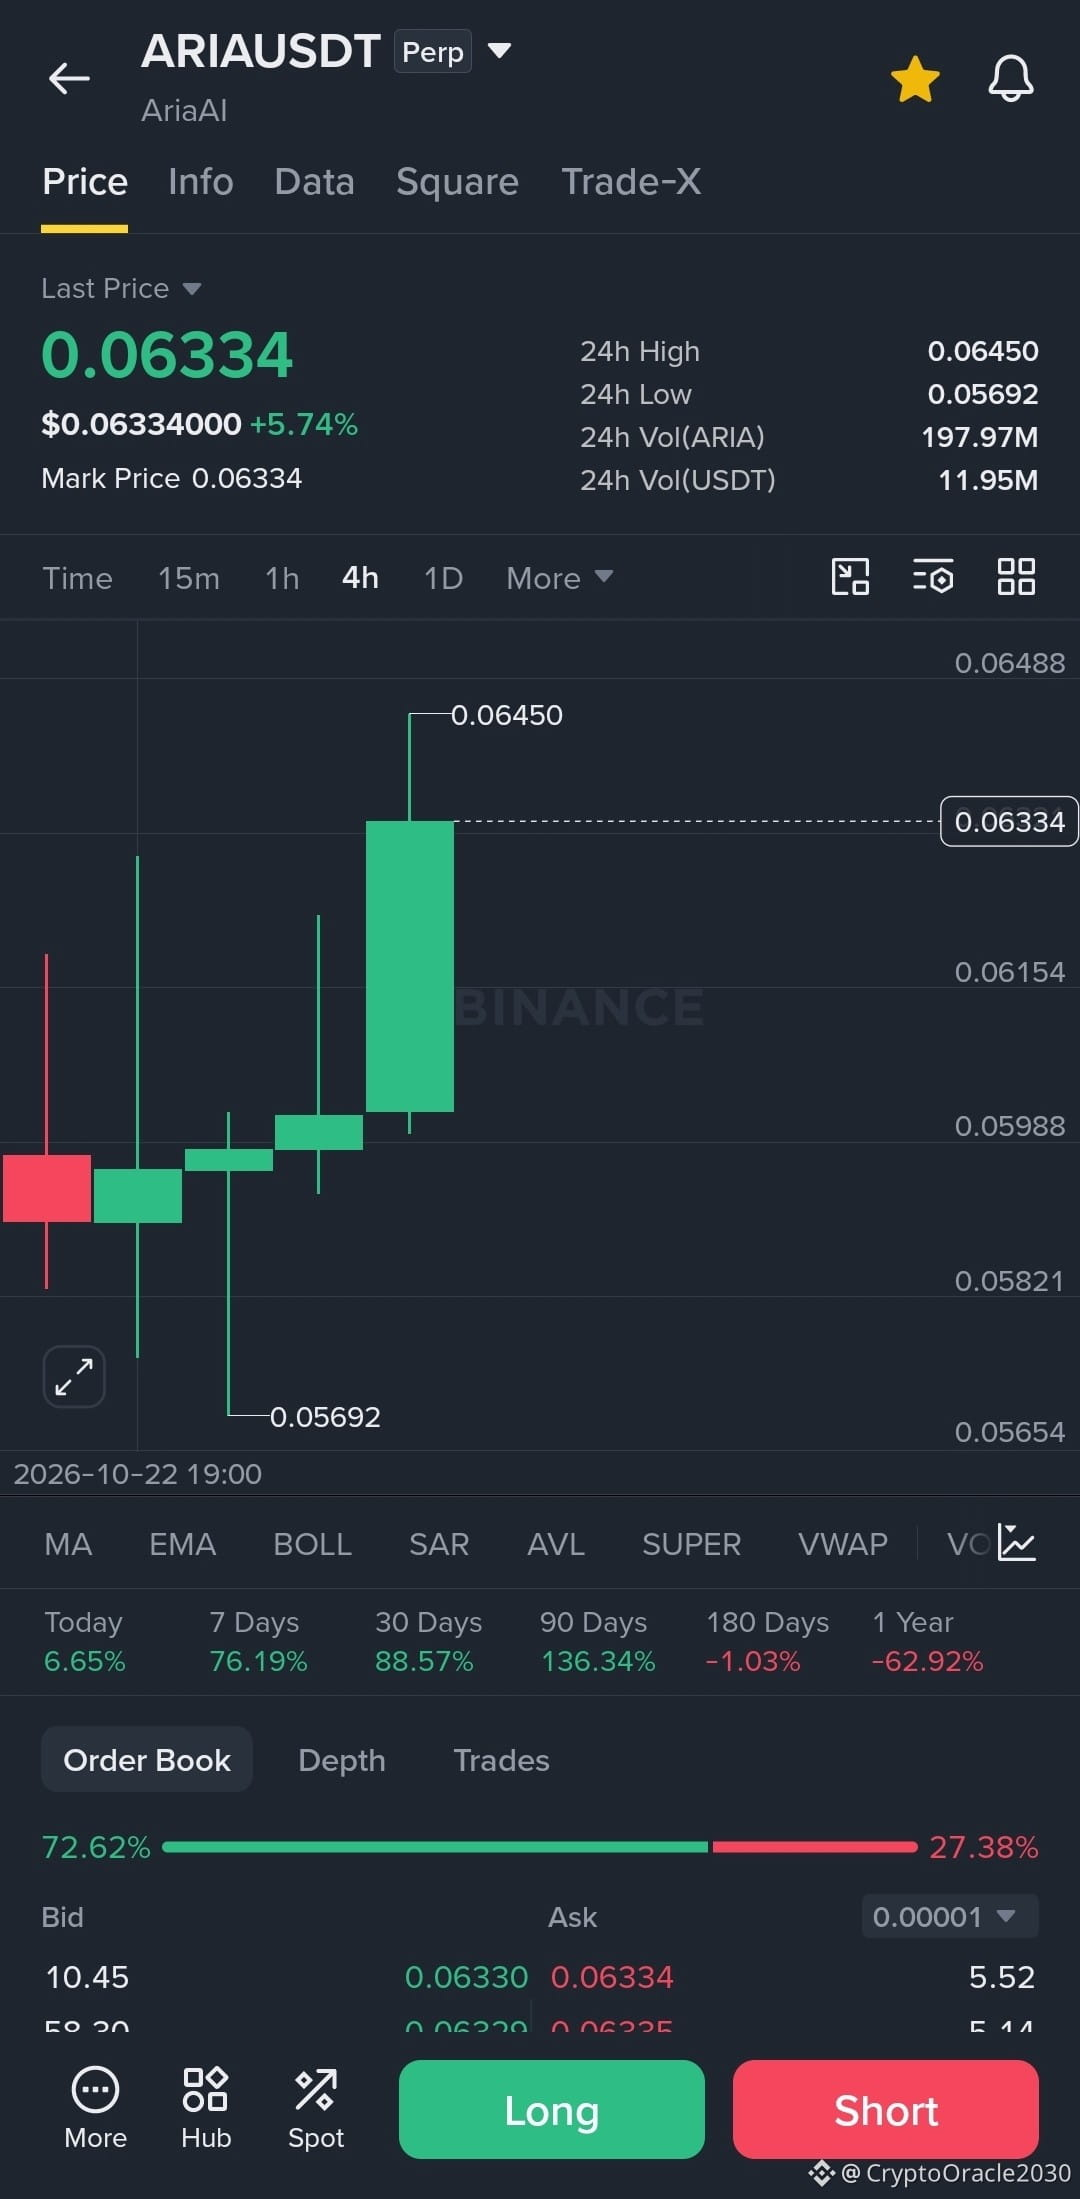
🚨 $ARIA /USDT — Is it gearing up for a new rally? 🚀📈
💵 Current price: $0.06334
📈 24-hour change: +5.74%
📊 High: $0.06450
📉 Low: $0.05692
💥 Trading volume: $11.95M USDT
🎯 Trade: LONG 🟢 — Conditional breakout
🟢 Entry zone: $0.06150–$0.06300
🛑 Stop loss (SL): $0.05900
💰 TP1: $0.06500 — +3.2%
💰 TP2: $0.06750 — +7.1%
🚀 TP3: $0.07000 — +11.1%
⚡ $ARIA is showing strong bullish momentum on the 4-hour timeframe, with a large green candle pushing the price close to the $0.06450 resistance.
👀 Buyers need to break above $0.06450 and hold there to confirm further upside toward the targets. A rejection at resistance could send the price back to retest the entry zone before another attempt.
#aria #ariaai #crypto #long #binance
{future}(ARIAUSDT)
🚨 $ARIA /USDT — Is it gearing up for a new rally? 🚀📈
💵 Current price: $0.06334
📈 24-hour change: +5.74%
📊 High: $0.06450
📉 Low: $0.05692
💥 Trading volume: $11.95M USDT
🎯 Trade: LONG 🟢 — Conditional breakout
🟢 Entry zone: $0.06150–$0.06300
🛑 Stop loss (SL): $0.05900
💰 TP1: $0.06500 — +3.2%
💰 TP2: $0.06750 — +7.1%
🚀 TP3: $0.07000 — +11.1%
⚡ $ARIA is showing strong bullish momentum on the 4-hour timeframe, with a large green candle pushing the price close to the $0.06450 resistance.
👀 Buyers need to break above $0.06450 and hold there to confirm further upside toward the targets. A rejection at resistance could send the price back to retest the entry zone before another attempt.
#aria #ariaai #crypto #long #binance
100
·
--
Bearish
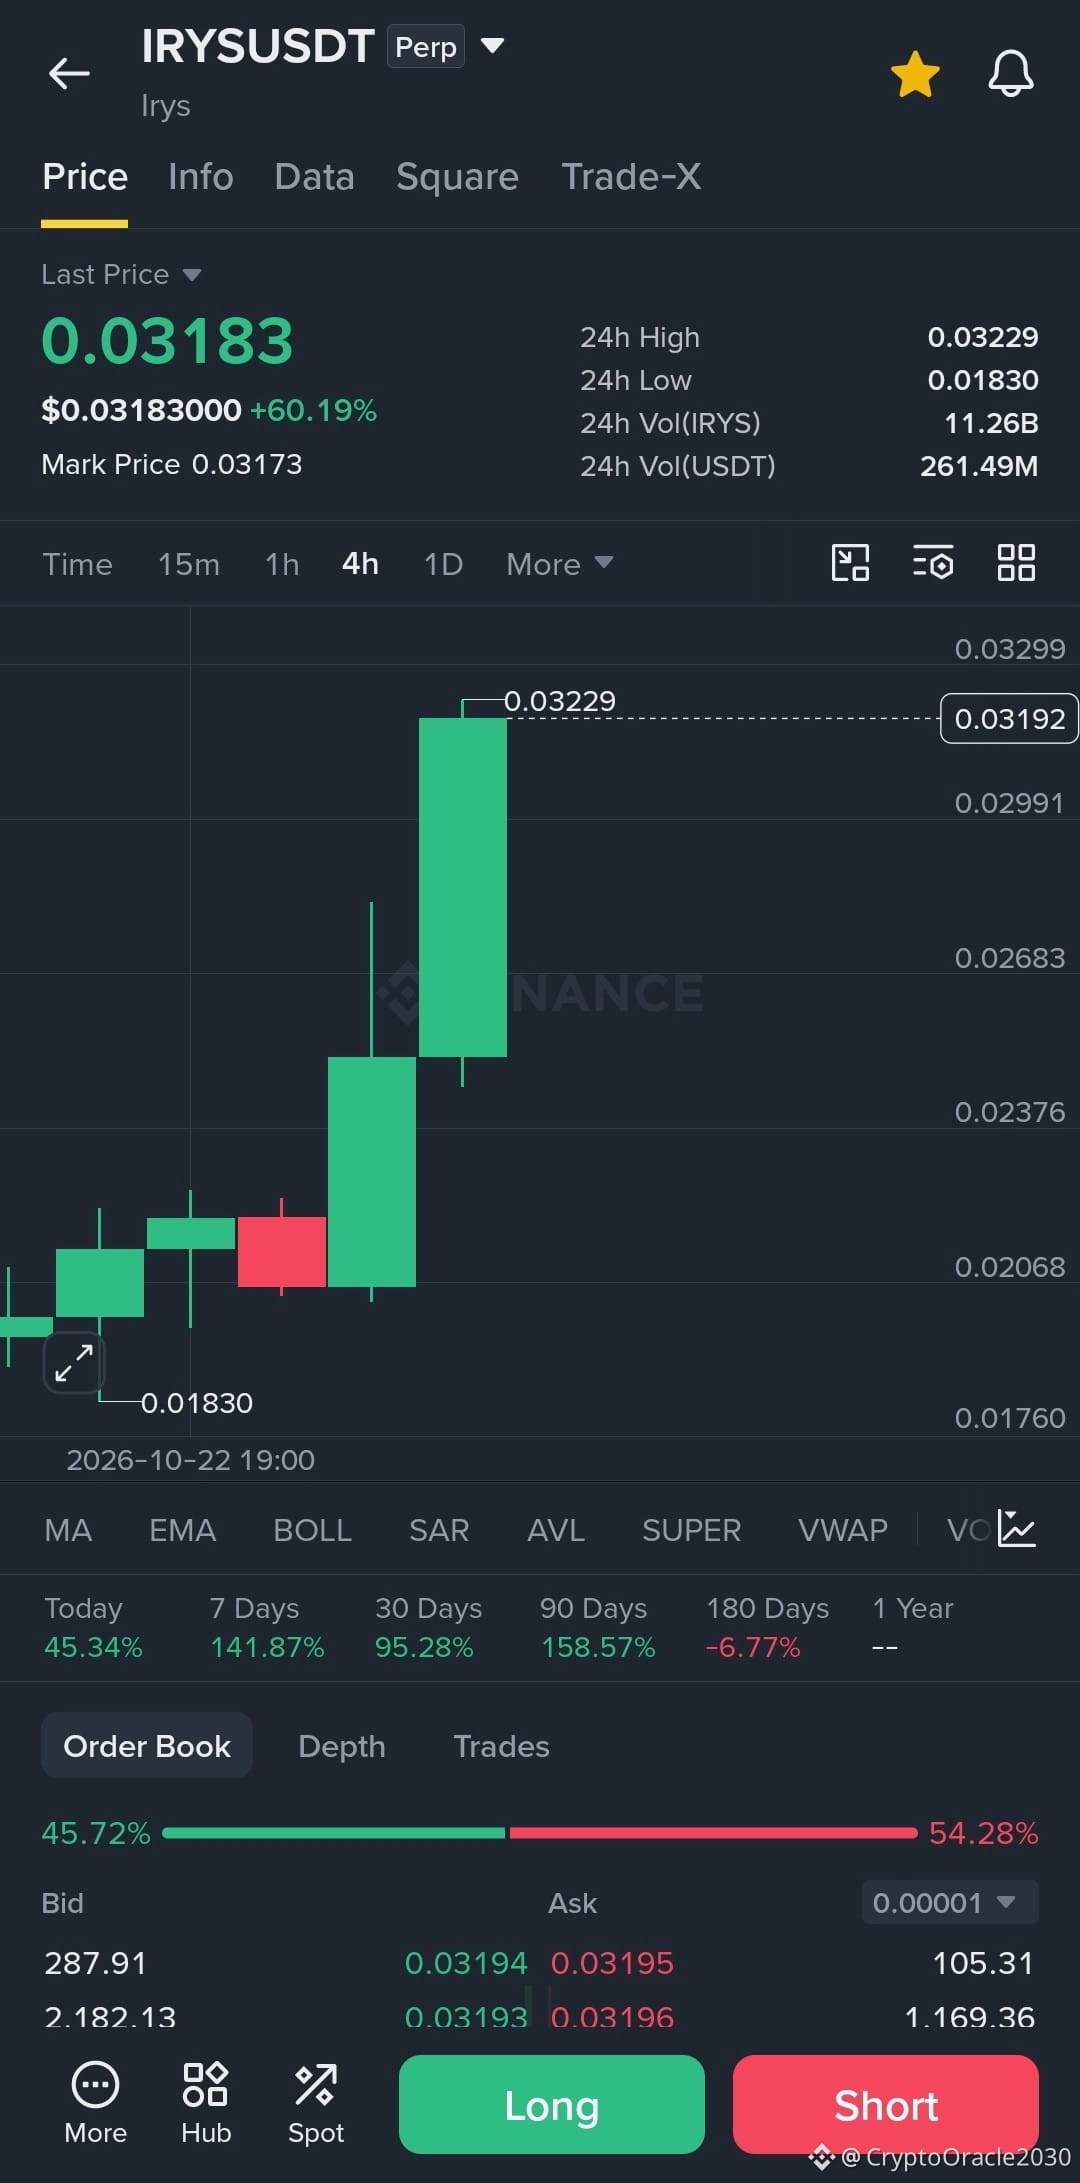
🚨 $IRYS /USDT — Is a correction near after this crazy rally? 📉🔥
💵 Current price: $0.03183
📈 24-hour change: +60.19%
📊 High: $0.03229
📉 Low: $0.01830
💥 Trading volume: $261.49M USDT
🎯 Trade: SHORT 🔴 — Conditional correction
🔴 Entry zone: $0.03180–$0.03230
🛑 Stop loss (SL): $0.03350
💰 TP1: $0.02990 — around +6%
💰 TP2: $0.02700 — around +15%
🚀 TP3: $0.02400 — around +25%
⚡ $IRYS jumped more than 60% in 24 hours, reaching resistance near $0.03229 after a strong 4-hour candle. This surge could open the door to profit-taking and a quick correction.
👀 Watching the $0.03200–$0.03229 zone is essential; a clear rejection could support a move down toward the targets. However, a breakout and hold above the high could invalidate the correction scenario.
#irys #crypto #short #trading #binance
{future}(IRYSUSDT)
🚨 $IRYS /USDT — Is a correction near after this crazy rally? 📉🔥
💵 Current price: $0.03183
📈 24-hour change: +60.19%
📊 High: $0.03229
📉 Low: $0.01830
💥 Trading volume: $261.49M USDT
🎯 Trade: SHORT 🔴 — Conditional correction
🔴 Entry zone: $0.03180–$0.03230
🛑 Stop loss (SL): $0.03350
💰 TP1: $0.02990 — around +6%
💰 TP2: $0.02700 — around +15%
🚀 TP3: $0.02400 — around +25%
⚡ $IRYS jumped more than 60% in 24 hours, reaching resistance near $0.03229 after a strong 4-hour candle. This surge could open the door to profit-taking and a quick correction.
👀 Watching the $0.03200–$0.03229 zone is essential; a clear rejection could support a move down toward the targets. However, a breakout and hold above the high could invalidate the correction scenario.
#irys #crypto #short #trading #binance
96
·
--
Bullish
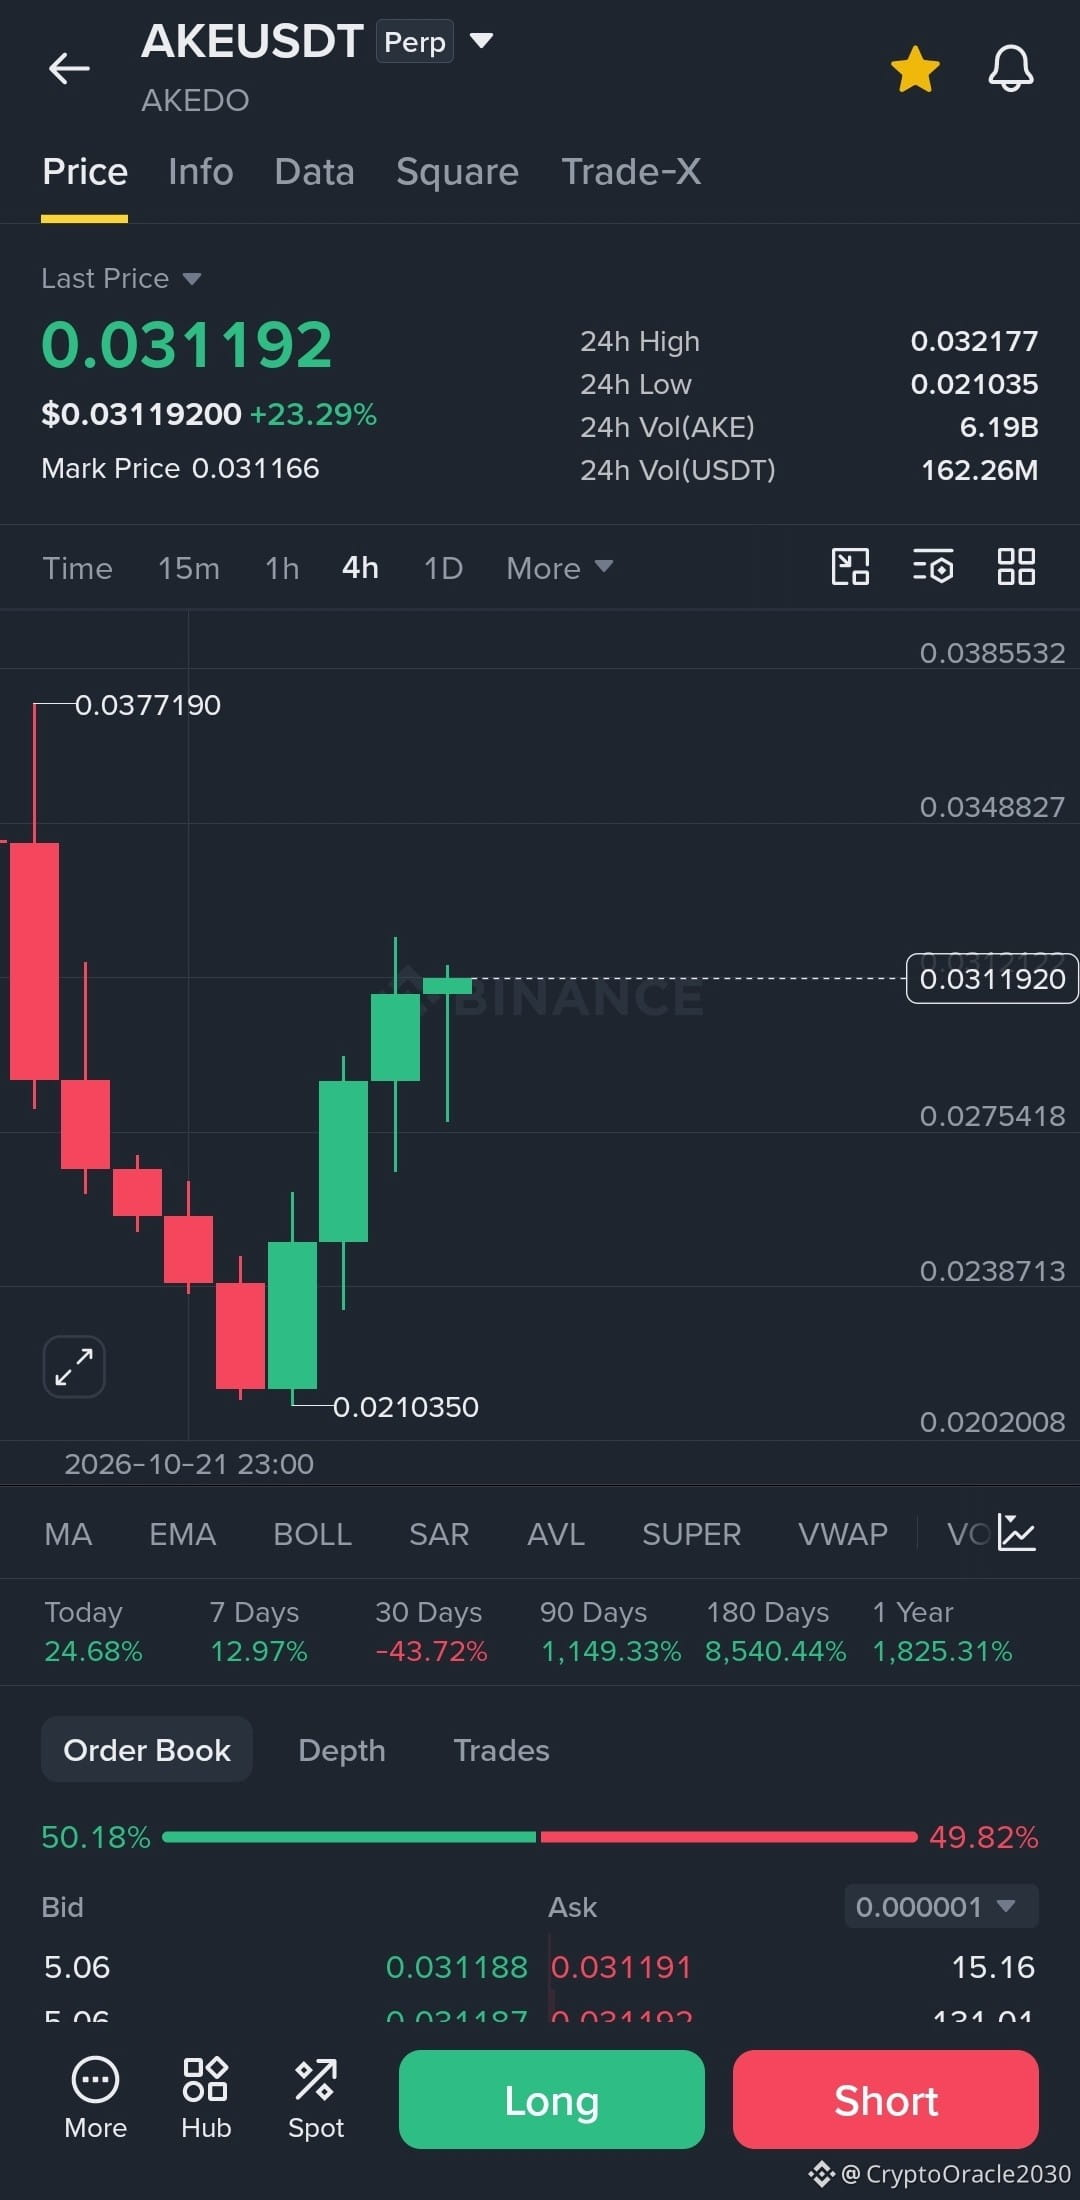
🚨 $AKE /USDT — A powerful recovery is underway! Can the bulls break higher? 🔥📈
💵 Current price: $0.031192
📈 24-hour change: +23.29%
📊 High: $0.032177
📉 Low: $0.021035
💥 Trading volume: $162.26M USDT
🎯 Trade: LONG 🟢 — Conditional breakout
🟢 Entry zone: $0.03000–$0.03130
🛑 Stop loss (SL): $0.02850
💰 TP1: $0.03218 — +5.2%
💰 TP2: $0.03488 — +13.2%
🚀 TP3: $0.03772 — +22.4%
⚡ $AKE has surged more than 23% in 24 hours, rebounding strongly from $0.021035 toward the $0.032177 resistance. The recovery is gaining attention, but price must clear the recent high to confirm another bullish leg.
👀 Bulls need to defend the $0.03000 area and break above $0.032177. A rejection could trigger profit-taking after the sharp rally.
#ake #akedo #crypto #long #binance
{future}(AKEUSDT)
🚨 $AKE /USDT — A powerful recovery is underway! Can the bulls break higher? 🔥📈
💵 Current price: $0.031192
📈 24-hour change: +23.29%
📊 High: $0.032177
📉 Low: $0.021035
💥 Trading volume: $162.26M USDT
🎯 Trade: LONG 🟢 — Conditional breakout
🟢 Entry zone: $0.03000–$0.03130
🛑 Stop loss (SL): $0.02850
💰 TP1: $0.03218 — +5.2%
💰 TP2: $0.03488 — +13.2%
🚀 TP3: $0.03772 — +22.4%
⚡ $AKE has surged more than 23% in 24 hours, rebounding strongly from $0.021035 toward the $0.032177 resistance. The recovery is gaining attention, but price must clear the recent high to confirm another bullish leg.
👀 Bulls need to defend the $0.03000 area and break above $0.032177. A rejection could trigger profit-taking after the sharp rally.
#ake #akedo #crypto #long #binance
11
·
--
Bullish
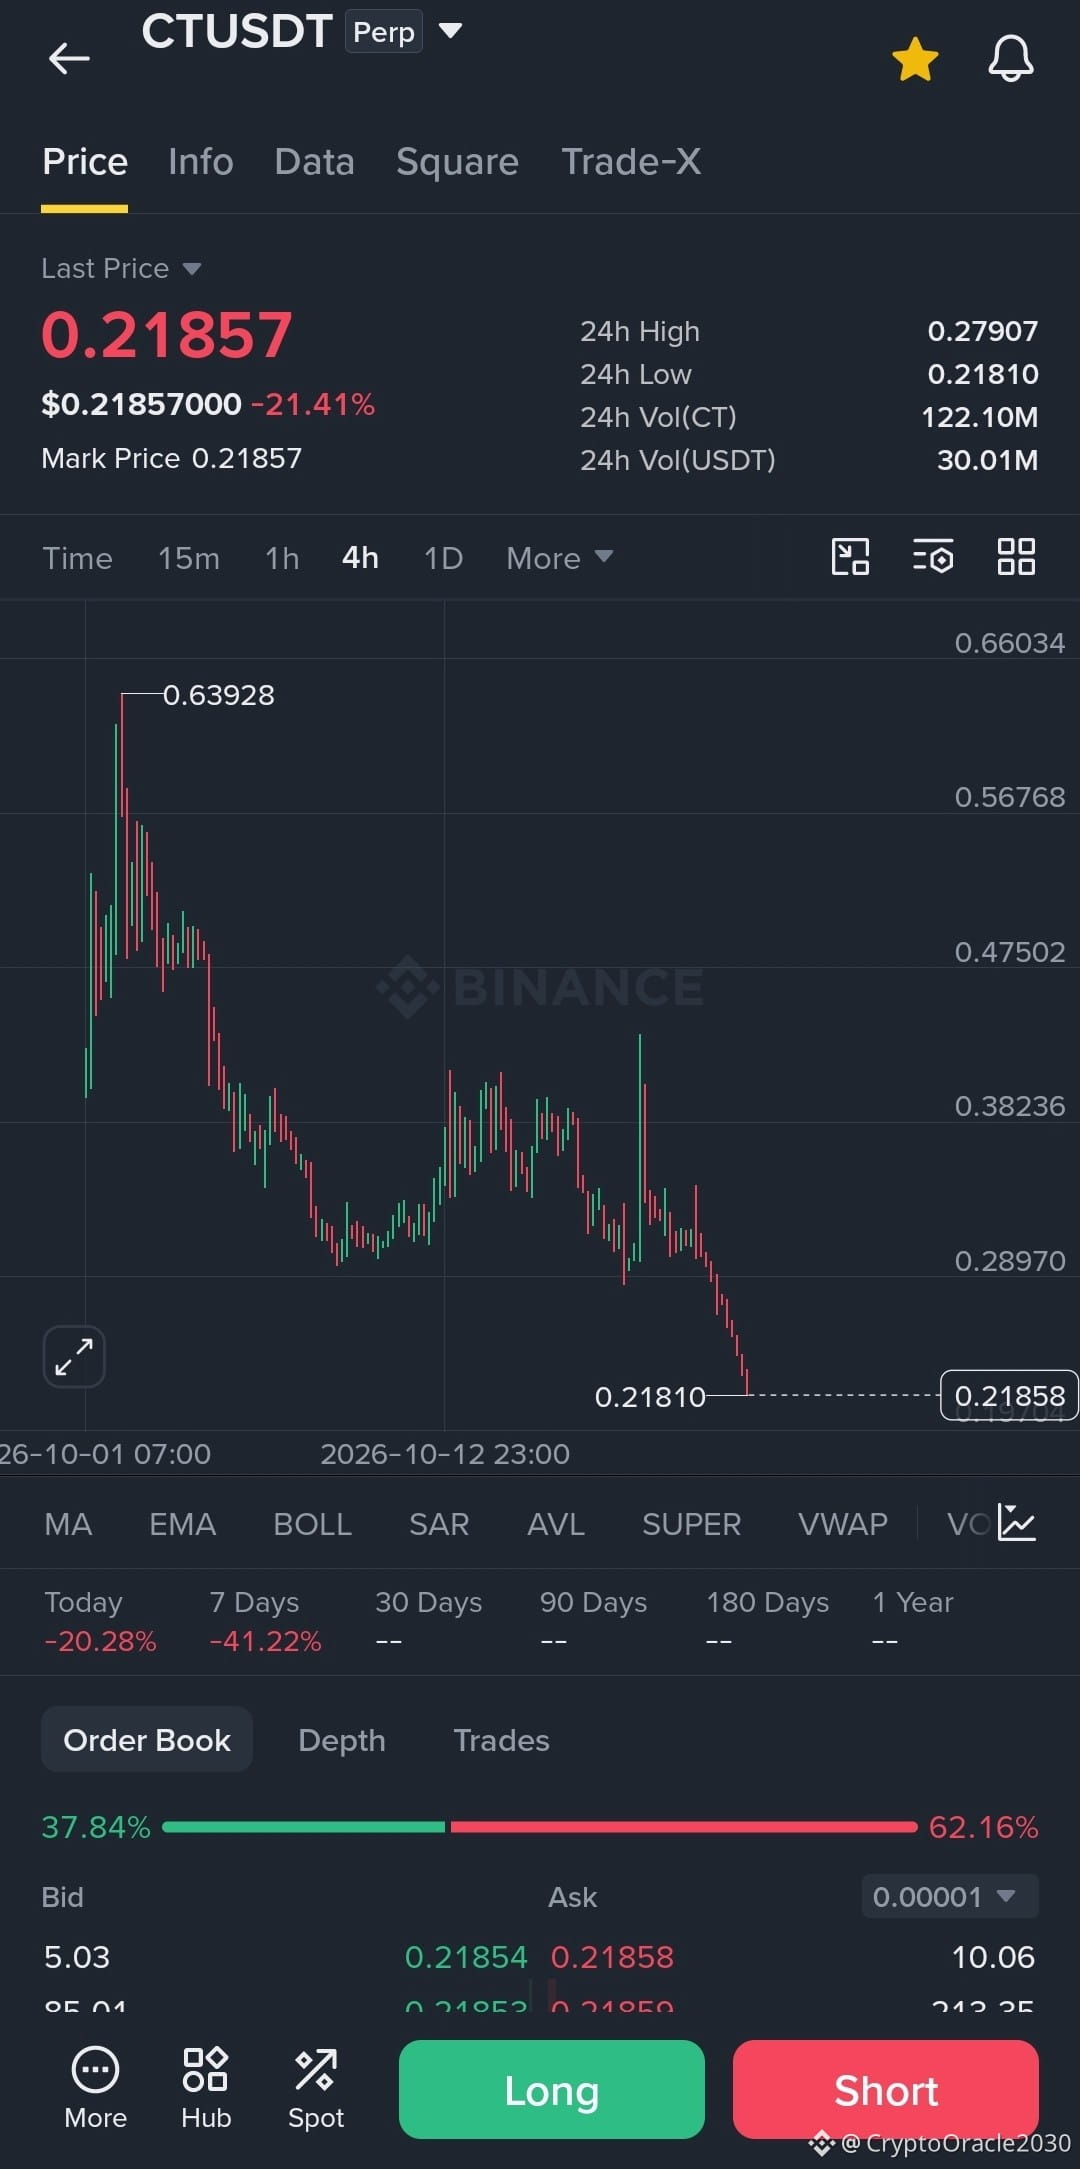
🚨 $CT /USDT — Selling pressure is intensifying! Is another leg down coming? 📉🔴
💵 Current price: $0.21857
📉 24-hour change: -21.41%
📊 High: $0.27907
📉 Low: $0.21810
💥 Trading volume: $30.01M USDT
🎯 Trade: SHORT 🔴 — Conditional breakdown
🔻 Entry zone: $0.21800–$0.22400
🛑 Stop loss (SL): $0.23200
💰 TP1: $0.21000 — +5.1%
💰 TP2: $0.20000 — +9.9%
🚀 TP3: $0.18500 — +16.6%
⚡ $CT has dropped over 21% in 24 hours, with the 4-hour chart showing a sustained downtrend and price pressing against the $0.21810 low. The sell-side order book also dominates at 62.16%, reinforcing the need to watch for further weakness.
👀 A confirmed break below $0.21810 could open the way toward $0.21000. If buyers reclaim $0.23200, the bearish setup would need reassessment.
#ct #crypto #short #trading #binance
{future}(CTUSDT)
🚨 $CT /USDT — Selling pressure is intensifying! Is another leg down coming? 📉🔴
💵 Current price: $0.21857
📉 24-hour change: -21.41%
📊 High: $0.27907
📉 Low: $0.21810
💥 Trading volume: $30.01M USDT
🎯 Trade: SHORT 🔴 — Conditional breakdown
🔻 Entry zone: $0.21800–$0.22400
🛑 Stop loss (SL): $0.23200
💰 TP1: $0.21000 — +5.1%
💰 TP2: $0.20000 — +9.9%
🚀 TP3: $0.18500 — +16.6%
⚡ $CT has dropped over 21% in 24 hours, with the 4-hour chart showing a sustained downtrend and price pressing against the $0.21810 low. The sell-side order book also dominates at 62.16%, reinforcing the need to watch for further weakness.
👀 A confirmed break below $0.21810 could open the way toward $0.21000. If buyers reclaim $0.23200, the bearish setup would need reassessment.
#ct #crypto #short #trading #binance
575
·
--
Bullish
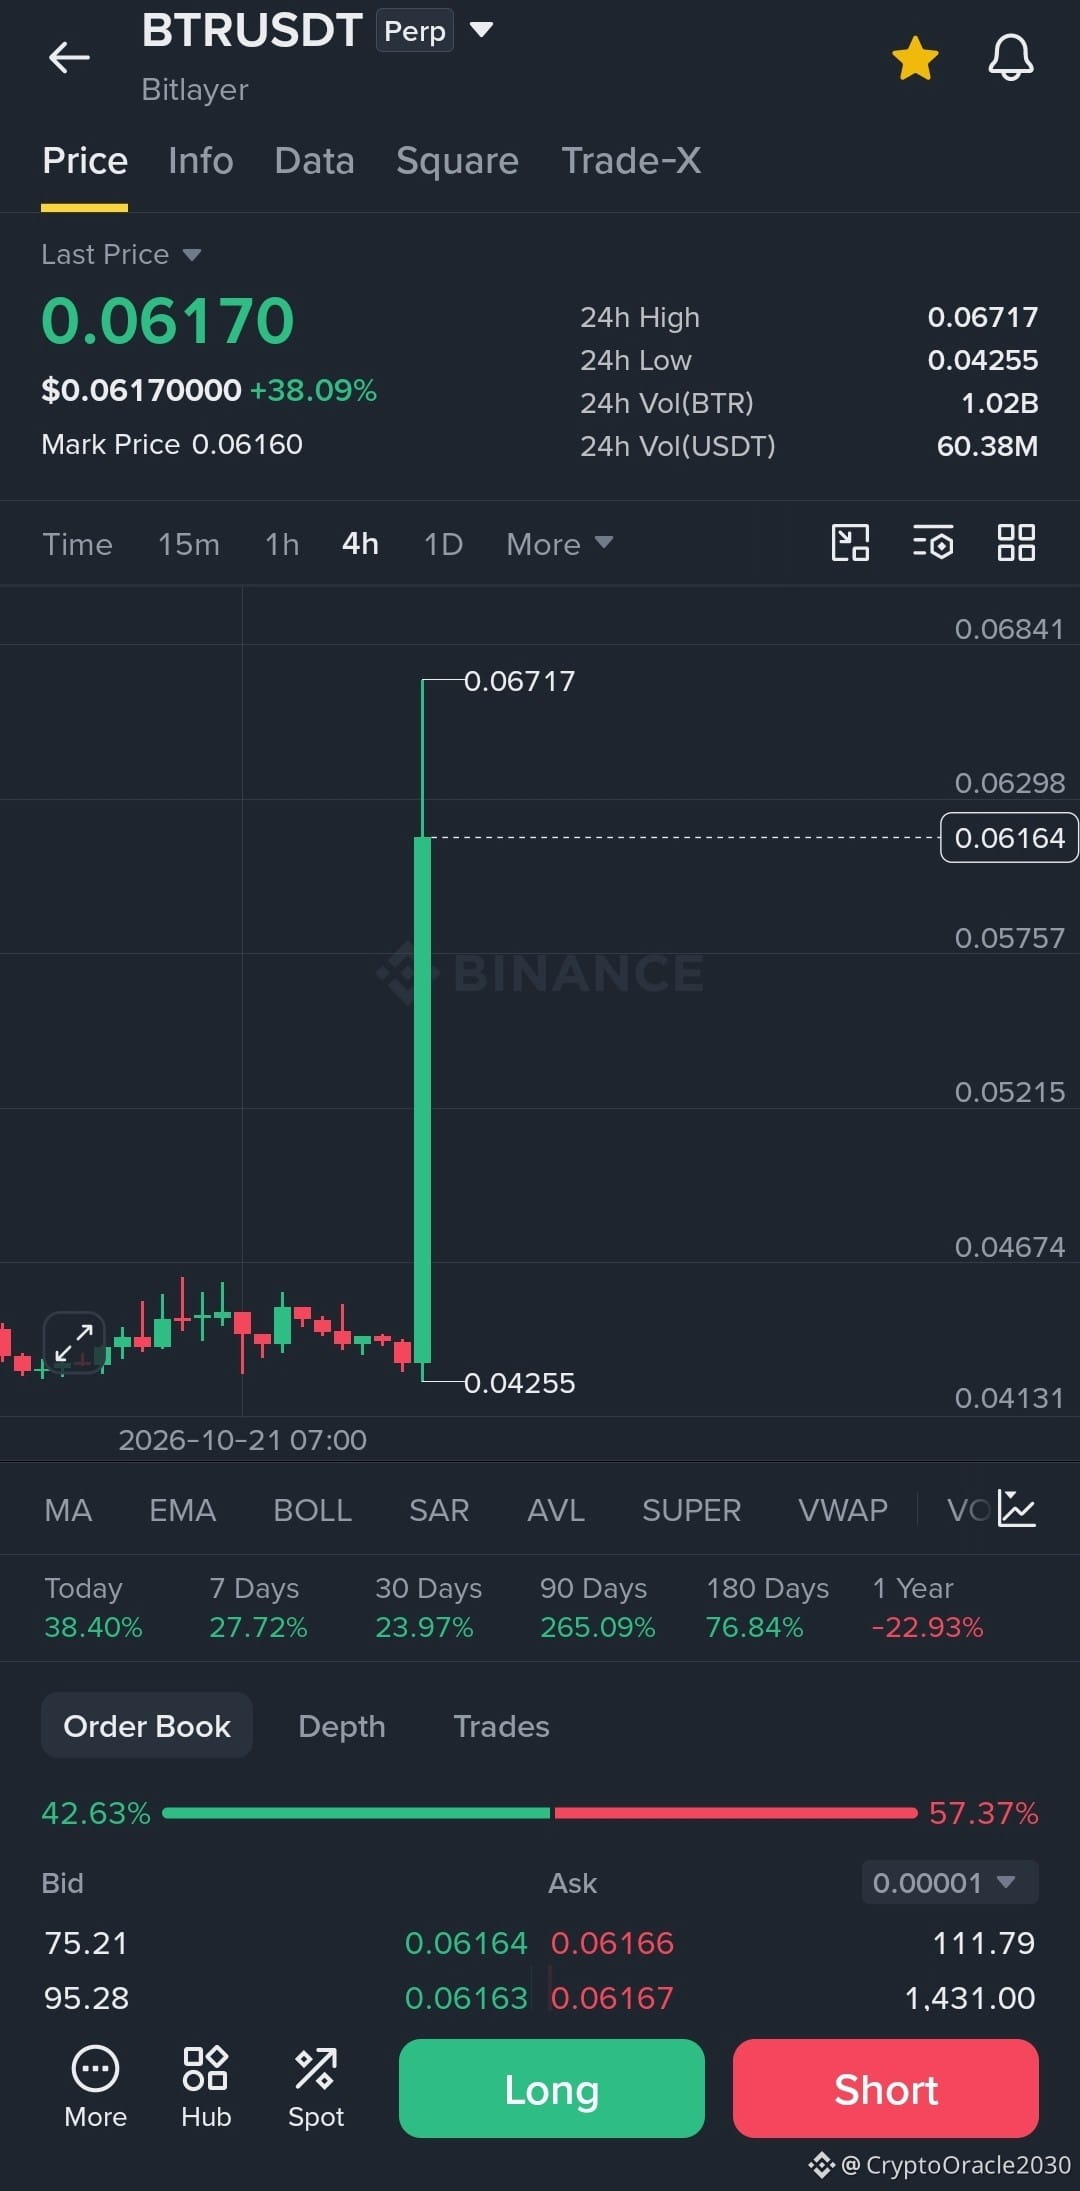
🚨$BTR /USDT — Is this explosive rally ready for another leg up? 🚀📈
💵 Current price: $0.06170
📈 24-hour change: +38.09%
📊 High: $0.06717
📉 Low: $0.04255
💥 Trading volume: $60.38M USDT
🎯 Trade: LONG 🟢 — Conditional breakout
🟢 Entry zone: $0.05900–$0.06100
🛑 Stop loss (SL): $0.05650
💰 TP1: $0.06300 — +3.3%
💰 TP2: $0.06500 — +6.6%
🚀 TP3: $0.06700 — +9.8%
⚡ $BTR has surged nearly 38% in 24 hours, climbing from $0.04255 to test the $0.06717 high. The 4-hour chart shows a powerful bullish impulse, but the sharp vertical move increases the risk of a pullback.
👀 Bulls need to defend the $0.05900–$0.06100 zone and challenge resistance near $0.06717. A rejection could trigger profit-taking, so avoid chasing the pump and wait for a controlled entry.
#BTR #Bitlayer #Crypto #LONG #Binance
{future}(BTRUSDT)
🚨$BTR /USDT — Is this explosive rally ready for another leg up? 🚀📈
💵 Current price: $0.06170
📈 24-hour change: +38.09%
📊 High: $0.06717
📉 Low: $0.04255
💥 Trading volume: $60.38M USDT
🎯 Trade: LONG 🟢 — Conditional breakout
🟢 Entry zone: $0.05900–$0.06100
🛑 Stop loss (SL): $0.05650
💰 TP1: $0.06300 — +3.3%
💰 TP2: $0.06500 — +6.6%
🚀 TP3: $0.06700 — +9.8%
⚡ $BTR has surged nearly 38% in 24 hours, climbing from $0.04255 to test the $0.06717 high. The 4-hour chart shows a powerful bullish impulse, but the sharp vertical move increases the risk of a pullback.
👀 Bulls need to defend the $0.05900–$0.06100 zone and challenge resistance near $0.06717. A rejection could trigger profit-taking, so avoid chasing the pump and wait for a controlled entry.
#BTR #Bitlayer #Crypto #LONG #Binance
25
·
--
Bullish
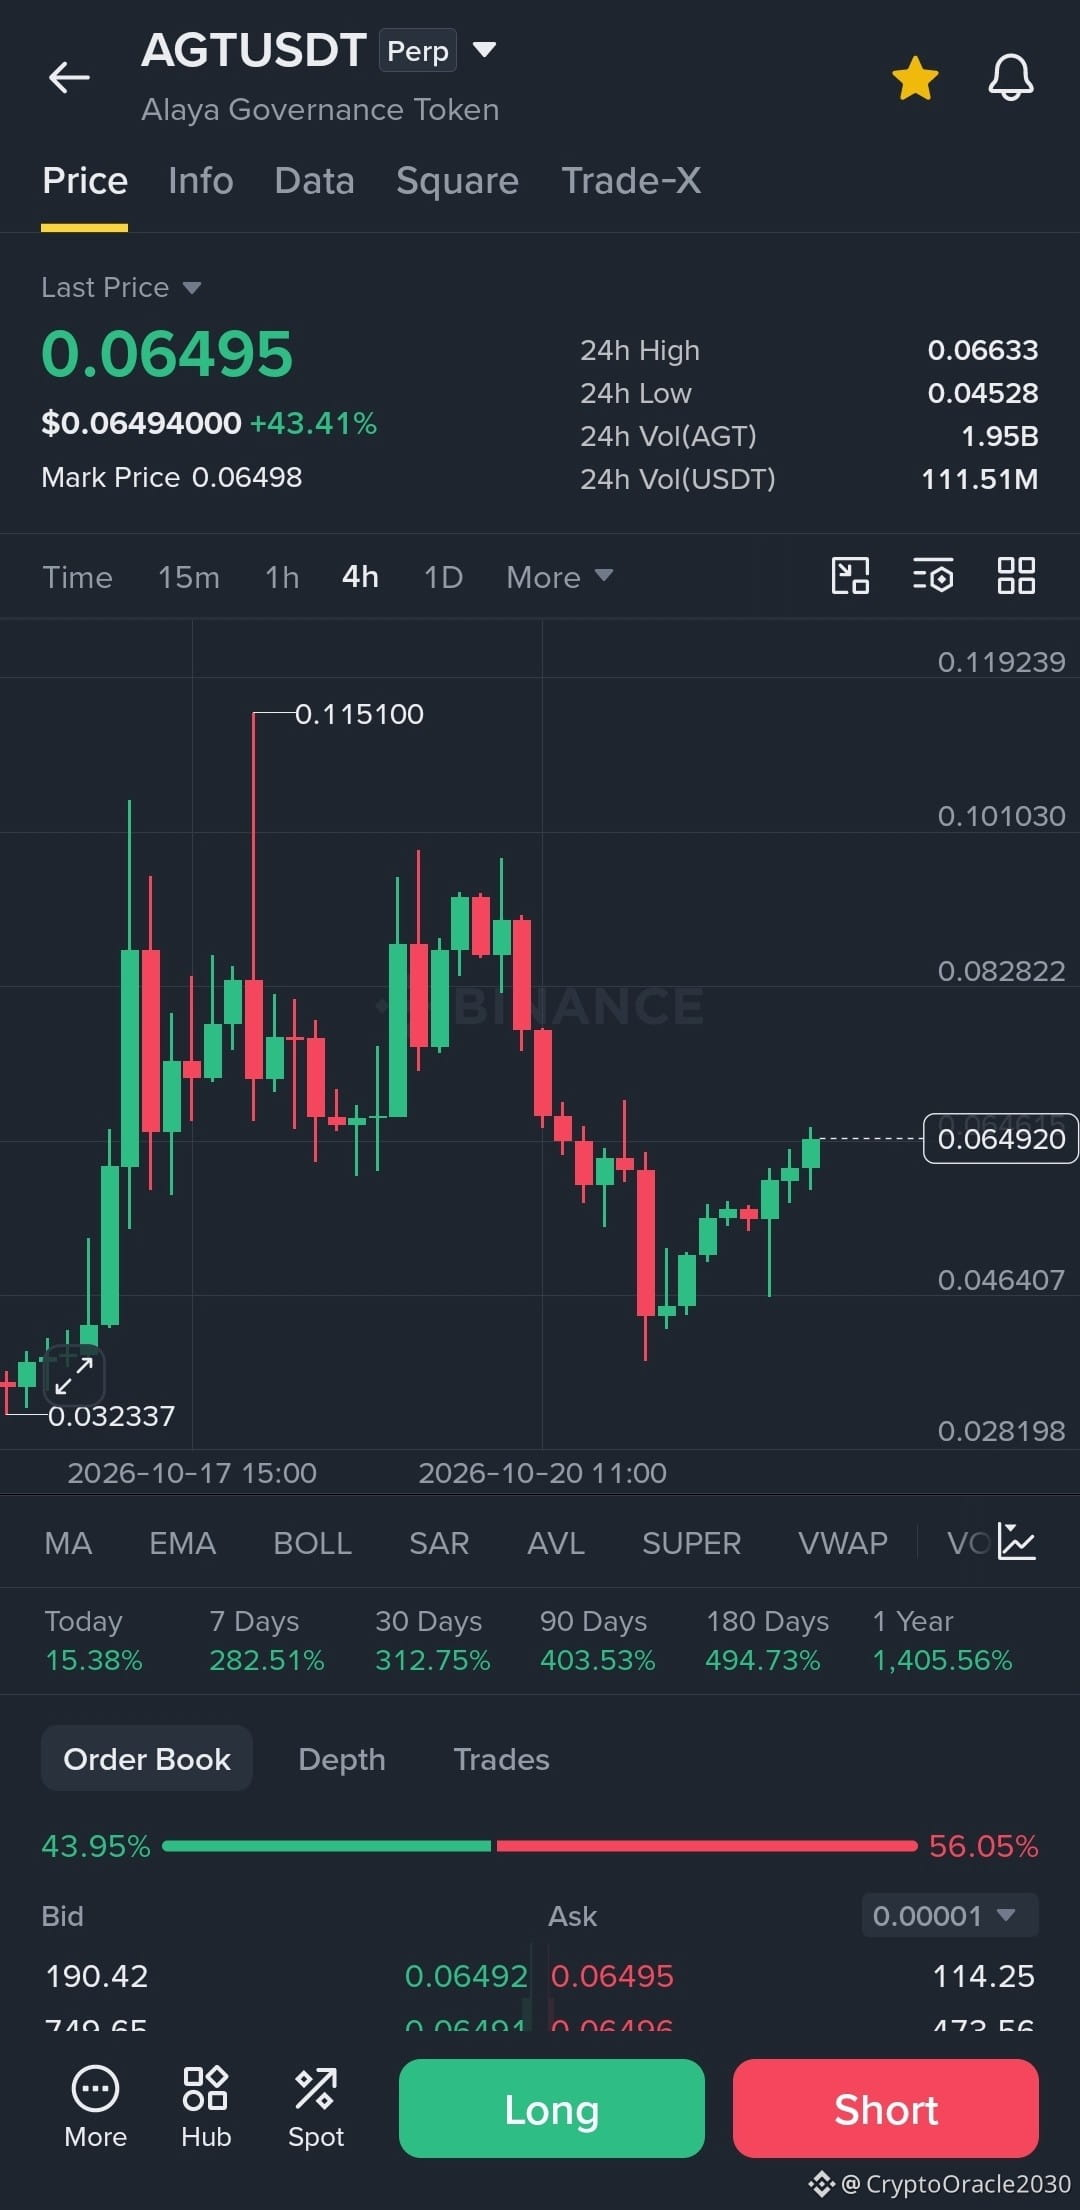
$AGT /USDT — Is the recovery gaining momentum? 🟢📈
💵 Current price: $0.06495
📈 24-hour change: +43.41%
📊 High: $0.06633
📉 Low: $0.04528
💥 Trading volume: $111.51M USDT
🎯 Trade: LONG 🟢 — Conditional recovery
🟢 Entry zone: $0.06250–$0.06450
🛑 Stop loss (SL): $0.05900
💰 TP1: $0.06700 — +3.9%
💰 TP2: $0.07000 — +8.5%
🚀 TP3: $0.07400 — +14.1%
⚡ $AGT has rebounded strongly from the $0.04528 low and is approaching the $0.06633 resistance zone. The 4-hour chart shows a recovery, but the sharp earlier decline means further volatility remains possible.
👀 A sustained move above $0.06633 could support continuation toward the targets. Failure to hold the entry zone may signal another pullback. Avoid chasing the price after a sharp rally.
#AGT #Crypto #Binance #LONG #Altcoins
{future}(AGTUSDT)
$AGT /USDT — Is the recovery gaining momentum? 🟢📈
💵 Current price: $0.06495
📈 24-hour change: +43.41%
📊 High: $0.06633
📉 Low: $0.04528
💥 Trading volume: $111.51M USDT
🎯 Trade: LONG 🟢 — Conditional recovery
🟢 Entry zone: $0.06250–$0.06450
🛑 Stop loss (SL): $0.05900
💰 TP1: $0.06700 — +3.9%
💰 TP2: $0.07000 — +8.5%
🚀 TP3: $0.07400 — +14.1%
⚡ $AGT has rebounded strongly from the $0.04528 low and is approaching the $0.06633 resistance zone. The 4-hour chart shows a recovery, but the sharp earlier decline means further volatility remains possible.
👀 A sustained move above $0.06633 could support continuation toward the targets. Failure to hold the entry zone may signal another pullback. Avoid chasing the price after a sharp rally.
#AGT #Crypto #Binance #LONG #Altcoins
117
Log in to explore more content
Join global crypto users on Binance Square
⚡️ Get latest and useful information about crypto.
💬 Trusted by the world’s largest crypto exchange.
👍 Discover real insights from verified creators.
Email / Phone number