
Crypto_君少
5k Posts

Crypto_君少
 Square Verified
Report
Block User

原创之星

币安人生 Holder
Frequent Trader
5.5 Years
14 Following
18.0K+ Followers
21.1K+ Liked
1 Badges
Posts
All
Quotes
Videos
PINNED
·
--
Community position transfers to Binance group chat,
Here there are meme experts,
Here there are precise research teams,
Here there are secondary analysts,
Here there is a group of like-minded comrades!
The captain will take you flying, no crashing of the plane!
There are various benefits in the group, when making money everyone celebrates with red envelopes together, if you miss out, there will be someone to commiserate with you!
[https://app.binance.com/uni-qr/group-chat-landing?channelToken=4jfOFh7j1A9DVg9w1kTuiA&type=1&entrySource=sharing_link](https://app.binance.com/uni-qr/group-chat-landing?channelToken=4jfOFh7j1A9DVg9w1kTuiA&type=1&entrySource=sharing_link)
Community position transfers to Binance group chat,
Here there are meme experts,
Here there are precise research teams,
Here there are secondary analysts,
Here there is a group of like-minded comrades!
The captain will take you flying, no crashing of the plane!
There are various benefits in the group, when making money everyone celebrates with red envelopes together, if you miss out, there will be someone to commiserate with you!
https://app.binance.com/uni-qr/group-chat-landing?channelToken=4jfOFh7j1A9DVg9w1kTuiA&type=1&entrySource=sharing_link
Here there are meme experts,
Here there are precise research teams,
Here there are secondary analysts,
Here there is a group of like-minded comrades!
The captain will take you flying, no crashing of the plane!
There are various benefits in the group, when making money everyone celebrates with red envelopes together, if you miss out, there will be someone to commiserate with you!
https://app.binance.com/uni-qr/group-chat-landing?channelToken=4jfOFh7j1A9DVg9w1kTuiA&type=1&entrySource=sharing_link

6
2
22
4.1k
PINNED
·
--
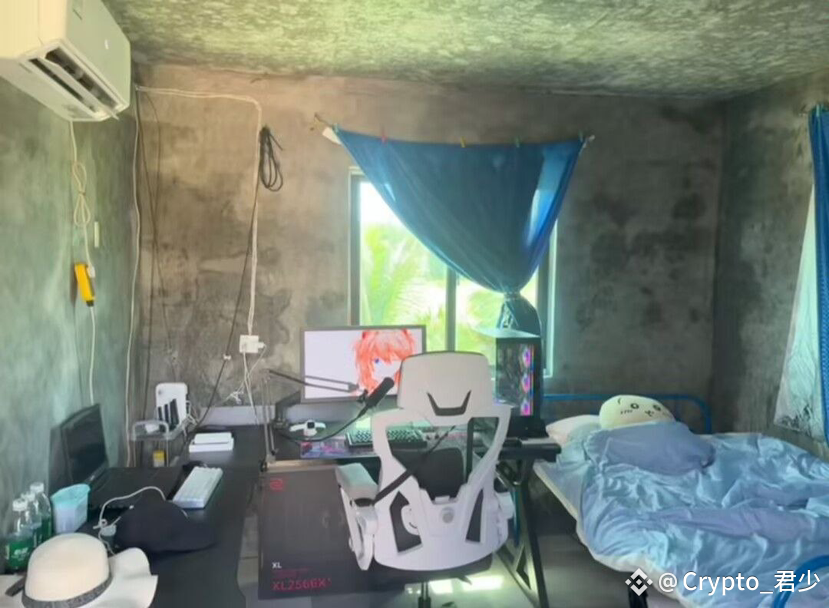
This time I must win🥇
Although the conditions are a bit poor, where there is a dream, there is a distance!
This time I must win🥇
Although the conditions are a bit poor, where there is a dream, there is a distance!
Although the conditions are a bit poor, where there is a dream, there is a distance!

94
29
201
100.9k
·
--
Those eyes, that bearing—I can't help feeling she still has unfinished ties to the mortal world!
Those eyes, that bearing—I can't help feeling she still has unfinished ties to the mortal world!

15
8
6k

·
--
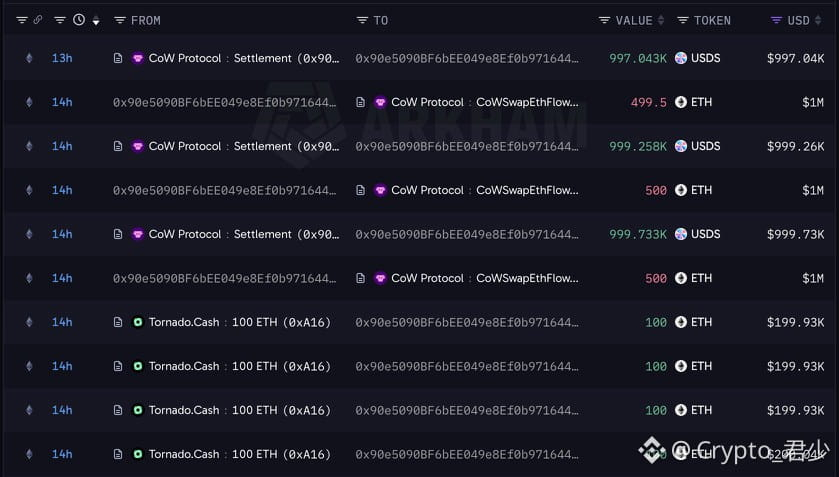
Even hackers are panic-selling $ETH because the market is crashing!
Why do I feel like a rebound is just around the corner?
{future}(ETHUSDT)
Even hackers are panic-selling $ETH because the market is crashing!
Why do I feel like a rebound is just around the corner?
Why do I feel like a rebound is just around the corner?
2
6.8k
·
--
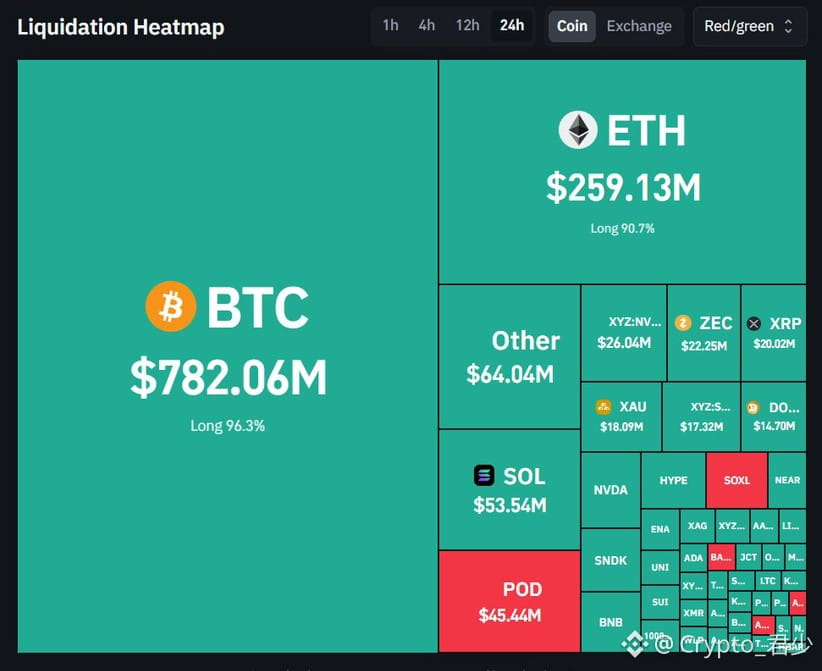
🚨 In the past 24 hours,
$1.47 billion worth of crypto positions were liquidated!
Is $BTC about to rebound!
🚨 In the past 24 hours,
$1.47 billion worth of crypto positions were liquidated!
Is $BTC about to rebound!
$1.47 billion worth of crypto positions were liquidated!
Is $BTC about to rebound!
2
1.6k
·
--
If it were the ’60s, Jensen Huang wouldn’t have had a future!
If it were the ’60s, Jensen Huang wouldn’t have had a future!

584
·
--
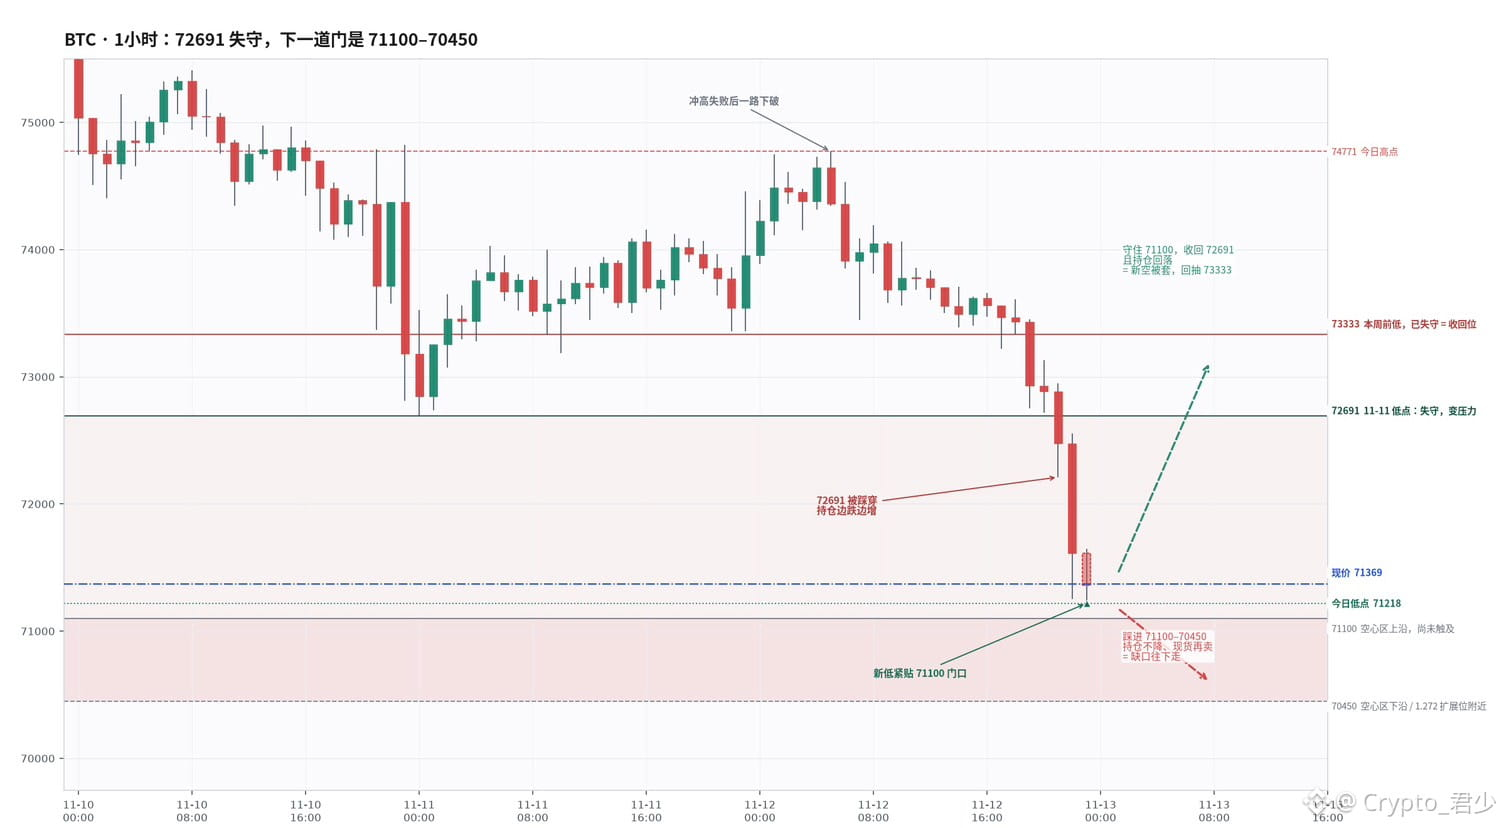
11-12 Nightly Review | BTC 71.4k / ETH 2000
🔻Tonight’s move
➤ After 72691 gave way, price bottomed near 71200—only about $100 from the next liquidity void at 71100.
➤ In the hour that drove price to a new low, futures were selling and spot was selling too. The intent to break support was strong.
➤ After the new low was made, both sides temporarily turned into small net buyers. It was actually worth considering a small long position.
🧠 Money on the sidelines is still cautious
Nvidia CEO Jensen Huang’s company dragged markets around the world down 🌿. It was down about 14% at one point, but has now narrowed its losses to around −5%. Nasdaq futures also bounced from their lows.
But the 10-year Treasury yield rose to 5.07%, and gold fell too. This isn’t rotation—it’s risk assets being hit across the board.
BTC ETFs have seen net outflows for 5 consecutive days, including $300 million the day before. Stablecoin supply has shrunk by about $4.7 billion in 8 days, showing that institutions are cashing out and liquidity is drying up further.
ETH is weaker still, hitting a low of 1982 and remaining below 2000, where retail consensus sits.
🐋 On-chain whales
The two largest BTC short positions total about 4300 coins, opened at 76–78k, and have barely been reduced. Their unrealized profits continue to grow.
A whale went long and was ruthlessly liquidated for about 90 million. The account now has only about $260,000 left.
📍Key levels—see chart
➥Above: 72691 has turned into resistance; above that is 73333.
➥Below: 71100–70450 is an unfilled liquidity void. Around 70.4k is also the 1.272 extension level for this move, so it’s worth watching.
The on-chain lending liquidation zones noted earlier are still far away, at 63k and 58k. For now, there’s no sign of whether price will reach them.
🎯Three possible paths from here
① Price enters 71100–70450, open interest doesn’t fall, and spot selling resumes ← about $100 away; still the most likely scenario right now.
② 71100 holds, the 1-hour candle reclaims 72691, and open interest drops noticeably = new shorts are trapped; bounce toward 73333.
③ Spot selling continues heavily, ETF outflows increase, and price breaks straight through 70450.
⚠️ The one thing giving me pause
The long-account ratio is still around 75%, and the funding rate is still slightly positive. After the new low, spot turned into a small net buyer. Longs haven’t run out of fuel, so a sweep into the gap followed by a sharp rally wouldn’t be surprising.
📌 My view
Bearish bias ≠ shorting at 71.4k.
We’re about 1.3% from 70450, and dip-buying interest is stirring. A small correction over the weekend, coming up soon, wouldn’t be unreasonable.
November $BTC —can it really not be pulled back up?
{future}(BTCUSDT)
11-12 Nightly Review | BTC 71.4k / ETH 2000
🔻Tonight’s move
➤ After 72691 gave way, price bottomed near 71200—only about $100 from the next liquidity void at 71100.
➤ In the hour that drove price to a new low, futures were selling and spot was selling too. The intent to break support was strong.
➤ After the new low was made, both sides temporarily turned into small net buyers. It was actually worth considering a small long position.
🧠 Money on the sidelines is still cautious
Nvidia CEO Jensen Huang’s company dragged markets around the world down 🌿. It was down about 14% at one point, but has now narrowed its losses to around −5%. Nasdaq futures also bounced from their lows.
But the 10-year Treasury yield rose to 5.07%, and gold fell too. This isn’t rotation—it’s risk assets being hit across the board.
BTC ETFs have seen net outflows for 5 consecutive days, including $300 million the day before. Stablecoin supply has shrunk by about $4.7 billion in 8 days, showing that institutions are cashing out and liquidity is drying up further.
ETH is weaker still, hitting a low of 1982 and remaining below 2000, where retail consensus sits.
🐋 On-chain whales
The two largest BTC short positions total about 4300 coins, opened at 76–78k, and have barely been reduced. Their unrealized profits continue to grow.
A whale went long and was ruthlessly liquidated for about 90 million. The account now has only about $260,000 left.
📍Key levels—see chart
➥Above: 72691 has turned into resistance; above that is 73333.
➥Below: 71100–70450 is an unfilled liquidity void. Around 70.4k is also the 1.272 extension level for this move, so it’s worth watching.
The on-chain lending liquidation zones noted earlier are still far away, at 63k and 58k. For now, there’s no sign of whether price will reach them.
🎯Three possible paths from here
① Price enters 71100–70450, open interest doesn’t fall, and spot selling resumes ← about $100 away; still the most likely scenario right now.
② 71100 holds, the 1-hour candle reclaims 72691, and open interest drops noticeably = new shorts are trapped; bounce toward 73333.
③ Spot selling continues heavily, ETF outflows increase, and price breaks straight through 70450.
⚠️ The one thing giving me pause
The long-account ratio is still around 75%, and the funding rate is still slightly positive. After the new low, spot turned into a small net buyer. Longs haven’t run out of fuel, so a sweep into the gap followed by a sharp rally wouldn’t be surprising.
📌 My view
Bearish bias ≠ shorting at 71.4k.
We’re about 1.3% from 70450, and dip-buying interest is stirring. A small correction over the weekend, coming up soon, wouldn’t be unreasonable.
November $BTC —can it really not be pulled back up?
🔻Tonight’s move
➤ After 72691 gave way, price bottomed near 71200—only about $100 from the next liquidity void at 71100.
➤ In the hour that drove price to a new low, futures were selling and spot was selling too. The intent to break support was strong.
➤ After the new low was made, both sides temporarily turned into small net buyers. It was actually worth considering a small long position.
🧠 Money on the sidelines is still cautious
Nvidia CEO Jensen Huang’s company dragged markets around the world down 🌿. It was down about 14% at one point, but has now narrowed its losses to around −5%. Nasdaq futures also bounced from their lows.
But the 10-year Treasury yield rose to 5.07%, and gold fell too. This isn’t rotation—it’s risk assets being hit across the board.
BTC ETFs have seen net outflows for 5 consecutive days, including $300 million the day before. Stablecoin supply has shrunk by about $4.7 billion in 8 days, showing that institutions are cashing out and liquidity is drying up further.
ETH is weaker still, hitting a low of 1982 and remaining below 2000, where retail consensus sits.
🐋 On-chain whales
The two largest BTC short positions total about 4300 coins, opened at 76–78k, and have barely been reduced. Their unrealized profits continue to grow.
A whale went long and was ruthlessly liquidated for about 90 million. The account now has only about $260,000 left.
📍Key levels—see chart
➥Above: 72691 has turned into resistance; above that is 73333.
➥Below: 71100–70450 is an unfilled liquidity void. Around 70.4k is also the 1.272 extension level for this move, so it’s worth watching.
The on-chain lending liquidation zones noted earlier are still far away, at 63k and 58k. For now, there’s no sign of whether price will reach them.
🎯Three possible paths from here
① Price enters 71100–70450, open interest doesn’t fall, and spot selling resumes ← about $100 away; still the most likely scenario right now.
② 71100 holds, the 1-hour candle reclaims 72691, and open interest drops noticeably = new shorts are trapped; bounce toward 73333.
③ Spot selling continues heavily, ETF outflows increase, and price breaks straight through 70450.
⚠️ The one thing giving me pause
The long-account ratio is still around 75%, and the funding rate is still slightly positive. After the new low, spot turned into a small net buyer. Longs haven’t run out of fuel, so a sweep into the gap followed by a sharp rally wouldn’t be surprising.
📌 My view
Bearish bias ≠ shorting at 71.4k.
We’re about 1.3% from 70450, and dip-buying interest is stirring. A small correction over the weekend, coming up soon, wouldn’t be unreasonable.
November $BTC —can it really not be pulled back up?
552
·
--
Verified
━━━━━━━━━━━━━━━━━━━━
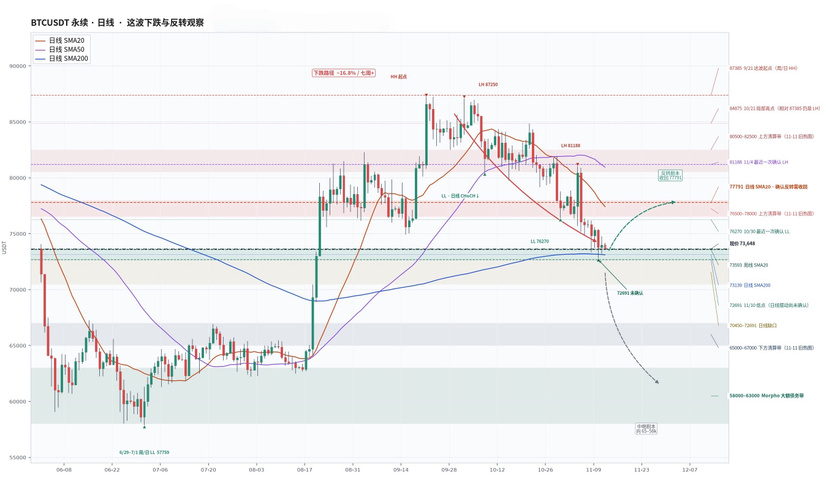
After seven weeks of losses totaling 16.8%, BTC has reached a very delicate position:
➥ Weekly 20 MA: 73593
➥ Daily 200 MA: 73139
━━━━━━━━━━━━━━━━━━━━
Both medium- and long-term moving averages are clustered right beneath price. This is the bulls’ last decent line of defense. A break below is okay as long as price can reclaim it.
The current structure leans bearish and choppy, but don’t short right on the moving averages.
Let’s look at three possible scenarios:
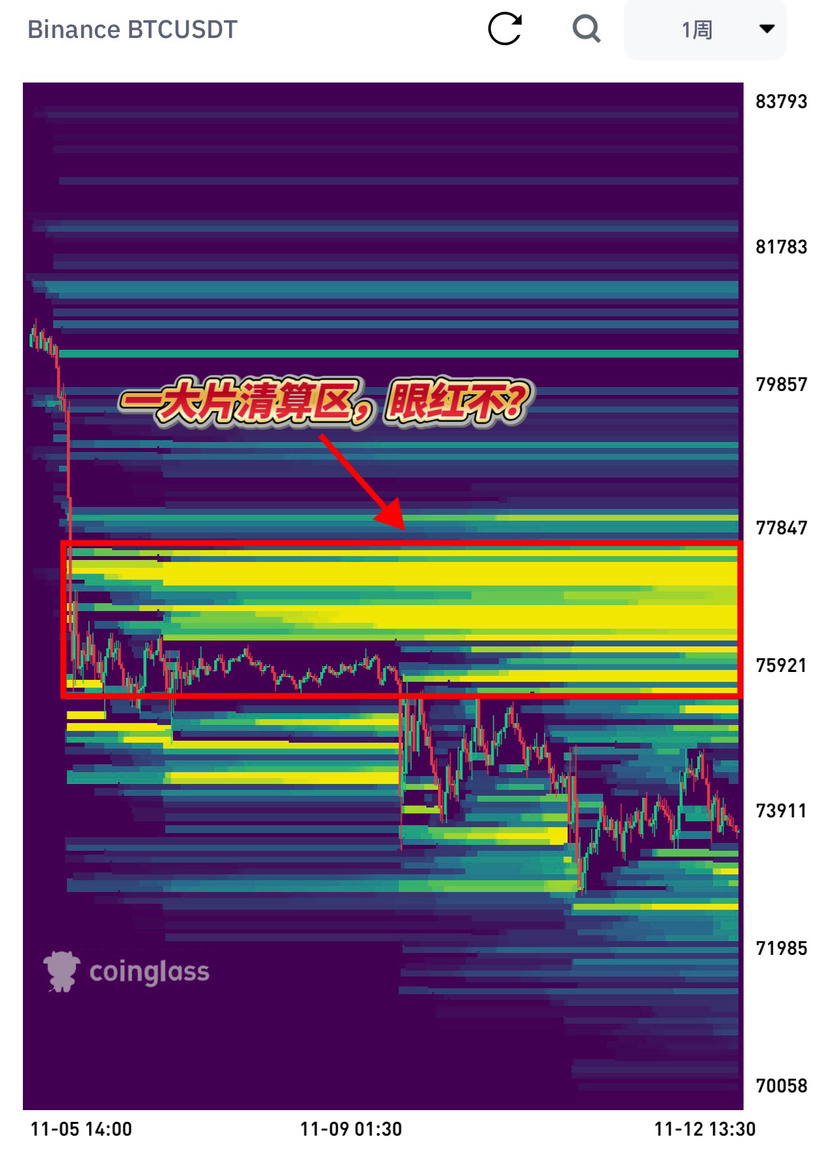
1️⃣ Reversal: Hold 72680 and close the daily candle back above 77800 (the 20-day moving average), while open interest recovers and spot buying picks up. Only then can the two short-side liquidation zones above get swept:
➣76500–78000
➣80500–82500
A reclaim of 81188 would mean the structure has genuinely turned bullish.
2️⃣ Relief rally continuation: Price rallies into 76,500–78,000, then gets pushed back down again (support for this scenario is discussed at the end).
3️⃣ Breakdown continuation: Price fails to reclaim 77800 and loses 72680. Next comes the daily gap at 70450–72000, followed by the on-chain lending liquidation zones:
➫ 63000|$160 million
➫ 59000|$60.56 million
➫ 58000|$154 million
Right now, this looks more like a continuation than a reversal. One reason is that there hasn’t been a shift in the flow of funds.
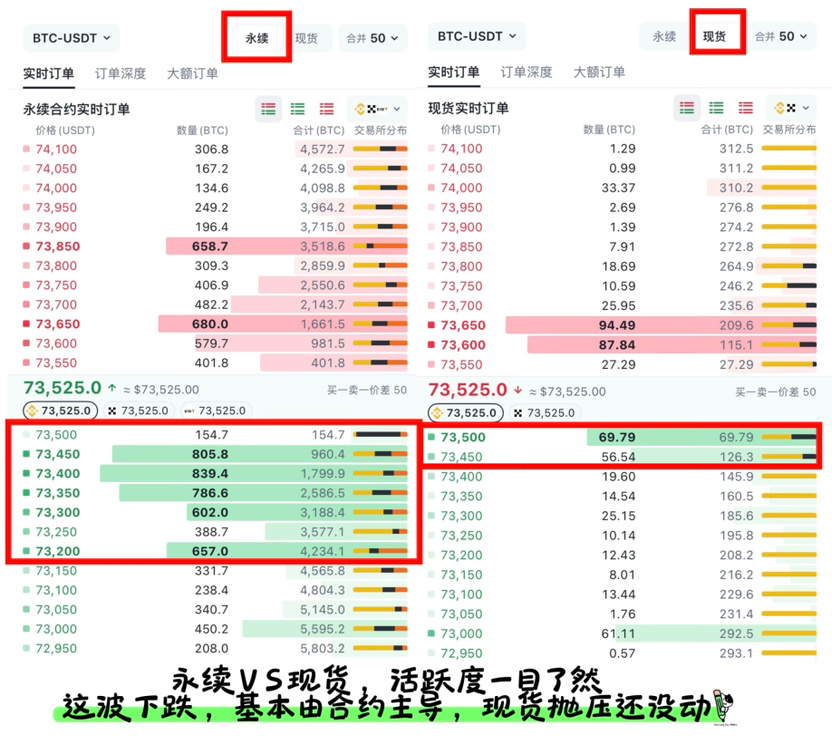
Today’s CVD shows net selling of 1,055 coins in perpetuals, while spot buying was only 159 coins—clearly, spot demand is weak.
ETFs have seen net outflows for four consecutive days. The outflows are slowing, but haven’t turned positive; it’s giving strong F*D vibes.
Stablecoin supply has contracted by about $5.7 billion in nine days. Scary!
The macro picture isn’t encouraging either: the Dollar Index is strong at 103, the 10-year Treasury yield is hovering near 5%, and October CPI came in hawkish. Tomorrow night’s jobless claims at 21:30 are still an unknown; keep an eye on the FOMC on December 9.
One more slow-burning risk.
It’s the official MSCI announcement just released: Strategy will be removed from indexes including the MSCI USA after the close on November 30, and Metaplanet will also be removed from Japan’s small-cap index. This isn’t the cause of the current drop, but passive funds will have to sell these stocks at month-end. Companies that rely on issuing shares to buy coins will have a harder time acting as a source of buying demand, and the buying power most needed for a reversal will keep weakening.
The part I’m still wrestling with is that most retail traders are expecting a rally. The market won’t make it easy for most people to profit, so be ready for a rough ride!
Do you think November is likely to close with a green candle? Think about the scenarios around Christmas.
━━━━━━━━━━━━━━━━━━━━
After seven weeks of losses totaling 16.8%, BTC has reached a very delicate position:
➥ Weekly 20 MA: 73593
➥ Daily 200 MA: 73139
━━━━━━━━━━━━━━━━━━━━
Both medium- and long-term moving averages are clustered right beneath price. This is the bulls’ last decent line of defense. A break below is okay as long as price can reclaim it.
The current structure leans bearish and choppy, but don’t short right on the moving averages.
Let’s look at three possible scenarios:
1️⃣ Reversal: Hold 72680 and close the daily candle back above 77800 (the 20-day moving average), while open interest recovers and spot buying picks up. Only then can the two short-side liquidation zones above get swept: ➣76500–78000 ➣80500–82500 A reclaim of 81188 would mean the structure has genuinely turned bullish.
2️⃣ Relief rally continuation: Price rallies into 76,500–78,000, then gets pushed back down again (support for this scenario is discussed at the end).
3️⃣ Breakdown continuation: Price fails to reclaim 77800 and loses 72680. Next comes the daily gap at 70450–72000, followed by the on-chain lending liquidation zones: ➫ 63000|$160 million ➫ 59000|$60.56 million ➫ 58000|$154 million
Right now, this looks more like a continuation than a reversal. One reason is that there hasn’t been a shift in the flow of funds.
Today’s CVD shows net selling of 1,055 coins in perpetuals, while spot buying was only 159 coins—clearly, spot demand is weak. ETFs have seen net outflows for four consecutive days. The outflows are slowing, but haven’t turned positive; it’s giving strong F*D vibes. Stablecoin supply has contracted by about $5.7 billion in nine days. Scary!
The macro picture isn’t encouraging either: the Dollar Index is strong at 103, the 10-year Treasury yield is hovering near 5%, and October CPI came in hawkish. Tomorrow night’s jobless claims at 21:30 are still an unknown; keep an eye on the FOMC on December 9.
One more slow-burning risk.
It’s the official MSCI announcement just released: Strategy will be removed from indexes including the MSCI USA after the close on November 30, and Metaplanet will also be removed from Japan’s small-cap index. This isn’t the cause of the current drop, but passive funds will have to sell these stocks at month-end. Companies that rely on issuing shares to buy coins will have a harder time acting as a source of buying demand, and the buying power most needed for a reversal will keep weakening.
The part I’m still wrestling with is that most retail traders are expecting a rally. The market won’t make it easy for most people to profit, so be ready for a rough ride!
Do you think November is likely to close with a green candle? Think about the scenarios around Christmas.
Both medium- and long-term moving averages are clustered right beneath price. This is the bulls’ last decent line of defense. A break below is okay as long as price can reclaim it.
The current structure leans bearish and choppy, but don’t short right on the moving averages.
Let’s look at three possible scenarios:
1️⃣ Reversal: Hold 72680 and close the daily candle back above 77800 (the 20-day moving average), while open interest recovers and spot buying picks up. Only then can the two short-side liquidation zones above get swept: ➣76500–78000 ➣80500–82500 A reclaim of 81188 would mean the structure has genuinely turned bullish.
2️⃣ Relief rally continuation: Price rallies into 76,500–78,000, then gets pushed back down again (support for this scenario is discussed at the end).
3️⃣ Breakdown continuation: Price fails to reclaim 77800 and loses 72680. Next comes the daily gap at 70450–72000, followed by the on-chain lending liquidation zones: ➫ 63000|$160 million ➫ 59000|$60.56 million ➫ 58000|$154 million
Right now, this looks more like a continuation than a reversal. One reason is that there hasn’t been a shift in the flow of funds.
Today’s CVD shows net selling of 1,055 coins in perpetuals, while spot buying was only 159 coins—clearly, spot demand is weak. ETFs have seen net outflows for four consecutive days. The outflows are slowing, but haven’t turned positive; it’s giving strong F*D vibes. Stablecoin supply has contracted by about $5.7 billion in nine days. Scary!
The macro picture isn’t encouraging either: the Dollar Index is strong at 103, the 10-year Treasury yield is hovering near 5%, and October CPI came in hawkish. Tomorrow night’s jobless claims at 21:30 are still an unknown; keep an eye on the FOMC on December 9.
One more slow-burning risk.
It’s the official MSCI announcement just released: Strategy will be removed from indexes including the MSCI USA after the close on November 30, and Metaplanet will also be removed from Japan’s small-cap index. This isn’t the cause of the current drop, but passive funds will have to sell these stocks at month-end. Companies that rely on issuing shares to buy coins will have a harder time acting as a source of buying demand, and the buying power most needed for a reversal will keep weakening.
The part I’m still wrestling with is that most retail traders are expecting a rally. The market won’t make it easy for most people to profit, so be ready for a rough ride!
Do you think November is likely to close with a green candle? Think about the scenarios around Christmas.
1
266
·
--
Is this considered good news?
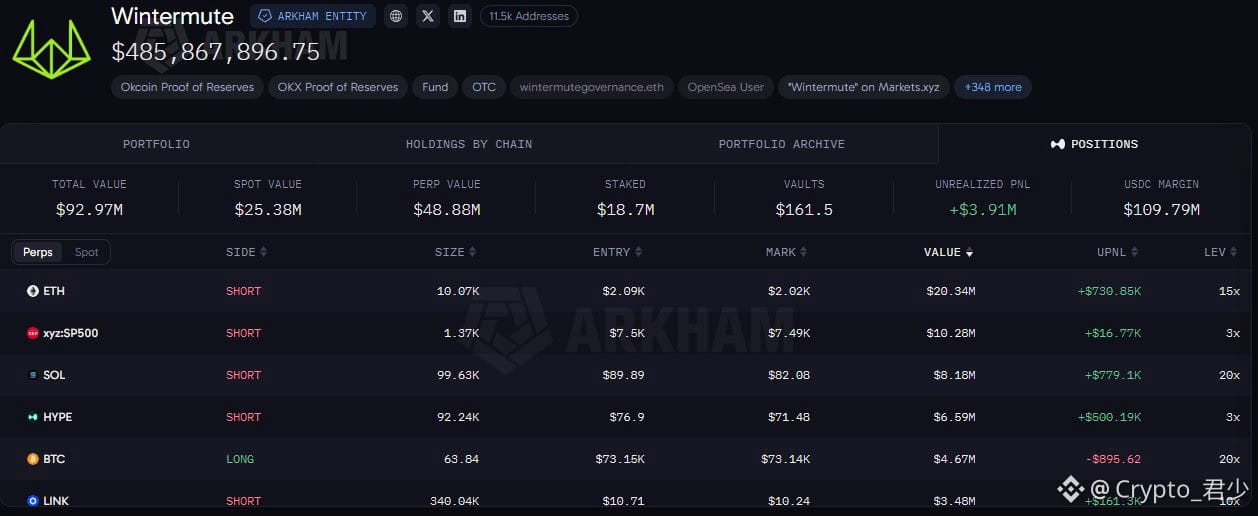
After the decline, Wintermute has shifted to a long position on $BTC ,
but they still hold an ETH short. I really hope ETH reverses—it's the only way altcoins have a chance!
{future}(BTCUSDT)
Is this considered good news?
After the decline, Wintermute has shifted to a long position on $BTC ,
but they still hold an ETH short. I really hope ETH reverses—it's the only way altcoins have a chance!
After the decline, Wintermute has shifted to a long position on $BTC ,
but they still hold an ETH short. I really hope ETH reverses—it's the only way altcoins have a chance!
1
1.8k
·
--
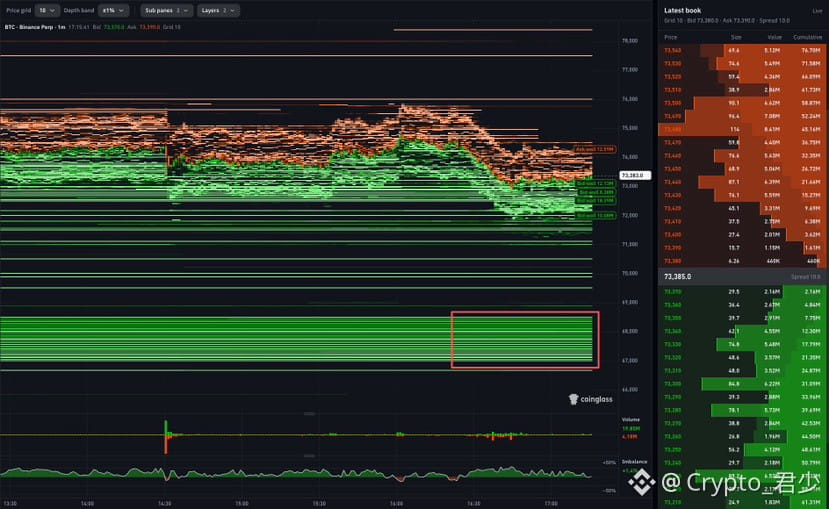
Is the next support level 68K?
Are so many limit orders already waiting at $BTC ?
{future}(BTCUSDT)
Is the next support level 68K?
Are so many limit orders already waiting at $BTC ?
Are so many limit orders already waiting at $BTC ?
3
1.7k
·
--
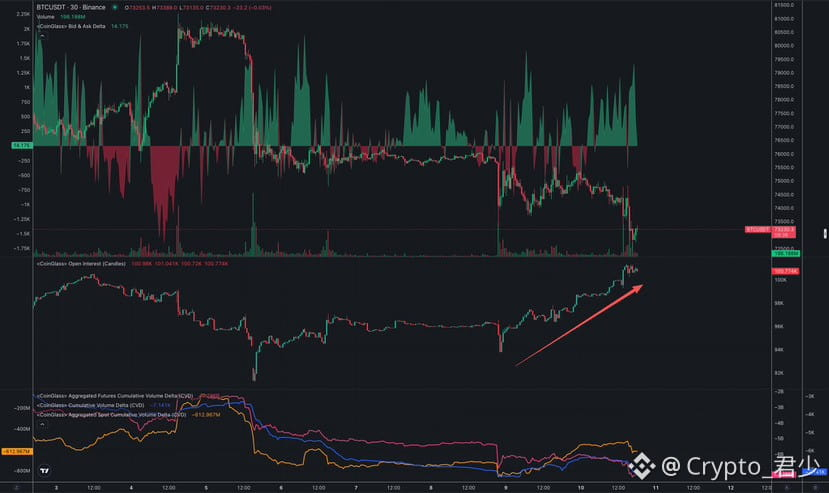
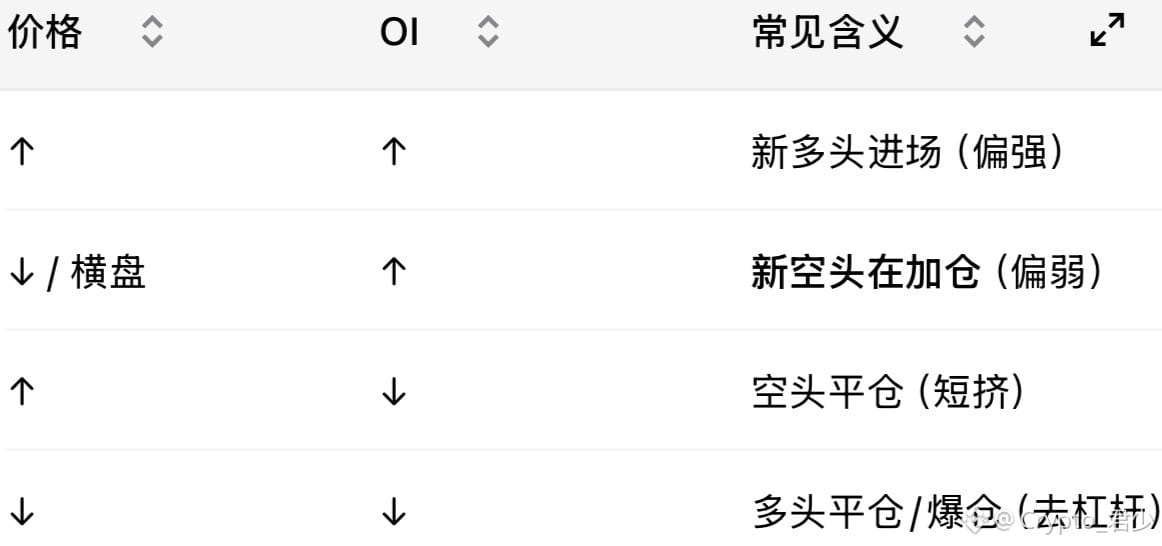
Not looking good,
OI is rising—not a good sign!
The chart makes it clear: weak prices + rising OI = new short positions are being opened, not just longs getting liquidated (long liquidations would cause OI to fall).
Not looking good,
OI is rising—not a good sign!
The chart makes it clear: weak prices + rising OI = new short positions are being opened, not just longs getting liquidated (long liquidations would cause OI to fall).
OI is rising—not a good sign!
The chart makes it clear: weak prices + rising OI = new short positions are being opened, not just longs getting liquidated (long liquidations would cause OI to fall).
1k
·
--
Partly True
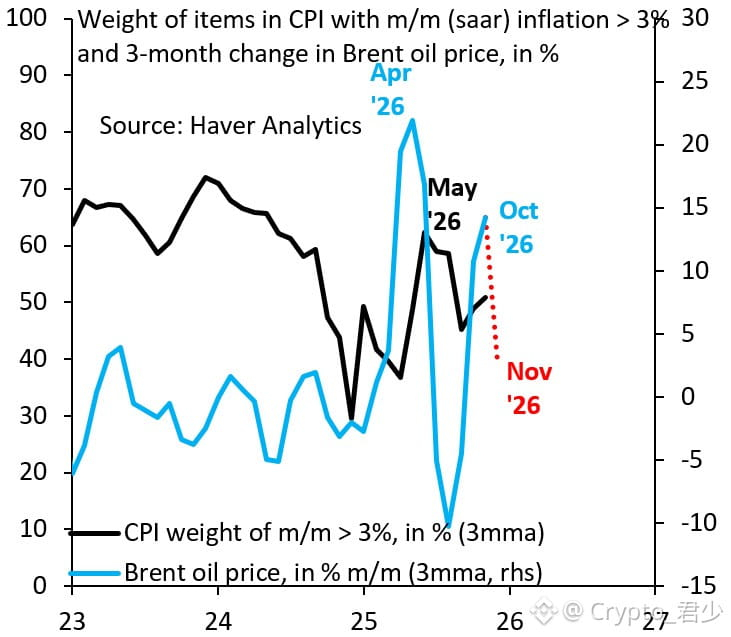
U.S. CPI unexpectedly rose, and the market is starting to bet on a 50-basis-point Fed rate hike next month.
But these figures look backward; oil prices have already fallen 26% since last month.
You can’t use old data to force a 50-basis-point hike. This upside surprise is just noise. The market will most likely close higher in November.
$BTC
{future}(BTCUSDT)
U.S. CPI unexpectedly rose, and the market is starting to bet on a 50-basis-point Fed rate hike next month.
But these figures look backward; oil prices have already fallen 26% since last month.
You can’t use old data to force a 50-basis-point hike. This upside surprise is just noise. The market will most likely close higher in November.
$BTC
But these figures look backward; oil prices have already fallen 26% since last month.
You can’t use old data to force a 50-basis-point hike. This upside surprise is just noise. The market will most likely close higher in November.
$BTC
179
·
--
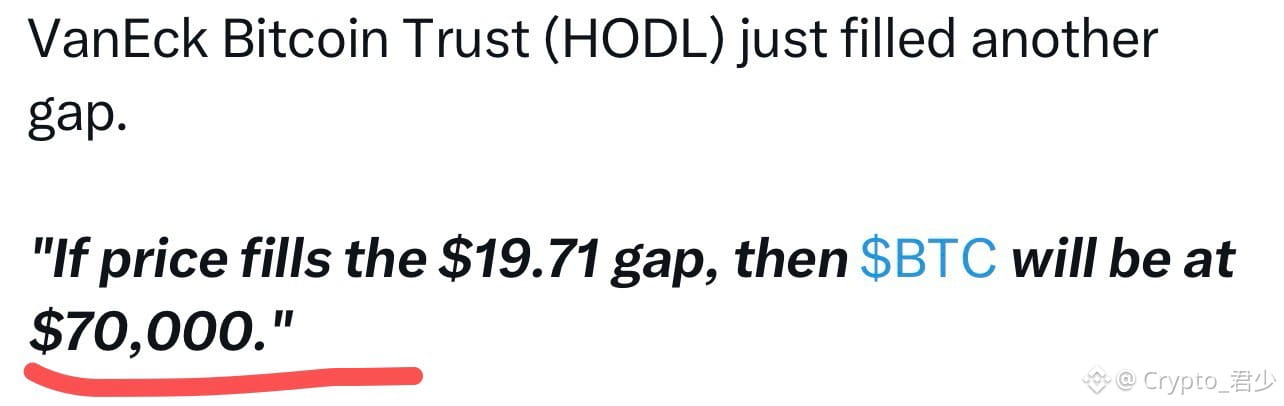
It’s said another exchange has been hacked,
if it’s true, everyone keep an eye on this level: $BTC !
{future}(BTCUSDT)
It’s said another exchange has been hacked,
if it’s true, everyone keep an eye on this level: $BTC !
if it’s true, everyone keep an eye on this level: $BTC !
3
3
11.3k
·
--
If I had watched this show back then, my life really would have been different!
$BTC
If I had watched this show back then, my life really would have been different!
$BTC
$BTC
7
6
49
43.5k
·
--
Verified
The U.S. October unemployment rate will be released tonight at 21:30
Previous: 4.2% · Forecast: 4.2%
• >4.2%: A weaker labor market could cool rate-hike expectations and favor a rebound in risk assets
• =4.2%: In line with expectations; direction unclear, with nonfarm payrolls and wage data also in focus
• <4.2%: Employment remains tight, raising rate-hike expectations and putting short-term pressure on markets
Also watch nonfarm payroll gains, hourly wage growth, and the labor force participation rate.
The U.S. October unemployment rate will be released tonight at 21:30
Previous: 4.2% · Forecast: 4.2%
• >4.2%: A weaker labor market could cool rate-hike expectations and favor a rebound in risk assets
• =4.2%: In line with expectations; direction unclear, with nonfarm payrolls and wage data also in focus
• <4.2%: Employment remains tight, raising rate-hike expectations and putting short-term pressure on markets
Also watch nonfarm payroll gains, hourly wage growth, and the labor force participation rate.
Previous: 4.2% · Forecast: 4.2%
• >4.2%: A weaker labor market could cool rate-hike expectations and favor a rebound in risk assets
• =4.2%: In line with expectations; direction unclear, with nonfarm payrolls and wage data also in focus
• <4.2%: Employment remains tight, raising rate-hike expectations and putting short-term pressure on markets
Also watch nonfarm payroll gains, hourly wage growth, and the labor force participation rate.
1.6k
·
--
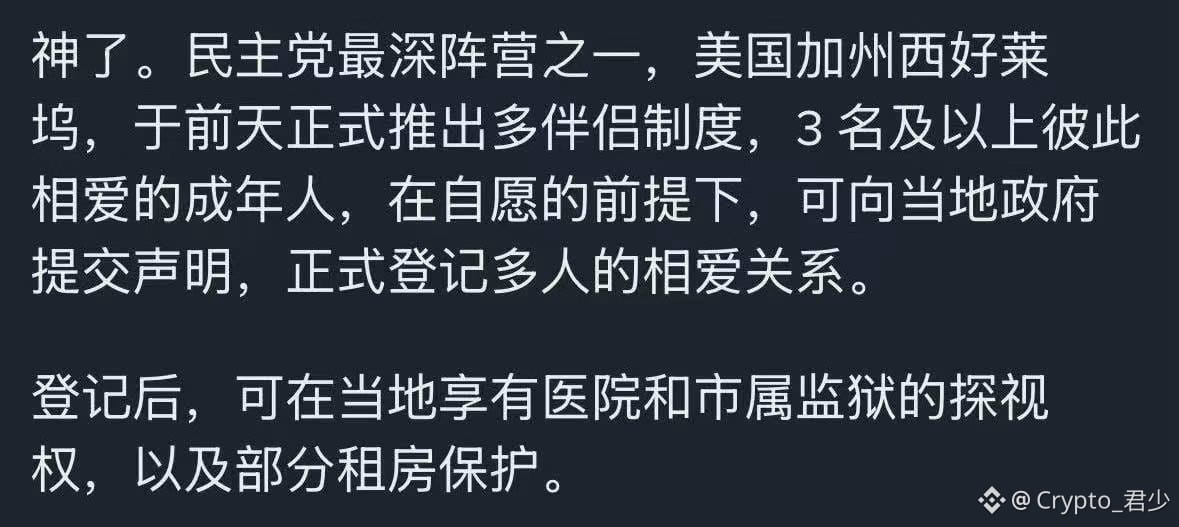
Polygamy,
A9 bigwigs are in luck!
Just imagining that heartwarming scene at night makes me happy!
Polygamy,
A9 bigwigs are in luck!
Just imagining that heartwarming scene at night makes me happy!
A9 bigwigs are in luck!
Just imagining that heartwarming scene at night makes me happy!
4
3
2.2k
·
--
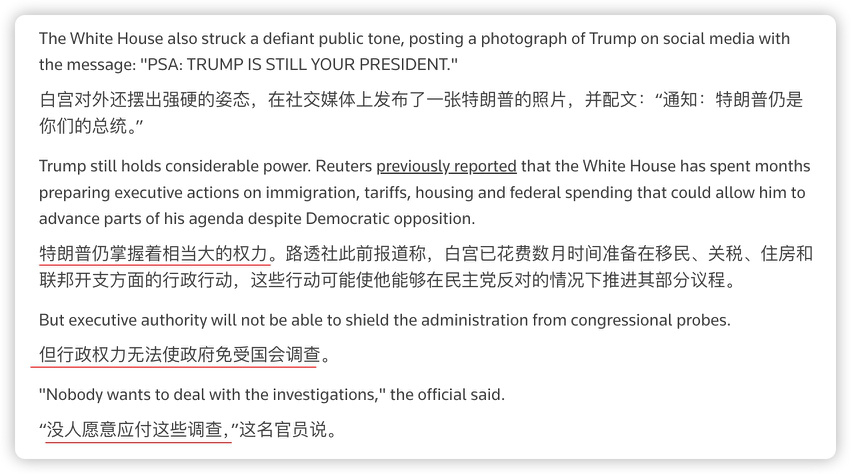
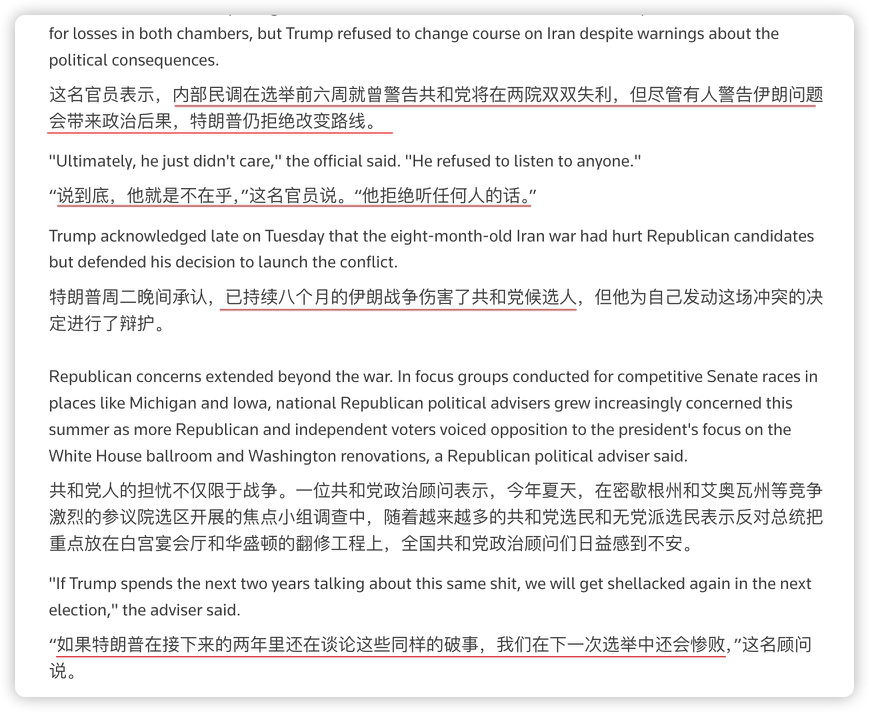
He was a big deal with an A7 valuation back then, too!
He was a big deal with an A7 valuation back then, too!

2
4
6.6k
Log in to explore more content
Join global crypto users on Binance Square
⚡️ Get latest and useful information about crypto.
💬 Trusted by the world’s largest crypto exchange.
👍 Discover real insights from verified creators.
Email / Phone number
Trending Topics
CryptoSelloffTriggersMultipleWhaleLiquidations
164,197 views
1,693 Discussing
Crypto Liquidations Top $2B in 24 Hours as 329,000 Traders Are Wiped Out
Binance News
·39 Likes
·50.9k views
USSpotXRPETFsSeeLargestWeeklyOutflowIn8Months
149,354 views
1,500 Discussing
WillFOMCMinutesReinforceRateHikeExpectations?
42,571 views
697 Discussing