
Crypto_Radar-
201 Posts

Crypto_Radar-
Report
Block User
Ділюся власними думками та аналізом крипторинку 📊Не фінансова порада. DYOR 🔍
High-Frequency Trader
5.7 Years
1 Following
127 Followers
177 Liked
Posts
All
Quotes
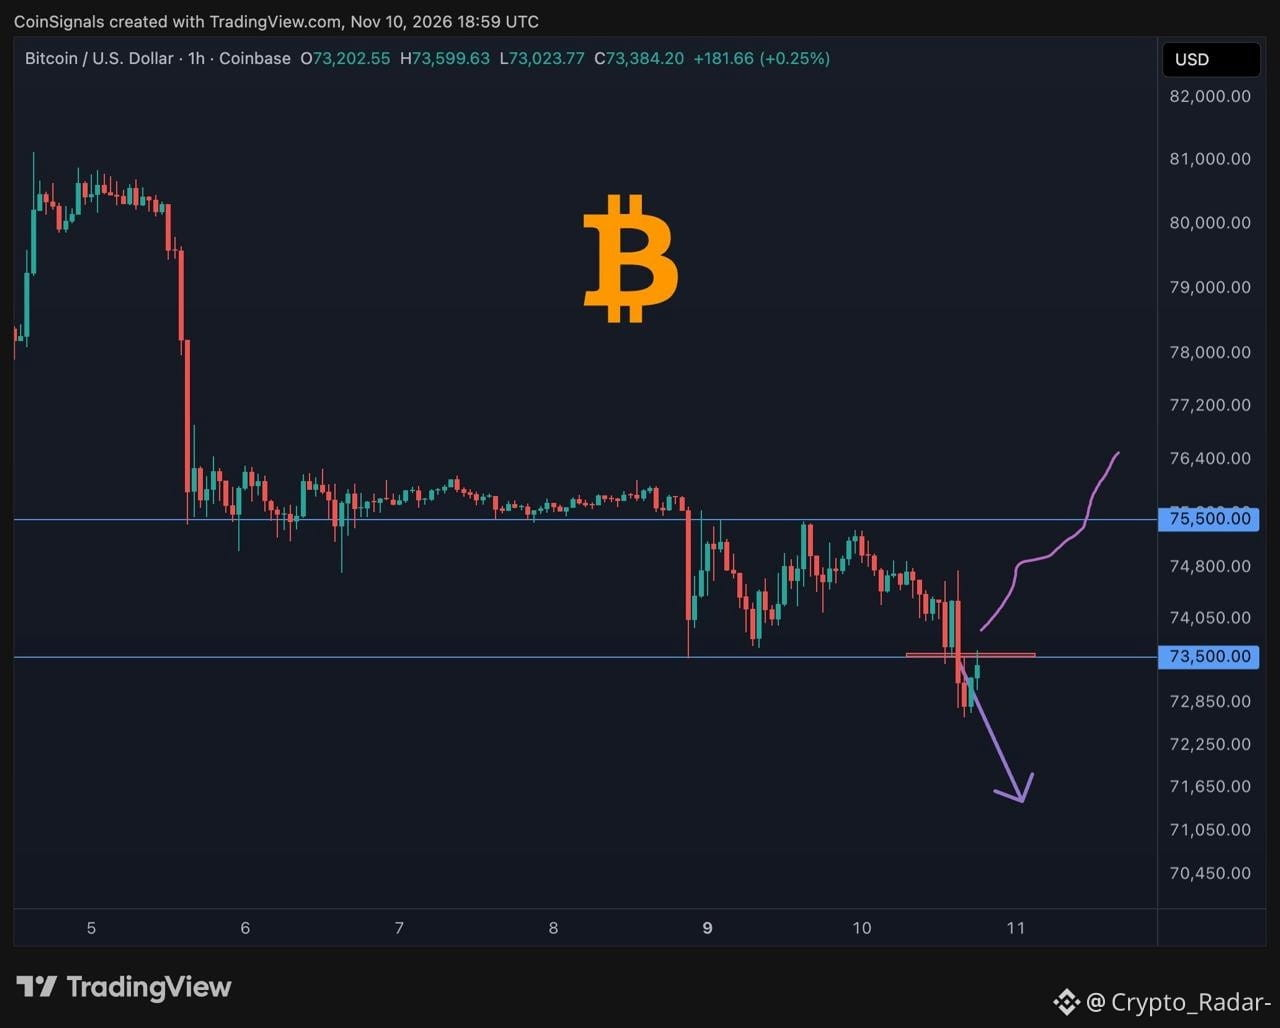
💰The battle between the “bulls” and “bears” is unfolding around $73,500. An important trend reversal zone 👀
{future}(BTCUSDT)
#BTC
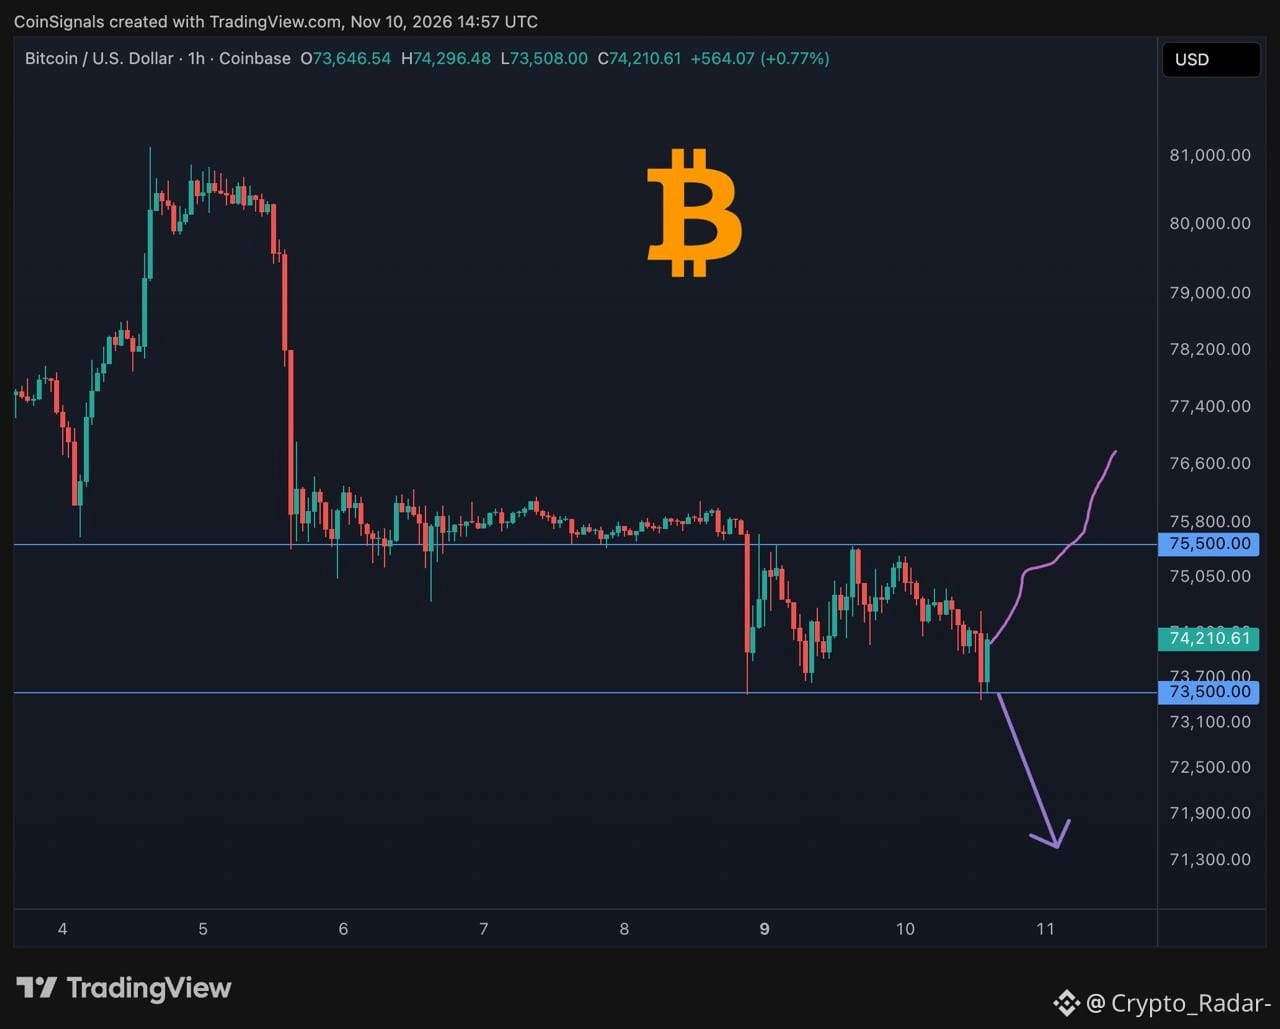
💰The battle between the “bulls” and “bears” is unfolding around $73,500. An important trend reversal zone 👀
#BTC
#BTC
2
194
📈 Bitcoin is currently consolidating in the $75,500–$73,500 range. Strengthening is taking place within this range, so expect a 3–4% rise before the next decline.
💰 We have taken 70% profit on all our recent short positions. We will continue to hold the short positions opened at higher levels.
Short-term outlook:$BTC
Bullish, but watch the $73,500 level closely. A break below this level could open the way for the next decline toward $69,000.
{future}(BTCUSDT)
📈 Bitcoin is currently consolidating in the $75,500–$73,500 range. Strengthening is taking place within this range, so expect a 3–4% rise before the next decline.
💰 We have taken 70% profit on all our recent short positions. We will continue to hold the short positions opened at higher levels.
Short-term outlook:$BTC
Bullish, but watch the $73,500 level closely. A break below this level could open the way for the next decline toward $69,000.
💰 We have taken 70% profit on all our recent short positions. We will continue to hold the short positions opened at higher levels.
Short-term outlook:$BTC
Bullish, but watch the $73,500 level closely. A break below this level could open the way for the next decline toward $69,000.
2
199
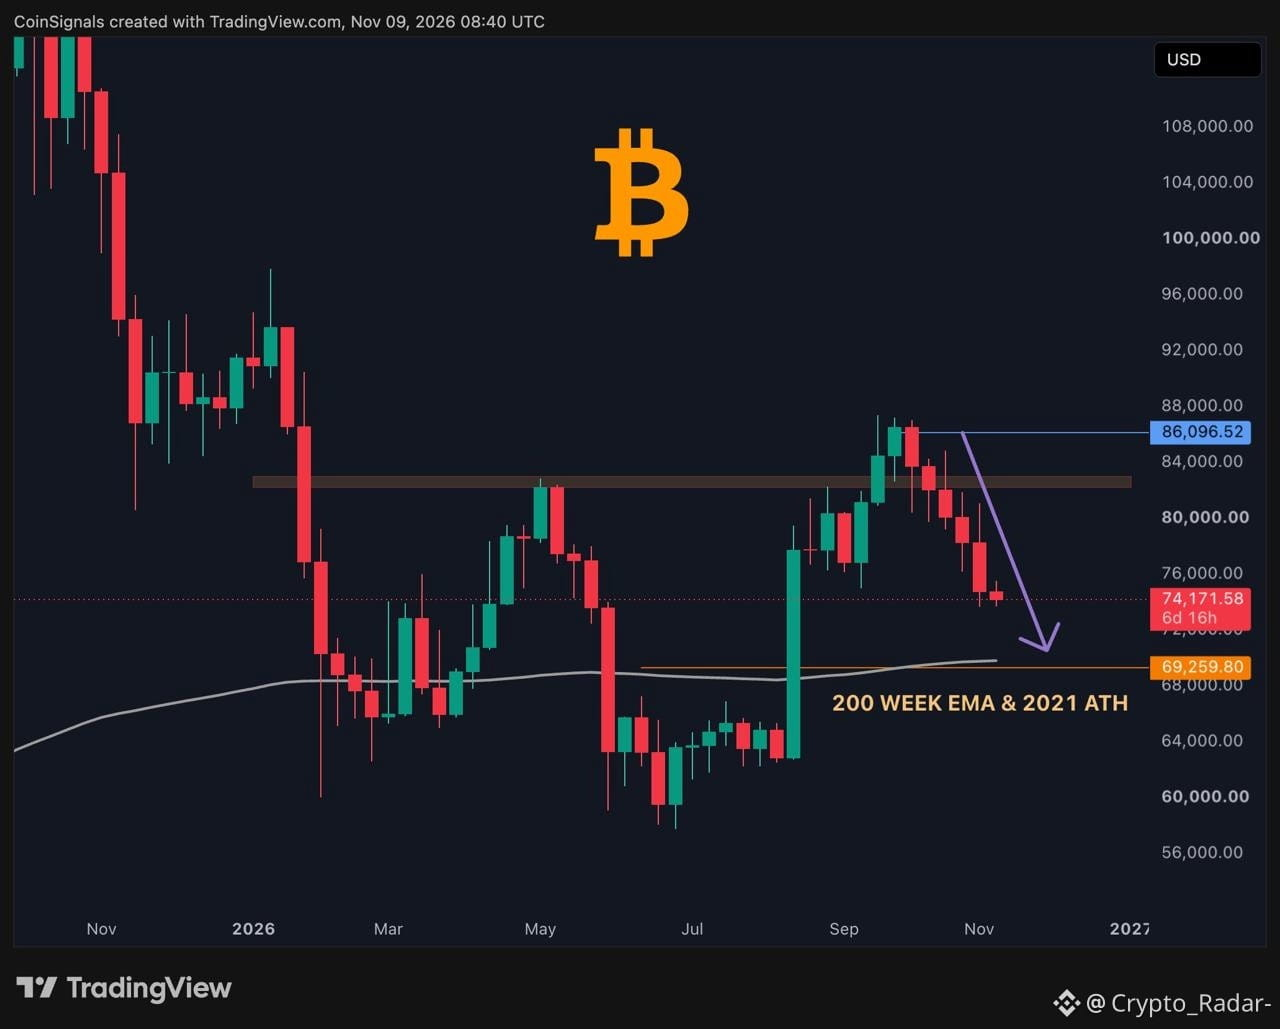
💰 $BTC We've been saying for over a month that Bitcoin would at least test the $69,000 level.
$69,000 is now very close, and we're holding several short positions opened at $86,000.
The 50-week exponential moving average has been breached. ❌
The next target is the 200-week exponential moving average. ✅
A weekly close below the 200-week exponential moving average could pave the way for a new cycle low.
{future}(BTCUSDT)
💰 $BTC We've been saying for over a month that Bitcoin would at least test the $69,000 level.
$69,000 is now very close, and we're holding several short positions opened at $86,000.
The 50-week exponential moving average has been breached. ❌
The next target is the 200-week exponential moving average. ✅
A weekly close below the 200-week exponential moving average could pave the way for a new cycle low.
$69,000 is now very close, and we're holding several short positions opened at $86,000.
The 50-week exponential moving average has been breached. ❌
The next target is the 200-week exponential moving average. ✅
A weekly close below the 200-week exponential moving average could pave the way for a new cycle low.
3
3.2k
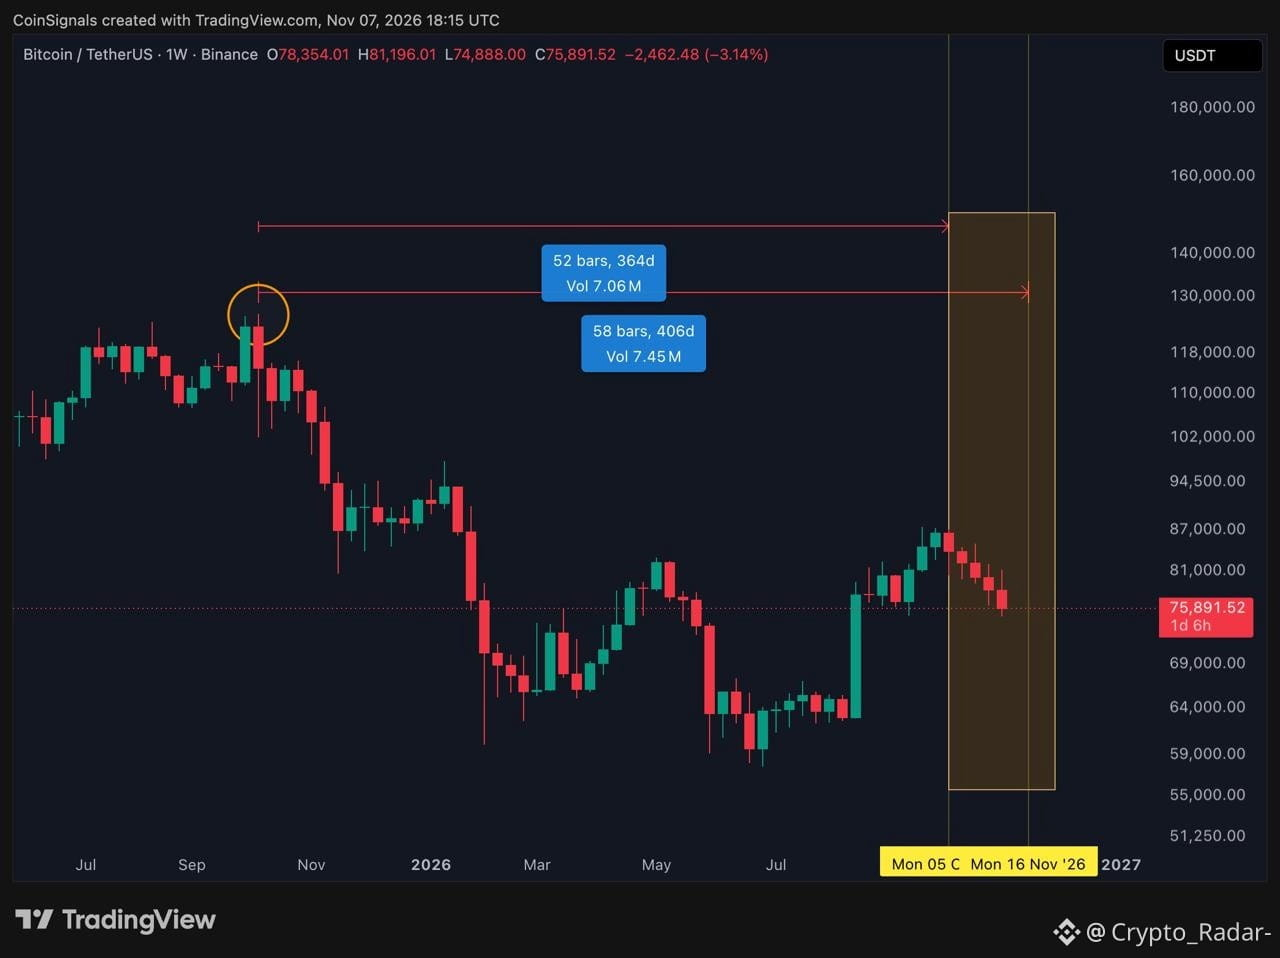
$BTC Previous lows from three cycles were observed approximately 365–406 days after the corresponding highs.
Based on this historical pattern, the current four-year cycle low will likely occur by the end of November or in December.
⚠️ The next two months are crucial.
$BTC Previous lows from three cycles were observed approximately 365–406 days after the corresponding highs.
Based on this historical pattern, the current four-year cycle low will likely occur by the end of November or in December.
⚠️ The next two months are crucial.
Based on this historical pattern, the current four-year cycle low will likely occur by the end of November or in December.
⚠️ The next two months are crucial.
2
1.8k


$BTC
$BTC

Crypto_Radar-
·
--
💰 $BTC
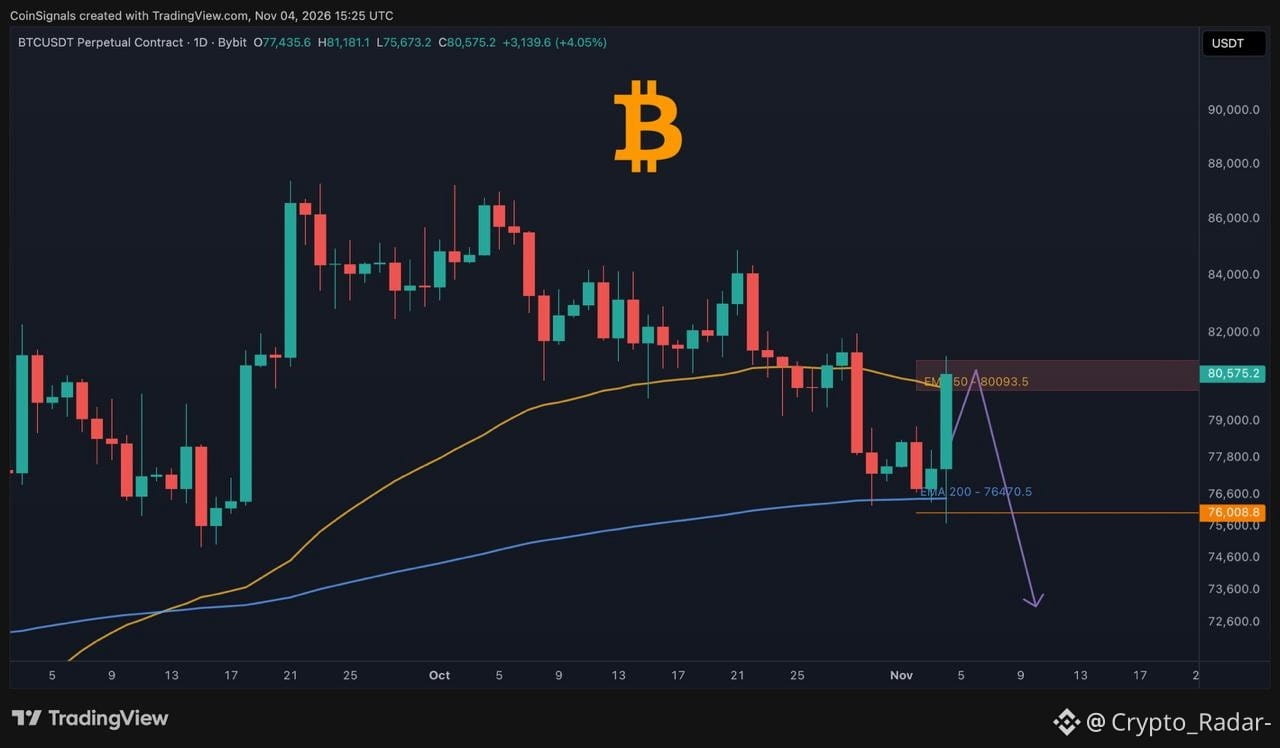
Break below the $80,000 level (50-day exponential moving average).
Short position in the $80,000–$81,000 range, as planned.
Break below the $80,000 level (50-day exponential moving average).
Short position in the $80,000–$81,000 range, as planned.
2
15
💰 $BTC
{future}(BTCUSDT)
Break below the $80,000 level (50-day exponential moving average).
Short position in the $80,000–$81,000 range, as planned.
💰 $BTC
Break below the $80,000 level (50-day exponential moving average).
Short position in the $80,000–$81,000 range, as planned.
Break below the $80,000 level (50-day exponential moving average).
Short position in the $80,000–$81,000 range, as planned.
1
4
2.3k
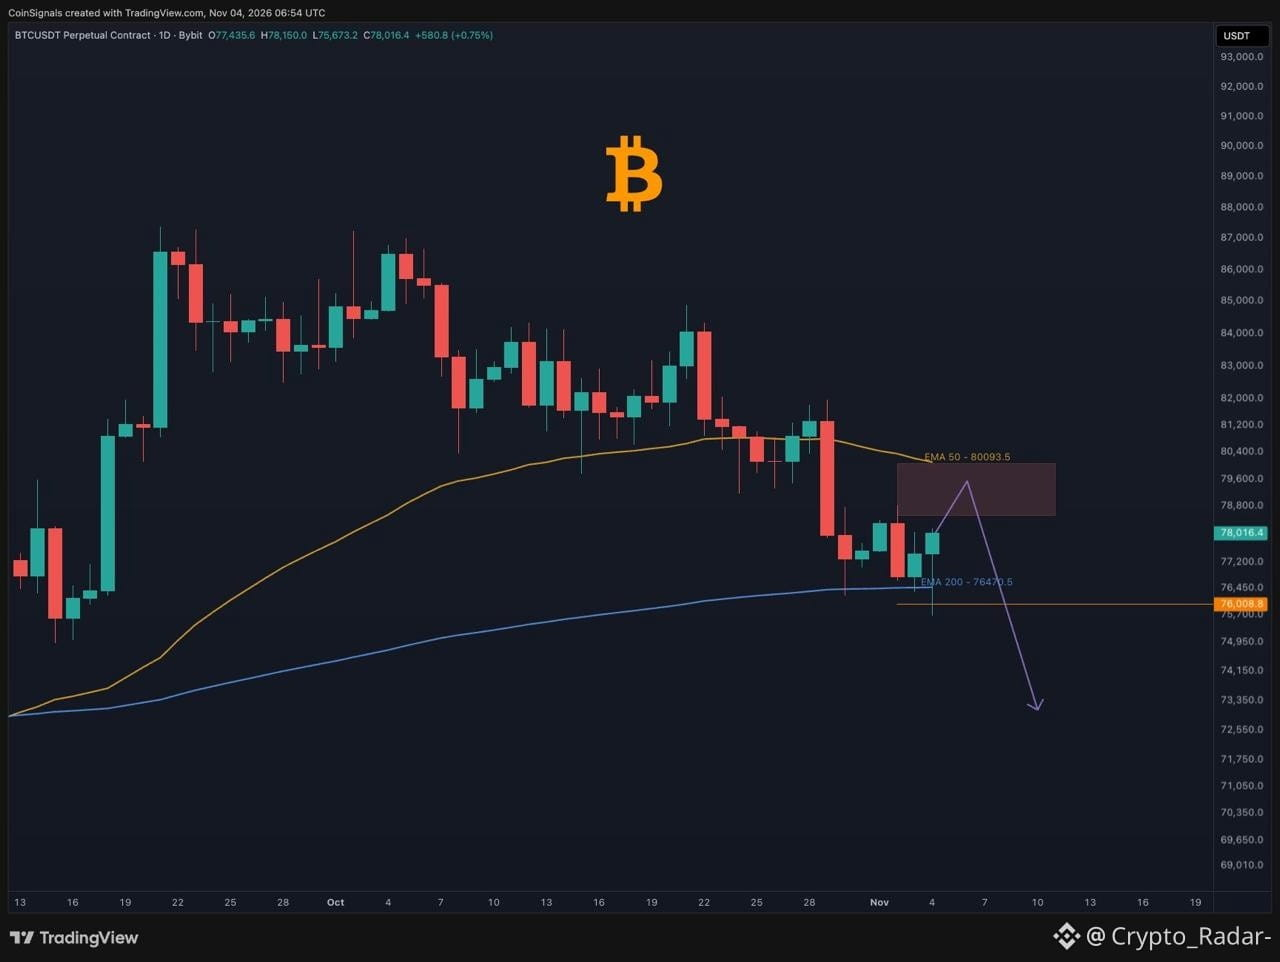
💰 Price $BTC , as expected, fell below $76,000 and found support at the 200-day exponential moving average (EMA).
A bounce toward $78,500–$80,000 (the 50-day EMA) is expected, after which another decline toward $73,000 may follow.
We are holding short positions from several levels, starting at $86,000. We will actively add to our positions within the highlighted red zone.
{future}(BTCUSDT)
💰 Price $BTC , as expected, fell below $76,000 and found support at the 200-day exponential moving average (EMA).
A bounce toward $78,500–$80,000 (the 50-day EMA) is expected, after which another decline toward $73,000 may follow.
We are holding short positions from several levels, starting at $86,000. We will actively add to our positions within the highlighted red zone.
A bounce toward $78,500–$80,000 (the 50-day EMA) is expected, after which another decline toward $73,000 may follow.
We are holding short positions from several levels, starting at $86,000. We will actively add to our positions within the highlighted red zone.
4
1.8k
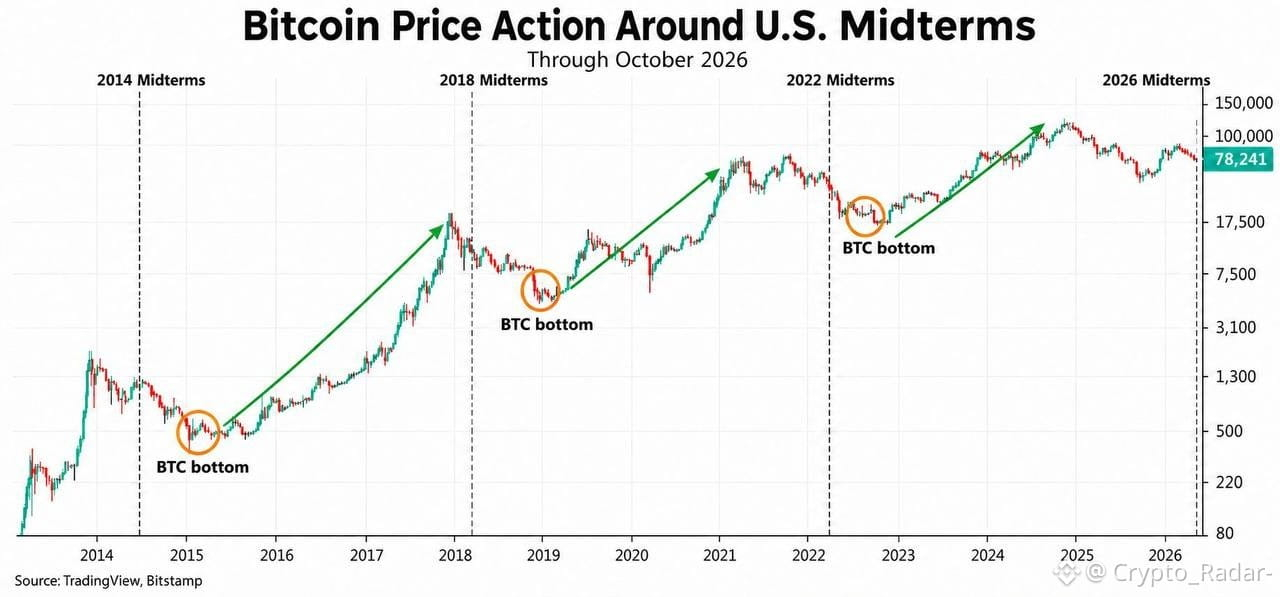
🚨$BTC The last THREE Bitcoin cycle lows occurred shortly after the U.S. midterm elections.
2014 → 71 days later
2018 → 39 days later
2022 → 13 days later
The next U.S. midterm elections are today, November 3.
This matches our forecast: "A low in late November or mid-December."
{future}(BTCUSDT)
🚨$BTC The last THREE Bitcoin cycle lows occurred shortly after the U.S. midterm elections.
2014 → 71 days later
2018 → 39 days later
2022 → 13 days later
The next U.S. midterm elections are today, November 3.
This matches our forecast: "A low in late November or mid-December."
2014 → 71 days later
2018 → 39 days later
2022 → 13 days later
The next U.S. midterm elections are today, November 3.
This matches our forecast: "A low in late November or mid-December."
5
7k
Today, the U.S. is holding midterm elections. 🇺🇸
Control of Congress is at stake, and the outcome could affect stock, cryptocurrency, and bond prices, as well as the dollar exchange rate.
* <b>Republican victory:</b> fewer obstacles to cryptocurrency development, but interest rates and the dollar could rise.
* <b>Democratic victory:</b> longer discussions about cryptocurrencies and deeper budget disagreements.
* <b>Divided Congress:</b> passing important laws becomes harder, with greater uncertainty around funding.
* <b>Uncertain or prolonged result:</b> short-term volatility until the situation becomes clear.
Don’t try to predict the first move. Manage your risks. 👊
Today, the U.S. is holding midterm elections. 🇺🇸
Control of Congress is at stake, and the outcome could affect stock, cryptocurrency, and bond prices, as well as the dollar exchange rate.
* <b>Republican victory:</b> fewer obstacles to cryptocurrency development, but interest rates and the dollar could rise.
* <b>Democratic victory:</b> longer discussions about cryptocurrencies and deeper budget disagreements.
* <b>Divided Congress:</b> passing important laws becomes harder, with greater uncertainty around funding.
* <b>Uncertain or prolonged result:</b> short-term volatility until the situation becomes clear.
Don’t try to predict the first move. Manage your risks. 👊
Control of Congress is at stake, and the outcome could affect stock, cryptocurrency, and bond prices, as well as the dollar exchange rate.
* <b>Republican victory:</b> fewer obstacles to cryptocurrency development, but interest rates and the dollar could rise.
* <b>Democratic victory:</b> longer discussions about cryptocurrencies and deeper budget disagreements.
* <b>Divided Congress:</b> passing important laws becomes harder, with greater uncertainty around funding.
* <b>Uncertain or prolonged result:</b> short-term volatility until the situation becomes clear.
Don’t try to predict the first move. Manage your risks. 👊
1
393
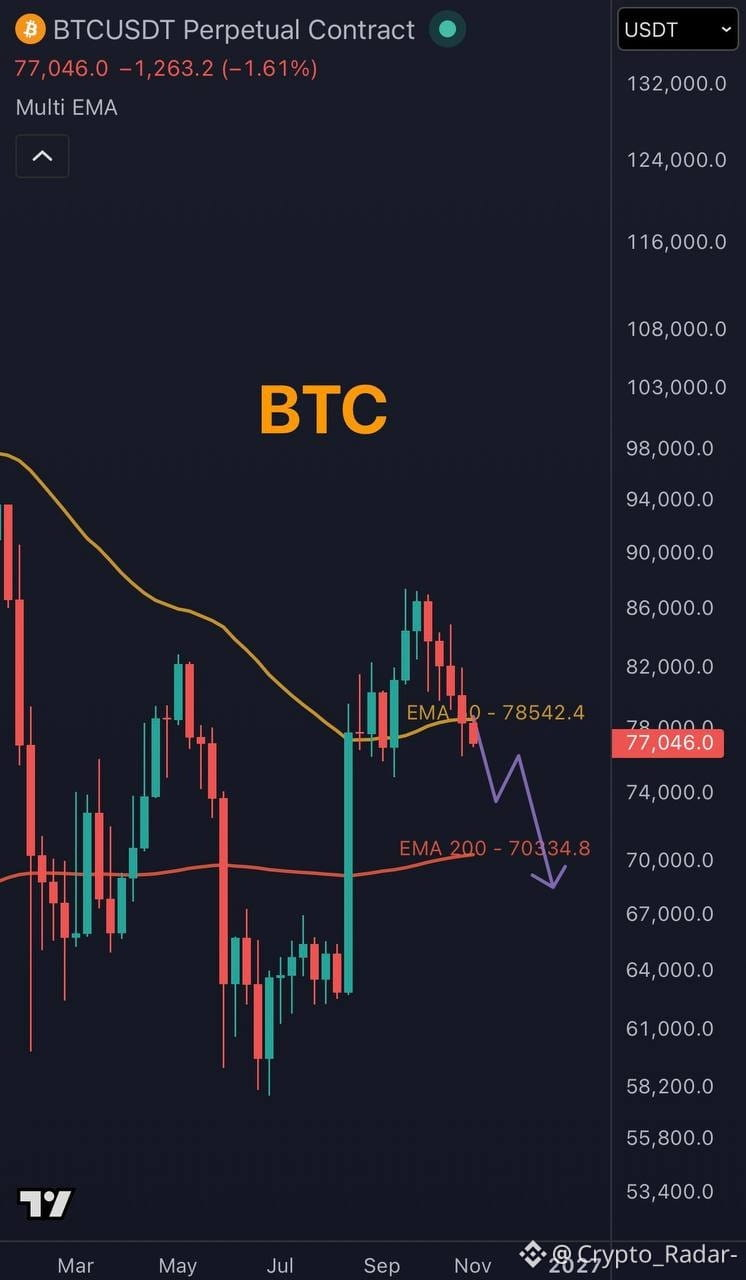
💰🚨 Bitcoin has lost the 50-week exponential moving average (bull/bear market indicator).
$BTC
If it fails to climb back above this level, it could plunge to the 200-week exponential moving average, in the $69,000–$70,000 range.
{future}(BTCUSDT)
💰🚨 Bitcoin has lost the 50-week exponential moving average (bull/bear market indicator).
$BTC
If it fails to climb back above this level, it could plunge to the 200-week exponential moving average, in the $69,000–$70,000 range.
$BTC
If it fails to climb back above this level, it could plunge to the 200-week exponential moving average, in the $69,000–$70,000 range.
1
1
1.3k
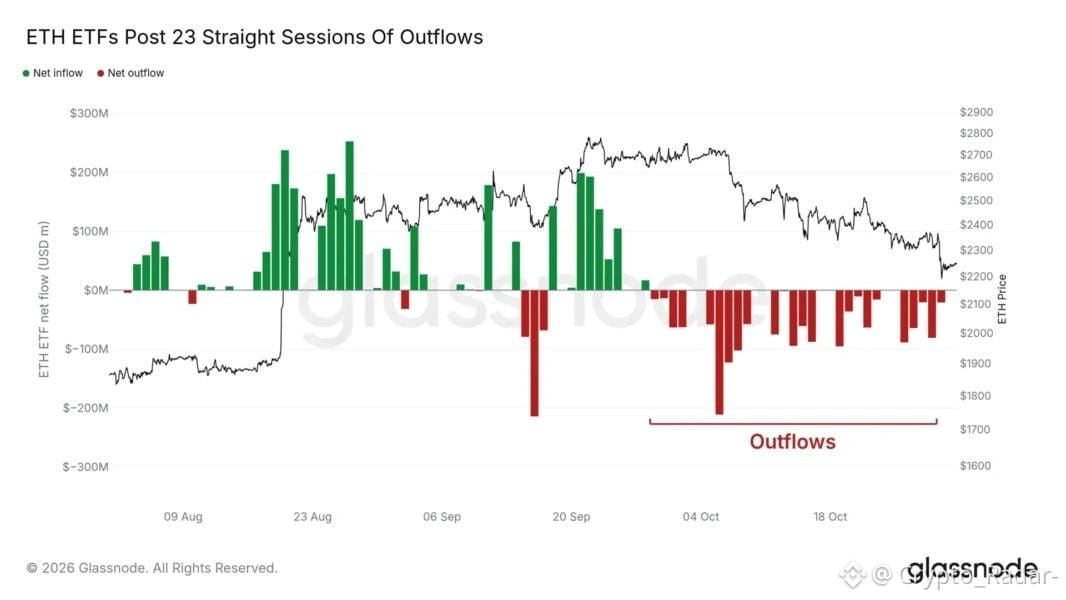
📉💰 Spot ETFs for $ETH have recorded net outflows for 23 consecutive trading days—the longest streak since their launch.
📉💰 Spot ETFs for $ETH have recorded net outflows for 23 consecutive trading days—the longest streak since their launch.
138
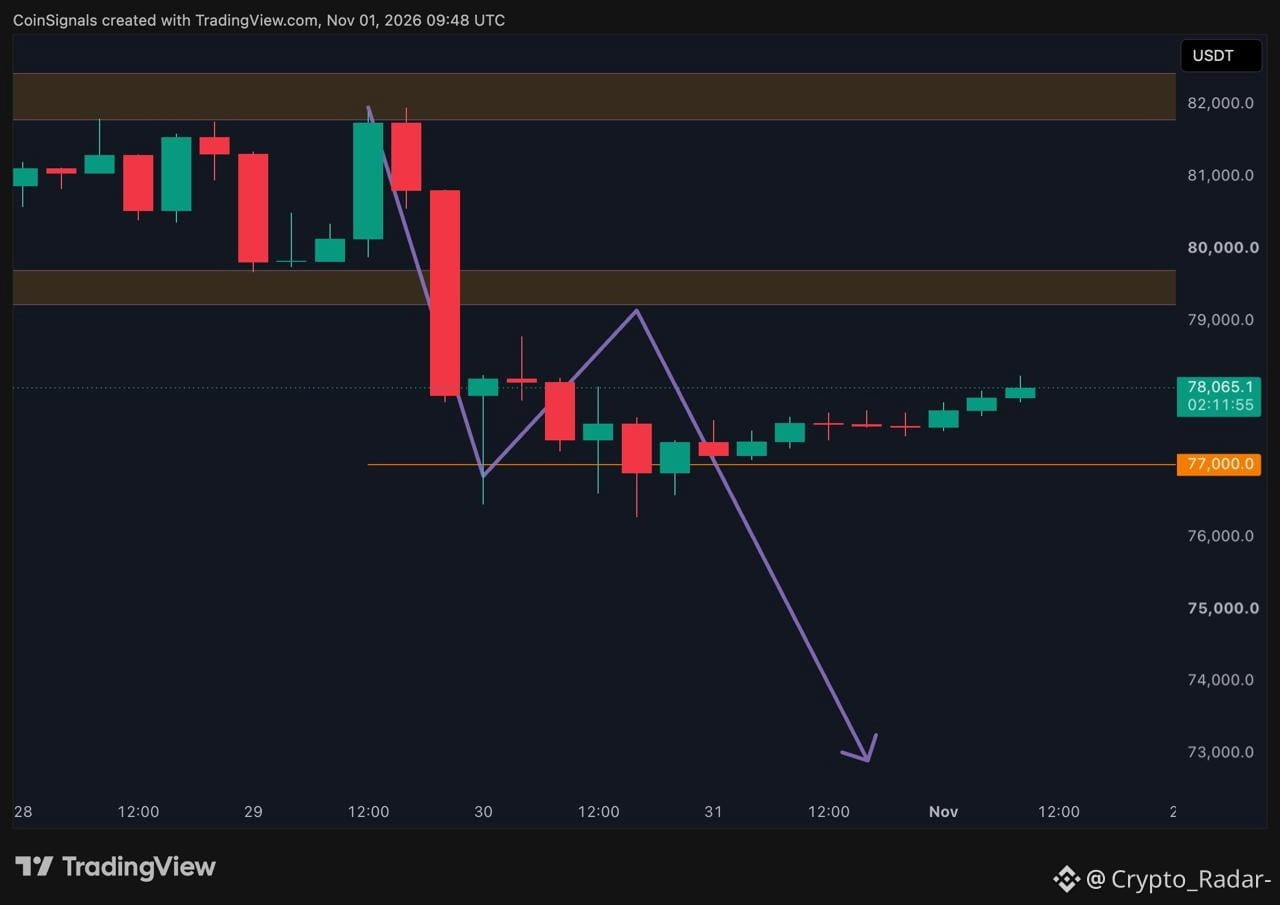
💰 The price $BTC reached our target of $82,000, then fell to $77,000.
It then bounced back into the $78,500–$79,500 range before dropping to $76,000, as expected.
We may see another attempt to break through the $78,000–$79,500 range before the price moves down toward $75,000.
💰 The price $BTC reached our target of $82,000, then fell to $77,000.
It then bounced back into the $78,500–$79,500 range before dropping to $76,000, as expected.
We may see another attempt to break through the $78,000–$79,500 range before the price moves down toward $75,000.
It then bounced back into the $78,500–$79,500 range before dropping to $76,000, as expected.
We may see another attempt to break through the $78,000–$79,500 range before the price moves down toward $75,000.
3
3.3k
Market Analysis
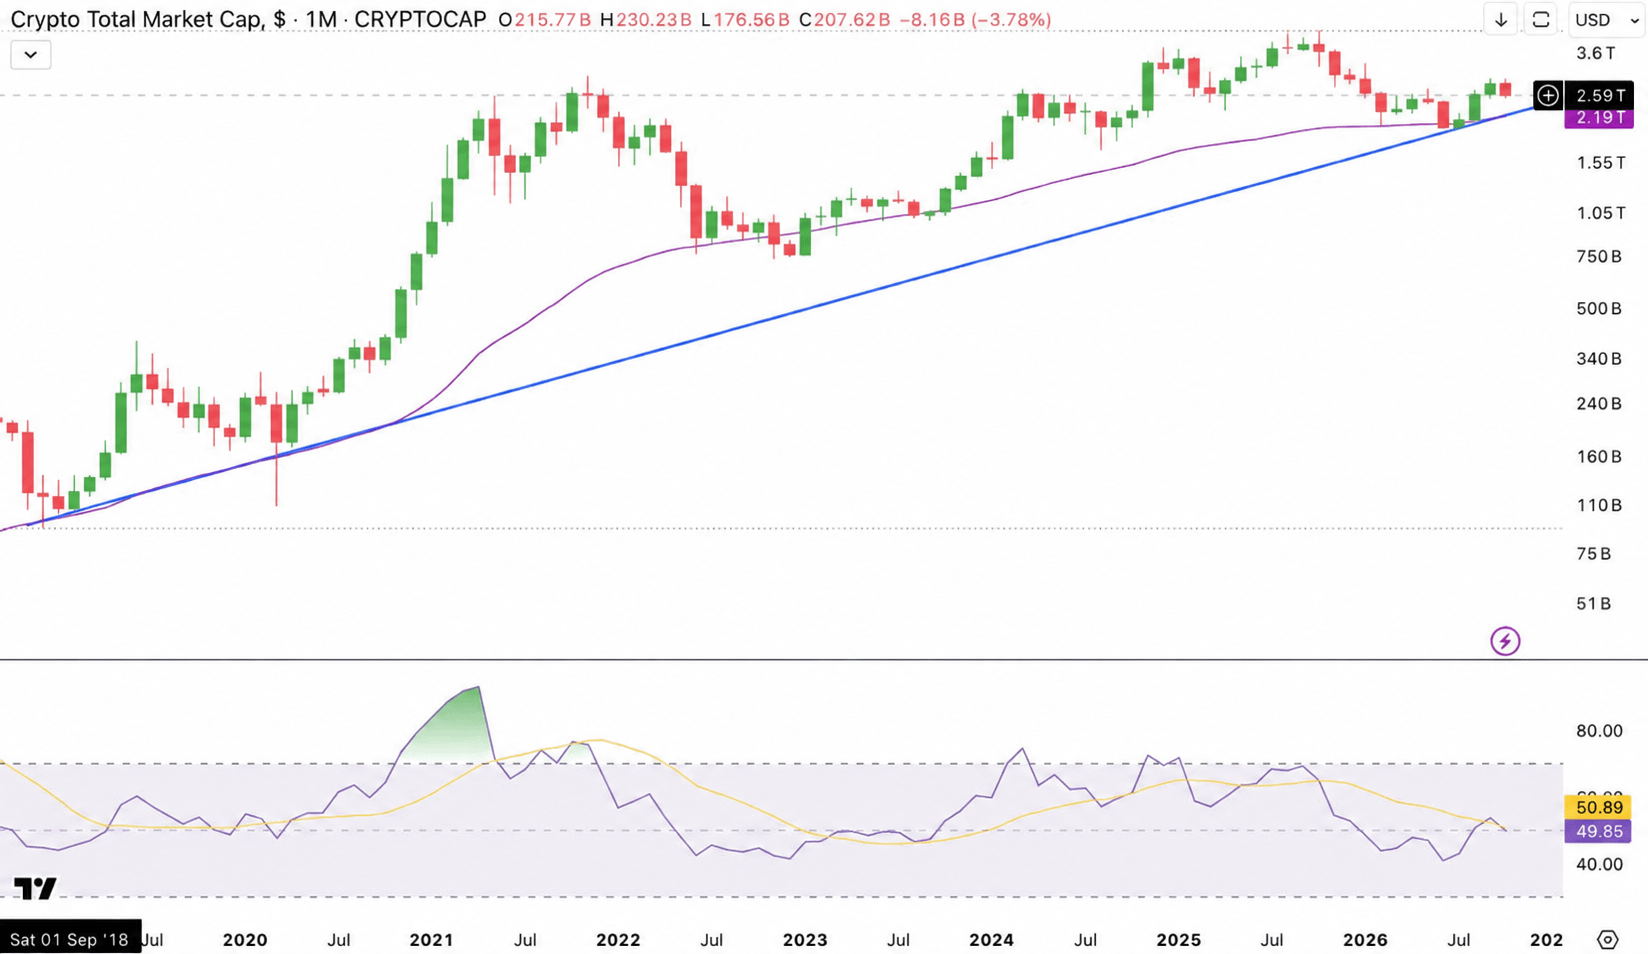
The total cryptocurrency market capitalization in October was $2.59 trillion, marking a decline after the growth seen over the previous two months. The market structure remains stable: the long-term uptrend line that began at the 2018 lows and the 50-day moving average are both near $2.19 trillion. The RSI indicator also ended the month near 50, pointing to neutral momentum at the start of November.
Bullish scenario: holding above $2.19 trillion and returning to $2.80 trillion would open the way to $3.00 trillion and the highs of $3.60 trillion.
Bearish scenario: a break below $2.19 trillion late in the month and a breach of the uptrend line could lead to a decline to $1.55 trillion.
Is October’s decline just a temporary pause in the broader uptrend, or the beginning of a deeper correction?
#Binance
Market Analysis
The total cryptocurrency market capitalization in October was $2.59 trillion, marking a decline after the growth seen over the previous two months. The market structure remains stable: the long-term uptrend line that began at the 2018 lows and the 50-day moving average are both near $2.19 trillion. The RSI indicator also ended the month near 50, pointing to neutral momentum at the start of November.
Bullish scenario: holding above $2.19 trillion and returning to $2.80 trillion would open the way to $3.00 trillion and the highs of $3.60 trillion.
Bearish scenario: a break below $2.19 trillion late in the month and a breach of the uptrend line could lead to a decline to $1.55 trillion.
Is October’s decline just a temporary pause in the broader uptrend, or the beginning of a deeper correction?
#Binance
The total cryptocurrency market capitalization in October was $2.59 trillion, marking a decline after the growth seen over the previous two months. The market structure remains stable: the long-term uptrend line that began at the 2018 lows and the 50-day moving average are both near $2.19 trillion. The RSI indicator also ended the month near 50, pointing to neutral momentum at the start of November.
Bullish scenario: holding above $2.19 trillion and returning to $2.80 trillion would open the way to $3.00 trillion and the highs of $3.60 trillion.
Bearish scenario: a break below $2.19 trillion late in the month and a breach of the uptrend line could lead to a decline to $1.55 trillion.
Is October’s decline just a temporary pause in the broader uptrend, or the beginning of a deeper correction?
#Binance
124
November 2022 vs. November 2026 👀
📉 November 2022:
• Federal Reserve interest rates: 3.75–4%
• FTX collapse
• U.S. midterm elections
• Crypto market lows
🔄 By November 2026:
• Federal Reserve interest rates: 3.75–4%
• Binance hack
• U.S. midterm elections
• The next crypto market low?
A 4-year difference. Almost identical situations. 💀
November 2022 vs. November 2026 👀
📉 November 2022:
• Federal Reserve interest rates: 3.75–4%
• FTX collapse
• U.S. midterm elections
• Crypto market lows
🔄 By November 2026:
• Federal Reserve interest rates: 3.75–4%
• Binance hack
• U.S. midterm elections
• The next crypto market low?
A 4-year difference. Almost identical situations. 💀
📉 November 2022:
• Federal Reserve interest rates: 3.75–4%
• FTX collapse
• U.S. midterm elections
• Crypto market lows
🔄 By November 2026:
• Federal Reserve interest rates: 3.75–4%
• Binance hack
• U.S. midterm elections
• The next crypto market low?
A 4-year difference. Almost identical situations. 💀
98
$BTC $ETH November 2022 vs. November 2026 👀
📉 November 2022:
• Federal Reserve interest rates: 3.75–4%
• FTX collapse
• U.S. midterm elections
• Crypto lows
🔄 By November 2026:
• Federal Reserve interest rates: 3.75–4%
• Binance hack
• U.S. midterm elections
• The next crypto low?
A 4-year difference. An almost identical situation. 💀
$BTC $ETH November 2022 vs. November 2026 👀
📉 November 2022:
• Federal Reserve interest rates: 3.75–4%
• FTX collapse
• U.S. midterm elections
• Crypto lows
🔄 By November 2026:
• Federal Reserve interest rates: 3.75–4%
• Binance hack
• U.S. midterm elections
• The next crypto low?
A 4-year difference. An almost identical situation. 💀
📉 November 2022:
• Federal Reserve interest rates: 3.75–4%
• FTX collapse
• U.S. midterm elections
• Crypto lows
🔄 By November 2026:
• Federal Reserve interest rates: 3.75–4%
• Binance hack
• U.S. midterm elections
• The next crypto low?
A 4-year difference. An almost identical situation. 💀
4
$BTC Price reduction targets (Base case / Worst-case scenario)
• In October, below $80,000 / $70,000
• In November, below $70,000 / $60,000
December: significant rise — “money printing” 🚀
{future}(BTCUSDT)
$BTC Price reduction targets (Base case / Worst-case scenario)
• In October, below $80,000 / $70,000
• In November, below $70,000 / $60,000
December: significant rise — “money printing” 🚀
• In October, below $80,000 / $70,000
• In November, below $70,000 / $60,000
December: significant rise — “money printing” 🚀
188
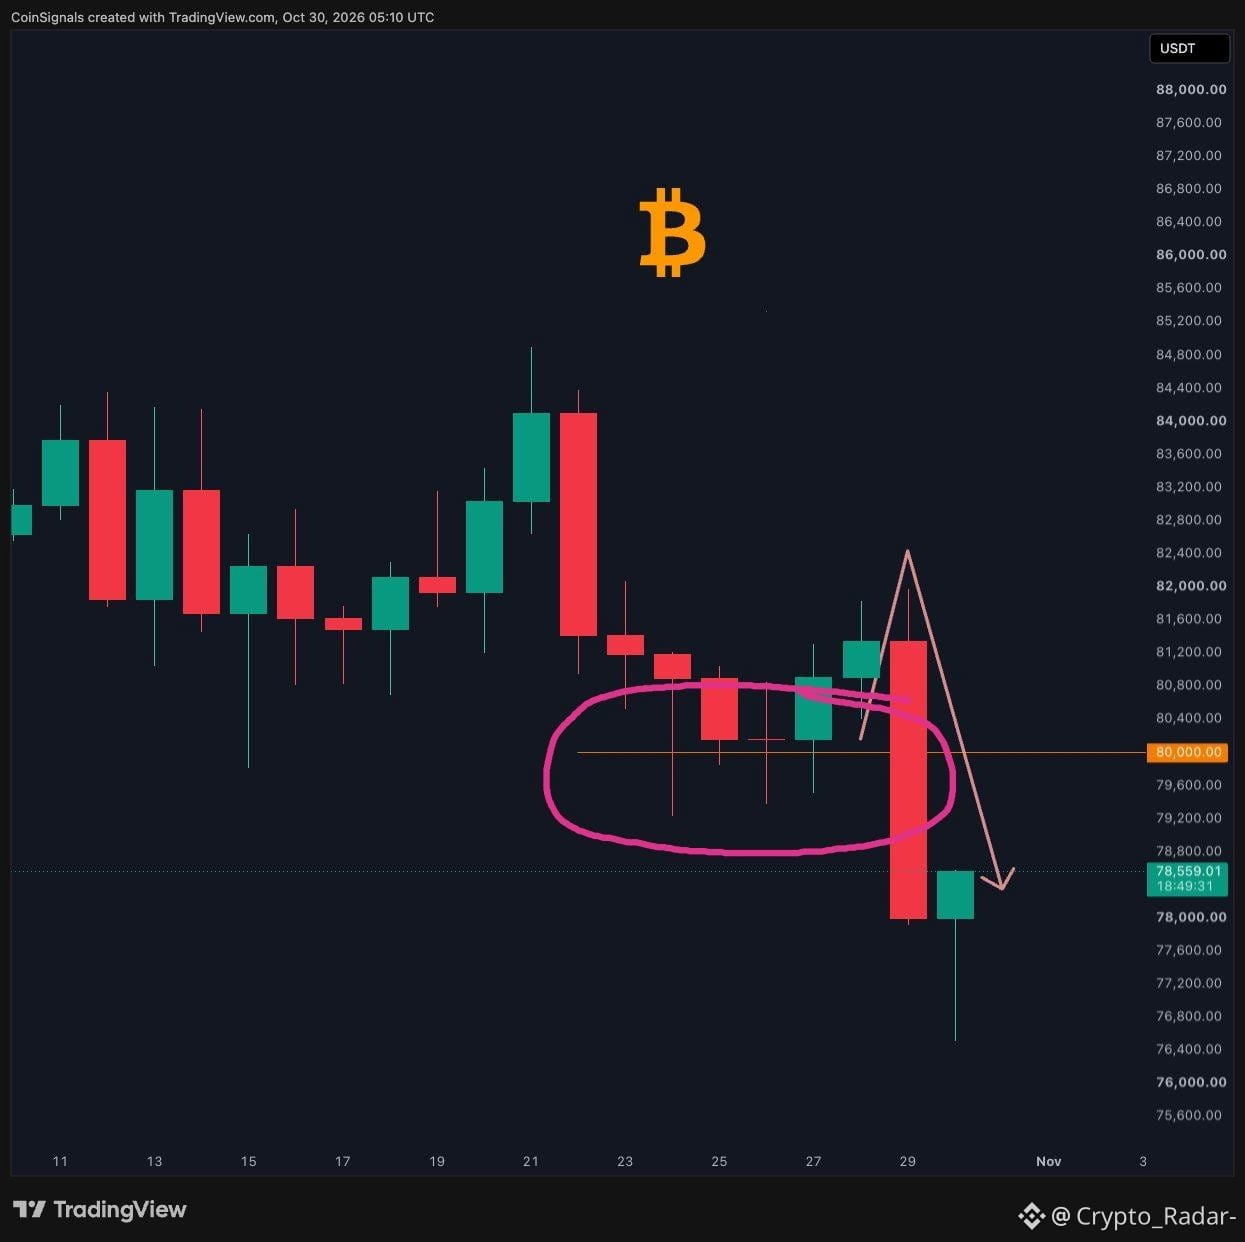
$BTC 82 000 US dollars -> 77 000 US dollars ✅
$BTC 82 000 US dollars -> 77 000 US dollars ✅
Crypto_Radar-
·
--
🚨💰 The price $BTC has fallen below the $80,000 mark four times in the past 4 days.
However, each time the price returned above $80,000, preventing a major sell-off.
We expect another small spike, followed by price manipulation driven by FOMC actions, before the real drop begins.
However, each time the price returned above $80,000, preventing a major sell-off.
We expect another small spike, followed by price manipulation driven by FOMC actions, before the real drop begins.
150
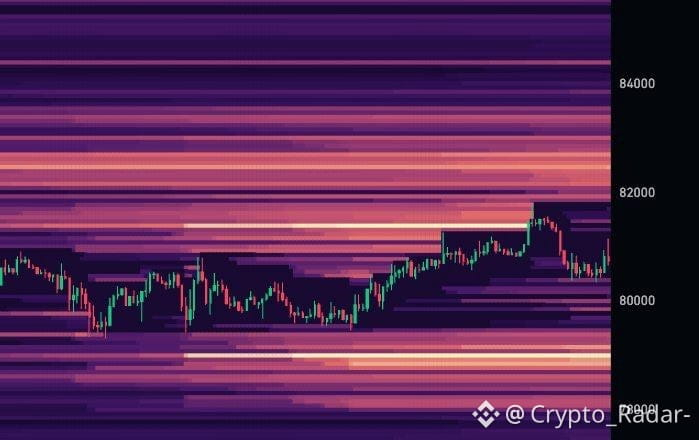
$BTC 💰⚠️ A large volume of sell orders is below the $80,000 mark. It will likely be cleared quickly.
{future}(BTCUSDT)
$BTC 💰⚠️ A large volume of sell orders is below the $80,000 mark. It will likely be cleared quickly.
1.1k
🇺🇸 The Federal Reserve kept interest rates at their current level.$BTC
🇺🇸 The Federal Reserve kept interest rates at their current level.$BTC
78
Log in to explore more content
Join global crypto users on Binance Square
⚡️ Get latest and useful information about crypto.
💬 Trusted by the world’s largest crypto exchange.
👍 Discover real insights from verified creators.
Email / Phone number
Trending Topics
HotCPIDecemberHikePriced
101,456 views
1,184 Discussing
CPI Market Watch | US CPI Rises 0.4% in October, Hotter Than 0.3% Forecast
Binance News
·27 Likes
·41.5k views
AnthropicRejectsIPODelayValuationinQuestion
225,780 views
1,874 Discussing
CanNvidiaEarningsEaseMarketConcerns?
37,993 views
545 Discussing