
交易大师-小刀
1.4k Posts

交易大师-小刀
Report
Block User
跟单请加聊天室,历经两轮币圈牛熊,以合约现货波段交易著称,出手快、狠、准。作为资深交易者,我凭借深厚洞察力和稳健策略,在市场中屡创佳绩。同时,作为KOL,乐于分享,口碑极佳,是众多投资者心中的传奇人物。
5 Following
4.6K+ Followers
2.6K+ Liked
Posts
All
Quotes
Videos
PINNED
·
--
1. Use Binance to scan the QR code and add the contact
2. For those you’ve already added, remember to check your messages in the top-right corner in your day-to-day!
Add @CryptoDPL —then you can know about market trends and opportunities right away!
#美联储纪要显示不支持降息
1. Use Binance to scan the QR code and add the contact
2. For those you’ve already added, remember to check your messages in the top-right corner in your day-to-day!
Add @交易大师-小刀 —then you can know about market trends and opportunities right away!
#美联储纪要显示不支持降息
2. For those you’ve already added, remember to check your messages in the top-right corner in your day-to-day!
Add @交易大师-小刀 —then you can know about market trends and opportunities right away!
#美联储纪要显示不支持降息

314
·
--
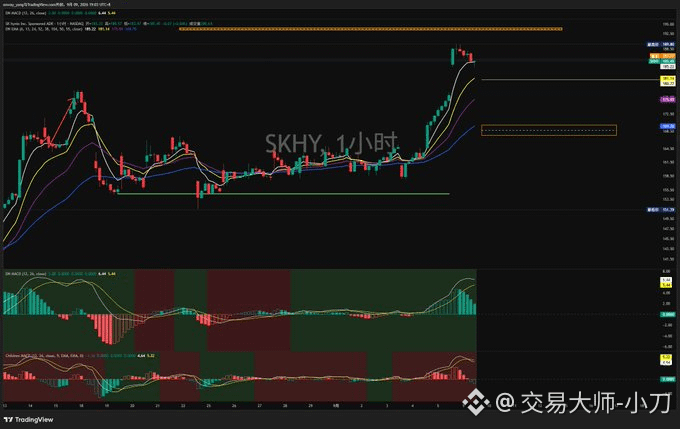
Hynix SKHY Pre-market Analysis
Review of yesterday’s view: The market is in a 4-hour and 1-hour rebound structure. The key focus is whether it can hold the 194 level. Only after it stabilizes there should we decide the next direction.
Last night, U.S. stocks opened and surged, reaching a high of 189, then pulled back. The current pre-market price is 186.
For today to continue strengthening, the key to watch is support at 181. As long as it does not break below, we can continue to look for a rebound to test 194.
Hynix’s market logic is relatively straightforward. If it pulls back again, the key support below is around 170. If 170 is not broken, the rebound outlook remains intact.
#灰度ZcashETF资产突破5亿美元
Hynix SKHY Pre-market Analysis
Review of yesterday’s view: The market is in a 4-hour and 1-hour rebound structure. The key focus is whether it can hold the 194 level. Only after it stabilizes there should we decide the next direction.
Last night, U.S. stocks opened and surged, reaching a high of 189, then pulled back. The current pre-market price is 186.
For today to continue strengthening, the key to watch is support at 181. As long as it does not break below, we can continue to look for a rebound to test 194.
Hynix’s market logic is relatively straightforward. If it pulls back again, the key support below is around 170. If 170 is not broken, the rebound outlook remains intact.
#灰度ZcashETF资产突破5亿美元
Review of yesterday’s view: The market is in a 4-hour and 1-hour rebound structure. The key focus is whether it can hold the 194 level. Only after it stabilizes there should we decide the next direction.
Last night, U.S. stocks opened and surged, reaching a high of 189, then pulled back. The current pre-market price is 186.
For today to continue strengthening, the key to watch is support at 181. As long as it does not break below, we can continue to look for a rebound to test 194.
Hynix’s market logic is relatively straightforward. If it pulls back again, the key support below is around 170. If 170 is not broken, the rebound outlook remains intact.
#灰度ZcashETF资产突破5亿美元
273
·
--
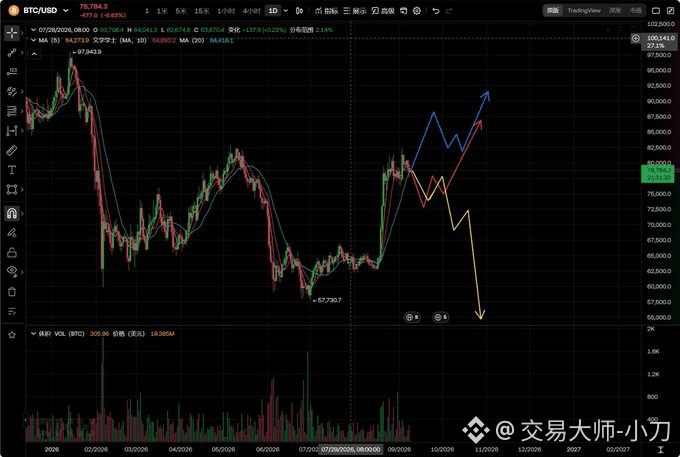
For the current BTC, I’m more inclined to treat it as a range-bound market first.
In the short term, neither the bulls nor the bears have enough strong catalysts, so the price is likely to keep tugging back and forth within the range.
The real directional breakout may have to wait for key events later to land, such as the CPI data and related bills: if the news is better than expected, it could break upward; if the negative factors build momentum, it may continue to look for support to the downside.
Wait first for the market to send a clearer signal, then follow the trend.
Of the three scenarios shown in the chart—the blue line, red line, and yellow line—which one do you like more?
#铜价创历史新高突破每磅6.80美元
For the current BTC, I’m more inclined to treat it as a range-bound market first.
In the short term, neither the bulls nor the bears have enough strong catalysts, so the price is likely to keep tugging back and forth within the range.
The real directional breakout may have to wait for key events later to land, such as the CPI data and related bills: if the news is better than expected, it could break upward; if the negative factors build momentum, it may continue to look for support to the downside.
Wait first for the market to send a clearer signal, then follow the trend.
Of the three scenarios shown in the chart—the blue line, red line, and yellow line—which one do you like more?
#铜价创历史新高突破每磅6.80美元
In the short term, neither the bulls nor the bears have enough strong catalysts, so the price is likely to keep tugging back and forth within the range.
The real directional breakout may have to wait for key events later to land, such as the CPI data and related bills: if the news is better than expected, it could break upward; if the negative factors build momentum, it may continue to look for support to the downside.
Wait first for the market to send a clearer signal, then follow the trend.
Of the three scenarios shown in the chart—the blue line, red line, and yellow line—which one do you like more?
#铜价创历史新高突破每磅6.80美元
289
·
--
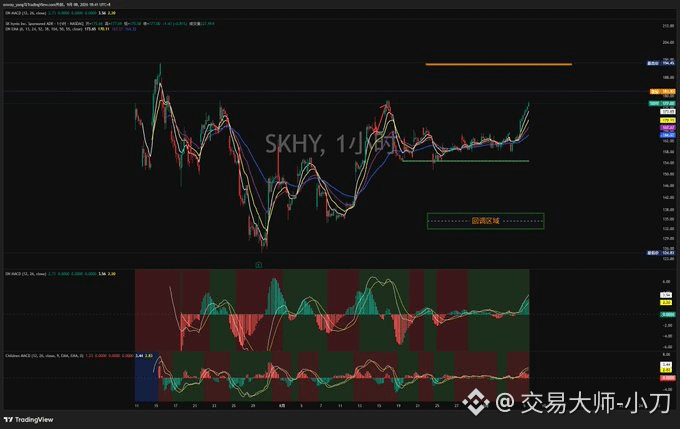
📝SK hynix SKHY pre-market analysis
In the earlier stage, the trend was relatively weak, repeatedly testing the 154 support and nearly breaking down.
Last Friday, boosted by favorable news for the storage sector, HBM demand surged, and it finally broke through the box range upper resistance at 167.
Currently, it is approaching 182 pre-market, fully exiting the long-term consolidation range.
If the market continues to maintain strength, there is potential to challenge the prior high at 194.
The storage sector is turning collectively bullish, and the main storyline is returning.
The chart is showing a rebound structure on the 4-hour and 1-hour timeframes.
Pay close attention after the market opens to the test of the 194 area, and see whether it can hold firmly there—then decide on the next direction. Overall, the bias is mainly bullish for now.
#美伊互袭油轮冲突升级
📝SK hynix SKHY pre-market analysis
In the earlier stage, the trend was relatively weak, repeatedly testing the 154 support and nearly breaking down.
Last Friday, boosted by favorable news for the storage sector, HBM demand surged, and it finally broke through the box range upper resistance at 167.
Currently, it is approaching 182 pre-market, fully exiting the long-term consolidation range.
If the market continues to maintain strength, there is potential to challenge the prior high at 194.
The storage sector is turning collectively bullish, and the main storyline is returning.
The chart is showing a rebound structure on the 4-hour and 1-hour timeframes.
Pay close attention after the market opens to the test of the 194 area, and see whether it can hold firmly there—then decide on the next direction. Overall, the bias is mainly bullish for now.
#美伊互袭油轮冲突升级
In the earlier stage, the trend was relatively weak, repeatedly testing the 154 support and nearly breaking down.
Last Friday, boosted by favorable news for the storage sector, HBM demand surged, and it finally broke through the box range upper resistance at 167.
Currently, it is approaching 182 pre-market, fully exiting the long-term consolidation range.
If the market continues to maintain strength, there is potential to challenge the prior high at 194.
The storage sector is turning collectively bullish, and the main storyline is returning.
The chart is showing a rebound structure on the 4-hour and 1-hour timeframes.
Pay close attention after the market opens to the test of the 194 area, and see whether it can hold firmly there—then decide on the next direction. Overall, the bias is mainly bullish for now.
#美伊互袭油轮冲突升级
252
·
--
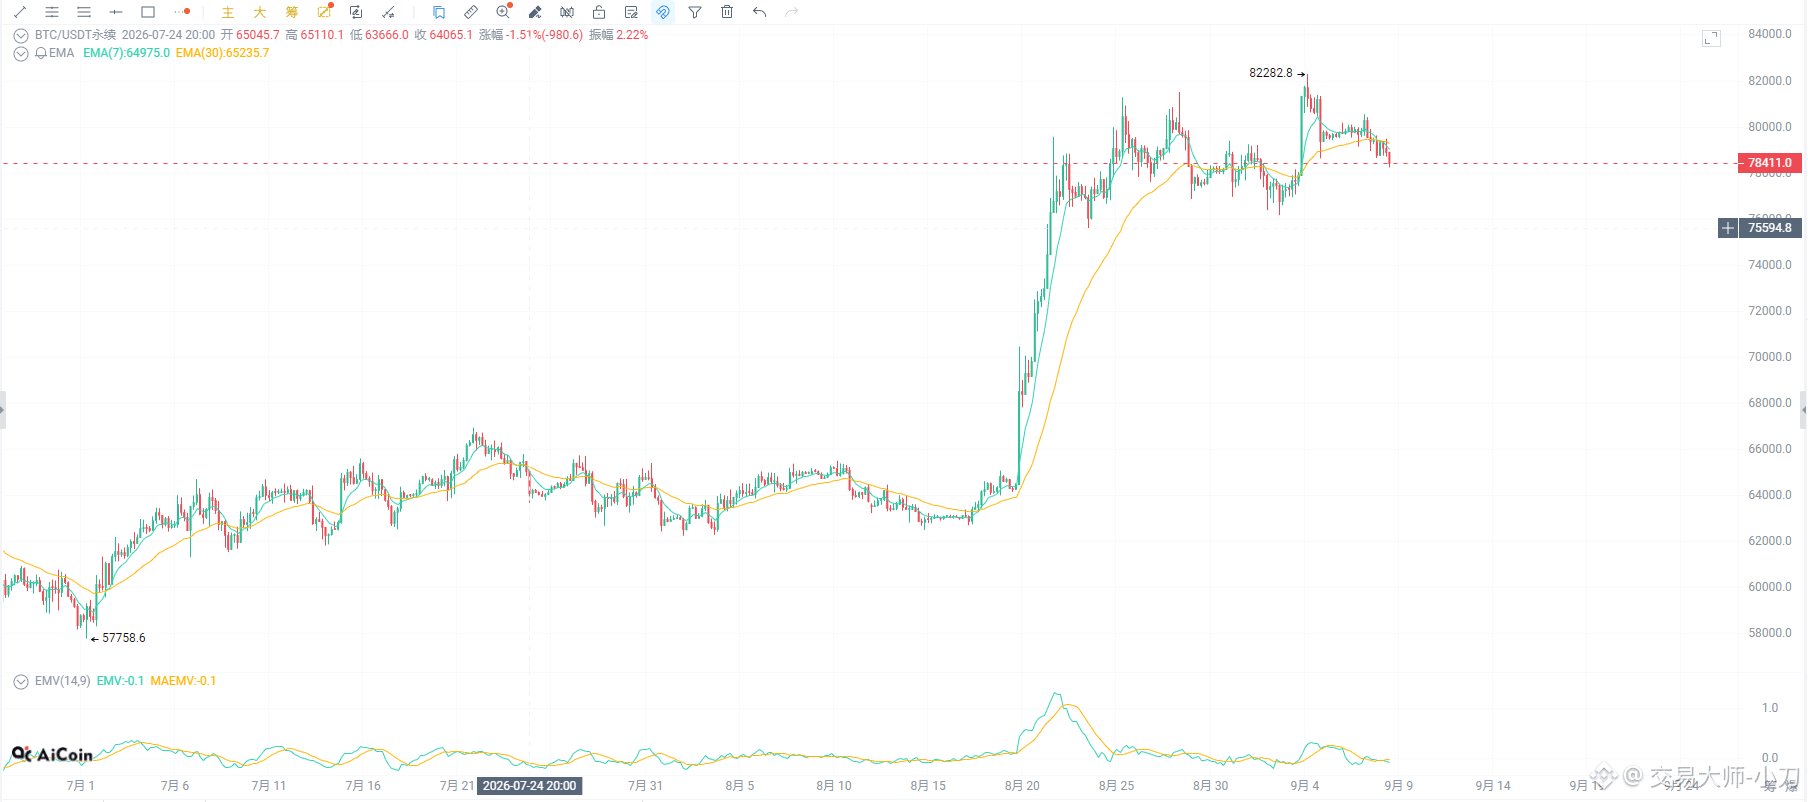
BTC has recently fallen from around $82,000 to $78.8k, but short-term holders have not yet entered a collective loss state.
CryptoQuant’s STH-SOPR shows that during the quick rebound in late August, the indicator rose to above 1.04 at one point, suggesting that chips held for between 1 hour and 155 days realized clear profits when they moved.
After that, the price dropped again, and the STH-SOPR fell rapidly as well. Currently, the daily line is about 1.004, and the 7-day moving average is around 1.007, but both remain above the breakeven line of 1.
It’s important to note that STH-SOPR measures the profit/loss status when these coins are spent or transferred, and it does not necessarily mean these BTC are definitely being sold to exchanges. However, when the indicator pulls back from a high level, it at least suggests that the profits that recent holders can realize are declining, and the market’s ability to withstand further downside is weakening.
The key next is still this line: 1.
If STH-SOPR briefly falls below 1 and quickly recovers, it means the market can still absorb short-term holders’ losing coins, and the current pullback is closer to a cost-resetting move. If the indicator stays below 1 while BTC’s rebound lacks momentum, then it would mean recent buyers are beginning to exit in a continuous loss, and the adjustment would shift from profit-taking to short-term holder capitulation.
At present, on-chain conditions are somewhat neutral: profit realization has clearly cooled, but real panic has not appeared.
#加拿大拟对美商品加征15%至50%关税
BTC has recently fallen from around $82,000 to $78.8k, but short-term holders have not yet entered a collective loss state.
CryptoQuant’s STH-SOPR shows that during the quick rebound in late August, the indicator rose to above 1.04 at one point, suggesting that chips held for between 1 hour and 155 days realized clear profits when they moved.
After that, the price dropped again, and the STH-SOPR fell rapidly as well. Currently, the daily line is about 1.004, and the 7-day moving average is around 1.007, but both remain above the breakeven line of 1.
It’s important to note that STH-SOPR measures the profit/loss status when these coins are spent or transferred, and it does not necessarily mean these BTC are definitely being sold to exchanges. However, when the indicator pulls back from a high level, it at least suggests that the profits that recent holders can realize are declining, and the market’s ability to withstand further downside is weakening.
The key next is still this line: 1.
If STH-SOPR briefly falls below 1 and quickly recovers, it means the market can still absorb short-term holders’ losing coins, and the current pullback is closer to a cost-resetting move. If the indicator stays below 1 while BTC’s rebound lacks momentum, then it would mean recent buyers are beginning to exit in a continuous loss, and the adjustment would shift from profit-taking to short-term holder capitulation.
At present, on-chain conditions are somewhat neutral: profit realization has clearly cooled, but real panic has not appeared.
#加拿大拟对美商品加征15%至50%关税
CryptoQuant’s STH-SOPR shows that during the quick rebound in late August, the indicator rose to above 1.04 at one point, suggesting that chips held for between 1 hour and 155 days realized clear profits when they moved.
After that, the price dropped again, and the STH-SOPR fell rapidly as well. Currently, the daily line is about 1.004, and the 7-day moving average is around 1.007, but both remain above the breakeven line of 1.
It’s important to note that STH-SOPR measures the profit/loss status when these coins are spent or transferred, and it does not necessarily mean these BTC are definitely being sold to exchanges. However, when the indicator pulls back from a high level, it at least suggests that the profits that recent holders can realize are declining, and the market’s ability to withstand further downside is weakening.
The key next is still this line: 1.
If STH-SOPR briefly falls below 1 and quickly recovers, it means the market can still absorb short-term holders’ losing coins, and the current pullback is closer to a cost-resetting move. If the indicator stays below 1 while BTC’s rebound lacks momentum, then it would mean recent buyers are beginning to exit in a continuous loss, and the adjustment would shift from profit-taking to short-term holder capitulation.
At present, on-chain conditions are somewhat neutral: profit realization has clearly cooled, but real panic has not appeared.
#加拿大拟对美商品加征15%至50%关税
242
·
--
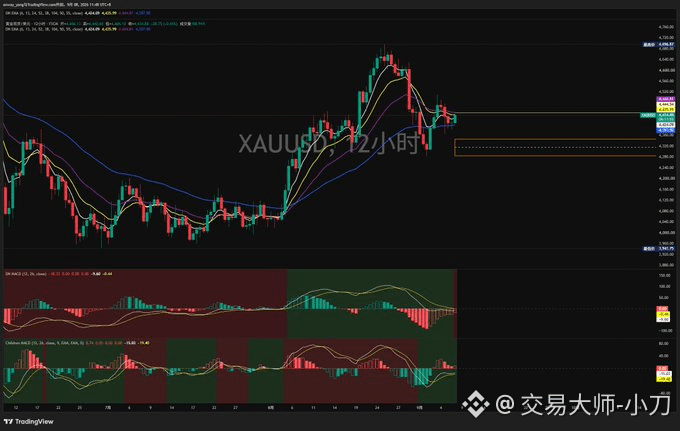
📝 XAU GOLD gold market recap
Yesterday’s view: On the large cycle, within a 12-hour window, there is potential for a rebound. If 4395 is held, look for further upside, with the first target at 4600.
After yesterday’s consolidation, the chart has changed. Price printed a new low at 4379. Fortunately, support at that level is effective, and the current price has returned to 4432.
Today is the key turning-point window.
The EMA24 resistance zone above at 4445 is crucial. Price must hold above this line in order to curb the risk of another decline on the 12-hour timeframe.
If 4445 cannot be reclaimed, the support strength near 4383 will be weakened, and there is a possibility of another dip.
Two possible scenarios going forward:
✅ Hold 4445—then the rebound logic continues.
❌ If it breaks below, it will test the support range at 4324–4285. This area is relatively weaker support—watch how well it is defended.
The battle between bulls and bears is heating up. The focus today is whether price can withstand the pressure and break upward.
#IMF称萨尔瓦多购币未用公共资金
📝 XAU GOLD gold market recap
Yesterday’s view: On the large cycle, within a 12-hour window, there is potential for a rebound. If 4395 is held, look for further upside, with the first target at 4600.
After yesterday’s consolidation, the chart has changed. Price printed a new low at 4379. Fortunately, support at that level is effective, and the current price has returned to 4432.
Today is the key turning-point window.
The EMA24 resistance zone above at 4445 is crucial. Price must hold above this line in order to curb the risk of another decline on the 12-hour timeframe.
If 4445 cannot be reclaimed, the support strength near 4383 will be weakened, and there is a possibility of another dip.
Two possible scenarios going forward:
✅ Hold 4445—then the rebound logic continues.
❌ If it breaks below, it will test the support range at 4324–4285. This area is relatively weaker support—watch how well it is defended.
The battle between bulls and bears is heating up. The focus today is whether price can withstand the pressure and break upward.
#IMF称萨尔瓦多购币未用公共资金
Yesterday’s view: On the large cycle, within a 12-hour window, there is potential for a rebound. If 4395 is held, look for further upside, with the first target at 4600.
After yesterday’s consolidation, the chart has changed. Price printed a new low at 4379. Fortunately, support at that level is effective, and the current price has returned to 4432.
Today is the key turning-point window.
The EMA24 resistance zone above at 4445 is crucial. Price must hold above this line in order to curb the risk of another decline on the 12-hour timeframe.
If 4445 cannot be reclaimed, the support strength near 4383 will be weakened, and there is a possibility of another dip.
Two possible scenarios going forward:
✅ Hold 4445—then the rebound logic continues.
❌ If it breaks below, it will test the support range at 4324–4285. This area is relatively weaker support—watch how well it is defended.
The battle between bulls and bears is heating up. The focus today is whether price can withstand the pressure and break upward.
#IMF称萨尔瓦多购币未用公共资金
392
·
--
Verified
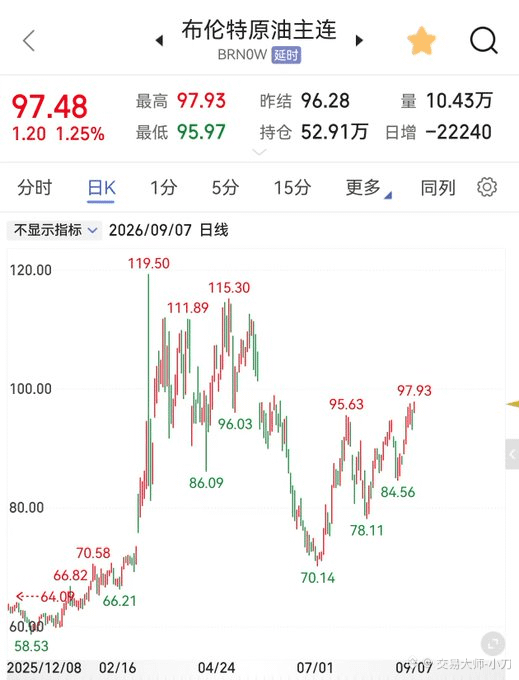
Is oil prices taking the place of the Fed rate hikes?
Brent crude is once again edging back toward $100.
Tensions between the U.S. and Iran are escalating, transport through the Strait of Hormuz is constrained, and OPEC+ has once again paused increasing production—energy inflation is back to being a key market variable.
And then, in the U.S., August nonfarm payrolls added 162,000 jobs—there’s no obvious economic slowdown. Since the economy is still holding up, the Fed has even more reason to keep interest rates at elevated levels. If oil prices keep rising, they will further push inflation expectations up.
In a sense, this is like oil prices tightening the Fed’s financial conditions.
For the market, the trouble is that earnings may not necessarily deteriorate right away, but high interest rates will first compress valuations—technology stocks are especially affected.
Next, I suggest you look at two things: whether oil can hold above $95, and whether this week’s CPI will further reinforce the assessment of persistent inflation stickiness.
Look at whether oil will face greater inflation pressure going forward, and look at whether inflation is actually cooling now, according to CPI.
What do you think—will the Fed raise rates again later?
#IMF称萨尔瓦多购币未用公共资金
Is oil prices taking the place of the Fed rate hikes?
Brent crude is once again edging back toward $100.
Tensions between the U.S. and Iran are escalating, transport through the Strait of Hormuz is constrained, and OPEC+ has once again paused increasing production—energy inflation is back to being a key market variable.
And then, in the U.S., August nonfarm payrolls added 162,000 jobs—there’s no obvious economic slowdown. Since the economy is still holding up, the Fed has even more reason to keep interest rates at elevated levels. If oil prices keep rising, they will further push inflation expectations up.
In a sense, this is like oil prices tightening the Fed’s financial conditions.
For the market, the trouble is that earnings may not necessarily deteriorate right away, but high interest rates will first compress valuations—technology stocks are especially affected.
Next, I suggest you look at two things: whether oil can hold above $95, and whether this week’s CPI will further reinforce the assessment of persistent inflation stickiness.
Look at whether oil will face greater inflation pressure going forward, and look at whether inflation is actually cooling now, according to CPI.
What do you think—will the Fed raise rates again later?
#IMF称萨尔瓦多购币未用公共资金
Brent crude is once again edging back toward $100.
Tensions between the U.S. and Iran are escalating, transport through the Strait of Hormuz is constrained, and OPEC+ has once again paused increasing production—energy inflation is back to being a key market variable.
And then, in the U.S., August nonfarm payrolls added 162,000 jobs—there’s no obvious economic slowdown. Since the economy is still holding up, the Fed has even more reason to keep interest rates at elevated levels. If oil prices keep rising, they will further push inflation expectations up.
In a sense, this is like oil prices tightening the Fed’s financial conditions.
For the market, the trouble is that earnings may not necessarily deteriorate right away, but high interest rates will first compress valuations—technology stocks are especially affected.
Next, I suggest you look at two things: whether oil can hold above $95, and whether this week’s CPI will further reinforce the assessment of persistent inflation stickiness.
Look at whether oil will face greater inflation pressure going forward, and look at whether inflation is actually cooling now, according to CPI.
What do you think—will the Fed raise rates again later?
#IMF称萨尔瓦多购币未用公共资金
1.1k
·
--
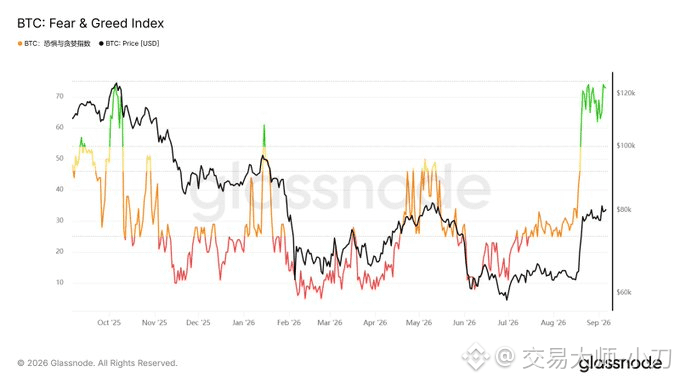
BTC has returned to around $80,000, yet market sentiment has already recovered to the same level of optimism seen last December when it was above $120,000, which makes me cautious about chasing the rally.
Glassnode data shows the Fear and Greed Index has climbed back above 70, approaching last October's highs. In May this year, when BTC was also close to $80,000, the index was mostly still between 30 and 50.
Prices are similar, but expectations for further gains are even stronger.
High sentiment does not mean a top, but if price fails to keep breaking higher, elevated sentiment requires more buying to absorb profit-taking. Once the rise fails to live up to expectations, funds that entered after the rebound are also more likely to waver.
So I am more wary of a pullback after a failed push higher. What matters next is not how optimistic the market is, but whether there is sustained buying support behind that optimism.
#中国八大金融机构注资3600亿元
BTC has returned to around $80,000, yet market sentiment has already recovered to the same level of optimism seen last December when it was above $120,000, which makes me cautious about chasing the rally.
Glassnode data shows the Fear and Greed Index has climbed back above 70, approaching last October's highs. In May this year, when BTC was also close to $80,000, the index was mostly still between 30 and 50.
Prices are similar, but expectations for further gains are even stronger.
High sentiment does not mean a top, but if price fails to keep breaking higher, elevated sentiment requires more buying to absorb profit-taking. Once the rise fails to live up to expectations, funds that entered after the rebound are also more likely to waver.
So I am more wary of a pullback after a failed push higher. What matters next is not how optimistic the market is, but whether there is sustained buying support behind that optimism.
#中国八大金融机构注资3600亿元
Glassnode data shows the Fear and Greed Index has climbed back above 70, approaching last October's highs. In May this year, when BTC was also close to $80,000, the index was mostly still between 30 and 50.
Prices are similar, but expectations for further gains are even stronger.
High sentiment does not mean a top, but if price fails to keep breaking higher, elevated sentiment requires more buying to absorb profit-taking. Once the rise fails to live up to expectations, funds that entered after the rebound are also more likely to waver.
So I am more wary of a pullback after a failed push higher. What matters next is not how optimistic the market is, but whether there is sustained buying support behind that optimism.
#中国八大金融机构注资3600亿元
391
·
--
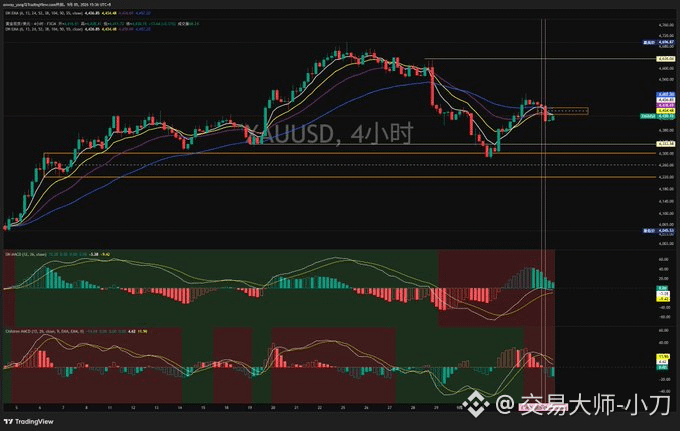
GOLD Gold Market Analysis
Affected by the stronger-than-expected non-farm payroll revision data, gold was hit hard from around 4464, dropping to a low of 4366
Compared with Bitcoin, gold showed stronger resilience, quickly completed a bottom test and rebound, and closed back at 4430, returning to our resistance zone
However, risks still cannot be ignored. The key one-hour support has already been broken, and downward pressure on the 4-hour timeframe remains. A further pullback is still possible
Next, focus on the 4333 support zone
If a retest of this level holds, you can try a small long position
#美国8月新增就业16.2万近预期三倍
GOLD Gold Market Analysis
Affected by the stronger-than-expected non-farm payroll revision data, gold was hit hard from around 4464, dropping to a low of 4366
Compared with Bitcoin, gold showed stronger resilience, quickly completed a bottom test and rebound, and closed back at 4430, returning to our resistance zone
However, risks still cannot be ignored. The key one-hour support has already been broken, and downward pressure on the 4-hour timeframe remains. A further pullback is still possible
Next, focus on the 4333 support zone
If a retest of this level holds, you can try a small long position
#美国8月新增就业16.2万近预期三倍
Affected by the stronger-than-expected non-farm payroll revision data, gold was hit hard from around 4464, dropping to a low of 4366
Compared with Bitcoin, gold showed stronger resilience, quickly completed a bottom test and rebound, and closed back at 4430, returning to our resistance zone
However, risks still cannot be ignored. The key one-hour support has already been broken, and downward pressure on the 4-hour timeframe remains. A further pullback is still possible
Next, focus on the 4333 support zone
If a retest of this level holds, you can try a small long position
#美国8月新增就业16.2万近预期三倍
358
·
--
Verified
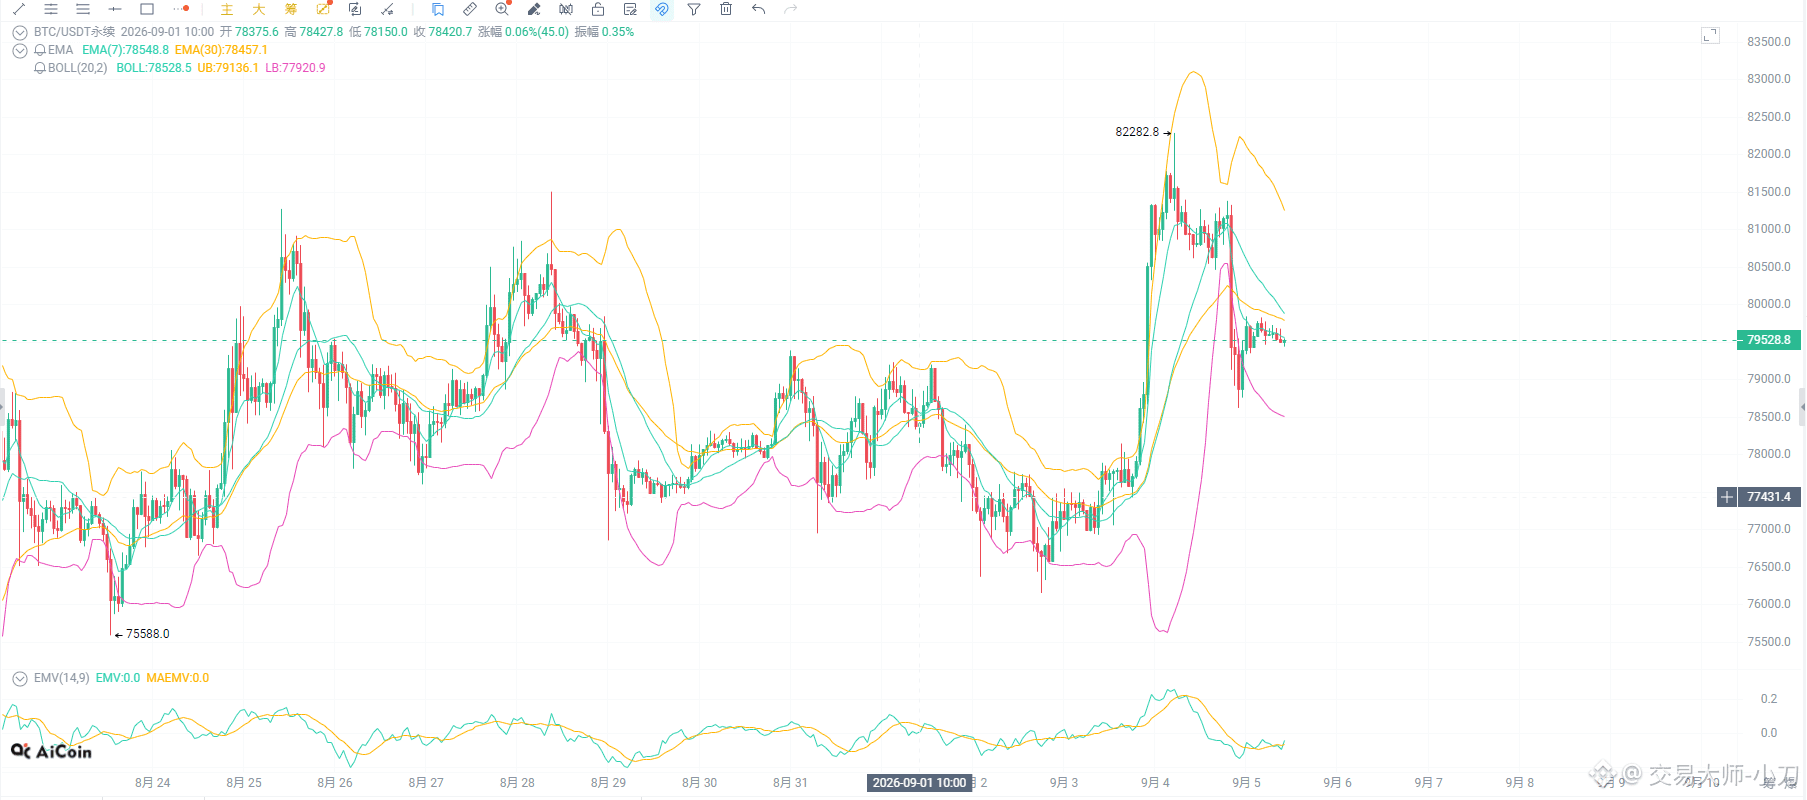
After the nonfarm payrolls data came out last night, BTC was pushed down again by macro factors.
August nonfarm payrolls increased by 162,000, well above expectations, and the unemployment rate stayed at 4.1%.
The stronger the job market, the more confidence the Fed has to stay hawkish, and the probability of a September rate hike has also climbed back to around 60%.
So what BTC is really waiting for now is no longer nonfarm payrolls, but next week’s CPI.
If inflation comes in above expectations again, the macro pressure in September may not be over yet.
Let’s see how the market digests this over the weekend.
#比特币ETF创1月以来最大单日流入
After the nonfarm payrolls data came out last night, BTC was pushed down again by macro factors.
August nonfarm payrolls increased by 162,000, well above expectations, and the unemployment rate stayed at 4.1%.
The stronger the job market, the more confidence the Fed has to stay hawkish, and the probability of a September rate hike has also climbed back to around 60%.
So what BTC is really waiting for now is no longer nonfarm payrolls, but next week’s CPI.
If inflation comes in above expectations again, the macro pressure in September may not be over yet.
Let’s see how the market digests this over the weekend.
#比特币ETF创1月以来最大单日流入
August nonfarm payrolls increased by 162,000, well above expectations, and the unemployment rate stayed at 4.1%.
The stronger the job market, the more confidence the Fed has to stay hawkish, and the probability of a September rate hike has also climbed back to around 60%.
So what BTC is really waiting for now is no longer nonfarm payrolls, but next week’s CPI.
If inflation comes in above expectations again, the macro pressure in September may not be over yet.
Let’s see how the market digests this over the weekend.
#比特币ETF创1月以来最大单日流入
1.1k
·
--
SK Hynix SKHY pre-market analysis
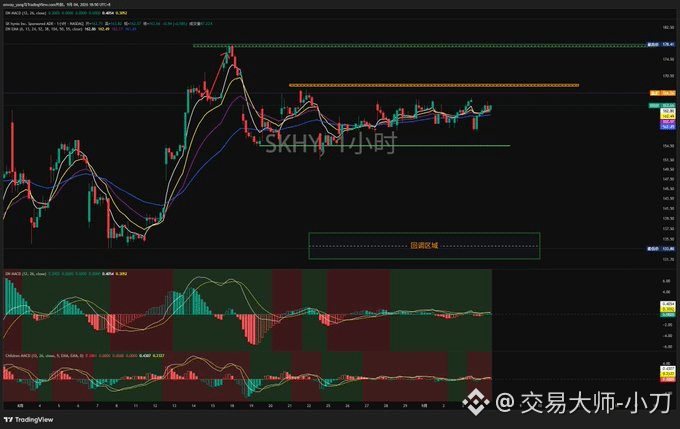
Yesterday’s view: The upward volume was insufficient, and the price repeatedly fluctuated around 165, never managing to break through the 168 resistance zone
Today’s pre-market price has moved to 166.7, with a slight increase. The key is to watch whether it can break through 168
The overall trend has been weak recently. Even if it breaks upward, it is still necessary to confirm whether it can hold above the level effectively, and to guard against a drop back into the range after the breakout
Today’s key support level below is 161, which serves as an important defensive level for the market
#希音港股上市后跌17.5%
SK Hynix SKHY pre-market analysis
Yesterday’s view: The upward volume was insufficient, and the price repeatedly fluctuated around 165, never managing to break through the 168 resistance zone
Today’s pre-market price has moved to 166.7, with a slight increase. The key is to watch whether it can break through 168
The overall trend has been weak recently. Even if it breaks upward, it is still necessary to confirm whether it can hold above the level effectively, and to guard against a drop back into the range after the breakout
Today’s key support level below is 161, which serves as an important defensive level for the market
#希音港股上市后跌17.5%
Yesterday’s view: The upward volume was insufficient, and the price repeatedly fluctuated around 165, never managing to break through the 168 resistance zone
Today’s pre-market price has moved to 166.7, with a slight increase. The key is to watch whether it can break through 168
The overall trend has been weak recently. Even if it breaks upward, it is still necessary to confirm whether it can hold above the level effectively, and to guard against a drop back into the range after the breakout
Today’s key support level below is 161, which serves as an important defensive level for the market
#希音港股上市后跌17.5%
1
2.6k
·
--
Verified
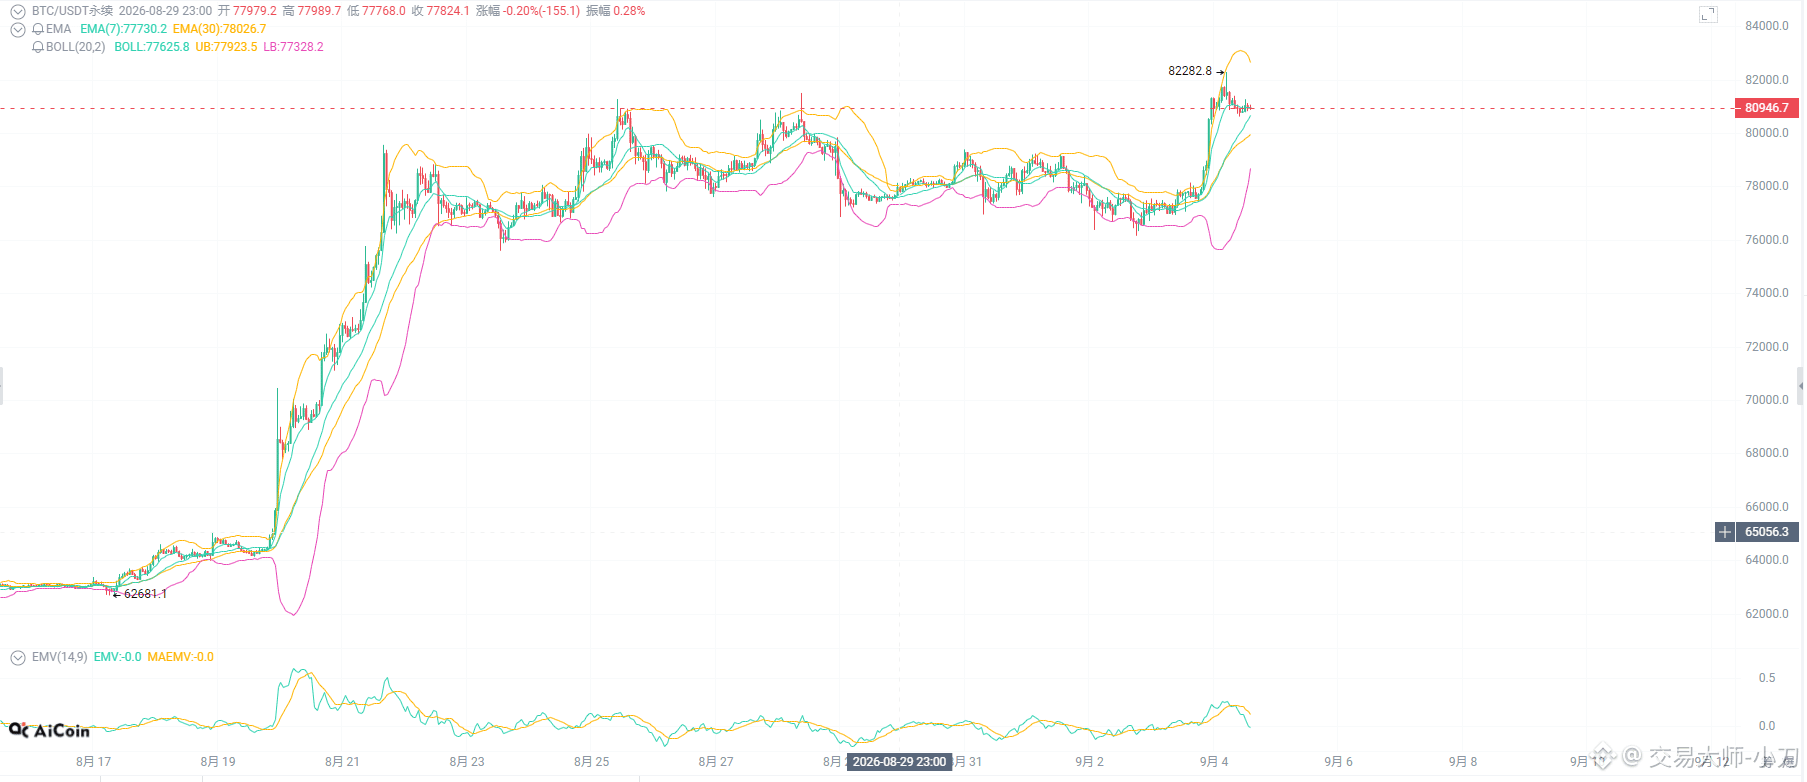
Tonight’s Non-Farm Payrolls may determine whether BTC’s move above $80,000 is a real breakout—or just another false move.
Market expectations for the U.S. August Non-Farm Payrolls are about +560,000 jobs, an improvement from July’s figure, which is down by about 230,000. BTC is currently around $81,000. Yesterday’s rebound largely benefited from falling U.S. Treasury yields and a cooling of rate-hike expectations.
So tonight, you can’t focus only on the number of new jobs.
If the data comes in clearly stronger than expected, U.S. Treasury yields and rate-hike expectations may rise again, and BTC’s $80,000 level will face renewed pressure.
If the data is mildly weak and yields continue to decline, BTC may finally have a chance to turn $80,000 into a real support level.
However, if unemployment jobs are far worse than expected, the market could shift from pricing in easier policy to worrying about an economic recession—also not good news for risk assets.
For BTC, the most comfortable outcome is not that Non-Farm Payrolls collapse, but that labor-market conditions cool while the economy does not sharply slow.
The data will be released at 20:30 Beijing time tonight. First, let’s see if $80,000 can hold—then we can talk about higher levels.#美国10年期国债收益率创2023年11月新高
Tonight’s Non-Farm Payrolls may determine whether BTC’s move above $80,000 is a real breakout—or just another false move.
Market expectations for the U.S. August Non-Farm Payrolls are about +560,000 jobs, an improvement from July’s figure, which is down by about 230,000. BTC is currently around $81,000. Yesterday’s rebound largely benefited from falling U.S. Treasury yields and a cooling of rate-hike expectations.
So tonight, you can’t focus only on the number of new jobs.
If the data comes in clearly stronger than expected, U.S. Treasury yields and rate-hike expectations may rise again, and BTC’s $80,000 level will face renewed pressure.
If the data is mildly weak and yields continue to decline, BTC may finally have a chance to turn $80,000 into a real support level.
However, if unemployment jobs are far worse than expected, the market could shift from pricing in easier policy to worrying about an economic recession—also not good news for risk assets.
For BTC, the most comfortable outcome is not that Non-Farm Payrolls collapse, but that labor-market conditions cool while the economy does not sharply slow.
The data will be released at 20:30 Beijing time tonight. First, let’s see if $80,000 can hold—then we can talk about higher levels.#美国10年期国债收益率创2023年11月新高
Market expectations for the U.S. August Non-Farm Payrolls are about +560,000 jobs, an improvement from July’s figure, which is down by about 230,000. BTC is currently around $81,000. Yesterday’s rebound largely benefited from falling U.S. Treasury yields and a cooling of rate-hike expectations.
So tonight, you can’t focus only on the number of new jobs.
If the data comes in clearly stronger than expected, U.S. Treasury yields and rate-hike expectations may rise again, and BTC’s $80,000 level will face renewed pressure.
If the data is mildly weak and yields continue to decline, BTC may finally have a chance to turn $80,000 into a real support level.
However, if unemployment jobs are far worse than expected, the market could shift from pricing in easier policy to worrying about an economic recession—also not good news for risk assets.
For BTC, the most comfortable outcome is not that Non-Farm Payrolls collapse, but that labor-market conditions cool while the economy does not sharply slow.
The data will be released at 20:30 Beijing time tonight. First, let’s see if $80,000 can hold—then we can talk about higher levels.#美国10年期国债收益率创2023年11月新高
810
·
--
Hynix SKHY pre-market analysis
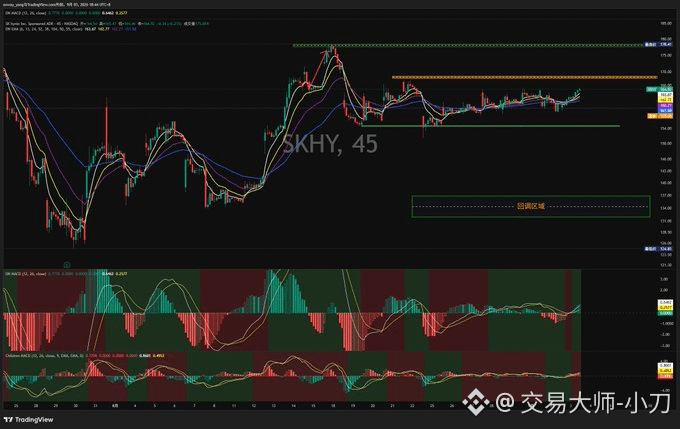
Yesterday's pre-market: 158; today's pre-market is still 158
It keeps hovering around the high point near 165, unable to break upward for a long time
The previous high at 168 is a key barrier; if it can’t hold above it effectively, there will still be downside pressure afterward
The 4- and 5-minute charts broke below last night, and then “revived,” but the volume and intensity are insufficient, and the pre-market price level is relatively low
The recent trend has been quite frustrating; wait for direction to be chosen. If it retraces, the target area is around 133
I’m Xiao Dao, a trader focused on candlestick chart analysis. I’m good at picking up signals from the order flow. If you’re interested, feel free to chat with me.
#美国10年期美债收益率触及2023年11月来最高
Hynix SKHY pre-market analysis
Yesterday's pre-market: 158; today's pre-market is still 158
It keeps hovering around the high point near 165, unable to break upward for a long time
The previous high at 168 is a key barrier; if it can’t hold above it effectively, there will still be downside pressure afterward
The 4- and 5-minute charts broke below last night, and then “revived,” but the volume and intensity are insufficient, and the pre-market price level is relatively low
The recent trend has been quite frustrating; wait for direction to be chosen. If it retraces, the target area is around 133
I’m Xiao Dao, a trader focused on candlestick chart analysis. I’m good at picking up signals from the order flow. If you’re interested, feel free to chat with me.
#美国10年期美债收益率触及2023年11月来最高
Yesterday's pre-market: 158; today's pre-market is still 158
It keeps hovering around the high point near 165, unable to break upward for a long time
The previous high at 168 is a key barrier; if it can’t hold above it effectively, there will still be downside pressure afterward
The 4- and 5-minute charts broke below last night, and then “revived,” but the volume and intensity are insufficient, and the pre-market price level is relatively low
The recent trend has been quite frustrating; wait for direction to be chosen. If it retraces, the target area is around 133
I’m Xiao Dao, a trader focused on candlestick chart analysis. I’m good at picking up signals from the order flow. If you’re interested, feel free to chat with me.
#美国10年期美债收益率触及2023年11月来最高
533
·
--
Verified
🔥Why I think I can gradually build a position in ONDO?
My personal view: In the next cycle, ONDO will be a very high-quality asset in the RWA track. You can accumulate gradually by buying on dips.
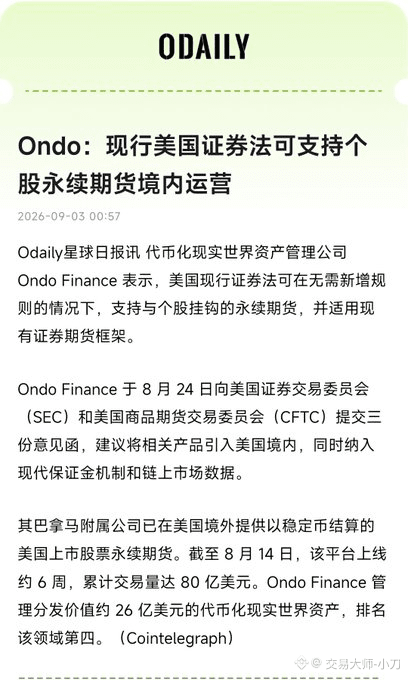
The core logic comes from the latest regulatory developments: Ondo Finance has submitted a comment letter to the SEC and CFTC. It argues that by relying on the existing U.S. securities laws, no new legislation is needed to bring perpetual stock futures into the U.S. market and directly place them under the current securities and futures regulatory framework.
The overseas version of the product has already been validated by the market. It launched only six weeks ago, and trading volume reached $8.0 billion. The real-world tokenized asset management scale is $2.6 billion, ranking fourth in the RWA sector.
RWA tokenization combined with synthetic derivatives for U.S. stocks is moving forward rapidly toward compliance.
We haven’t entered a full-blown bull market yet. Build your position gradually on dips and wait for the narrative-driven benefits of the next cycle to play out #沙特称伊朗在霍尔木兹袭击其船只
🔥Why I think I can gradually build a position in ONDO?
My personal view: In the next cycle, ONDO will be a very high-quality asset in the RWA track. You can accumulate gradually by buying on dips.
The core logic comes from the latest regulatory developments: Ondo Finance has submitted a comment letter to the SEC and CFTC. It argues that by relying on the existing U.S. securities laws, no new legislation is needed to bring perpetual stock futures into the U.S. market and directly place them under the current securities and futures regulatory framework.
The overseas version of the product has already been validated by the market. It launched only six weeks ago, and trading volume reached $8.0 billion. The real-world tokenized asset management scale is $2.6 billion, ranking fourth in the RWA sector.
RWA tokenization combined with synthetic derivatives for U.S. stocks is moving forward rapidly toward compliance.
We haven’t entered a full-blown bull market yet. Build your position gradually on dips and wait for the narrative-driven benefits of the next cycle to play out #沙特称伊朗在霍尔木兹袭击其船只
My personal view: In the next cycle, ONDO will be a very high-quality asset in the RWA track. You can accumulate gradually by buying on dips.
The core logic comes from the latest regulatory developments: Ondo Finance has submitted a comment letter to the SEC and CFTC. It argues that by relying on the existing U.S. securities laws, no new legislation is needed to bring perpetual stock futures into the U.S. market and directly place them under the current securities and futures regulatory framework.
The overseas version of the product has already been validated by the market. It launched only six weeks ago, and trading volume reached $8.0 billion. The real-world tokenized asset management scale is $2.6 billion, ranking fourth in the RWA sector.
RWA tokenization combined with synthetic derivatives for U.S. stocks is moving forward rapidly toward compliance.
We haven’t entered a full-blown bull market yet. Build your position gradually on dips and wait for the narrative-driven benefits of the next cycle to play out #沙特称伊朗在霍尔木兹袭击其船只
3
2
2.1k
·
--
BTC is currently undergoing a relatively concentrated round of macro pressure testing.
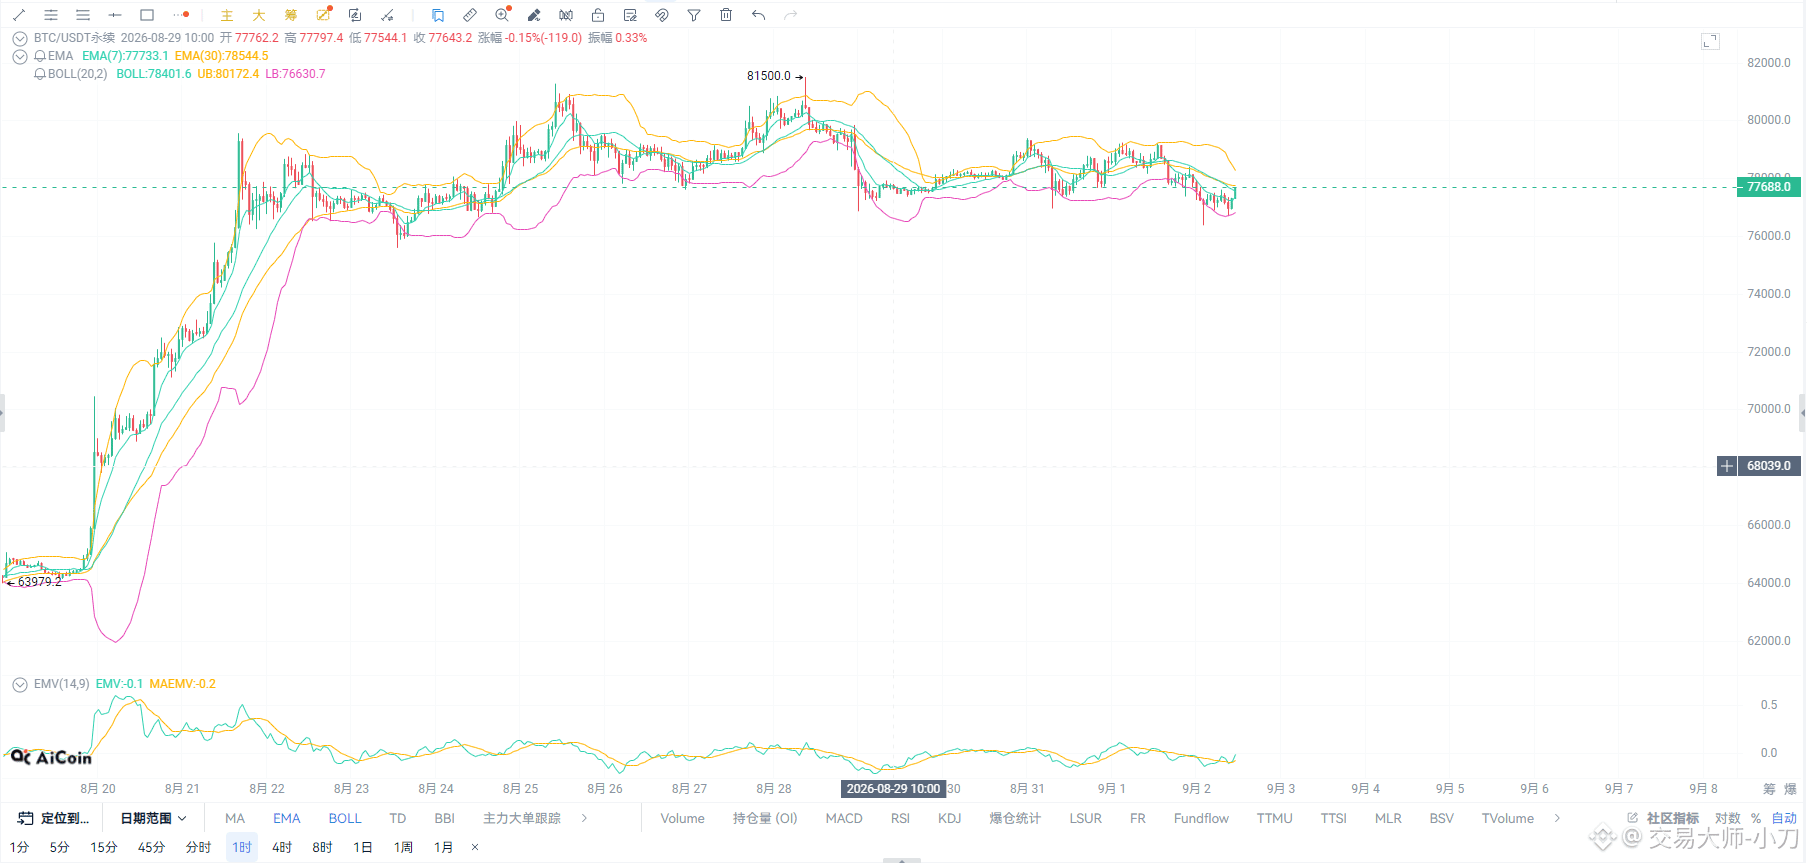
Oil prices are approaching $100, U.S. Treasury yields continue to rise, the U.S. dollar is strengthening, and the probability of a September rate hike has been pushed to above 60%. Almost every factor that is unfavorable to risk assets has converged at once.
However, BTC has only fallen from above $80,000 to around $77,000, and there has not yet been a runaway-style selloff.
So the $75,000–$78,000 range is crucial next.
If BTC can still hold this area despite a relatively strong dollar and U.S. Treasury yields, it would suggest that the funds that entered in August have not easily withdrawn, and that there is still market capacity to absorb selling.
But if it breaks down and then fails to reclaim the level for a long time, you should be cautious that this is not just a short-term macro disruption, but rather that the profit-taking from the rally accumulated in August is beginning to be cashed out in a concentrated way.
There’s no need to rush to guess the top right now—first, we should see how long BTC can hold up under such a macro environment.
#伊朗革命卫队称打击约旦美军陆战队营地
BTC is currently undergoing a relatively concentrated round of macro pressure testing.
Oil prices are approaching $100, U.S. Treasury yields continue to rise, the U.S. dollar is strengthening, and the probability of a September rate hike has been pushed to above 60%. Almost every factor that is unfavorable to risk assets has converged at once.
However, BTC has only fallen from above $80,000 to around $77,000, and there has not yet been a runaway-style selloff.
So the $75,000–$78,000 range is crucial next.
If BTC can still hold this area despite a relatively strong dollar and U.S. Treasury yields, it would suggest that the funds that entered in August have not easily withdrawn, and that there is still market capacity to absorb selling.
But if it breaks down and then fails to reclaim the level for a long time, you should be cautious that this is not just a short-term macro disruption, but rather that the profit-taking from the rally accumulated in August is beginning to be cashed out in a concentrated way.
There’s no need to rush to guess the top right now—first, we should see how long BTC can hold up under such a macro environment.
#伊朗革命卫队称打击约旦美军陆战队营地
Oil prices are approaching $100, U.S. Treasury yields continue to rise, the U.S. dollar is strengthening, and the probability of a September rate hike has been pushed to above 60%. Almost every factor that is unfavorable to risk assets has converged at once.
However, BTC has only fallen from above $80,000 to around $77,000, and there has not yet been a runaway-style selloff.
So the $75,000–$78,000 range is crucial next.
If BTC can still hold this area despite a relatively strong dollar and U.S. Treasury yields, it would suggest that the funds that entered in August have not easily withdrawn, and that there is still market capacity to absorb selling.
But if it breaks down and then fails to reclaim the level for a long time, you should be cautious that this is not just a short-term macro disruption, but rather that the profit-taking from the rally accumulated in August is beginning to be cashed out in a concentrated way.
There’s no need to rush to guess the top right now—first, we should see how long BTC can hold up under such a macro environment.
#伊朗革命卫队称打击约旦美军陆战队营地
467
·
--
SK hynix (SKHY) pre-market analysis
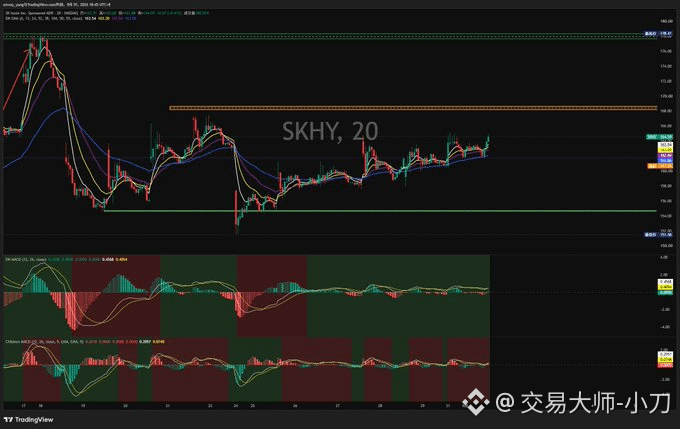
Recap of yesterday’s view: Wait for a 3–4 hour timeframe to choose direction; the first target is the 165–167 zone
Last night, SK hynix surged to 165.33, precisely reaching the target zone we indicated
This rebound uptrend is still continuing. Today, focus on the rebound strength and whether it can break through the 165 resistance. If it successfully breaks above, the upside target is the 168–170 zone
⚠️Key reminder:
Once price reaches around 168, be highly alert to the risk of a pullback—there may be a relatively strong drop here
If you hold positions at this level, make sure to adjust your position sizing and do not get overly attached—don’t fight the move
#黄金较三个月高点下跌5.5%
SK hynix (SKHY) pre-market analysis
Recap of yesterday’s view: Wait for a 3–4 hour timeframe to choose direction; the first target is the 165–167 zone
Last night, SK hynix surged to 165.33, precisely reaching the target zone we indicated
This rebound uptrend is still continuing. Today, focus on the rebound strength and whether it can break through the 165 resistance. If it successfully breaks above, the upside target is the 168–170 zone
⚠️Key reminder:
Once price reaches around 168, be highly alert to the risk of a pullback—there may be a relatively strong drop here
If you hold positions at this level, make sure to adjust your position sizing and do not get overly attached—don’t fight the move
#黄金较三个月高点下跌5.5%
Recap of yesterday’s view: Wait for a 3–4 hour timeframe to choose direction; the first target is the 165–167 zone
Last night, SK hynix surged to 165.33, precisely reaching the target zone we indicated
This rebound uptrend is still continuing. Today, focus on the rebound strength and whether it can break through the 165 resistance. If it successfully breaks above, the upside target is the 168–170 zone
⚠️Key reminder:
Once price reaches around 168, be highly alert to the risk of a pullback—there may be a relatively strong drop here
If you hold positions at this level, make sure to adjust your position sizing and do not get overly attached—don’t fight the move
#黄金较三个月高点下跌5.5%
582
·
--
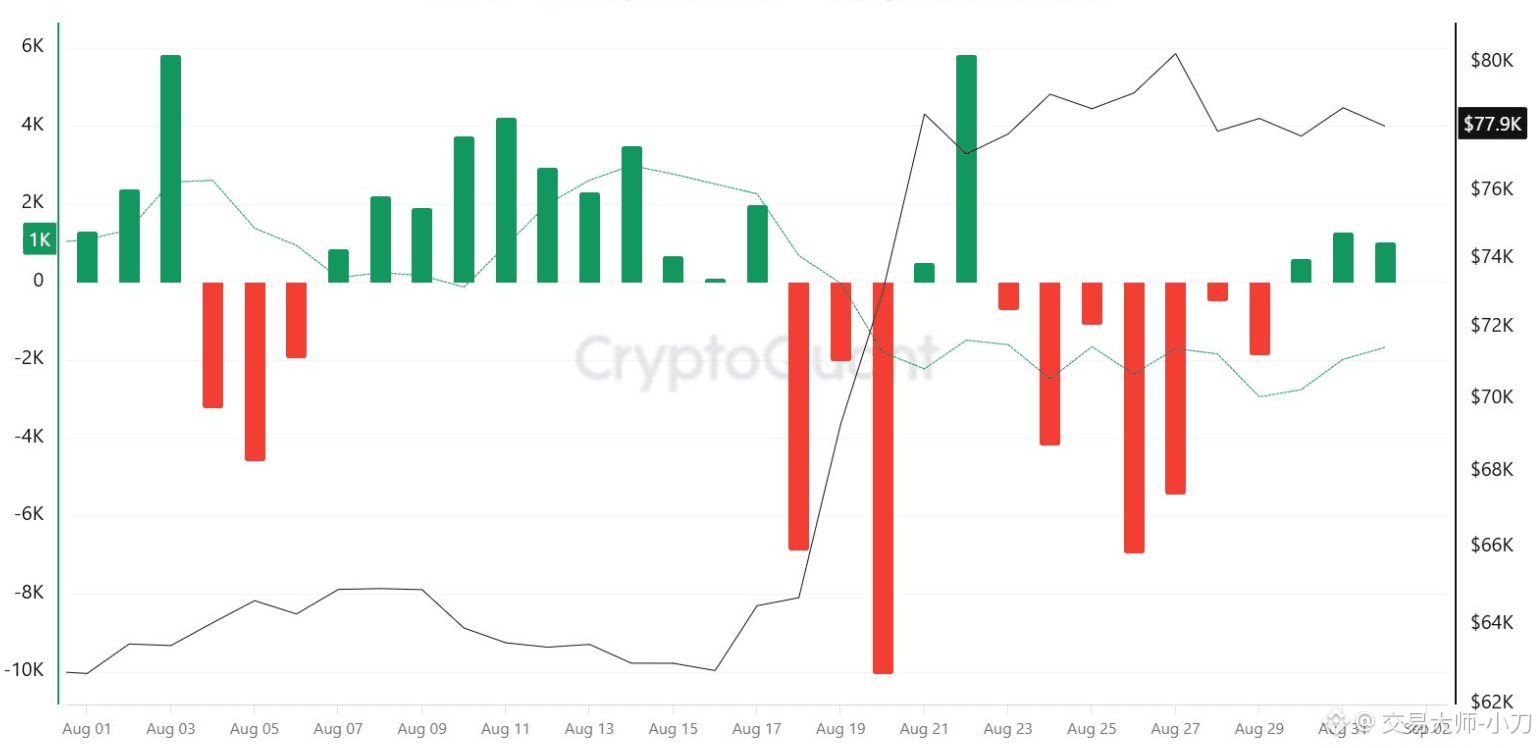
BTC is currently at $77,966, and over the past three reporting days, the exchange net flow has turned positive for consecutive days.
This means that the amount of BTC entering exchanges has begun to exceed the amount being withdrawn, so the potential supply of sellable holdings in the short term may be increasing. However, the magnitude of the recent net inflows is not extreme, and the 7-day average is still negative—overall, the past week has remained in net outflows.
So for now, this looks more like a shift at the margin in capital flows, and it’s not enough to directly conclude that large holders are concentrating their selling. The BTC transferred into exchanges could also be used for market making, custody adjustments, or adding margin, and it doesn’t necessarily enter the spot market.
Next, two signals matter: whether the exchange net inflow continues to expand, and whether BTC can absorb these newly added coins when it approaches $80,000.
If net inflows keep rising while the price repeatedly fails to break above $80,000, that would be stronger evidence that selling pressure from above is building. If net inflows end quickly and the price continues to hold steady in the current range, it’s more likely that this is just normal post-rally capital reallocation.
While this data alone can’t directly support a bearish view, it’s time to start paying attention to these potential sell-pressure signals.
BTC is currently at $77,966, and over the past three reporting days, the exchange net flow has turned positive for consecutive days.
This means that the amount of BTC entering exchanges has begun to exceed the amount being withdrawn, so the potential supply of sellable holdings in the short term may be increasing. However, the magnitude of the recent net inflows is not extreme, and the 7-day average is still negative—overall, the past week has remained in net outflows.
So for now, this looks more like a shift at the margin in capital flows, and it’s not enough to directly conclude that large holders are concentrating their selling. The BTC transferred into exchanges could also be used for market making, custody adjustments, or adding margin, and it doesn’t necessarily enter the spot market.
Next, two signals matter: whether the exchange net inflow continues to expand, and whether BTC can absorb these newly added coins when it approaches $80,000.
If net inflows keep rising while the price repeatedly fails to break above $80,000, that would be stronger evidence that selling pressure from above is building. If net inflows end quickly and the price continues to hold steady in the current range, it’s more likely that this is just normal post-rally capital reallocation.
While this data alone can’t directly support a bearish view, it’s time to start paying attention to these potential sell-pressure signals.
This means that the amount of BTC entering exchanges has begun to exceed the amount being withdrawn, so the potential supply of sellable holdings in the short term may be increasing. However, the magnitude of the recent net inflows is not extreme, and the 7-day average is still negative—overall, the past week has remained in net outflows.
So for now, this looks more like a shift at the margin in capital flows, and it’s not enough to directly conclude that large holders are concentrating their selling. The BTC transferred into exchanges could also be used for market making, custody adjustments, or adding margin, and it doesn’t necessarily enter the spot market.
Next, two signals matter: whether the exchange net inflow continues to expand, and whether BTC can absorb these newly added coins when it approaches $80,000.
If net inflows keep rising while the price repeatedly fails to break above $80,000, that would be stronger evidence that selling pressure from above is building. If net inflows end quickly and the price continues to hold steady in the current range, it’s more likely that this is just normal post-rally capital reallocation.
While this data alone can’t directly support a bearish view, it’s time to start paying attention to these potential sell-pressure signals.
554
·
--
Verified
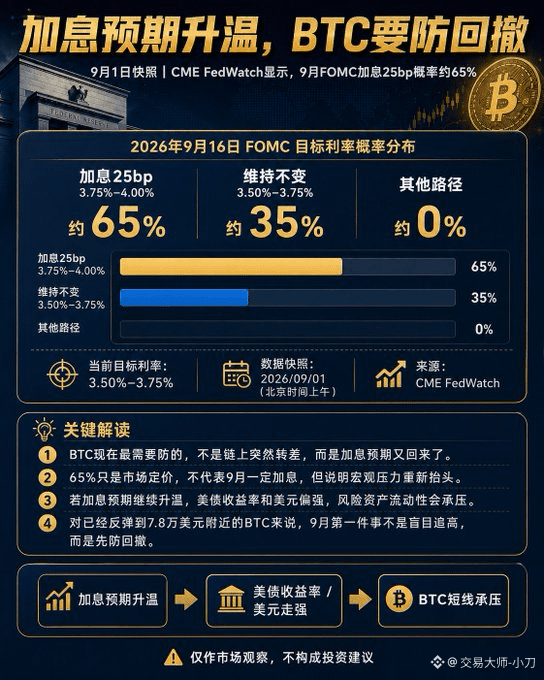
At the start of September, BTC has already gained a variable that needs to be watched closely: a rate hike.
As of the latest market pricing as of September 1, the probability of a 25-basis-point Fed rate hike in September has climbed to about 65%.
Right now, the federal funds target range is 3.50%—3.75%. If a hike really happens, the range would move back to 3.75%—4.00%.
For BTC, this is not a great change.
Once the market continues to price in rate hikes, Treasury yields and the U.S. dollar are more likely to stay at elevated levels, and the liquidity environment facing risk assets will become tighter.
BTC is currently hovering near $78,000. It has already rebounded quite a bit over the past stretch. If rate expectations keep moving upward and yields continue to rise, the main risk to watch for is a sudden pullback from the high level.
Of course, 65% is just what the market is forecasting—it does not mean September will definitely see a hike.
But at least it shows one thing:
The macro environment in September is no longer as comfortable as it was earlier.
So for now, I’d rather hedge first against a possible BTC pullback.
At the start of September, BTC has already gained a variable that needs to be watched closely: a rate hike.
As of the latest market pricing as of September 1, the probability of a 25-basis-point Fed rate hike in September has climbed to about 65%.
Right now, the federal funds target range is 3.50%—3.75%. If a hike really happens, the range would move back to 3.75%—4.00%.
For BTC, this is not a great change.
Once the market continues to price in rate hikes, Treasury yields and the U.S. dollar are more likely to stay at elevated levels, and the liquidity environment facing risk assets will become tighter.
BTC is currently hovering near $78,000. It has already rebounded quite a bit over the past stretch. If rate expectations keep moving upward and yields continue to rise, the main risk to watch for is a sudden pullback from the high level.
Of course, 65% is just what the market is forecasting—it does not mean September will definitely see a hike.
But at least it shows one thing:
The macro environment in September is no longer as comfortable as it was earlier.
So for now, I’d rather hedge first against a possible BTC pullback.
As of the latest market pricing as of September 1, the probability of a 25-basis-point Fed rate hike in September has climbed to about 65%.
Right now, the federal funds target range is 3.50%—3.75%. If a hike really happens, the range would move back to 3.75%—4.00%.
For BTC, this is not a great change.
Once the market continues to price in rate hikes, Treasury yields and the U.S. dollar are more likely to stay at elevated levels, and the liquidity environment facing risk assets will become tighter.
BTC is currently hovering near $78,000. It has already rebounded quite a bit over the past stretch. If rate expectations keep moving upward and yields continue to rise, the main risk to watch for is a sudden pullback from the high level.
Of course, 65% is just what the market is forecasting—it does not mean September will definitely see a hike.
But at least it shows one thing:
The macro environment in September is no longer as comfortable as it was earlier.
So for now, I’d rather hedge first against a possible BTC pullback.
2
2
1.2k
·
--
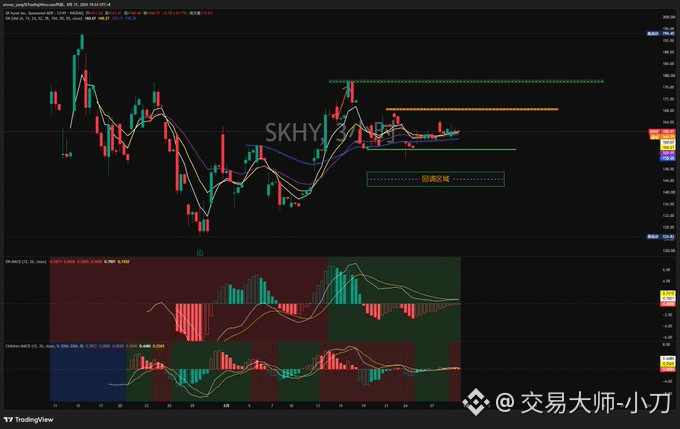
Hynix SKHY pre-market
Review of last Friday’s viewpoint: The market continues to trade in a box range. Resistance at the upper boundary is 167‑169, and support at the lower boundary is 150‑157.
Wait for the 3–4 hour timeframe to choose a direction, so we maintain the judgment that it will continue to range-bound.
Currently, the 3-hour sub-timeframe has already crossed above the zero line, and the pre-market price is at 160.8.
The key focus today is to watch for an upside push. The first target is the 165‑167 range.
#SK海力士研究在日本合建存储芯片厂
Hynix SKHY pre-market
Review of last Friday’s viewpoint: The market continues to trade in a box range. Resistance at the upper boundary is 167‑169, and support at the lower boundary is 150‑157.
Wait for the 3–4 hour timeframe to choose a direction, so we maintain the judgment that it will continue to range-bound.
Currently, the 3-hour sub-timeframe has already crossed above the zero line, and the pre-market price is at 160.8.
The key focus today is to watch for an upside push. The first target is the 165‑167 range.
#SK海力士研究在日本合建存储芯片厂
Review of last Friday’s viewpoint: The market continues to trade in a box range. Resistance at the upper boundary is 167‑169, and support at the lower boundary is 150‑157.
Wait for the 3–4 hour timeframe to choose a direction, so we maintain the judgment that it will continue to range-bound.
Currently, the 3-hour sub-timeframe has already crossed above the zero line, and the pre-market price is at 160.8.
The key focus today is to watch for an upside push. The first target is the 165‑167 range.
#SK海力士研究在日本合建存储芯片厂
435
·
--
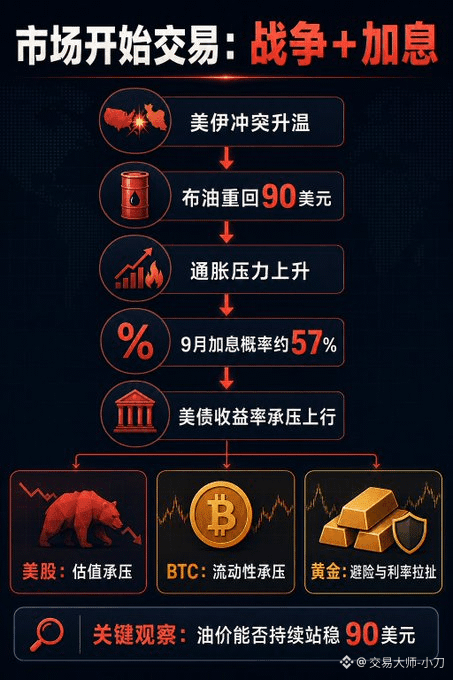
Oil prices have once again moved back above $90, and the market has another problem.
The conflict between the U.S. and Iran has escalated again. Brent crude oil briefly rose to around $90.6. At the same time, Fed Chair Powell’s speech at Jackson Hole was clearly hawkish, and market expectations for a 25-basis-point rate hike in September rose from about 35% to 57%.
Originally, the market only needed to worry about rate hikes. Now it also needs to worry that the war will keep pushing oil prices higher.
Put these two things together, and the logic is straightforward:
When oil prices rise, inflation becomes harder to bring down. If inflation can’t be brought down, the Fed has even more reason to raise rates. U.S. Treasury yields continue to move higher, and both U.S. stocks and BTC will face pressure.
Gold is also not as comfortable as people might imagine. War is a positive for safe-haven demand, but rate-hike expectations are also weighing on gold. So today, the gold price continued to fall instead.
At present, BTC is still holding around $78,000. Its performance has been more resilient than U.S. stock futures. But the truly key point going forward isn’t whether oil has touched $90—it’s whether it can keep sustaining levels above $90.
If oil keeps climbing, what the market is trading won’t just be the war anymore, but a new round of inflation pressure.
What does everyone think about where this market trend is headed?
#油轮在霍尔木兹海峡触雷起火
Oil prices have once again moved back above $90, and the market has another problem.
The conflict between the U.S. and Iran has escalated again. Brent crude oil briefly rose to around $90.6. At the same time, Fed Chair Powell’s speech at Jackson Hole was clearly hawkish, and market expectations for a 25-basis-point rate hike in September rose from about 35% to 57%.
Originally, the market only needed to worry about rate hikes. Now it also needs to worry that the war will keep pushing oil prices higher.
Put these two things together, and the logic is straightforward:
When oil prices rise, inflation becomes harder to bring down. If inflation can’t be brought down, the Fed has even more reason to raise rates. U.S. Treasury yields continue to move higher, and both U.S. stocks and BTC will face pressure.
Gold is also not as comfortable as people might imagine. War is a positive for safe-haven demand, but rate-hike expectations are also weighing on gold. So today, the gold price continued to fall instead.
At present, BTC is still holding around $78,000. Its performance has been more resilient than U.S. stock futures. But the truly key point going forward isn’t whether oil has touched $90—it’s whether it can keep sustaining levels above $90.
If oil keeps climbing, what the market is trading won’t just be the war anymore, but a new round of inflation pressure.
What does everyone think about where this market trend is headed?
#油轮在霍尔木兹海峡触雷起火
The conflict between the U.S. and Iran has escalated again. Brent crude oil briefly rose to around $90.6. At the same time, Fed Chair Powell’s speech at Jackson Hole was clearly hawkish, and market expectations for a 25-basis-point rate hike in September rose from about 35% to 57%.
Originally, the market only needed to worry about rate hikes. Now it also needs to worry that the war will keep pushing oil prices higher.
Put these two things together, and the logic is straightforward:
When oil prices rise, inflation becomes harder to bring down. If inflation can’t be brought down, the Fed has even more reason to raise rates. U.S. Treasury yields continue to move higher, and both U.S. stocks and BTC will face pressure.
Gold is also not as comfortable as people might imagine. War is a positive for safe-haven demand, but rate-hike expectations are also weighing on gold. So today, the gold price continued to fall instead.
At present, BTC is still holding around $78,000. Its performance has been more resilient than U.S. stock futures. But the truly key point going forward isn’t whether oil has touched $90—it’s whether it can keep sustaining levels above $90.
If oil keeps climbing, what the market is trading won’t just be the war anymore, but a new round of inflation pressure.
What does everyone think about where this market trend is headed?
#油轮在霍尔木兹海峡触雷起火
530
Log in to explore more content
Join global crypto users on Binance Square
⚡️ Get latest and useful information about crypto.
💬 Trusted by the world’s largest crypto exchange.
👍 Discover real insights from verified creators.
Email / Phone number