
CRYPTO SHARKSS
975 Posts

CRYPTO SHARKSS
Report
Block User
Crypto Trading Trainer / Blockchain / Airdrop / Crypto News / NFT
106 Following
210 Followers
1.2K+ Liked
Posts
All
Videos
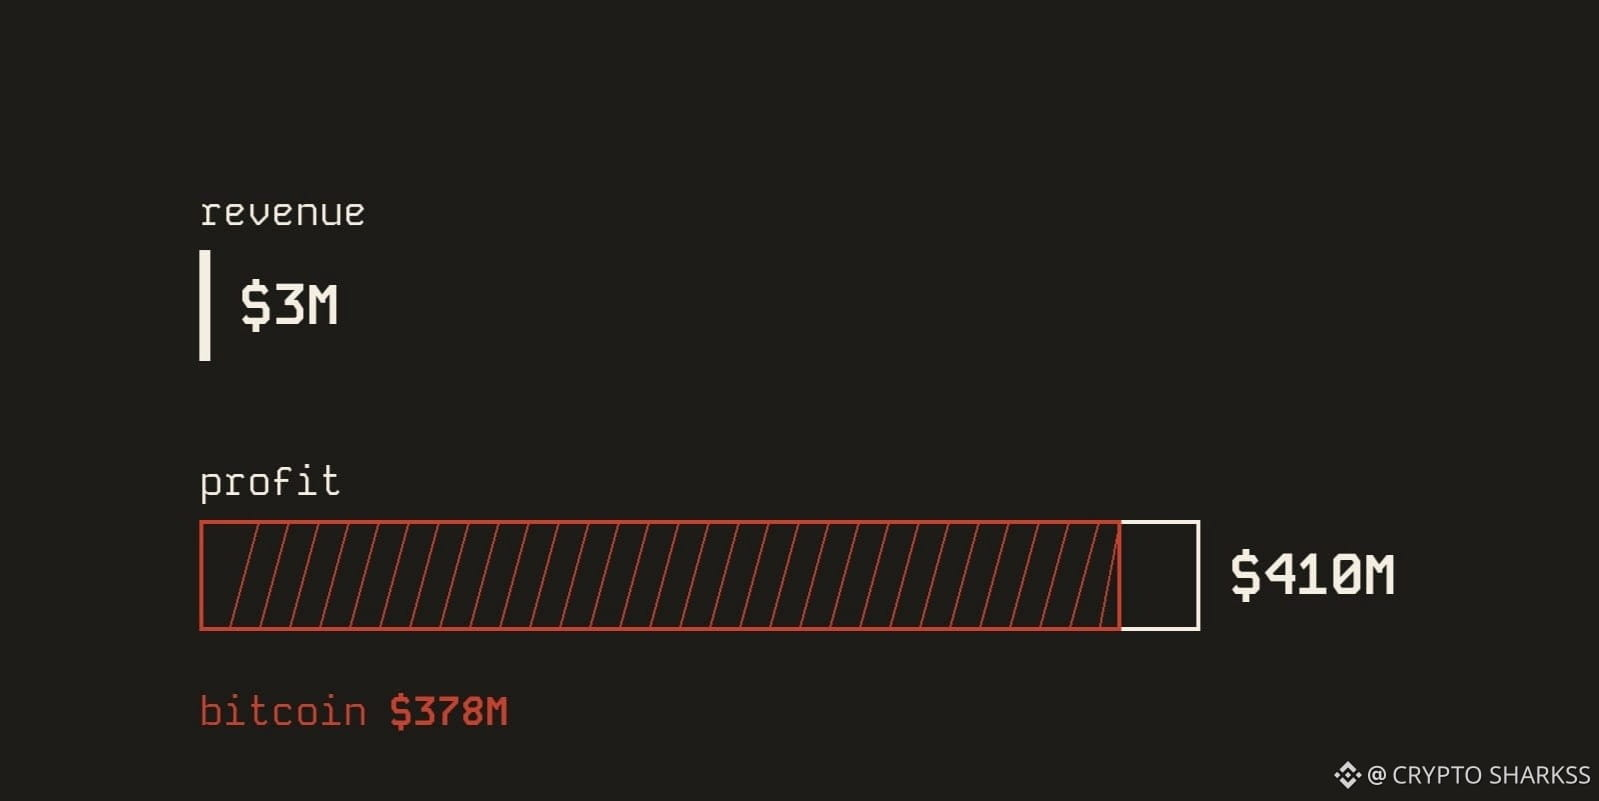
It’s hard to wrap your head around: Trump Media reported a profit of $410 million on revenue of just $3 million 🤯
Where did the rest of the money come from? Bitcoin. Trump Media owns about 15,649 BTC (news sites highlighted the 1,510 BTC the company bought last quarter). The company’s CFO said that over those three months, the price of bitcoin rose by about 42%, and the income statement showed that around $378 million of the profit came from the increase in value of its bitcoin assets. The report also says that most of the profit was non-cash: it was paper profit, not money earned by the business.
Those same assets can just as quickly turn into losses. According to Yahoo Finance, the company lost $238 million in the previous quarter when the value of its crypto and stock holdings fell. For the first nine months of 2026, the company’s loss still stands at $234 million.
So a headline about profits may actually be a headline about the price of bitcoin. If results depend on the price, a high profit says little about how the business itself is doing.
Next time you see a big profit, check where it came from.
Do you do that?
It’s hard to wrap your head around: Trump Media reported a profit of $410 million on revenue of just $3 million 🤯
Where did the rest of the money come from? Bitcoin. Trump Media owns about 15,649 BTC (news sites highlighted the 1,510 BTC the company bought last quarter). The company’s CFO said that over those three months, the price of bitcoin rose by about 42%, and the income statement showed that around $378 million of the profit came from the increase in value of its bitcoin assets. The report also says that most of the profit was non-cash: it was paper profit, not money earned by the business.
Those same assets can just as quickly turn into losses. According to Yahoo Finance, the company lost $238 million in the previous quarter when the value of its crypto and stock holdings fell. For the first nine months of 2026, the company’s loss still stands at $234 million.
So a headline about profits may actually be a headline about the price of bitcoin. If results depend on the price, a high profit says little about how the business itself is doing.
Next time you see a big profit, check where it came from.
Do you do that?
Where did the rest of the money come from? Bitcoin. Trump Media owns about 15,649 BTC (news sites highlighted the 1,510 BTC the company bought last quarter). The company’s CFO said that over those three months, the price of bitcoin rose by about 42%, and the income statement showed that around $378 million of the profit came from the increase in value of its bitcoin assets. The report also says that most of the profit was non-cash: it was paper profit, not money earned by the business.
Those same assets can just as quickly turn into losses. According to Yahoo Finance, the company lost $238 million in the previous quarter when the value of its crypto and stock holdings fell. For the first nine months of 2026, the company’s loss still stands at $234 million.
So a headline about profits may actually be a headline about the price of bitcoin. If results depend on the price, a high profit says little about how the business itself is doing.
Next time you see a big profit, check where it came from.
Do you do that?
1
17
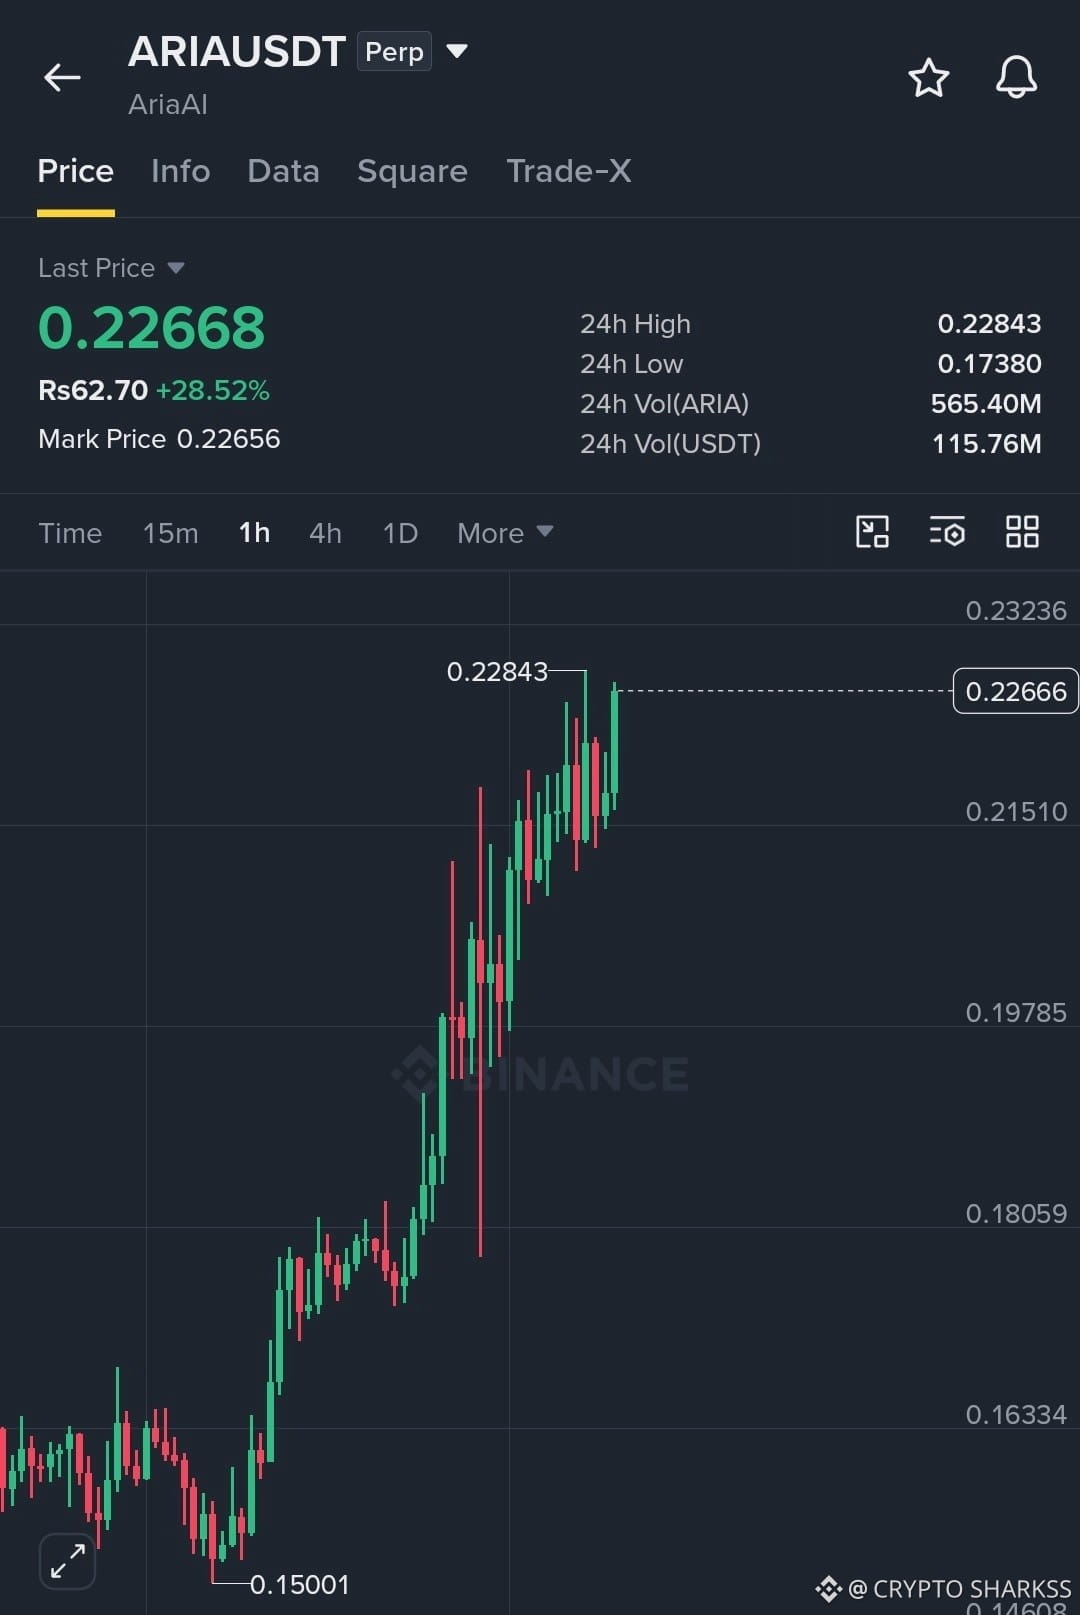
$ARIA AT A TURNING POINT! BREAKOUT OR DECLINE?
ARIA is showing strong bullish momentum and is trading around 0.2266 after an impressive rise. But now the price is testing a key resistance zone at 0.2284.
Bullish scenario: a confirmed break above 0.2284 could open the way to 0.25 and possibly even higher.
Bearish scenario: if buyers lose control and support at 0.215 is broken, a deeper correction to 0.20–0.18 is possible.
The next move could be significant. The bulls have momentum, but the real test is resistance.
ARIA Which side will win this battle?
$ARIA
{future}(ARIAUSDT)
$ARIA AT A TURNING POINT! BREAKOUT OR DECLINE?
ARIA is showing strong bullish momentum and is trading around 0.2266 after an impressive rise. But now the price is testing a key resistance zone at 0.2284.
Bullish scenario: a confirmed break above 0.2284 could open the way to 0.25 and possibly even higher.
Bearish scenario: if buyers lose control and support at 0.215 is broken, a deeper correction to 0.20–0.18 is possible.
The next move could be significant. The bulls have momentum, but the real test is resistance.
ARIA Which side will win this battle?
$ARIA
ARIA is showing strong bullish momentum and is trading around 0.2266 after an impressive rise. But now the price is testing a key resistance zone at 0.2284.
Bullish scenario: a confirmed break above 0.2284 could open the way to 0.25 and possibly even higher.
Bearish scenario: if buyers lose control and support at 0.215 is broken, a deeper correction to 0.20–0.18 is possible.
The next move could be significant. The bulls have momentum, but the real test is resistance.
ARIA Which side will win this battle?
$ARIA
1
20
🚨 Is $PEPE preparing for something bigger? 🐸
The connection between $PEPE and Elon Musk continues to attract attention from the crypto community.
Although there is no confirmed information that Elon Musk owns or has invested in PEPE, his past posts and Pepe-related memes have helped keep interest in the token alive.
In the crypto world, attention from influential people can sometimes spark a frenzy and trigger unexpected market moves.
Could PEPE pull off a big surprise during the next bull run? Or is its biggest rally still ahead?
What’s your forecast? Does PEPE have the potential to reach new highs?
Buy and trade $PEPE
{spot}(PEPEUSDT)
🚨 Is $PEPE preparing for something bigger? 🐸
The connection between $PEPE and Elon Musk continues to attract attention from the crypto community.
Although there is no confirmed information that Elon Musk owns or has invested in PEPE, his past posts and Pepe-related memes have helped keep interest in the token alive.
In the crypto world, attention from influential people can sometimes spark a frenzy and trigger unexpected market moves.
Could PEPE pull off a big surprise during the next bull run? Or is its biggest rally still ahead?
What’s your forecast? Does PEPE have the potential to reach new highs?
Buy and trade $PEPE
The connection between $PEPE and Elon Musk continues to attract attention from the crypto community.
Although there is no confirmed information that Elon Musk owns or has invested in PEPE, his past posts and Pepe-related memes have helped keep interest in the token alive.
In the crypto world, attention from influential people can sometimes spark a frenzy and trigger unexpected market moves.
Could PEPE pull off a big surprise during the next bull run? Or is its biggest rally still ahead?
What’s your forecast? Does PEPE have the potential to reach new highs?
Buy and trade $PEPE

1
31
$BTC Liquidation Heatmap: rebound brings price back to $74.0K amid strong liquidity levels in the $72.0K–$75.5K range 🛑
The heatmap shows how Bitcoin bounced from local lows around $72,000 and gradually moved higher, consolidating near $74,000.
Current market situation: BTC is trading around $74,100, maintaining a recovery structure with higher lows after testing the lower end of the range.
Market analysis: Bitcoin has formed a clear $3,500-wide trading range between two strong liquidity zones highlighted in yellow. As long as buyers defend support at $72.0K during pullbacks, momentum favors a breakout that could push the price toward the dense cluster of short positions in the $75.0K–$75.8K range.
Are you buying the dip near the $72.3K support, or expecting a breakout above $75.5K? Share your plan in the comments! 👇
{future}(BTCUSDT)
$BTC Liquidation Heatmap: rebound brings price back to $74.0K amid strong liquidity levels in the $72.0K–$75.5K range 🛑
The heatmap shows how Bitcoin bounced from local lows around $72,000 and gradually moved higher, consolidating near $74,000.
Current market situation: BTC is trading around $74,100, maintaining a recovery structure with higher lows after testing the lower end of the range.
Market analysis: Bitcoin has formed a clear $3,500-wide trading range between two strong liquidity zones highlighted in yellow. As long as buyers defend support at $72.0K during pullbacks, momentum favors a breakout that could push the price toward the dense cluster of short positions in the $75.0K–$75.8K range.
Are you buying the dip near the $72.3K support, or expecting a breakout above $75.5K? Share your plan in the comments! 👇
The heatmap shows how Bitcoin bounced from local lows around $72,000 and gradually moved higher, consolidating near $74,000.
Current market situation: BTC is trading around $74,100, maintaining a recovery structure with higher lows after testing the lower end of the range.
Market analysis: Bitcoin has formed a clear $3,500-wide trading range between two strong liquidity zones highlighted in yellow. As long as buyers defend support at $72.0K during pullbacks, momentum favors a breakout that could push the price toward the dense cluster of short positions in the $75.0K–$75.8K range.
Are you buying the dip near the $72.3K support, or expecting a breakout above $75.5K? Share your plan in the comments! 👇
1
34
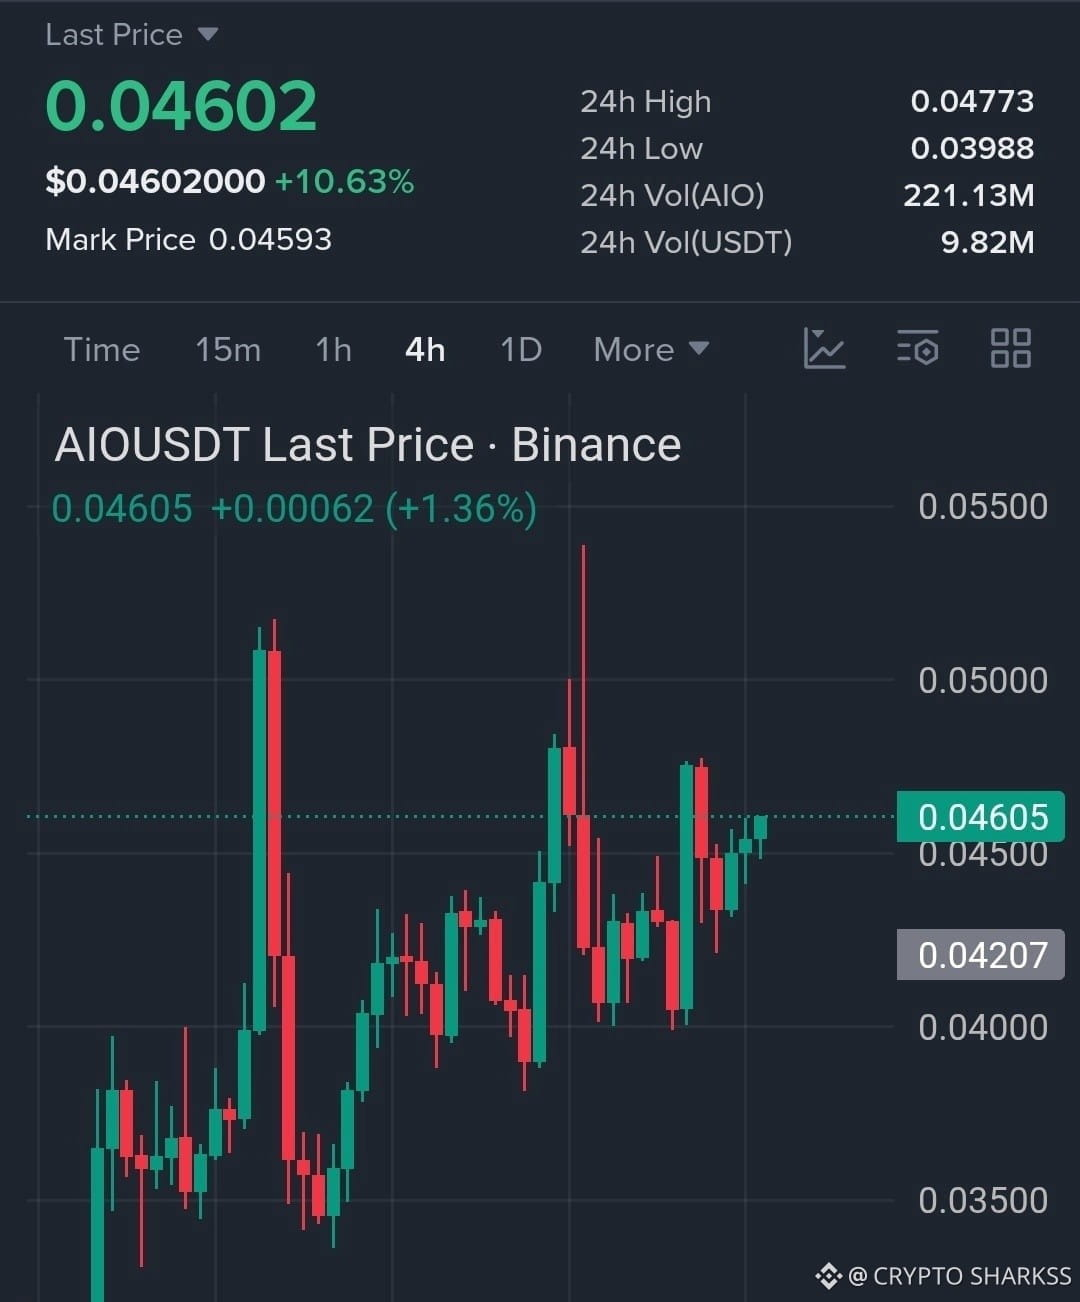
🚀 $AIO LONG NOW — bulls are aiming for a higher resistance level...
Open a long position now with 20x leverage:
Entry: 0.04550–0.04620
TP1: 0.04770
TP2: 0.05000
TP3: 0.05200
Final target: 0.05400
SL: 0.04000
Trade rationale:
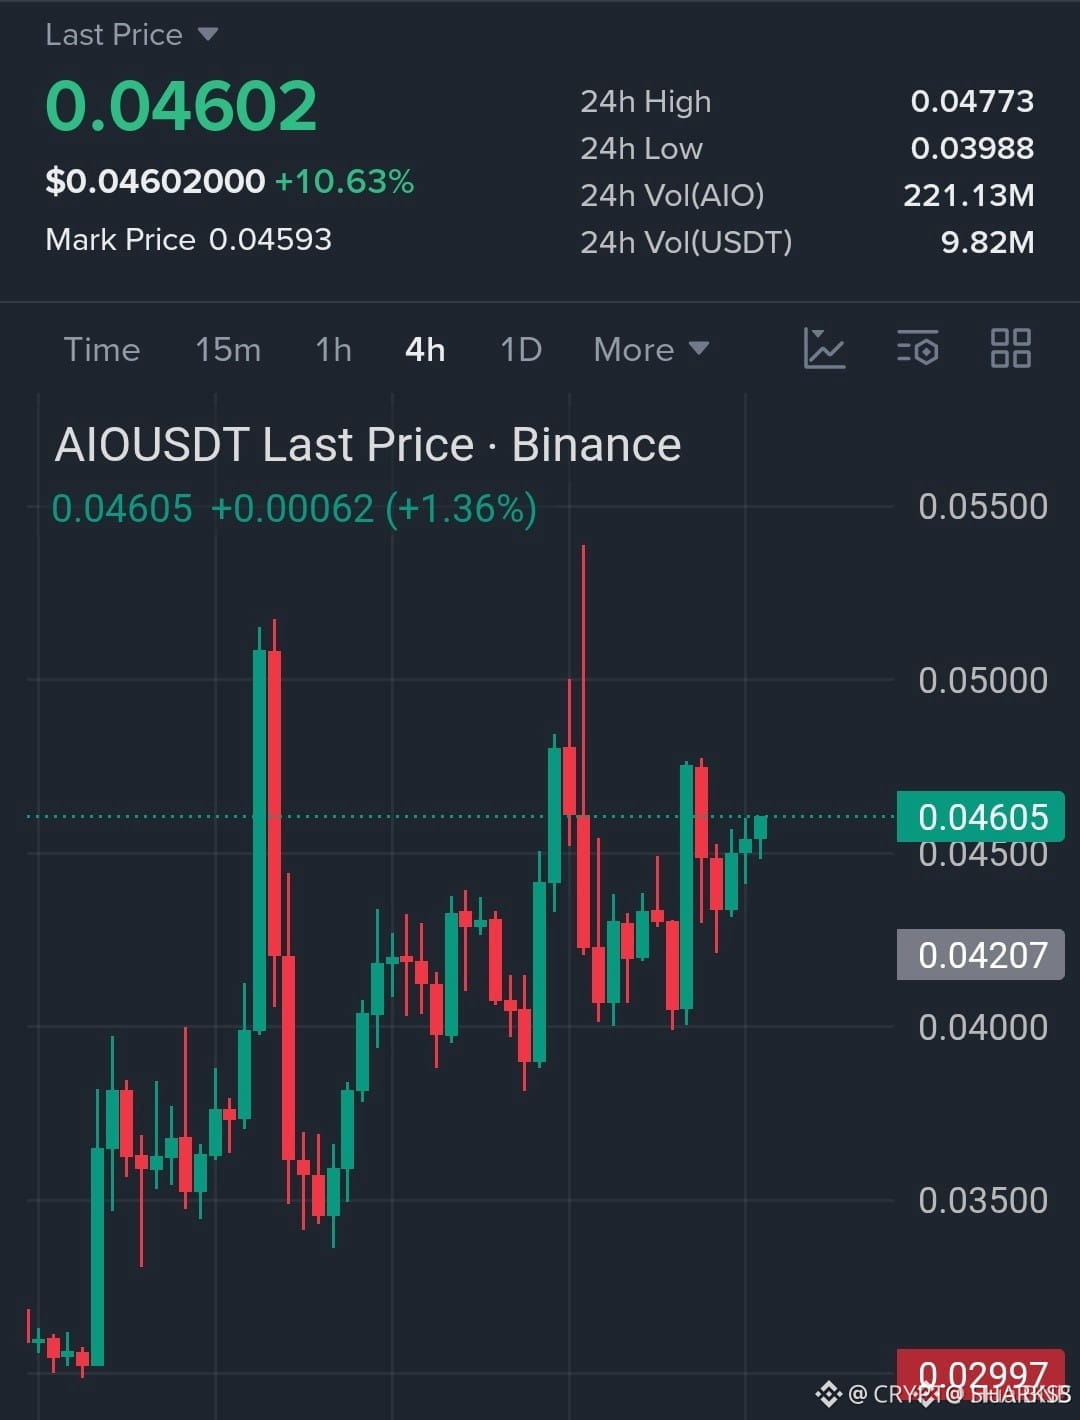
$AIO is trading around 0.04605 on the 4-hour chart, showing a recovery after the recent support zone around 0.0400–0.0420.
Price is holding above 0.0450 and attempting to build bullish momentum. If buyers hold support and break through 0.04770, further upside toward 0.05000–0.05200 may follow.
A confirmed break above 0.05200 could open the way to the next resistance level around 0.05400.
There is still resistance ahead... Use a stop-loss and manage risk carefully.
Trade $AIO here...👇
{future}(AIOUSDT)
🚀 $AIO LONG NOW — bulls are aiming for a higher resistance level...
Open a long position now with 20x leverage:
Entry: 0.04550–0.04620
TP1: 0.04770
TP2: 0.05000
TP3: 0.05200
Final target: 0.05400
SL: 0.04000
Trade rationale:
$AIO is trading around 0.04605 on the 4-hour chart, showing a recovery after the recent support zone around 0.0400–0.0420.
Price is holding above 0.0450 and attempting to build bullish momentum. If buyers hold support and break through 0.04770, further upside toward 0.05000–0.05200 may follow.
A confirmed break above 0.05200 could open the way to the next resistance level around 0.05400.
There is still resistance ahead... Use a stop-loss and manage risk carefully.
Trade $AIO here...👇
Open a long position now with 20x leverage:
Entry: 0.04550–0.04620
TP1: 0.04770
TP2: 0.05000
TP3: 0.05200
Final target: 0.05400
SL: 0.04000
Trade rationale:
$AIO is trading around 0.04605 on the 4-hour chart, showing a recovery after the recent support zone around 0.0400–0.0420.
Price is holding above 0.0450 and attempting to build bullish momentum. If buyers hold support and break through 0.04770, further upside toward 0.05000–0.05200 may follow.
A confirmed break above 0.05200 could open the way to the next resistance level around 0.05400.
There is still resistance ahead... Use a stop-loss and manage risk carefully.
Trade $AIO here...👇
1
20
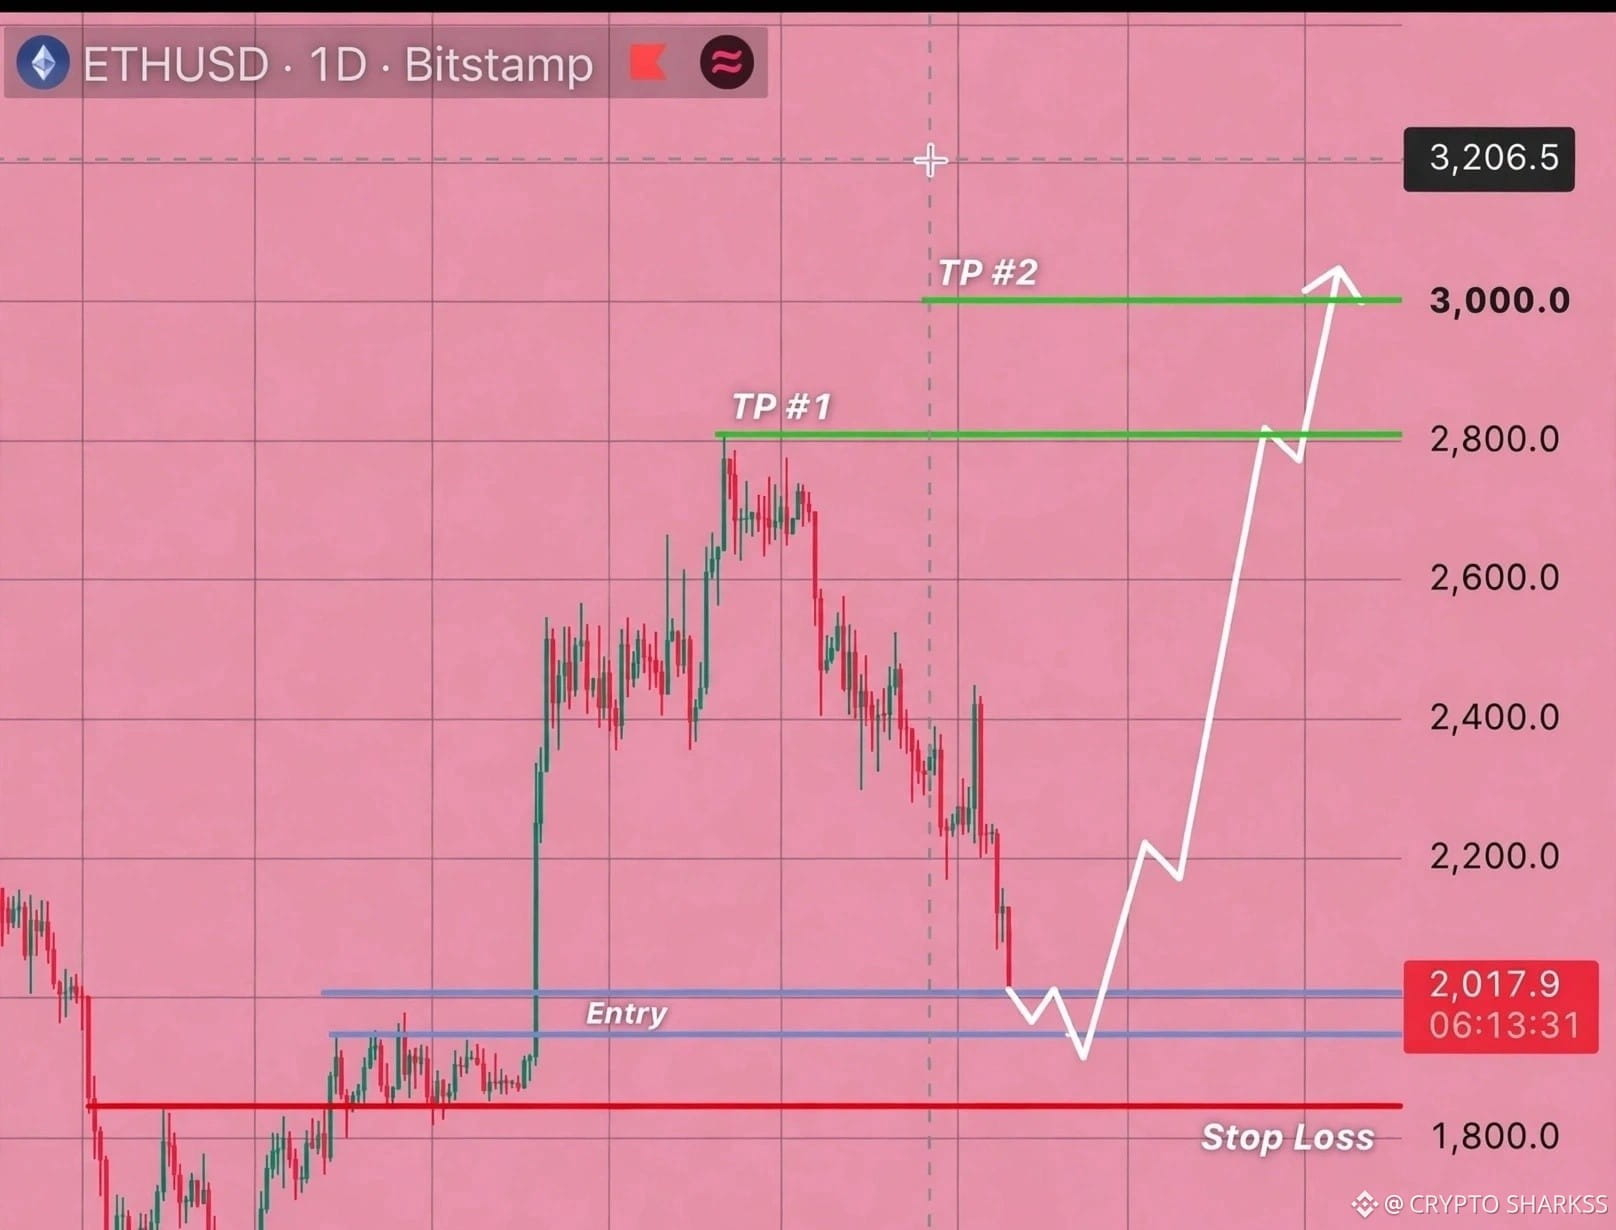
GUYS, $ETH HAS DROPPED BELOW $2,000 AGAIN, JUST AS I EXPECTED‼️‼️
I was waiting for this move, and it finally happened.
I said ETH had to drop below $2K one more time before a strong recovery could begin. Now this liquidity sweep is complete.
My trade plan:
→ Entry: $1,950–$2,015
→ Stop-loss: $1,800
→ Target 1: $2,800
→ Target 2: $3,000
Let’s see how far ETH can go
{future}(ETHUSDT)
#Ethereum
GUYS, $ETH HAS DROPPED BELOW $2,000 AGAIN, JUST AS I EXPECTED‼️‼️
I was waiting for this move, and it finally happened.
I said ETH had to drop below $2K one more time before a strong recovery could begin. Now this liquidity sweep is complete.
My trade plan:
→ Entry: $1,950–$2,015
→ Stop-loss: $1,800
→ Target 1: $2,800
→ Target 2: $3,000
Let’s see how far ETH can go
#Ethereum
I was waiting for this move, and it finally happened.
I said ETH had to drop below $2K one more time before a strong recovery could begin. Now this liquidity sweep is complete.
My trade plan:
→ Entry: $1,950–$2,015
→ Stop-loss: $1,800
→ Target 1: $2,800
→ Target 2: $3,000
Let’s see how far ETH can go
#Ethereum
2
66
🚀 $BTW
{future}(BTWUSDT)
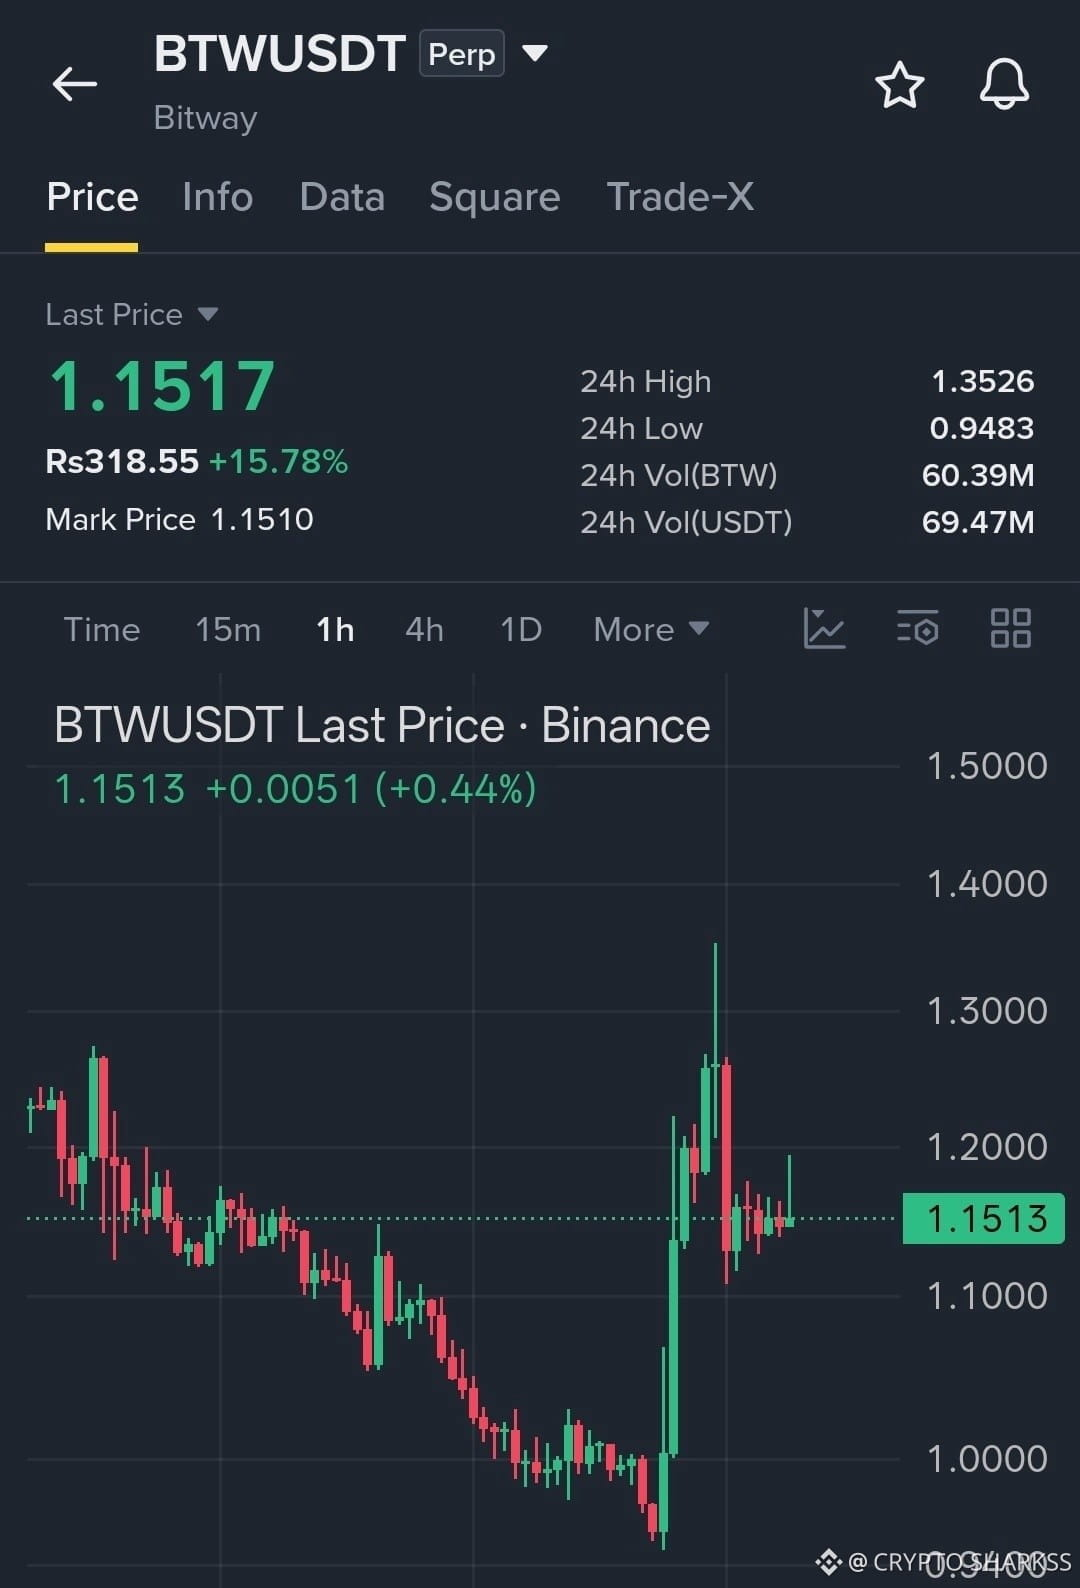
EYES $1.25 amid strengthening bullish momentum!
Long entry: $1.135–$1.155 Stop-loss: $1.105 Target 1: $1.190 Target 2: $1.230 Target 3: $1.280
🚀 $BTW
EYES $1.25 amid strengthening bullish momentum!
Long entry: $1.135–$1.155 Stop-loss: $1.105 Target 1: $1.190 Target 2: $1.230 Target 3: $1.280
EYES $1.25 amid strengthening bullish momentum!
Long entry: $1.135–$1.155 Stop-loss: $1.105 Target 1: $1.190 Target 2: $1.230 Target 3: $1.280
1
47
$NVDAB 📈
Everyone trading NVIDIA stock with a long-term strategy is already in! As for short-term traders, there’s no need to rush into opening a position.
NVIDIA’s market capitalization is currently around $4 trillion, whereas it previously remained above the $5 trillion mark for several months.
A rise from $4 trillion to $5 trillion would mean an increase of more than 25%.
At the current share price of around $170, if you buy actual NVIDIA shares and wait for its market cap to rise by 25%—to $5 trillion—the share price would reach just $212.50, still well below its previous high of $243.
Buffett earns an annual return of only a few tens of percent—no more. So isn’t it sensible to hold NVIDIA shares for more than six months? The potential gain far outweighs the risk!
When we trade, we bet on probabilities, the relationship between value and price, and the risk-to-reward ratio. Actual NVIDIA shares fit this strategy perfectly.
$NVDAB 📈
Everyone trading NVIDIA stock with a long-term strategy is already in! As for short-term traders, there’s no need to rush into opening a position.
NVIDIA’s market capitalization is currently around $4 trillion, whereas it previously remained above the $5 trillion mark for several months.
A rise from $4 trillion to $5 trillion would mean an increase of more than 25%.
At the current share price of around $170, if you buy actual NVIDIA shares and wait for its market cap to rise by 25%—to $5 trillion—the share price would reach just $212.50, still well below its previous high of $243.
Buffett earns an annual return of only a few tens of percent—no more. So isn’t it sensible to hold NVIDIA shares for more than six months? The potential gain far outweighs the risk!
When we trade, we bet on probabilities, the relationship between value and price, and the risk-to-reward ratio. Actual NVIDIA shares fit this strategy perfectly.
Everyone trading NVIDIA stock with a long-term strategy is already in! As for short-term traders, there’s no need to rush into opening a position.
NVIDIA’s market capitalization is currently around $4 trillion, whereas it previously remained above the $5 trillion mark for several months.
A rise from $4 trillion to $5 trillion would mean an increase of more than 25%.
At the current share price of around $170, if you buy actual NVIDIA shares and wait for its market cap to rise by 25%—to $5 trillion—the share price would reach just $212.50, still well below its previous high of $243.
Buffett earns an annual return of only a few tens of percent—no more. So isn’t it sensible to hold NVIDIA shares for more than six months? The potential gain far outweighs the risk!
When we trade, we bet on probabilities, the relationship between value and price, and the risk-to-reward ratio. Actual NVIDIA shares fit this strategy perfectly.
1
68
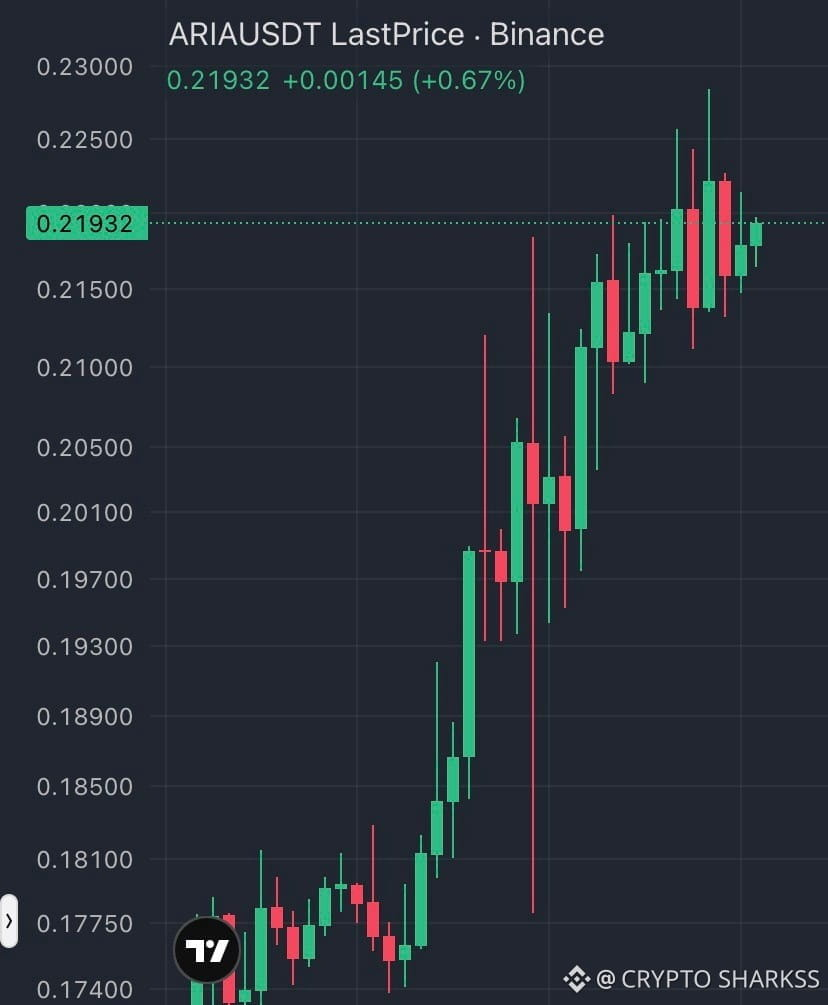
🚀 Guys, open a long position $ARIA right now!
📍 Entry zone: 0.2150 – 0.2210
🎯 TP1: 0.2480
🎯 TP2: 0.2700
🛑 Stop-loss: 0.1750
{future}(ARIAUSDT)
🚀 Guys, open a long position $ARIA right now!
📍 Entry zone: 0.2150 – 0.2210
🎯 TP1: 0.2480
🎯 TP2: 0.2700
🛑 Stop-loss: 0.1750
📍 Entry zone: 0.2150 – 0.2210
🎯 TP1: 0.2480
🎯 TP2: 0.2700
🛑 Stop-loss: 0.1750
1
78
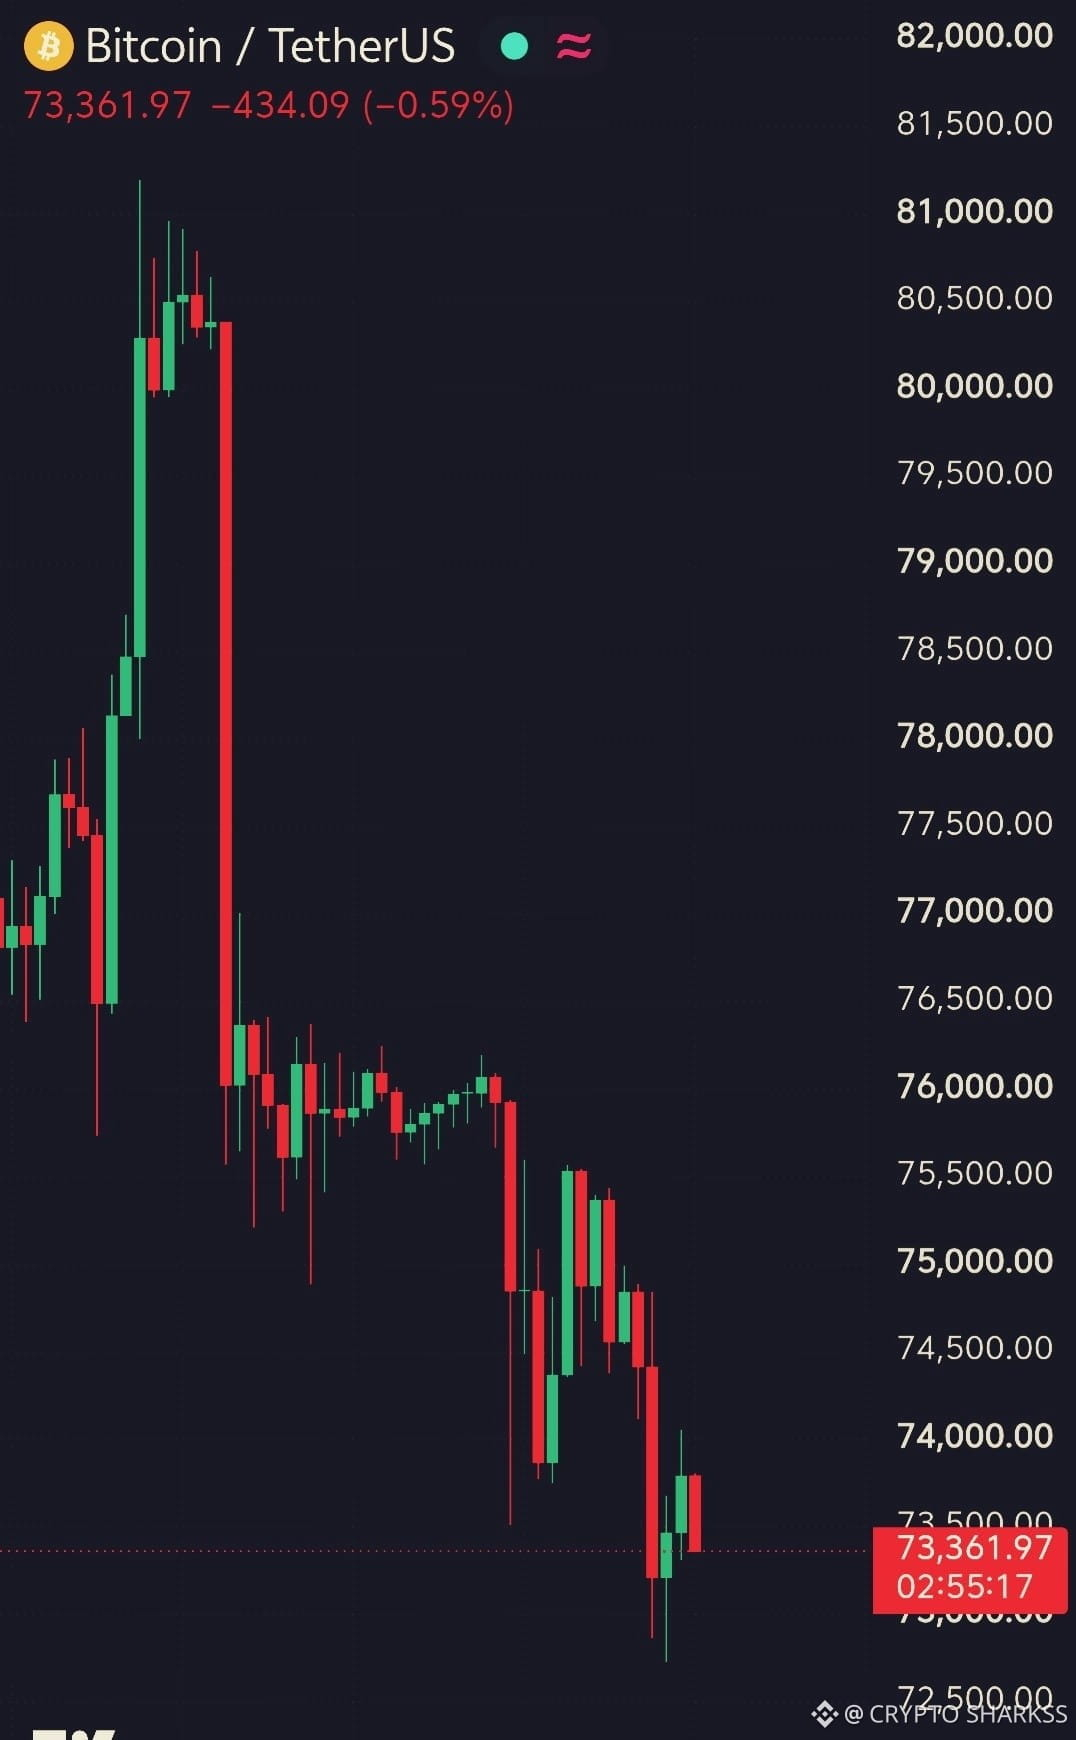
MASS LIQUIDATION ♥️
$BTC fell below $73,000 for the first time in 12 weeks.
$230 million in longs liquidated in just 60 minutes.
{future}(BTCUSDT)
MASS LIQUIDATION ♥️
$BTC fell below $73,000 for the first time in 12 weeks.
$230 million in longs liquidated in just 60 minutes.
$BTC fell below $73,000 for the first time in 12 weeks.
$230 million in longs liquidated in just 60 minutes.
1
88
Altcoins are ready to take off…‼️
$SECZ — Target: $10.5
$ARIA — Target: $0.3
$CYBER — Target: $0.4
Altcoins are ready to take off…‼️
$SECZ — Target: $10.5
$ARIA — Target: $0.3
$CYBER — Target: $0.4
$SECZ — Target: $10.5
$ARIA — Target: $0.3
$CYBER — Target: $0.4
1
23
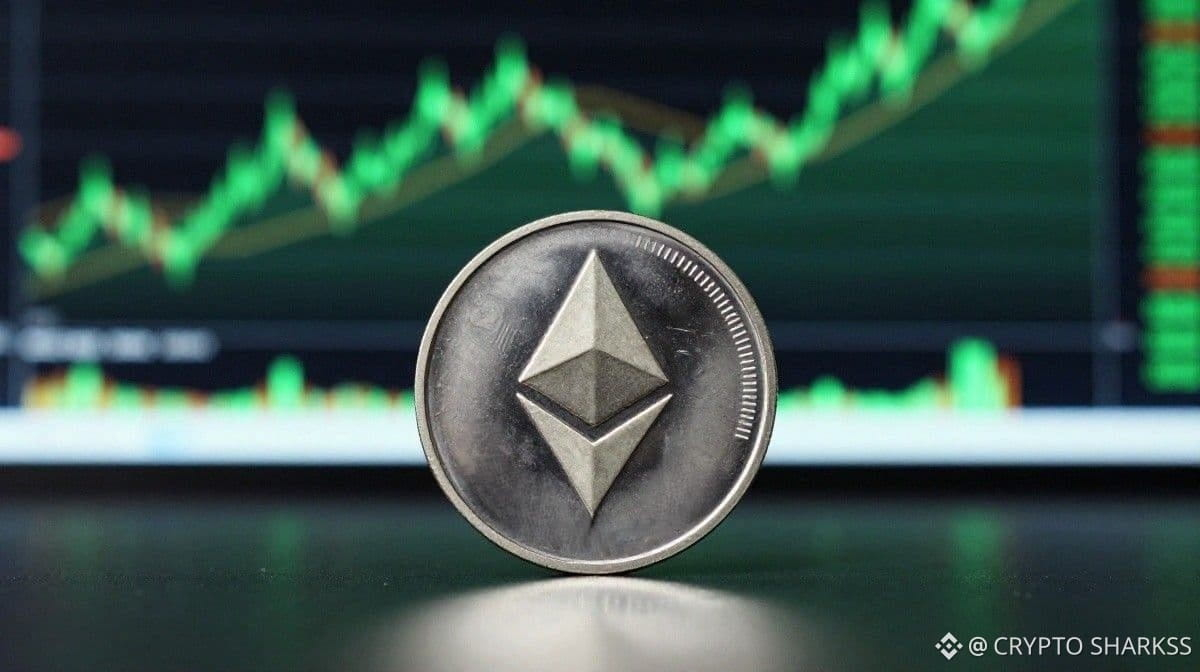
🚨Ethereum ($ETH ) | Daily Chart Analysis
Let’s wrap up today’s Ethereum analysis, guys! We’ve already covered Bitcoin this week, so now it’s time to take a broader look at ETH on the daily timeframe.
First, a quick update on my previous analysis. The scenario played out perfectly! As expected, ETH reached the 4-hour FVG zone we marked around $2,170–$2,225 and showed a strong bullish reaction. It’s always great to see price respect the levels we’re watching. Now let’s continue the analysis and look at the bigger picture.
In August, $ETH rose from around $1,950 to $2,800, forming two consolidation zones along the way. Since then, the structure has turned bearish, and the price has returned..
{future}(ETHUSDT)
#Ethereum
🚨Ethereum ($ETH ) | Daily Chart Analysis
Let’s wrap up today’s Ethereum analysis, guys! We’ve already covered Bitcoin this week, so now it’s time to take a broader look at ETH on the daily timeframe.
First, a quick update on my previous analysis. The scenario played out perfectly! As expected, ETH reached the 4-hour FVG zone we marked around $2,170–$2,225 and showed a strong bullish reaction. It’s always great to see price respect the levels we’re watching. Now let’s continue the analysis and look at the bigger picture.
In August, $ETH rose from around $1,950 to $2,800, forming two consolidation zones along the way. Since then, the structure has turned bearish, and the price has returned..
#Ethereum
Let’s wrap up today’s Ethereum analysis, guys! We’ve already covered Bitcoin this week, so now it’s time to take a broader look at ETH on the daily timeframe.
First, a quick update on my previous analysis. The scenario played out perfectly! As expected, ETH reached the 4-hour FVG zone we marked around $2,170–$2,225 and showed a strong bullish reaction. It’s always great to see price respect the levels we’re watching. Now let’s continue the analysis and look at the bigger picture.
In August, $ETH rose from around $1,950 to $2,800, forming two consolidation zones along the way. Since then, the structure has turned bearish, and the price has returned..
#Ethereum
2
34
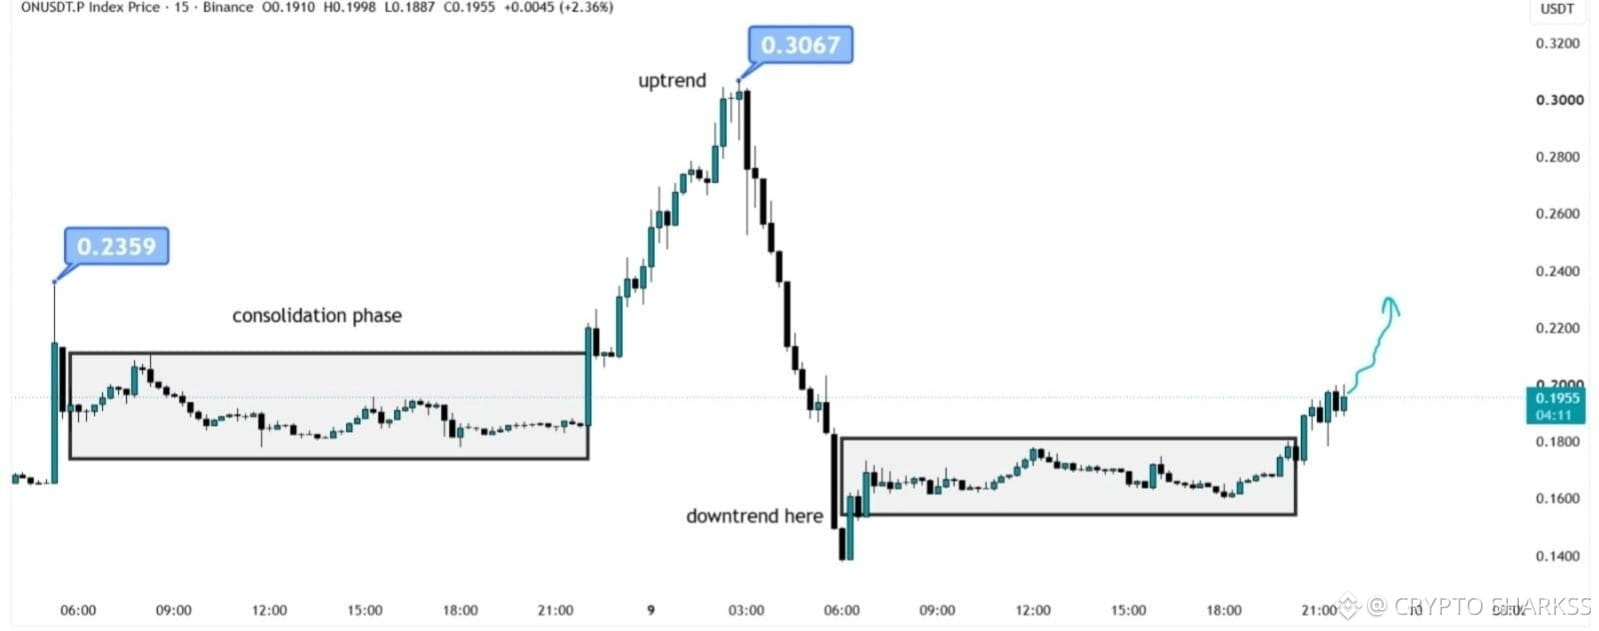
$ON RETURNS AFTER A SHARP DROP! ON surged to new highs, plunged sharply, consolidated near the lows, and is now breaking upward again, building fresh momentum. Price is holding around $0.1955, and the next key level to watch is $0.2359; buyers are returning!
{future}(ONUSDT)
$ON RETURNS AFTER A SHARP DROP! ON surged to new highs, plunged sharply, consolidated near the lows, and is now breaking upward again, building fresh momentum. Price is holding around $0.1955, and the next key level to watch is $0.2359; buyers are returning!
2
6
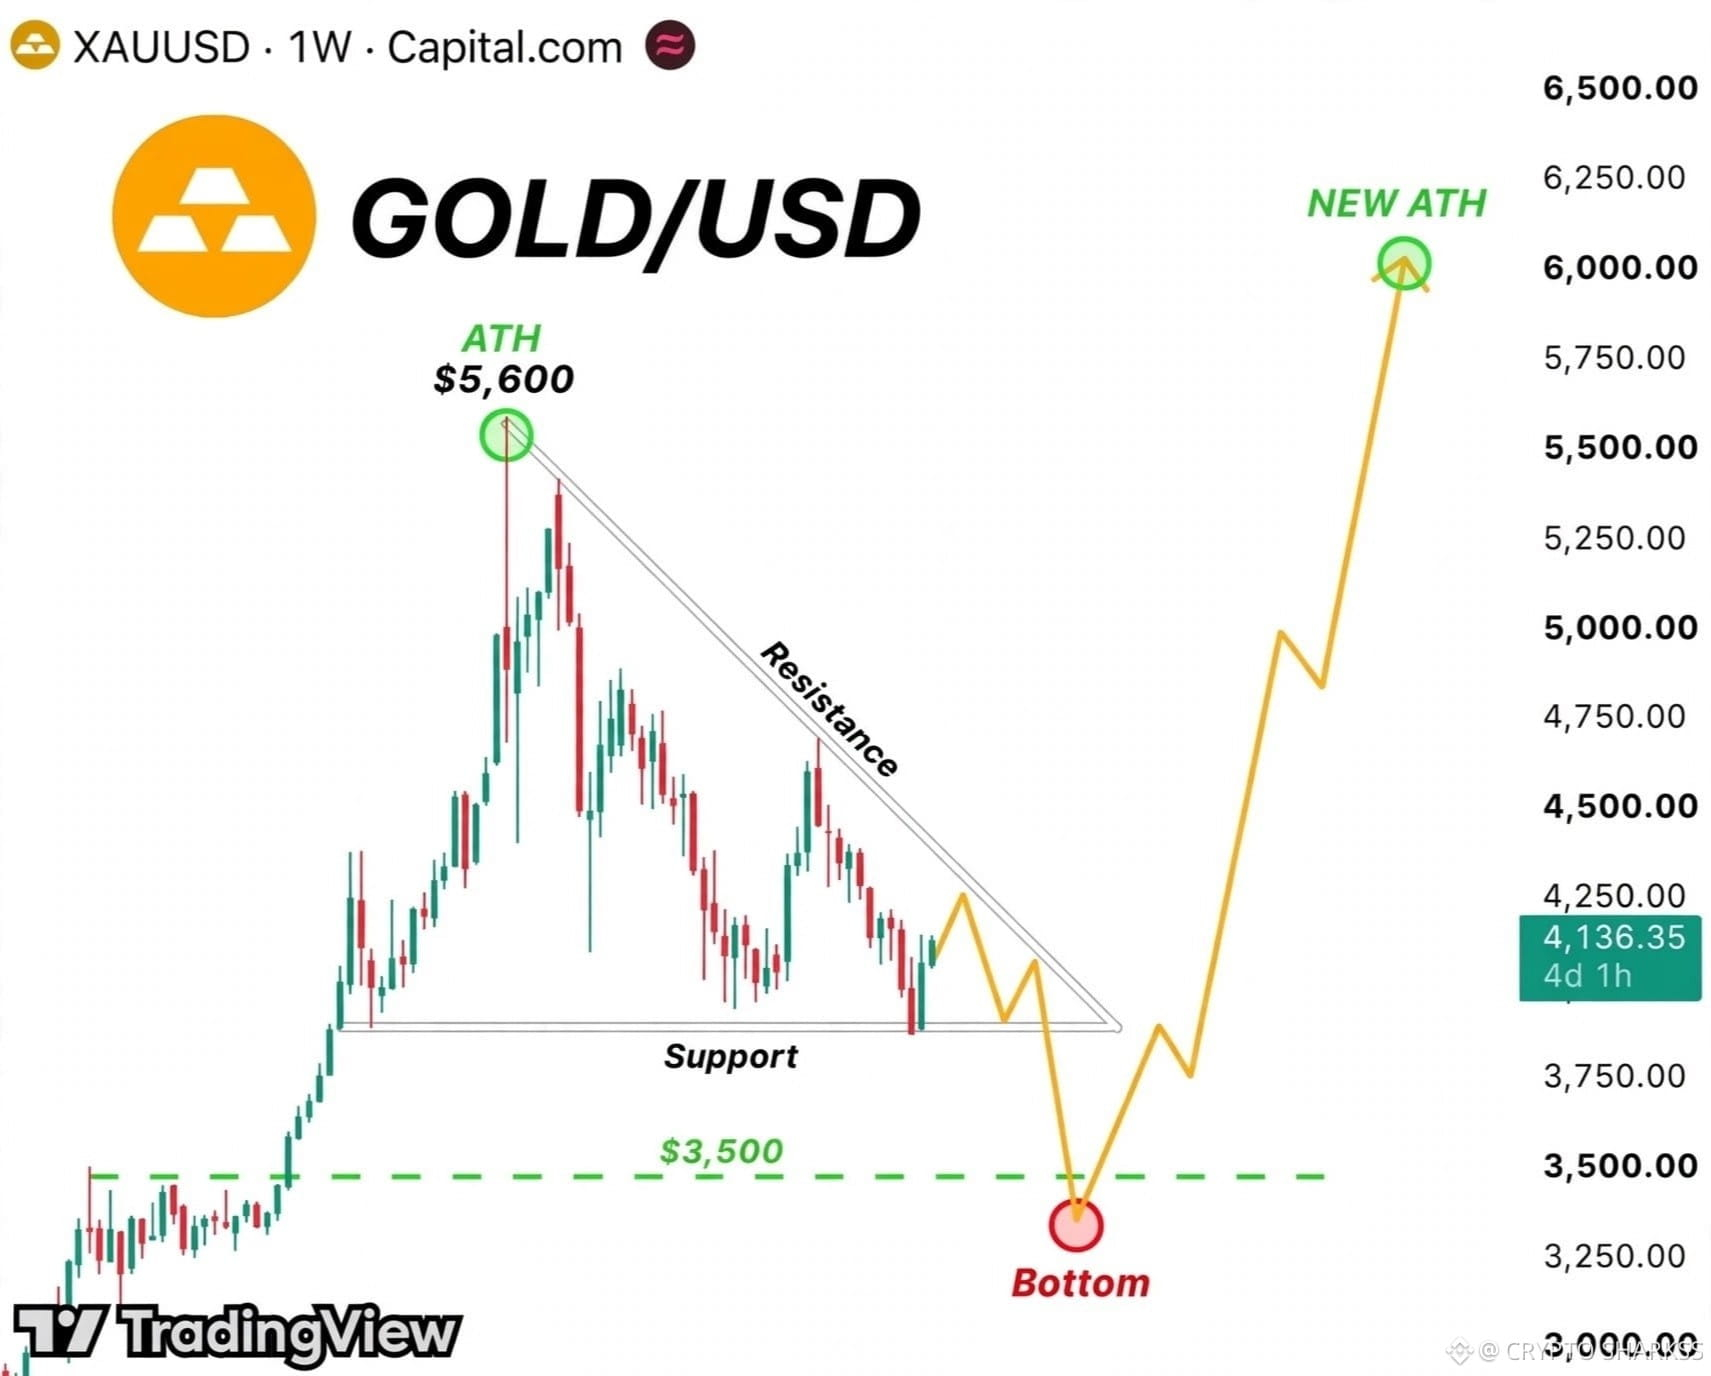
GOLD WILL SEE ONE MORE STRONG SHAKEOUT BEFORE THE NEXT ALL-TIME HIGH‼️‼️
A clear structure is emerging on the weekly chart.
Gold lost support around $3,900, while the descending resistance line continues to cap the recovery.
First, I expect another move up, possibly to $4,250, followed by another decline.
My main target for forming the final bottom is $3,300–$3,500.
I expect buyers to start stepping in within this zone, triggering a powerful reversal.
Once gold breaks above the descending resistance line, the next major targets will be $5,000, followed by a new all-time high around $6,000.
I’m not claiming that the gold bull market is over.
$XAUT l $BTC l $ETH
GOLD WILL SEE ONE MORE STRONG SHAKEOUT BEFORE THE NEXT ALL-TIME HIGH‼️‼️
A clear structure is emerging on the weekly chart.
Gold lost support around $3,900, while the descending resistance line continues to cap the recovery.
First, I expect another move up, possibly to $4,250, followed by another decline.
My main target for forming the final bottom is $3,300–$3,500.
I expect buyers to start stepping in within this zone, triggering a powerful reversal.
Once gold breaks above the descending resistance line, the next major targets will be $5,000, followed by a new all-time high around $6,000.
I’m not claiming that the gold bull market is over.
$XAUT l $BTC l $ETH
A clear structure is emerging on the weekly chart.
Gold lost support around $3,900, while the descending resistance line continues to cap the recovery.
First, I expect another move up, possibly to $4,250, followed by another decline.
My main target for forming the final bottom is $3,300–$3,500.
I expect buyers to start stepping in within this zone, triggering a powerful reversal.
Once gold breaks above the descending resistance line, the next major targets will be $5,000, followed by a new all-time high around $6,000.
I’m not claiming that the gold bull market is over.
$XAUT l $BTC l $ETH
2
39
$GRAM #GRAM 💎 Pavel Durov: The entire crypto market is in the red. Only GRAM is rising (+7%).
That doesn't surprise me. It's the only coin integrated into a real social ecosystem. It's still significantly undervalued and deserves a place in CoinMarketCap's TOP 3. One day, GRAM will make it there.
{future}(GRAMUSDT)
$GRAM #GRAM 💎 Pavel Durov: The entire crypto market is in the red. Only GRAM is rising (+7%).
That doesn't surprise me. It's the only coin integrated into a real social ecosystem. It's still significantly undervalued and deserves a place in CoinMarketCap's TOP 3. One day, GRAM will make it there.
That doesn't surprise me. It's the only coin integrated into a real social ecosystem. It's still significantly undervalued and deserves a place in CoinMarketCap's TOP 3. One day, GRAM will make it there.
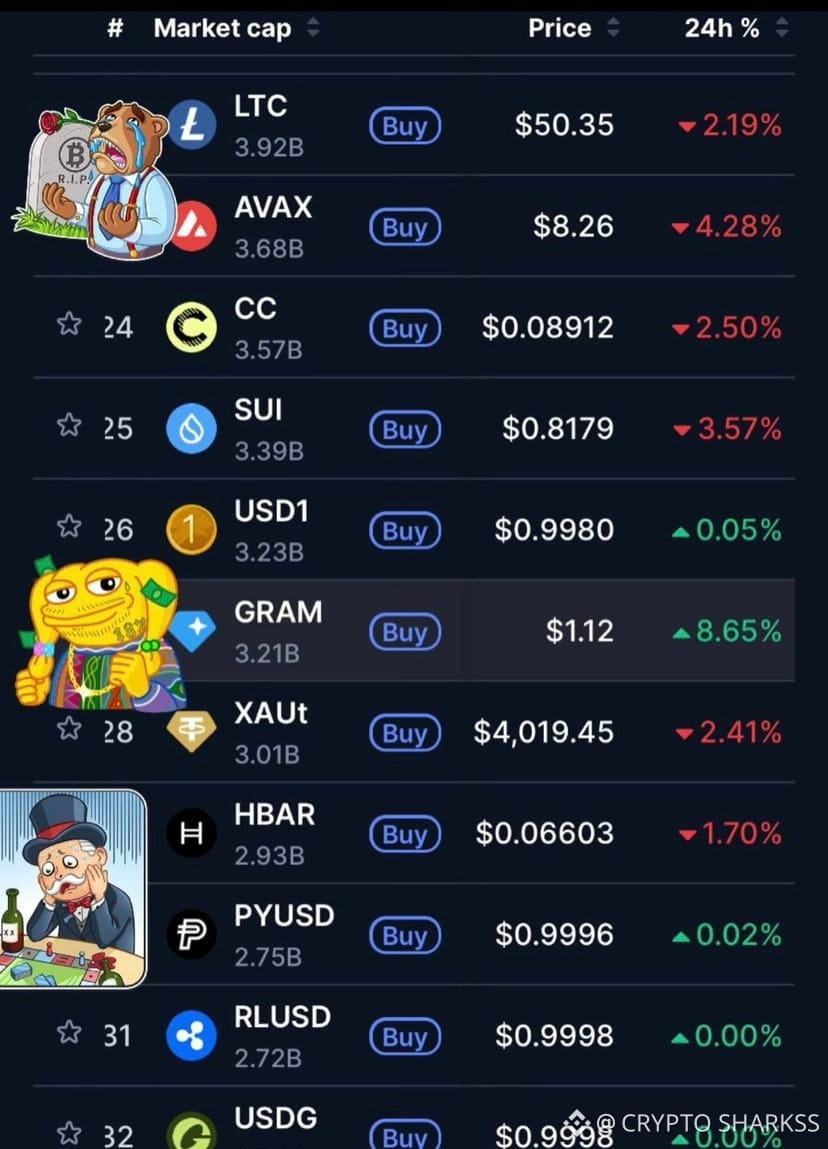
1
2
29
$GPS /USDT into Long🐋
{future}(GPSUSDT)
Entry point: at market!
Targets: 0.008087, 0.008636, 0.009063
Stop: 0.007456
$GPS /USDT into Long🐋
Entry point: at market!
Targets: 0.008087, 0.008636, 0.009063
Stop: 0.007456
Entry point: at market!
Targets: 0.008087, 0.008636, 0.009063
Stop: 0.007456
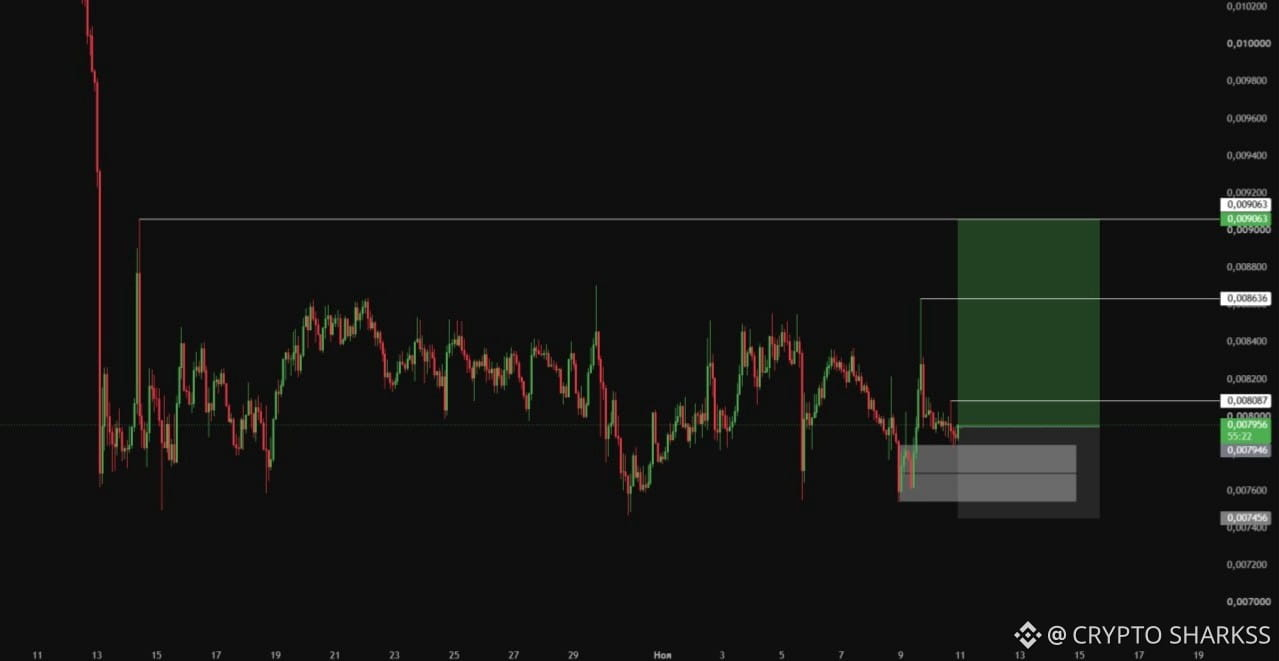
1
14
$XRP – LONG-TERM TRADE
✅ Entry price: 1.0497
📌 Targets: 1.0605 / 1.0932 / 1.1369
🔽❌ Stop-loss: 1.0069
We have entered the XRP area of interest on a longer timeframe, and I expect a reaction that will allow us to fill the nearest imbalance.
{future}(XRPUSDT)
#Xrp🔥🔥
$XRP – LONG-TERM TRADE
✅ Entry price: 1.0497
📌 Targets: 1.0605 / 1.0932 / 1.1369
🔽❌ Stop-loss: 1.0069
We have entered the XRP area of interest on a longer timeframe, and I expect a reaction that will allow us to fill the nearest imbalance.
#Xrp🔥🔥
✅ Entry price: 1.0497
📌 Targets: 1.0605 / 1.0932 / 1.1369
🔽❌ Stop-loss: 1.0069
We have entered the XRP area of interest on a longer timeframe, and I expect a reaction that will allow us to fill the nearest imbalance.
#Xrp🔥🔥
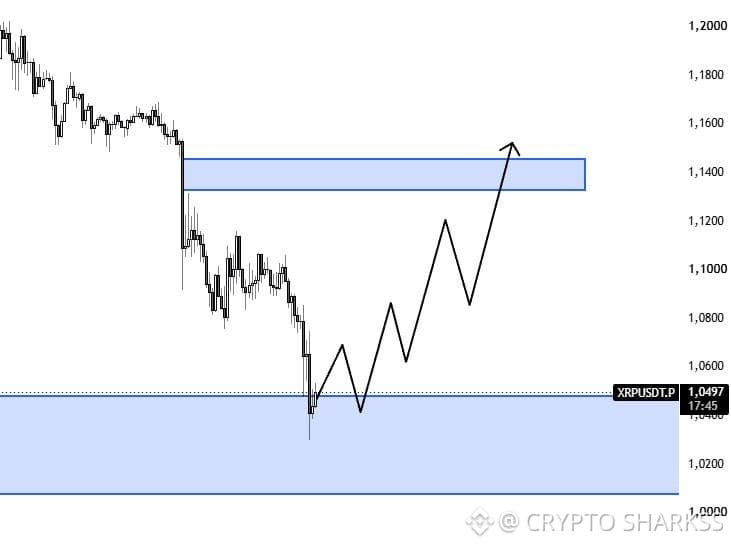
1
11
🐸😂$PEPE Are you still dreaming of seeing PEPE reach $1? Or have you decided to hold onto your coins until that legendary day finally arrives?
Some of you are waiting for a massive pump, while others are already imagining the profits! 🤣
As for me, I might just move away before PEPE ever reaches that price! Hahaha 😂
One dollar? Come on, friends, let's be at least a little realistic! 🚀🐸
#PEPE #Crypto #memecoins
🐸😂$PEPE Are you still dreaming of seeing PEPE reach $1? Or have you decided to hold onto your coins until that legendary day finally arrives?
Some of you are waiting for a massive pump, while others are already imagining the profits! 🤣
As for me, I might just move away before PEPE ever reaches that price! Hahaha 😂
One dollar? Come on, friends, let's be at least a little realistic! 🚀🐸
#PEPE #Crypto #memecoins
Some of you are waiting for a massive pump, while others are already imagining the profits! 🤣
As for me, I might just move away before PEPE ever reaches that price! Hahaha 😂
One dollar? Come on, friends, let's be at least a little realistic! 🚀🐸
#PEPE #Crypto #memecoins

1
1
156
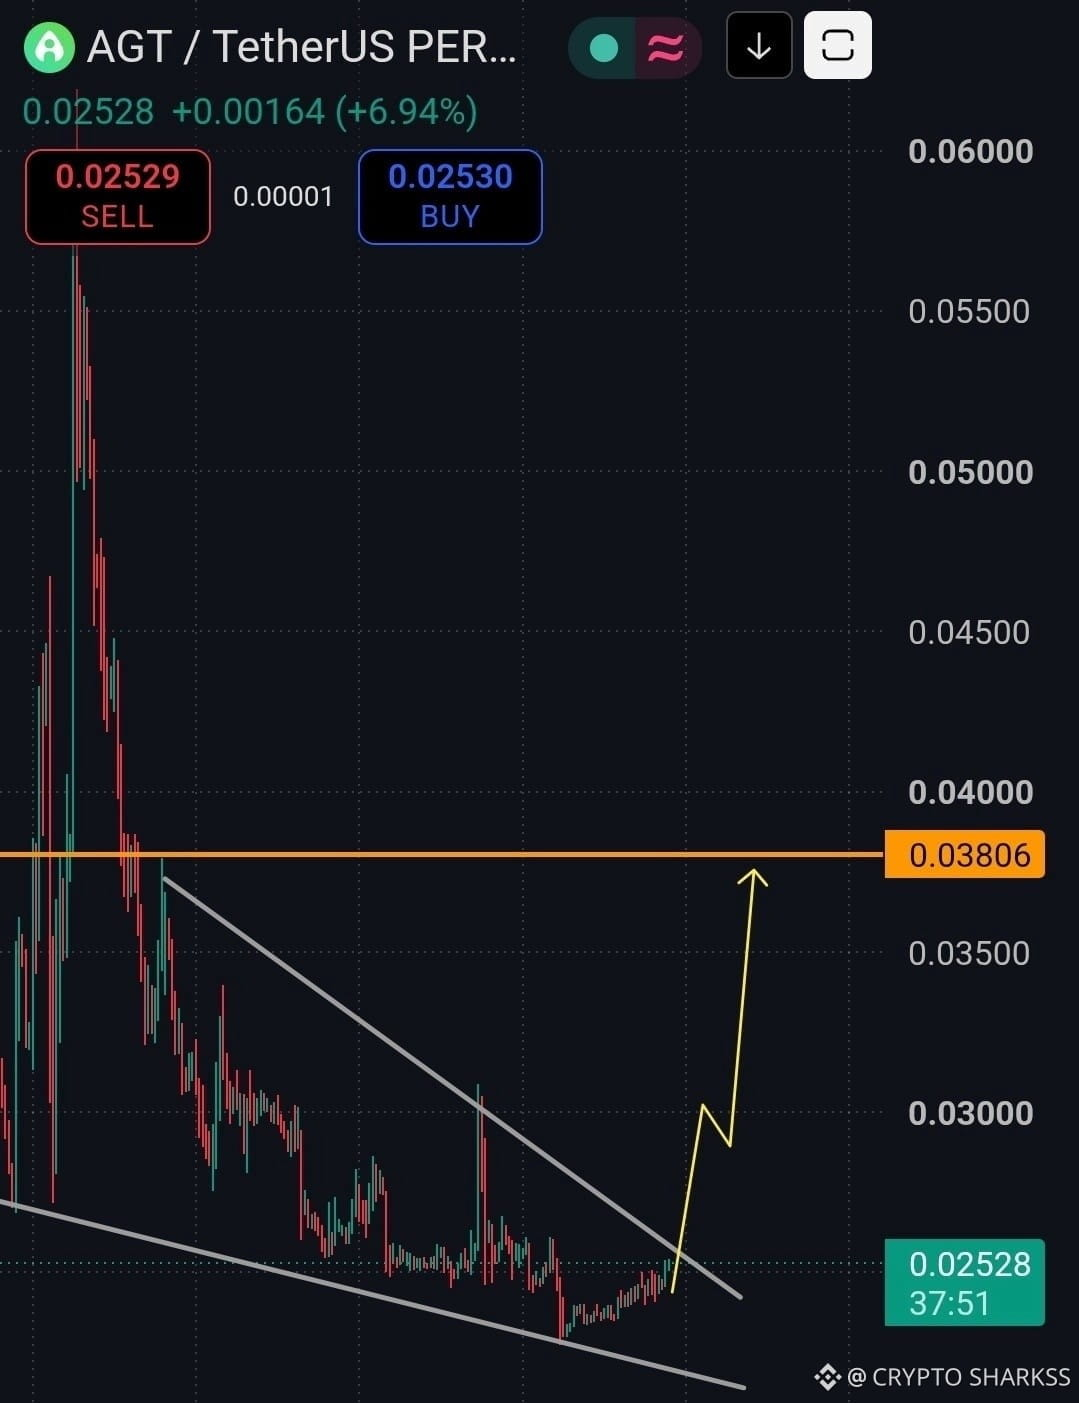
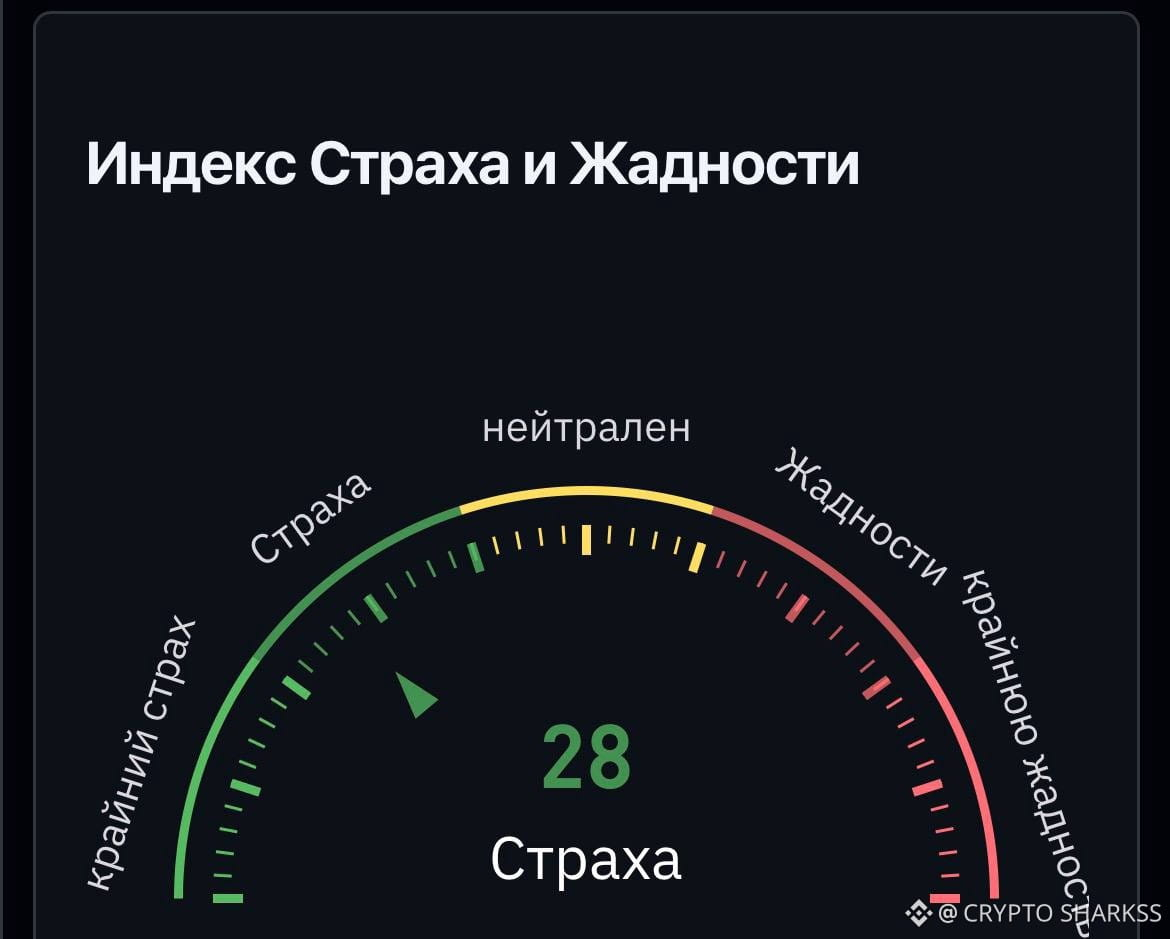
🐵 The Fear and Greed Index is currently at 28, indicating that fear persists in the market.
Market participants remain fairly cautious, so we can’t rule out increased volatility and localized sell-offs. At the same time, such sentiment may create good opportunities to build positions if the market provides the right confirmation🆕
🐵 The Fear and Greed Index is currently at 28, indicating that fear persists in the market.
Market participants remain fairly cautious, so we can’t rule out increased volatility and localized sell-offs. At the same time, such sentiment may create good opportunities to build positions if the market provides the right confirmation🆕
Market participants remain fairly cautious, so we can’t rule out increased volatility and localized sell-offs. At the same time, such sentiment may create good opportunities to build positions if the market provides the right confirmation🆕
1
2
66
Log in to explore more content
Join global crypto users on Binance Square
⚡️ Get latest and useful information about crypto.
💬 Trusted by the world’s largest crypto exchange.
👍 Discover real insights from verified creators.
Email / Phone number
Trending Topics
HotCPIDecemberHikePriced
98,445 views
1,164 Discussing
CPI Market Watch | US CPI Rises 0.4% in October, Hotter Than 0.3% Forecast
Binance News
·27 Likes
·41.5k views
AnthropicRejectsIPODelayValuationinQuestion
222,282 views
1,860 Discussing
CanNvidiaEarningsEaseMarketConcerns?
36,885 views
537 Discussing