

CRYPTO XN
3 Posts

CRYPTO XN
Report
Block User
0 Following
0 Followers
2 Liked
Posts
·
--
BTC /2026/11/01Technical analysis of the BTC/USDT pair
$BTC #BTC
Trend: Bitcoin’s current price is 77987.86, indicating a short-term downward trend, with a decline of 2.70% over the week and 7.73% over the month. This downward trend reflects weak buying momentum.
Support and resistance: The main support level over the past 30 days is 76325.98, while the resistance level is 81971. If the price manages to rise above the resistance level, this could indicate a potential trend reversal. However, if the price falls below the support level, it may move toward lower levels.
BTC /2026/11/01
Technical analysis of the BTC/USDT pair
$BTC #BTC
Trend: Bitcoin’s current price is 77987.86, indicating a short-term downward trend, with a decline of 2.70% over the week and 7.73% over the month. This downward trend reflects weak buying momentum.
Support and resistance: The main support level over the past 30 days is 76325.98, while the resistance level is 81971. If the price manages to rise above the resistance level, this could indicate a potential trend reversal. However, if the price falls below the support level, it may move toward lower levels.
2
260
·
--

Article
BTC$BTC
AI Analysis
Technical Analysis of Bitcoin (BTCUSDT)
Direction: The current Bitcoin price stands at $77,510.77, with a slight 0.18% change over 24 hours, but it has fallen 4.18% over the week and 8.68% over the month. This indicates a short-term bearish trend, with the price trading below the 20- and 50-day simple moving averages (SMAs), reinforcing the bearish trend.
BTC
$BTC
AI Analysis
Technical Analysis of Bitcoin (BTCUSDT)
Direction: The current Bitcoin price stands at $77,510.77, with a slight 0.18% change over 24 hours, but it has fallen 4.18% over the week and 8.68% over the month. This indicates a short-term bearish trend, with the price trading below the 20- and 50-day simple moving averages (SMAs), reinforcing the bearish trend.
95
·
--
$BTC
{spot}(BTCUSDT)
#BTC AI analysis
Trend Analysis:
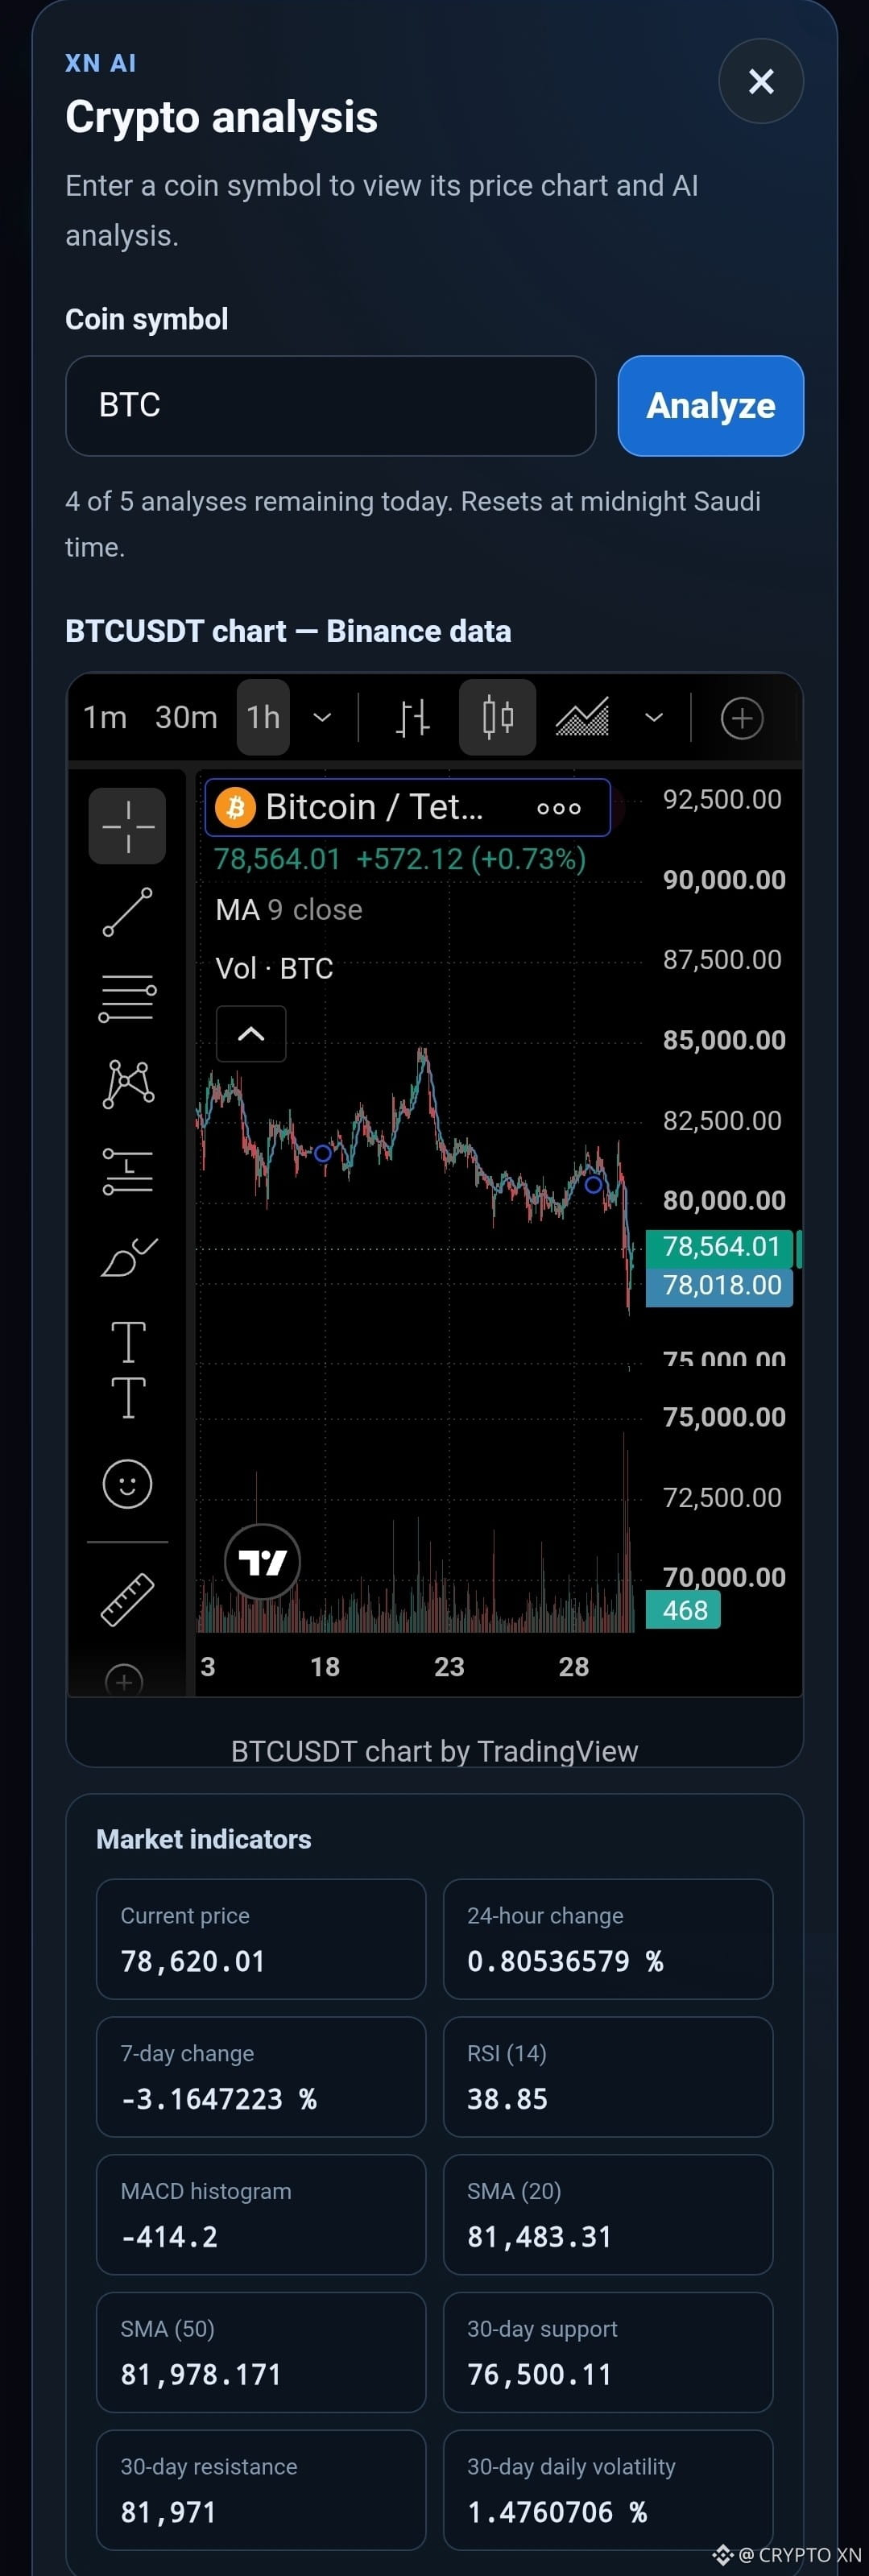
As of the latest close on October 30, 2026, Bitcoin (BTC) is trading at 78,620.01 USDT, reflecting a slight increase of 0.81% over the past 24 hours. However, the asset has experienced a decline of approximately 3.16% over the past week and about 5.98% over the last 30 days. This suggests a bearish trend in the medium term, as the price is below both the 20-day (SMA20) and 50-day (SMA50) simple moving averages, which are currently at 81,483.31 and 81,978.17, respectively.
Support and Resistance:
The immediate support level is identified at 76,500.11, which has held over the past 30 days. Conversely, the resistance level is situated at 81,971. If the price breaks below the support, it may indicate further bearish momentum. Conversely, a move above the resistance could signal a potential reversal or bullish trend.
RSI and MACD:
The 14-day Relative Strength Index (RSI) is at 38.85, suggesting that BTC is nearing oversold conditions, which could indicate a potential price rebound if buying interest increases. The MACD shows a bearish crossover, with the MACD line at -784.06 below the signal line at -369.86, indicating continued downward momentum in the short term.
Volatility:
The 30-day daily volatility is relatively low at 1.48%, suggesting that price movements have been stable but could change rapidly if market conditions shift.
Conditional Scenarios:
A bullish scenario would involve a breakout above the resistance level of 81,971, potentially leading to a test of the SMA20 and SMA50. Conversely, a bearish scenario could see a decline below the support level of 76,500.11, which may trigger further selling pressure.
Disclaimer:
This analysis is for educational purposes only and does not constitute investment advice. Past performance is not indicative of future results, and there are no guarantees of returns. Always conduct your own research before making investment decisions.
$BTC
#BTC AI analysis
Trend Analysis:
As of the latest close on October 30, 2026, Bitcoin (BTC) is trading at 78,620.01 USDT, reflecting a slight increase of 0.81% over the past 24 hours. However, the asset has experienced a decline of approximately 3.16% over the past week and about 5.98% over the last 30 days. This suggests a bearish trend in the medium term, as the price is below both the 20-day (SMA20) and 50-day (SMA50) simple moving averages, which are currently at 81,483.31 and 81,978.17, respectively.
Support and Resistance:
The immediate support level is identified at 76,500.11, which has held over the past 30 days. Conversely, the resistance level is situated at 81,971. If the price breaks below the support, it may indicate further bearish momentum. Conversely, a move above the resistance could signal a potential reversal or bullish trend.
RSI and MACD:
The 14-day Relative Strength Index (RSI) is at 38.85, suggesting that BTC is nearing oversold conditions, which could indicate a potential price rebound if buying interest increases. The MACD shows a bearish crossover, with the MACD line at -784.06 below the signal line at -369.86, indicating continued downward momentum in the short term.
Volatility:
The 30-day daily volatility is relatively low at 1.48%, suggesting that price movements have been stable but could change rapidly if market conditions shift.
Conditional Scenarios:
A bullish scenario would involve a breakout above the resistance level of 81,971, potentially leading to a test of the SMA20 and SMA50. Conversely, a bearish scenario could see a decline below the support level of 76,500.11, which may trigger further selling pressure.
Disclaimer:
This analysis is for educational purposes only and does not constitute investment advice. Past performance is not indicative of future results, and there are no guarantees of returns. Always conduct your own research before making investment decisions.
69
Log in to explore more content
Join global crypto users on Binance Square
⚡️ Get latest and useful information about crypto.
💬 Trusted by the world’s largest crypto exchange.
👍 Discover real insights from verified creators.
Email / Phone number
Trending Topics
BinanceProcesses$4.65BWithdrawals
20,305 views
107 Discussing
Binance Processes $4.65 Billion in Withdrawals After Reopening, Net Outflow of $3.64 Billion Equals 2.1% of Its $171 Billion in Assets
Binance News
·38 Likes
·10.9k views
WithdrawalsBack: 15 networks live
7,234 views
126 Discussing
BinanceUpdatesProofofReservesAddresses
115,269 views
1,512 Discussing