

CoinsProbe
3.5k Posts

CoinsProbe
 Square Verified+
Report
Block User
Coinsprobe is the leading cryptocurrency platform that provides the latest news, breakouts, price predictions, airdrops, events, and ICO presales.
1 Following
9.8K+ Followers
12.7K+ Liked
Posts
·
--
Article
XRP, HYPE, and ENA — Key Levels to Watch Ahead of the FOMCKey Highlights
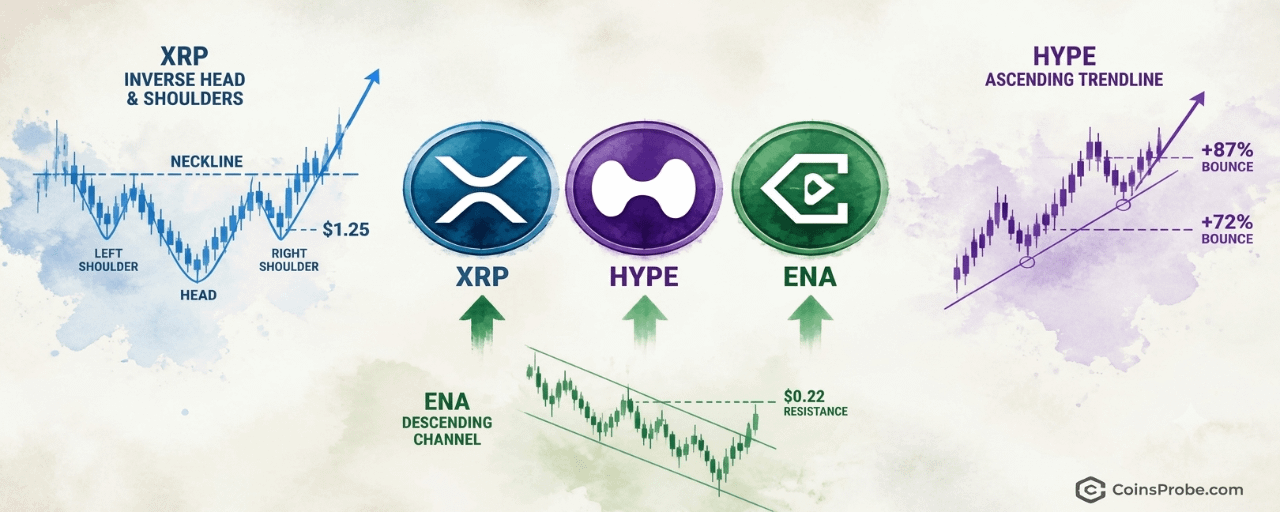
XRP trading at $1.33 (+2.32%) — inverse H&S forming on daily chart with right shoulder at $1.25 support per @alichartsHYPE at $81.26 testing rising trendline for third time — prior two touches produced +87.17% and +72.16% ralliesENA up 18% in days, testing descending channel upper boundary at $0.22 — breakout targets $0.24 then $0.27All three setups unconfirmed — FOMC outcome is the immediate macro catalyst that could resolve each pattern
With the Federal Open Market Committee meeting approaching, three altcoins are at technically critical junctures. XRP is trading at $1.33 — up 2.32% in the past 24 hours — with a market cap of approximately $84.1 billion and $1.53 billion in 24-hour volume. Hyperliquid (HYPE) is bouncing from a rising trendline near $81. Ethena (ENA) is testing the upper boundary of a descending channel at $0.21. All three are at levels that will define near-term trajectory — and chart analyst Ali Martinez (@alicharts) has mapped exactly what needs to happen at each.
In a five-part thread published on October 27, 2026 and titled “Altcoins Bounce Ahead of the FOMC,” Martinez lays out the decision points for XRP, HYPE, and ENA with surgical precision — identifying key support levels, pattern structures, and the specific price that separates a continuation from a breakdown. The timing matters: FOMC meetings historically inject directional volatility into risk assets, and altcoins with defined technical structures tend to resolve sharply in either direction.
Signal 1 — XRP: Inverse Head-and-Shoulders Forming, $1.25 Is the Right Shoulder
On the daily chart, Martinez identifies an inverse head-and-shoulders bottom forming in XRP. The pattern’s structure — left shoulder, a deeper middle low (the head), and a developing right shoulder — places the current right shoulder near the $1.25 support level. At time of writing, XRP is trading at $1.33, which sits above that $1.25 support but still below the neckline at $1.55. The chart marks the current price at $1.32 relative to the pattern’s key levels of $0.90, $1.15, $1.32, $1.55, $1.80, and $2.10.
XRP Daily Chart | Source: @alicharts (X)
The inverse head-and-shoulders is a reversal pattern — it signals that sellers have exhausted a downtrend and buyers are beginning to establish a higher low. In this case, the right shoulder’s hold at $1.25 is not merely a support test; it is the structural condition required for the pattern to remain valid. Martinez states clearly: if $1.25 holds, XRP could move toward the neckline at $1.55. A daily close above $1.55 would technically confirm the pattern, with a measured breakout target at $2.10. If $1.25 fails, Martinez flags the next significant level at $0.98.
The pattern is still forming — no neckline breakout has occurred. XRP’s position at $1.33 means it has recovered from the right shoulder zone but has not yet tested the $1.55 neckline. The critical near-term question is whether the FOMC catalyst drives enough momentum to push a daily close above $1.55, or whether macro uncertainty sends XRP back to retest $1.25.
Bullish Scenario
$1.25 holds as the right shoulder base → XRP advances to test the $1.55 neckline → a confirmed daily close above $1.55 opens the measured move target of $2.10.
Bearish Scenario
A daily close below $1.25 invalidates the inverse head-and-shoulders structure → next meaningful support at $0.98.
Signal 2 — HYPE: Third Trendline Touch After +87% and +72% Prior Bounces
Hyperliquid has bounced from approximately $74, a level coinciding with a rising trendline in place since late January 2026. Martinez notes that this trendline has now been tested three times — and the two prior touches produced documented rallies of +87.17% and +72.16% respectively. The current price of $81.26 sits precisely at the trendline, with an upward arrow on the chart signaling that Martinez views this as a potential third bounce setup.
HYPE Daily Chart | Source: @alicharts (X)
The chart displays price labels at $18, $27, $44, $63, $81.26, and $110 — the latter being the identified target if the trendline holds. The two prior percentage moves are annotated directly on the chart: the first bounce from the early May region (+87.17%) and the second from the July region (+72.16%). Both are completed historical moves, not projections. The current setup is structurally analogous — a third touch at rising support — but the pattern remains unconfirmed until price sustains above the trendline and clears recent highs.
Martinez sets the upside target at $110 if the trendline holds. If it breaks, the next meaningful downside levels are $67 and then $60. Given the prior two instances each produced rallies exceeding 70%, the trendline’s track record is the core of the setup — but past performance at this support does not guarantee the third instance follows the same path. The FOMC outcome is an immediate macro variable that could determine whether this third test holds or breaks.
Altcoin momentum strategies with defined trendlines are explored further in CoinsProbe’s coverage of AI Agent Altcoins Losing Momentum — VVV, TRAC, and ARC Face Key Breakdown Levels, where similar trendline break scenarios are mapped.
Bullish Scenario
Rising trendline holds at $74–$81 → HYPE advances toward $110, following the pattern established by the prior +87% and +72% bounces.
Bearish Scenario
A sustained break below the rising trendline → $67 becomes the first downside target, followed by $60.
Signal 3 — ENA: +18% in Days, Now Testing the Channel’s Ceiling at $0.22
Ethena has gained +18% over the past few days, per Martinez’s thread, pushing price to test the upper boundary of a descending parallel channel on the 4-hour chart. The current price is marked at $0.210, pressing directly against the channel’s upper trendline — the same boundary that has capped rallies throughout the pattern’s duration. The chart spans from approximately the 10th through the 28th, with key price levels at $0.15, $0.18, and $0.21.
ENA 4H Chart | Source: @alicharts (X)
A descending channel is defined by two parallel downward-sloping trendlines — the upper acting as resistance, the lower as support. Price oscillating between them is range-bound, bearish in structure until a confirmed break above the upper boundary. Martinez’s analysis identifies $0.22 as the specific level requiring a break for bullish confirmation — meaning the pattern is not resolved at $0.210. The 18% gain has brought ENA to the decision point, not through it.
If ENA closes above $0.22 on the 4-hour chart, Martinez flags the next targets at $0.24 and then $0.27. A failure to break — meaning price gets rejected at the upper boundary — returns the mid-channel level of $0.18 as the near-term downside. The pattern remains forming: ENA is at a critical inflection, not a confirmed breakout. The FOMC catalyst could provide the volatility needed to resolve this channel definitively in one direction.
Bullish Scenario
4-hour close above $0.22 confirms the channel breakout → targets at $0.24 and $0.27 open progressively.
Bearish Scenario
Rejection at the $0.22 upper channel boundary → price returns to mid-channel support at $0.18.
The FOMC Variable — Why Timing Matters
Martinez frames all three setups explicitly in the context of the approaching FOMC decision. All three patterns share a common structural feature: they are at decision points where either a macro tailwind or headwind will force resolution. Risk-on FOMC outcomes — rate cuts or dovish signals — have historically provided the directional liquidity needed to clear resistance levels that have resisted organic buying. Risk-off outcomes — hawkish surprises or no-cut reaffirmations — tend to break supports that were holding on sentiment alone.
For XRP at $1.33, the question is whether FOMC-driven momentum can push a daily close above $1.55. For HYPE at $81.26, whether it can sustain the trendline while navigating macro uncertainty. For ENA, whether the 18% pre-FOMC move has enough follow-through to close the 4-hour bar above $0.22. None of these are confirmed. All three are live. Macro context — including the FOMC rate outlook — remains a key variable, with Bitcoin market dynamics adding additional macro overlay as covered in Bitcoin Trader Realized Price Rising Again — Dynamic Support in Bull Corrections.
Martinez’s thread is a structured pre-FOMC watchlist — not a prediction. The analyst identifies the levels that matter and lets the market answer. Watch $1.25 and $1.55 for XRP, $74 and $110 for HYPE, and $0.22 and $0.18 for ENA as the levels that will define whether these setups resolve bullishly or fail into the next leg lower.
Disclaimer: The views and analysis presented in this article are for informational purposes only and reflect the author’s perspective, not financial advice. Technical patterns and indicators discussed are subject to market volatility and may or may not yield the anticipated results. Investors are advised to exercise caution, conduct independent research, and make decisions aligned with their individual risk tolerance.
XRP, HYPE, and ENA — Key Levels to Watch Ahead of the FOMC
Key Highlights
XRP trading at $1.33 (+2.32%) — inverse H&S forming on daily chart with right shoulder at $1.25 support per @alichartsHYPE at $81.26 testing rising trendline for third time — prior two touches produced +87.17% and +72.16% ralliesENA up 18% in days, testing descending channel upper boundary at $0.22 — breakout targets $0.24 then $0.27All three setups unconfirmed — FOMC outcome is the immediate macro catalyst that could resolve each pattern
With the Federal Open Market Committee meeting approaching, three altcoins are at technically critical junctures. XRP is trading at $1.33 — up 2.32% in the past 24 hours — with a market cap of approximately $84.1 billion and $1.53 billion in 24-hour volume. Hyperliquid (HYPE) is bouncing from a rising trendline near $81. Ethena (ENA) is testing the upper boundary of a descending channel at $0.21. All three are at levels that will define near-term trajectory — and chart analyst Ali Martinez (@alicharts) has mapped exactly what needs to happen at each.
In a five-part thread published on October 27, 2026 and titled “Altcoins Bounce Ahead of the FOMC,” Martinez lays out the decision points for XRP, HYPE, and ENA with surgical precision — identifying key support levels, pattern structures, and the specific price that separates a continuation from a breakdown. The timing matters: FOMC meetings historically inject directional volatility into risk assets, and altcoins with defined technical structures tend to resolve sharply in either direction.
Signal 1 — XRP: Inverse Head-and-Shoulders Forming, $1.25 Is the Right Shoulder
On the daily chart, Martinez identifies an inverse head-and-shoulders bottom forming in XRP. The pattern’s structure — left shoulder, a deeper middle low (the head), and a developing right shoulder — places the current right shoulder near the $1.25 support level. At time of writing, XRP is trading at $1.33, which sits above that $1.25 support but still below the neckline at $1.55. The chart marks the current price at $1.32 relative to the pattern’s key levels of $0.90, $1.15, $1.32, $1.55, $1.80, and $2.10.
XRP Daily Chart | Source: @alicharts (X)
The inverse head-and-shoulders is a reversal pattern — it signals that sellers have exhausted a downtrend and buyers are beginning to establish a higher low. In this case, the right shoulder’s hold at $1.25 is not merely a support test; it is the structural condition required for the pattern to remain valid. Martinez states clearly: if $1.25 holds, XRP could move toward the neckline at $1.55. A daily close above $1.55 would technically confirm the pattern, with a measured breakout target at $2.10. If $1.25 fails, Martinez flags the next significant level at $0.98.
The pattern is still forming — no neckline breakout has occurred. XRP’s position at $1.33 means it has recovered from the right shoulder zone but has not yet tested the $1.55 neckline. The critical near-term question is whether the FOMC catalyst drives enough momentum to push a daily close above $1.55, or whether macro uncertainty sends XRP back to retest $1.25.
Bullish Scenario
$1.25 holds as the right shoulder base → XRP advances to test the $1.55 neckline → a confirmed daily close above $1.55 opens the measured move target of $2.10.
Bearish Scenario
A daily close below $1.25 invalidates the inverse head-and-shoulders structure → next meaningful support at $0.98.
Signal 2 — HYPE: Third Trendline Touch After +87% and +72% Prior Bounces
Hyperliquid has bounced from approximately $74, a level coinciding with a rising trendline in place since late January 2026. Martinez notes that this trendline has now been tested three times — and the two prior touches produced documented rallies of +87.17% and +72.16% respectively. The current price of $81.26 sits precisely at the trendline, with an upward arrow on the chart signaling that Martinez views this as a potential third bounce setup.
HYPE Daily Chart | Source: @alicharts (X)
The chart displays price labels at $18, $27, $44, $63, $81.26, and $110 — the latter being the identified target if the trendline holds. The two prior percentage moves are annotated directly on the chart: the first bounce from the early May region (+87.17%) and the second from the July region (+72.16%). Both are completed historical moves, not projections. The current setup is structurally analogous — a third touch at rising support — but the pattern remains unconfirmed until price sustains above the trendline and clears recent highs.
Martinez sets the upside target at $110 if the trendline holds. If it breaks, the next meaningful downside levels are $67 and then $60. Given the prior two instances each produced rallies exceeding 70%, the trendline’s track record is the core of the setup — but past performance at this support does not guarantee the third instance follows the same path. The FOMC outcome is an immediate macro variable that could determine whether this third test holds or breaks.
Altcoin momentum strategies with defined trendlines are explored further in CoinsProbe’s coverage of AI Agent Altcoins Losing Momentum — VVV, TRAC, and ARC Face Key Breakdown Levels, where similar trendline break scenarios are mapped.
Bullish Scenario
Rising trendline holds at $74–$81 → HYPE advances toward $110, following the pattern established by the prior +87% and +72% bounces.
Bearish Scenario
A sustained break below the rising trendline → $67 becomes the first downside target, followed by $60.
Signal 3 — ENA: +18% in Days, Now Testing the Channel’s Ceiling at $0.22
Ethena has gained +18% over the past few days, per Martinez’s thread, pushing price to test the upper boundary of a descending parallel channel on the 4-hour chart. The current price is marked at $0.210, pressing directly against the channel’s upper trendline — the same boundary that has capped rallies throughout the pattern’s duration. The chart spans from approximately the 10th through the 28th, with key price levels at $0.15, $0.18, and $0.21.
ENA 4H Chart | Source: @alicharts (X)
A descending channel is defined by two parallel downward-sloping trendlines — the upper acting as resistance, the lower as support. Price oscillating between them is range-bound, bearish in structure until a confirmed break above the upper boundary. Martinez’s analysis identifies $0.22 as the specific level requiring a break for bullish confirmation — meaning the pattern is not resolved at $0.210. The 18% gain has brought ENA to the decision point, not through it.
If ENA closes above $0.22 on the 4-hour chart, Martinez flags the next targets at $0.24 and then $0.27. A failure to break — meaning price gets rejected at the upper boundary — returns the mid-channel level of $0.18 as the near-term downside. The pattern remains forming: ENA is at a critical inflection, not a confirmed breakout. The FOMC catalyst could provide the volatility needed to resolve this channel definitively in one direction.
Bullish Scenario
4-hour close above $0.22 confirms the channel breakout → targets at $0.24 and $0.27 open progressively.
Bearish Scenario
Rejection at the $0.22 upper channel boundary → price returns to mid-channel support at $0.18.
The FOMC Variable — Why Timing Matters
Martinez frames all three setups explicitly in the context of the approaching FOMC decision. All three patterns share a common structural feature: they are at decision points where either a macro tailwind or headwind will force resolution. Risk-on FOMC outcomes — rate cuts or dovish signals — have historically provided the directional liquidity needed to clear resistance levels that have resisted organic buying. Risk-off outcomes — hawkish surprises or no-cut reaffirmations — tend to break supports that were holding on sentiment alone.
For XRP at $1.33, the question is whether FOMC-driven momentum can push a daily close above $1.55. For HYPE at $81.26, whether it can sustain the trendline while navigating macro uncertainty. For ENA, whether the 18% pre-FOMC move has enough follow-through to close the 4-hour bar above $0.22. None of these are confirmed. All three are live. Macro context — including the FOMC rate outlook — remains a key variable, with Bitcoin market dynamics adding additional macro overlay as covered in Bitcoin Trader Realized Price Rising Again — Dynamic Support in Bull Corrections.
Martinez’s thread is a structured pre-FOMC watchlist — not a prediction. The analyst identifies the levels that matter and lets the market answer. Watch $1.25 and $1.55 for XRP, $74 and $110 for HYPE, and $0.22 and $0.18 for ENA as the levels that will define whether these setups resolve bullishly or fail into the next leg lower.
Disclaimer: The views and analysis presented in this article are for informational purposes only and reflect the author’s perspective, not financial advice. Technical patterns and indicators discussed are subject to market volatility and may or may not yield the anticipated results. Investors are advised to exercise caution, conduct independent research, and make decisions aligned with their individual risk tolerance.
278
·
--
Article
Bitcoin OI Hits 36.7% in 2026 — Already Above the 6-Year MedianKey Highlights
Bitcoin OI in BTC terms rose +36.7% in 2026, above the 6-year historical median year-end reading of +26.4% per @Alphractal2026 OI sits at the 67th percentile as of October 27th — above 4 of 6 comparable prior years with Q4 still openMost correlated prior year is 2025 (r=0.79), which finished at -12.5%; second-closest is 2022 (r=0.62), which finished at +69.9%Rising BTC-denominated OI confirms expanding derivatives positioning — direction of those positions remains unconfirmed
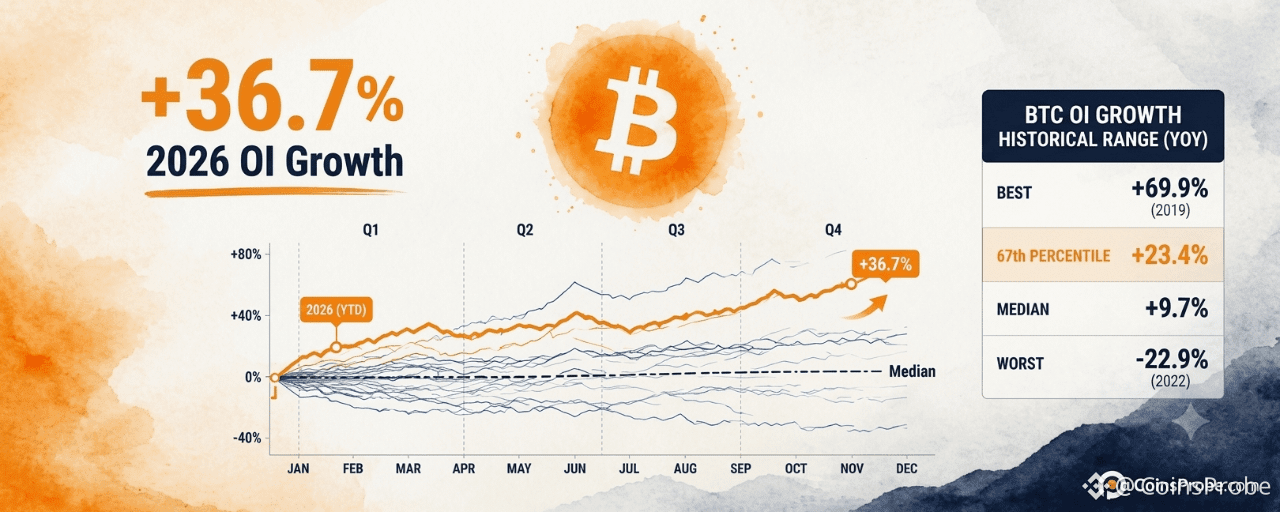
Bitcoin is trading at approximately $80,865 — up 1.45% in the past 24 hours — with a total market cap of $1.63 trillion. Beneath that price action, a structural derivatives signal is developing: Bitcoin’s Open Interest, measured in BTC-denominated terms, has already risen +36.7% in 2026, clearing the six-year historical median year-end change of +26.4% with the full fourth quarter still ahead.
The observation comes from Alphractal (@Alphractal), who published the analysis on October 27, 2026, alongside two comparative cycle charts. Their post notes that 2026 OI trajectory has already surpassed what most years finished at — and the year still has two months remaining. Alphractal is careful to flag that trajectory correlation does not equal outcome, and that rising OI amid uncertainty can signal expanding short positioning or elevated leverage as much as bullish conviction.
What Bitcoin’s OI-in-Coins Metric Actually Measures
Open Interest measured in BTC — not USD — strips out dollar price appreciation. When OI in BTC rises, it means the raw number of coins committed to open futures and perpetual contracts is expanding. This matters because a USD-denominated OI rise can be manufactured entirely by a price rally; a BTC-denominated OI rise cannot. It reflects actual growth in derivatives positioning at the network level.
The six-year dataset Alphractal tracks shows OI increased in 4 of the 6 prior years on this measure. The best year was 2022 at +69.9%. The worst was 2023 at -22.9%. The median finishing value across all six years is +26.4%.
2026 at the 67th Percentile — With Q4 Remaining
As of October 27th, 2026’s BTC-denominated OI growth stands at +36.7% — placing it at the 67th percentile of all six comparable years at this point on the calendar. That means 2026 is already tracking above roughly two-thirds of all prior full-year readings, and the year is not finished.
Chart 1 of 2: Chart Analysis | Source: @Alphractal (X)
The two charts shared by Alphractal plot each year’s OI path from January through December as indexed lines diverging from a common starting point. The 2026 orange line surged sharply in the April window, consolidated through mid-year at an elevated level, then declined toward the median path before recovering upward into Q4. As of late October, the 2026 line sits clearly above the median path — +36.7% versus the historical median of +26.4% — confirming the breakout above average-year behavior is already in place, not merely projected.
Source: @Alphractal (X)
The most statistically correlated prior year is 2025, with a path correlation of r=0.79. The second-closest match is 2022, at r=0.62. Alphractal explicitly warns that high correlation does not mean identical outcome: 2025 finished the full year at -12.5%, while 2022 finished at +69.9%. Two years with similar trajectory shapes produced radically opposite final readings. That warning is core to how this data should be interpreted.
What Expanding OI Signals — And What It Does Not
Rising BTC-denominated OI signals one thing with certainty: derivatives participation is increasing. More BTC is committed to open positions than at the start of the year. What it does not confirm is the direction of those positions. Alphractal explicitly notes that rising OI in uncertain market conditions can reflect expanding short positioning or elevated leverage just as readily as bullish accumulation. This is the critical distinction between an OI metric and a directional signal.
The data does confirm that 2026 has already built a new structural baseline for derivatives activity — one that exceeds most prior years before the final quarter closes. Whether that base becomes the foundation for a year-end move comparable to 2022’s +69.9%, or reverses in Q4 as 2025’s -12.5% outcome demonstrated, depends on whether the positioning is long-heavy or short-heavy — a question the OI metric alone cannot answer. On-chain data tracking UTXO age bands and whale movement patterns would need to be cross-referenced to assess the directional composition of this OI expansion.
Historical Year-End Outcomes — The Range That Defines the Stakes
Year Full-Year OI Change (BTC) 2022 +69.9% 2021 +49.5% 2024 +43.1% Median +26.4% 2020 +9.7% 2025 -12.5% 2023 -22.9% 2026 (YTD) +36.7%
Source: @Alphractal (X), October 27, 2026
2026 currently sits between 2024’s +43.1% and the historical median of +26.4%. With Q4 still open, any directional move in either spot or futures market will pull 2026’s final reading toward one of the historical bookends — either the upper cluster of +43%–+70% or the negative outcomes of 2023 and 2025. Institutional activity in Q4, such as miner and corporate treasury behavior, will likely determine which cluster 2026 ultimately joins.
Bullish Scenario
If the expanded OI reflects net long positioning and Q4 price action holds above current levels, 2026 could close in the upper historical cluster — tracking closer to 2024’s +43.1% or 2022’s +69.9% outcome. That would confirm 2026 as a structurally above-average year for derivatives growth.
Bearish Scenario
If the OI expansion reflects leveraged short positioning or over-leveraged longs that unwind into year-end, the 2025 path (r=0.79 correlation, -12.5% final reading) becomes the cautionary precedent. A Q4 deleveraging event could pull the +36.7% reading negative before December closes.
Alphractal’s analysis does not offer a price target, a support level, or a directional trade recommendation. The note raises a pointed structural question: is 2026 building new derivatives infrastructure, or repeating a familiar pre-Q4 pattern that resolves sharply in either direction? That question remains open.
The OI-in-coins metric has already answered one question definitively — 2026 derivatives activity is above average. The direction of that activity, and where it ends on December 31, remains the only number that matters. Watch the BTC-denominated OI reading on Alphractal’s live tracker: if it sustains above +36.7% through November, the upper historical cluster remains in range. If it breaks back toward the median, the 2025 correlation becomes the dominant risk scenario.
Disclaimer: The views and analysis presented in this article are for informational purposes only and reflect the author’s perspective, not financial advice. Technical patterns and indicators discussed are subject to market volatility and may or may not yield the anticipated results. Investors are advised to exercise caution, conduct independent research, and make decisions aligned with their individual risk tolerance.
Bitcoin OI Hits 36.7% in 2026 — Already Above the 6-Year Median
Key Highlights
Bitcoin OI in BTC terms rose +36.7% in 2026, above the 6-year historical median year-end reading of +26.4% per @Alphractal2026 OI sits at the 67th percentile as of October 27th — above 4 of 6 comparable prior years with Q4 still openMost correlated prior year is 2025 (r=0.79), which finished at -12.5%; second-closest is 2022 (r=0.62), which finished at +69.9%Rising BTC-denominated OI confirms expanding derivatives positioning — direction of those positions remains unconfirmed
Bitcoin is trading at approximately $80,865 — up 1.45% in the past 24 hours — with a total market cap of $1.63 trillion. Beneath that price action, a structural derivatives signal is developing: Bitcoin’s Open Interest, measured in BTC-denominated terms, has already risen +36.7% in 2026, clearing the six-year historical median year-end change of +26.4% with the full fourth quarter still ahead.
The observation comes from Alphractal (@Alphractal), who published the analysis on October 27, 2026, alongside two comparative cycle charts. Their post notes that 2026 OI trajectory has already surpassed what most years finished at — and the year still has two months remaining. Alphractal is careful to flag that trajectory correlation does not equal outcome, and that rising OI amid uncertainty can signal expanding short positioning or elevated leverage as much as bullish conviction.
What Bitcoin’s OI-in-Coins Metric Actually Measures
Open Interest measured in BTC — not USD — strips out dollar price appreciation. When OI in BTC rises, it means the raw number of coins committed to open futures and perpetual contracts is expanding. This matters because a USD-denominated OI rise can be manufactured entirely by a price rally; a BTC-denominated OI rise cannot. It reflects actual growth in derivatives positioning at the network level.
The six-year dataset Alphractal tracks shows OI increased in 4 of the 6 prior years on this measure. The best year was 2022 at +69.9%. The worst was 2023 at -22.9%. The median finishing value across all six years is +26.4%.
2026 at the 67th Percentile — With Q4 Remaining
As of October 27th, 2026’s BTC-denominated OI growth stands at +36.7% — placing it at the 67th percentile of all six comparable years at this point on the calendar. That means 2026 is already tracking above roughly two-thirds of all prior full-year readings, and the year is not finished.
Chart 1 of 2: Chart Analysis | Source: @Alphractal (X)
The two charts shared by Alphractal plot each year’s OI path from January through December as indexed lines diverging from a common starting point. The 2026 orange line surged sharply in the April window, consolidated through mid-year at an elevated level, then declined toward the median path before recovering upward into Q4. As of late October, the 2026 line sits clearly above the median path — +36.7% versus the historical median of +26.4% — confirming the breakout above average-year behavior is already in place, not merely projected.
Source: @Alphractal (X)
The most statistically correlated prior year is 2025, with a path correlation of r=0.79. The second-closest match is 2022, at r=0.62. Alphractal explicitly warns that high correlation does not mean identical outcome: 2025 finished the full year at -12.5%, while 2022 finished at +69.9%. Two years with similar trajectory shapes produced radically opposite final readings. That warning is core to how this data should be interpreted.
What Expanding OI Signals — And What It Does Not
Rising BTC-denominated OI signals one thing with certainty: derivatives participation is increasing. More BTC is committed to open positions than at the start of the year. What it does not confirm is the direction of those positions. Alphractal explicitly notes that rising OI in uncertain market conditions can reflect expanding short positioning or elevated leverage just as readily as bullish accumulation. This is the critical distinction between an OI metric and a directional signal.
The data does confirm that 2026 has already built a new structural baseline for derivatives activity — one that exceeds most prior years before the final quarter closes. Whether that base becomes the foundation for a year-end move comparable to 2022’s +69.9%, or reverses in Q4 as 2025’s -12.5% outcome demonstrated, depends on whether the positioning is long-heavy or short-heavy — a question the OI metric alone cannot answer. On-chain data tracking UTXO age bands and whale movement patterns would need to be cross-referenced to assess the directional composition of this OI expansion.
Historical Year-End Outcomes — The Range That Defines the Stakes
Year Full-Year OI Change (BTC) 2022 +69.9% 2021 +49.5% 2024 +43.1% Median +26.4% 2020 +9.7% 2025 -12.5% 2023 -22.9% 2026 (YTD) +36.7%
Source: @Alphractal (X), October 27, 2026
2026 currently sits between 2024’s +43.1% and the historical median of +26.4%. With Q4 still open, any directional move in either spot or futures market will pull 2026’s final reading toward one of the historical bookends — either the upper cluster of +43%–+70% or the negative outcomes of 2023 and 2025. Institutional activity in Q4, such as miner and corporate treasury behavior, will likely determine which cluster 2026 ultimately joins.
Bullish Scenario
If the expanded OI reflects net long positioning and Q4 price action holds above current levels, 2026 could close in the upper historical cluster — tracking closer to 2024’s +43.1% or 2022’s +69.9% outcome. That would confirm 2026 as a structurally above-average year for derivatives growth.
Bearish Scenario
If the OI expansion reflects leveraged short positioning or over-leveraged longs that unwind into year-end, the 2025 path (r=0.79 correlation, -12.5% final reading) becomes the cautionary precedent. A Q4 deleveraging event could pull the +36.7% reading negative before December closes.
Alphractal’s analysis does not offer a price target, a support level, or a directional trade recommendation. The note raises a pointed structural question: is 2026 building new derivatives infrastructure, or repeating a familiar pre-Q4 pattern that resolves sharply in either direction? That question remains open.
The OI-in-coins metric has already answered one question definitively — 2026 derivatives activity is above average. The direction of that activity, and where it ends on December 31, remains the only number that matters. Watch the BTC-denominated OI reading on Alphractal’s live tracker: if it sustains above +36.7% through November, the upper historical cluster remains in range. If it breaks back toward the median, the 2025 correlation becomes the dominant risk scenario.
Disclaimer: The views and analysis presented in this article are for informational purposes only and reflect the author’s perspective, not financial advice. Technical patterns and indicators discussed are subject to market volatility and may or may not yield the anticipated results. Investors are advised to exercise caution, conduct independent research, and make decisions aligned with their individual risk tolerance.
107
·
--

Article
Bitcoin ETFs Pull $108.91M in a Day While Ethereum Bleeds $89.07MKey Highlights
Bitcoin ETFs logged +1,359 BTC ($108.91M) on Oct. 27 — reversing 56.6% of the prior seven-day $192.3M outflow in a single sessionBlackRock's IBIT added 1,381 BTC on the day — accounting for 101.6% of total Bitcoin ETF net inflow; all other products were flat or negativeEthereum ETFs shed 38,303 ETH ($89.07M) on Oct. 27, representing 46.8% of the full seven-day $190.12M outflow in one sessionCombined seven-day net outflows across Bitcoin and Ethereum ETFs totaled $382.42M as of Oct. 27
BREAKING
Bitcoin spot ETFs recorded a net inflow of 1,359 BTC — worth $108.91 million — on October 27, according to data published by Lookonchain. At the same moment, Ethereum spot ETFs registered the opposite: a single-day net outflow of 38,303 ETH, equivalent to $89.07 million leaving the product category.
At the time of writing, Bitcoin is trading at approximately $79,971, up 0.10% over the past 24 hours.
Bitcoin: One Day of Inflows Against a Week of Outflows
The October 27 inflow of $108.91M is a reversal in isolation — but the seven-day picture tells a different story. Over the prior week, Bitcoin ETFs collectively shed 2,399 BTC ($192.3 million), per Lookonchain. That means the single day’s inflow recovered roughly 56.6% of the seven-day outflow in BTC terms ($108.91M ÷ $192.3M), not a full reset.
Bitcoin ETFs Pull $108.91M in a Day While Ethereum Bleeds $8 | Source: @lookonchain (Telegram)
On the fund-level breakdown from the chart data, BlackRock’s IBIT drove the day’s positive print, adding 1,381 BTC on October 27 — accounting for 101.6% of the total daily net inflow of 1,359 BTC. Every other major product was flat or negative: Grayscale (GBTC + BTC) shed 16 BTC, while Fidelity’s FBTC, Bitwise’s BITB, and ARK 21Shares’ ARKB each posted zero flows on the day. The remaining funds collectively lost 6 BTC.
The concentration is stark: IBIT alone carried the entire Bitcoin ETF category on October 27. Without BlackRock’s 1,381 BTC purchase, the day would have printed a net outflow of approximately 22 BTC across all other products.
Over seven days, the divergence between IBIT and the rest widens further. IBIT added only 45 BTC on a net seven-day basis, while ARK 21Shares’ ARKB lost 1,229 BTC — the steepest seven-day outflow among named funds. Fidelity’s FBTC shed 500 BTC and Bitwise’s BITB lost 233 BTC over the same window. Total Bitcoin ETF holdings across all products stood at 1,276,550 BTC ($102.31 billion) as of October 27.
Ethereum: Both Timeframes in the Red
Ethereum ETFs offered no comparable bright spot. The 38,303 ETH daily outflow ($89.07M) sits inside a seven-day outflow of 81,754 ETH ($190.12 million) — meaning October 27 alone accounted for 46.8% of the entire week’s Ethereum ETF redemptions in ETH terms.
At the fund level, BlackRock’s ETHA was the dominant source of selling pressure, losing 45,243 ETH on October 27. That figure alone exceeds the total net Ethereum ETF outflow for the day (38,303 ETH), which means other funds provided partial offsets: Fidelity’s FETH added 7,020 ETH on the day, and Grayscale’s combined products (ETHE + ETH) shed only 79 ETH. Total Ethereum ETF holdings across all products stood at approximately 5,537,104 ETH based on the chart-reported fund-level data.
The seven-day Ethereum picture shows ETHA alone responsible for 102,251 ETH of outflows — more than the total category’s seven-day loss of 81,754 ETH — again offset partially by Fidelity’s FETH gaining 16,283 ETH and Grayscale’s combined products gaining 3,481 ETH over the week.
The Split in One Number
Combining both asset classes, spot ETF products across Bitcoin and Ethereum generated a combined single-day net flow of approximately +$19.84 million ($108.91M Bitcoin inflow minus $89.07M Ethereum outflow). Over seven days, combined net flows were deeply negative: Bitcoin’s $192.3M outflow plus Ethereum’s $190.12M outflow totals $382.42 million in net seven-day redemptions across both categories.
The October 27 data reflects a single session where institutional demand was concentrated in one fund (IBIT) and one asset (Bitcoin), while Ethereum ETF products continued a week-long redemption trend with no fund reversing it on a meaningful scale. Whether IBIT’s daily inflow represents the start of a sustained Bitcoin ETF re-accumulation phase — or a one-day reversion within a broader outflow trend — will be answered by the flow data in sessions ahead. Watch FBTC and ARKB seven-day flow direction as the secondary confirmation: both remained net negative over the week ending October 27.
**Disclaimer: **The views and analysis presented in this article are for informational purposes only and reflect the author’s perspective, not financial advice. Technical patterns and indicators discussed are subject to market volatility and may or may not yield the anticipated results. Investors are advised to exercise caution, conduct independent research, and make decisions aligned with their individual risk tolerance.
Bitcoin ETFs Pull $108.91M in a Day While Ethereum Bleeds $89.07M
Key Highlights
Bitcoin ETFs logged +1,359 BTC ($108.91M) on Oct. 27 — reversing 56.6% of the prior seven-day $192.3M outflow in a single sessionBlackRock's IBIT added 1,381 BTC on the day — accounting for 101.6% of total Bitcoin ETF net inflow; all other products were flat or negativeEthereum ETFs shed 38,303 ETH ($89.07M) on Oct. 27, representing 46.8% of the full seven-day $190.12M outflow in one sessionCombined seven-day net outflows across Bitcoin and Ethereum ETFs totaled $382.42M as of Oct. 27
BREAKING
Bitcoin spot ETFs recorded a net inflow of 1,359 BTC — worth $108.91 million — on October 27, according to data published by Lookonchain. At the same moment, Ethereum spot ETFs registered the opposite: a single-day net outflow of 38,303 ETH, equivalent to $89.07 million leaving the product category.
At the time of writing, Bitcoin is trading at approximately $79,971, up 0.10% over the past 24 hours.
Bitcoin: One Day of Inflows Against a Week of Outflows
The October 27 inflow of $108.91M is a reversal in isolation — but the seven-day picture tells a different story. Over the prior week, Bitcoin ETFs collectively shed 2,399 BTC ($192.3 million), per Lookonchain. That means the single day’s inflow recovered roughly 56.6% of the seven-day outflow in BTC terms ($108.91M ÷ $192.3M), not a full reset.
Bitcoin ETFs Pull $108.91M in a Day While Ethereum Bleeds $8 | Source: @lookonchain (Telegram)
On the fund-level breakdown from the chart data, BlackRock’s IBIT drove the day’s positive print, adding 1,381 BTC on October 27 — accounting for 101.6% of the total daily net inflow of 1,359 BTC. Every other major product was flat or negative: Grayscale (GBTC + BTC) shed 16 BTC, while Fidelity’s FBTC, Bitwise’s BITB, and ARK 21Shares’ ARKB each posted zero flows on the day. The remaining funds collectively lost 6 BTC.
The concentration is stark: IBIT alone carried the entire Bitcoin ETF category on October 27. Without BlackRock’s 1,381 BTC purchase, the day would have printed a net outflow of approximately 22 BTC across all other products.
Over seven days, the divergence between IBIT and the rest widens further. IBIT added only 45 BTC on a net seven-day basis, while ARK 21Shares’ ARKB lost 1,229 BTC — the steepest seven-day outflow among named funds. Fidelity’s FBTC shed 500 BTC and Bitwise’s BITB lost 233 BTC over the same window. Total Bitcoin ETF holdings across all products stood at 1,276,550 BTC ($102.31 billion) as of October 27.
Ethereum: Both Timeframes in the Red
Ethereum ETFs offered no comparable bright spot. The 38,303 ETH daily outflow ($89.07M) sits inside a seven-day outflow of 81,754 ETH ($190.12 million) — meaning October 27 alone accounted for 46.8% of the entire week’s Ethereum ETF redemptions in ETH terms.
At the fund level, BlackRock’s ETHA was the dominant source of selling pressure, losing 45,243 ETH on October 27. That figure alone exceeds the total net Ethereum ETF outflow for the day (38,303 ETH), which means other funds provided partial offsets: Fidelity’s FETH added 7,020 ETH on the day, and Grayscale’s combined products (ETHE + ETH) shed only 79 ETH. Total Ethereum ETF holdings across all products stood at approximately 5,537,104 ETH based on the chart-reported fund-level data.
The seven-day Ethereum picture shows ETHA alone responsible for 102,251 ETH of outflows — more than the total category’s seven-day loss of 81,754 ETH — again offset partially by Fidelity’s FETH gaining 16,283 ETH and Grayscale’s combined products gaining 3,481 ETH over the week.
The Split in One Number
Combining both asset classes, spot ETF products across Bitcoin and Ethereum generated a combined single-day net flow of approximately +$19.84 million ($108.91M Bitcoin inflow minus $89.07M Ethereum outflow). Over seven days, combined net flows were deeply negative: Bitcoin’s $192.3M outflow plus Ethereum’s $190.12M outflow totals $382.42 million in net seven-day redemptions across both categories.
The October 27 data reflects a single session where institutional demand was concentrated in one fund (IBIT) and one asset (Bitcoin), while Ethereum ETF products continued a week-long redemption trend with no fund reversing it on a meaningful scale. Whether IBIT’s daily inflow represents the start of a sustained Bitcoin ETF re-accumulation phase — or a one-day reversion within a broader outflow trend — will be answered by the flow data in sessions ahead. Watch FBTC and ARKB seven-day flow direction as the secondary confirmation: both remained net negative over the week ending October 27.
**Disclaimer: **The views and analysis presented in this article are for informational purposes only and reflect the author’s perspective, not financial advice. Technical patterns and indicators discussed are subject to market volatility and may or may not yield the anticipated results. Investors are advised to exercise caution, conduct independent research, and make decisions aligned with their individual risk tolerance.
648
·
--

Article
Bitcoin UTXO Age Bands Signal Incoming Rally — Here’s the On-Chain ProofKey Highlights
Bitcoin trades at $79,648 (-0.91% 24h) as CryptoQuant analyst @DanCoinInvestor flags a historic UTXO rotation signalWhen BTC held >18 months peaks then declines, a strong rally has followed in all three prior confirmed instances since 2015The fourth arc pattern is still forming — the signal is active but full cycle rotation has not yet concludedWatch the rate of decline in the 18-month-plus UTXO proportion alongside spot demand as the dual confirmation trigger
Bitcoin is trading at $79,648 — down 0.91% in the past 24 hours against a market cap of $1.6 trillion — and most short-term traders are focused on the price. The on-chain data tells a different, quieter story: a historically reliable rotation in long-term holder behavior is unfolding right now, and it has preceded every major Bitcoin rally in the past decade.
The signal comes from CryptoQuant analyst @DanCoinInvestor, published via CryptoQuant’s official channel on October 27, 2026. His observation is direct: “When the proportion of Bitcoin held for more than 18 months across the entire network rises and then starts to decline, a strong rally usually follows.” The chart shared with the post — spanning Bitcoin’s price history from 2015 through 2026 — shows this cycle playing out for a fourth consecutive time.
Bitcoin UTXO Age Bands Analysis | Source: @cryptoquant_com (X)
What the UTXO Age Band Metric Actually Measures
The metric at the center of this signal is the proportion of Bitcoin’s realized cap held in UTXOs aged 18 months or older — measuring what percentage of the network’s economic weight sits in coins that have not moved in a year and a half or more. This is not a price indicator. It is a behavioral indicator. It tracks the collective patience — or impatience — of Bitcoin’s longest-conviction holders.
When this proportion rises, long-term holders are accumulating and holding. New supply is being absorbed by participants who demonstrate, through on-chain behavior, that they are not selling. When the proportion subsequently declines, those same long-term holders begin distributing — but crucially, this distribution tends to coincide with fresh demand absorbing that supply at rising prices. The rotation from long-term holders to new buyers at higher prices is the structural engine of Bitcoin bull markets. DanCoinInvestor’s signal identifies the precise moment this engine switches on.
Four Cycles — Four Confirmed Rallies
The chart shared by CryptoQuant visualizes four distinct arc patterns in the 18-months-and-older UTXO band, each marked with a yellow arrow. The structure is consistent across all four instances: the blue band proportion rises over an accumulation phase, peaks, then turns downward — and each prior peak-and-decline has coincided with a strong Bitcoin price rally in the periods that followed. The chart covers 2015 through 2026, giving this pattern a ten-year track record across multiple market cycles, including the 2017 peak, the 2020–2021 bull run, and the 2024–2025 cycle.
The current reading — the fourth arrow on the chart — shows the 18-month-plus UTXO proportion at the tail end of its declining phase. According to the chart analysis, price is positioned at the declining phase of this fourth arc, near the 100K zone on the right axis, with the descending arrow still incomplete. The pattern is still forming. The full rotation has not yet concluded. But the directional signal — long-term holders beginning to release coins into a market preparing to absorb them — is active.
Why This Rotation Precedes Rallies — The Mechanism
The causal chain here is specific and worth stating explicitly. Long-term holders (those holding 18+ months) accumulated Bitcoin during prior bear markets and periods of consolidation. As price rises and new demand enters, these holders find willing buyers. The decline in the proportion of aged UTXOs reflects coins moving from dormant wallets into active circulation — being sold to new participants who believe the rally has further to run.
This is demand absorption at scale. When long-term supply rotation coincides with rising inflows from new buyers — retail, institutional, or ETF-driven — the net effect is upward price pressure. The aged UTXO band declining is not bearish. It is the supply-side signal that confirms a new demand cycle has begun. Without this rotation, rallies stall. With it, they tend to sustain. That is the structural logic behind DanCoinInvestor’s conclusion.
The Current Setup — Where the Signal Stands
Bitcoin’s price has spent recent sessions below the $80,000 threshold, with 24-hour volume at $26.5 billion — not a distress reading, but not a momentum print either. Against that backdrop, the on-chain signal is operating on a longer clock. The UTXO age band rotation does not produce same-day price reactions. It is a leading indicator with a lag measured in weeks to months, not hours. The four prior instances on the chart confirm this: the rally that follows the peak-and-decline in the aged band does not always begin immediately at the inflection point. It begins as new demand catches up to the available supply being rotated out.
The practical implication: the signal DanCoinInvestor identifies is an early-stage, not a breakout-confirmed reading. The pattern is still forming, which means the highest-conviction confirmation would come when the declining phase of the fourth arc accelerates and price begins to follow. Readers tracking broader signals around long-term holder behavior can cross-reference the XRP TD Sequential Buy Signal analysis for another instance of how cycle-based indicators build confirmation over time.
Bullish Scenario
If the fourth arc’s decline in the 18-month-plus UTXO band accelerates — matching the velocity of the three prior confirmed instances — and new demand continues to absorb the rotated supply, Bitcoin’s historical precedent across all four prior cycles points to a strong rally following the inflection. Each of the three prior arcs on the chart ended with a significant upward price move in the months that followed. A continuation of the current pattern places Bitcoin on the same structural path.
Bearish Scenario
If the declining phase of the UTXO arc stalls or reverses — meaning long-term holders stop distributing and re-enter accumulation mode without new demand absorbing supply — the rotation signal fails to complete. A stall in the arc would indicate that holders are withdrawing from the market rather than selling into strength, which historically correlates with continued consolidation or price weakness rather than a rally. Loss of the $79,000 level with no recovery in aged UTXO rotation would be the metric to watch for early warning.
What This Signal Says — And What It Doesn’t
The UTXO age band rotation is a behavioral signal, not a price target generator. DanCoinInvestor’s analysis identifies the pattern and its historical correlation with rallies. It does not specify a rally magnitude, a timing window, or a specific price level. The chart contains no labeled targets. What the signal does say with four cycles of confirmation: the structural precondition for a Bitcoin rally — long-term supply rotating into fresh demand — is present and developing. What it does not say: how large the subsequent rally will be, or precisely when price will respond. Watch the rate of change in the aged UTXO proportion in the weeks ahead. Acceleration in that decline, combined with rising spot demand, is the confirmation this signal requires.
At $79,648 with the fourth UTXO arc declining and the pattern still forming, Bitcoin is sitting in a historically significant setup. The crypto market may be quiet. The on-chain data suggests it is not sleeping.
Disclaimer: The views and analysis presented in this article are for informational purposes only and reflect the author’s perspective, not financial advice. Technical patterns and indicators discussed are subject to market volatility and may or may not yield the anticipated results. Investors are advised to exercise caution, conduct independent research, and make decisions aligned with their individual risk tolerance.
Bitcoin UTXO Age Bands Signal Incoming Rally — Here’s the On-Chain Proof
Key Highlights
Bitcoin trades at $79,648 (-0.91% 24h) as CryptoQuant analyst @DanCoinInvestor flags a historic UTXO rotation signalWhen BTC held >18 months peaks then declines, a strong rally has followed in all three prior confirmed instances since 2015The fourth arc pattern is still forming — the signal is active but full cycle rotation has not yet concludedWatch the rate of decline in the 18-month-plus UTXO proportion alongside spot demand as the dual confirmation trigger
Bitcoin is trading at $79,648 — down 0.91% in the past 24 hours against a market cap of $1.6 trillion — and most short-term traders are focused on the price. The on-chain data tells a different, quieter story: a historically reliable rotation in long-term holder behavior is unfolding right now, and it has preceded every major Bitcoin rally in the past decade.
The signal comes from CryptoQuant analyst @DanCoinInvestor, published via CryptoQuant’s official channel on October 27, 2026. His observation is direct: “When the proportion of Bitcoin held for more than 18 months across the entire network rises and then starts to decline, a strong rally usually follows.” The chart shared with the post — spanning Bitcoin’s price history from 2015 through 2026 — shows this cycle playing out for a fourth consecutive time.
Bitcoin UTXO Age Bands Analysis | Source: @cryptoquant_com (X)
What the UTXO Age Band Metric Actually Measures
The metric at the center of this signal is the proportion of Bitcoin’s realized cap held in UTXOs aged 18 months or older — measuring what percentage of the network’s economic weight sits in coins that have not moved in a year and a half or more. This is not a price indicator. It is a behavioral indicator. It tracks the collective patience — or impatience — of Bitcoin’s longest-conviction holders.
When this proportion rises, long-term holders are accumulating and holding. New supply is being absorbed by participants who demonstrate, through on-chain behavior, that they are not selling. When the proportion subsequently declines, those same long-term holders begin distributing — but crucially, this distribution tends to coincide with fresh demand absorbing that supply at rising prices. The rotation from long-term holders to new buyers at higher prices is the structural engine of Bitcoin bull markets. DanCoinInvestor’s signal identifies the precise moment this engine switches on.
Four Cycles — Four Confirmed Rallies
The chart shared by CryptoQuant visualizes four distinct arc patterns in the 18-months-and-older UTXO band, each marked with a yellow arrow. The structure is consistent across all four instances: the blue band proportion rises over an accumulation phase, peaks, then turns downward — and each prior peak-and-decline has coincided with a strong Bitcoin price rally in the periods that followed. The chart covers 2015 through 2026, giving this pattern a ten-year track record across multiple market cycles, including the 2017 peak, the 2020–2021 bull run, and the 2024–2025 cycle.
The current reading — the fourth arrow on the chart — shows the 18-month-plus UTXO proportion at the tail end of its declining phase. According to the chart analysis, price is positioned at the declining phase of this fourth arc, near the 100K zone on the right axis, with the descending arrow still incomplete. The pattern is still forming. The full rotation has not yet concluded. But the directional signal — long-term holders beginning to release coins into a market preparing to absorb them — is active.
Why This Rotation Precedes Rallies — The Mechanism
The causal chain here is specific and worth stating explicitly. Long-term holders (those holding 18+ months) accumulated Bitcoin during prior bear markets and periods of consolidation. As price rises and new demand enters, these holders find willing buyers. The decline in the proportion of aged UTXOs reflects coins moving from dormant wallets into active circulation — being sold to new participants who believe the rally has further to run.
This is demand absorption at scale. When long-term supply rotation coincides with rising inflows from new buyers — retail, institutional, or ETF-driven — the net effect is upward price pressure. The aged UTXO band declining is not bearish. It is the supply-side signal that confirms a new demand cycle has begun. Without this rotation, rallies stall. With it, they tend to sustain. That is the structural logic behind DanCoinInvestor’s conclusion.
The Current Setup — Where the Signal Stands
Bitcoin’s price has spent recent sessions below the $80,000 threshold, with 24-hour volume at $26.5 billion — not a distress reading, but not a momentum print either. Against that backdrop, the on-chain signal is operating on a longer clock. The UTXO age band rotation does not produce same-day price reactions. It is a leading indicator with a lag measured in weeks to months, not hours. The four prior instances on the chart confirm this: the rally that follows the peak-and-decline in the aged band does not always begin immediately at the inflection point. It begins as new demand catches up to the available supply being rotated out.
The practical implication: the signal DanCoinInvestor identifies is an early-stage, not a breakout-confirmed reading. The pattern is still forming, which means the highest-conviction confirmation would come when the declining phase of the fourth arc accelerates and price begins to follow. Readers tracking broader signals around long-term holder behavior can cross-reference the XRP TD Sequential Buy Signal analysis for another instance of how cycle-based indicators build confirmation over time.
Bullish Scenario
If the fourth arc’s decline in the 18-month-plus UTXO band accelerates — matching the velocity of the three prior confirmed instances — and new demand continues to absorb the rotated supply, Bitcoin’s historical precedent across all four prior cycles points to a strong rally following the inflection. Each of the three prior arcs on the chart ended with a significant upward price move in the months that followed. A continuation of the current pattern places Bitcoin on the same structural path.
Bearish Scenario
If the declining phase of the UTXO arc stalls or reverses — meaning long-term holders stop distributing and re-enter accumulation mode without new demand absorbing supply — the rotation signal fails to complete. A stall in the arc would indicate that holders are withdrawing from the market rather than selling into strength, which historically correlates with continued consolidation or price weakness rather than a rally. Loss of the $79,000 level with no recovery in aged UTXO rotation would be the metric to watch for early warning.
What This Signal Says — And What It Doesn’t
The UTXO age band rotation is a behavioral signal, not a price target generator. DanCoinInvestor’s analysis identifies the pattern and its historical correlation with rallies. It does not specify a rally magnitude, a timing window, or a specific price level. The chart contains no labeled targets. What the signal does say with four cycles of confirmation: the structural precondition for a Bitcoin rally — long-term supply rotating into fresh demand — is present and developing. What it does not say: how large the subsequent rally will be, or precisely when price will respond. Watch the rate of change in the aged UTXO proportion in the weeks ahead. Acceleration in that decline, combined with rising spot demand, is the confirmation this signal requires.
At $79,648 with the fourth UTXO arc declining and the pattern still forming, Bitcoin is sitting in a historically significant setup. The crypto market may be quiet. The on-chain data suggests it is not sleeping.
Disclaimer: The views and analysis presented in this article are for informational purposes only and reflect the author’s perspective, not financial advice. Technical patterns and indicators discussed are subject to market volatility and may or may not yield the anticipated results. Investors are advised to exercise caution, conduct independent research, and make decisions aligned with their individual risk tolerance.
119
·
--
Article
XRP TD Sequential Buy Signal — Last Three Led to 18%–31% ReboundsKey Highlights
XRP is trading at $1.30 (+0.80% 24h) after printing a TD Sequential '9' buy signal on its 3-day chart per @alichartsThe last three identical TD Sequential '9' signals on XRP's 3-day chart produced rebounds of +31.26%, +24.38%, and +18.65% respectivelyAnalyst sets $1.25 as the critical hold level — a break below targets $0.98 (-24.6%); a hold targets $1.40XRP spot ETFs logged a $3.6M daily net outflow on Oct 26, with cumulative inflows since launch at $1.80B per SoSoValue
XRP is trading at $1.30 — up 0.80% in the past 24 hours, with a market cap of $82.3 billion — and a high-conviction technical signal has just appeared on its 3-day chart. The TD Sequential has printed a ‘9’ buy signal, a reading that has preceded rebounds of 31%, 24%, and 18% in its three most recent appearances. Three-for-three is a track record that demands attention.
Crypto analyst Ali Martinez (@alicharts) flagged the signal on October 27, 2026: “The TD Sequential has flashed a buy signal on the $XRP 3-day chart. The last three similar signals triggered rebounds of 31%, 24%, and 18%. That makes the latest signal worth paying attention to. But everything depends on $1.25.” The analyst identifies $1.25 as the line that separates a replay of those rebounds from a continuation of the current selling pressure — with $0.98 as the downside target if that level fails.
The TD Sequential — How It Works and What It Just Said
The TD Sequential counts nine consecutive candlesticks each closing lower than the close four bars prior. When the count reaches nine, it identifies momentum exhaustion — not a price level, not a trend reversal guarantee. It is a signal that selling pressure has statistically run its course and a counter-move is overdue. On XRP’s 3-day chart, that count has now completed for the fourth time in the visible history of this signal cycle.
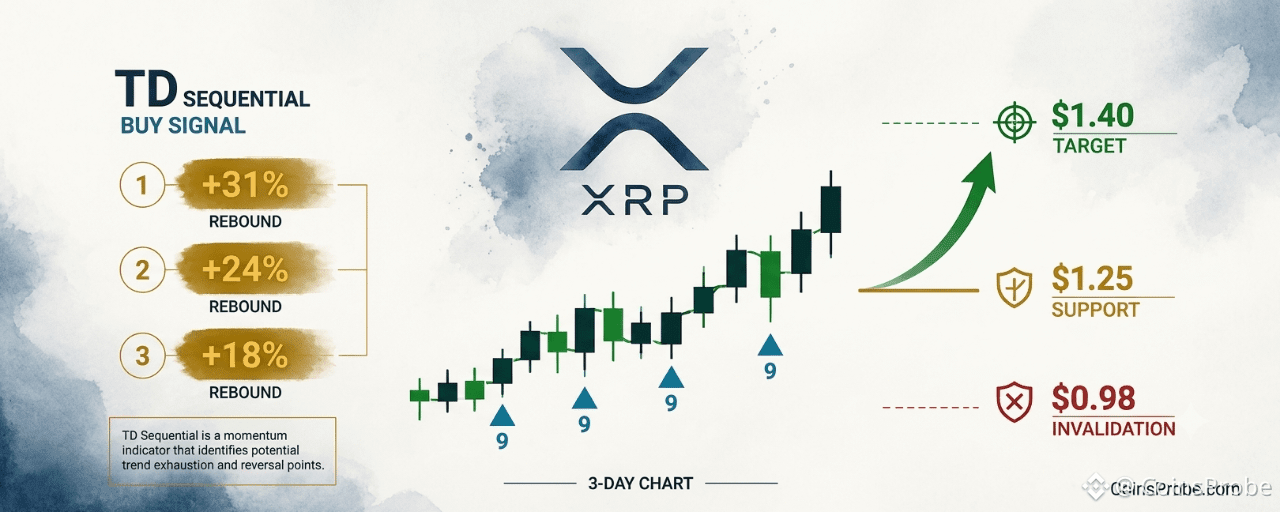
The chart shared by @alicharts plots XRP/USD on a 3-day timeframe spanning approximately April through October 2026. Four TD Sequential signals are marked with triangles beneath candles. The three historical ‘9’ signals each produced labeled rebounds directly on the chart: +31.26%, +24.38%, and +18.65%. A fourth historical label of +71.88% appears over a completed August spike. The current ‘9’ signal appears at the rightmost bars, with XRP at $1.299 — marked with a dashed horizontal line at the signal trigger point. No confirmed breakout has occurred yet; the pattern is still forming.
XRP TD Sequential Buy Signal | Source: @alicharts (X)
The historical track record across all three prior instances is summarized below:
Signal Instance Signal Type Rebound Produced Prior Instance 1 TD Sequential ‘9’ (3-day) +31.26% Prior Instance 2 TD Sequential ‘9’ (3-day) +24.38% Prior Instance 3 TD Sequential ‘9’ (3-day) +18.65% Current Signal TD Sequential ‘9’ (3-day) Forming — hinges on$1.25
TD Sequential ‘9’ buy signal history on XRP 3-day chart | Source: @alicharts (X)
$1.25 — The Critical Support Level
Martinez is explicit: the entire thesis rests on $1.25. This is not an arbitrary technical level — it is the line the analyst has identified as the floor that must hold for the TD Sequential signal to activate. The current price of $1.30 sits just 3.8% above that threshold, meaning the margin is thin.
Hold $1.25 and the prior rebound range of 18%–31% puts the immediate target at $1.40, per Martinez’s published analysis. That would represent a roughly 7.7% move from current levels — modest by XRP standards but directionally consistent with each prior TD Sequential resolution on this timeframe.
Lose $1.25 and the analyst’s stated next destination is $0.98 — a drop of 24.6% from the current price of $1.30. That level aligns with a significant prior support zone and represents the scenario Martinez flagged in a separate thread dated October 25: “XRP WILL DROP TO $0.98 IF WHALES KEEP SELLING.” Ongoing whale profit-taking remains the primary risk to the buy signal playing out.
ETF Flows and Macro Context
XRP spot ETF data via SoSoValue adds a layer of nuance. The latest trading session on October 26 logged a daily net outflow of $3.6 million, with total ETF net assets standing at $1.47 billion and cumulative net inflows since launch at $1.80 billion. Over the past five trading days, the net position is a modest +$645,000 — split across two inflow days and three outflow days. The ETF flow picture is not yet confirming institutional conviction in either direction, which keeps the $1.25 hold test as the primary near-term determinant.
Macro data releases this week add timing sensitivity. Core PCE Price Index (MoM and YoY) and GDP (QoQ) are due on October 28 — the day after this signal was flagged. A hotter-than-expected PCE reading could pressure risk assets broadly and accelerate a test of the $1.25 level before the TD Sequential has time to resolve. GDP and PMI data through early November will determine whether the macro backdrop supports or suppresses an XRP rebound. Traders watching the signal would do well to track these releases alongside price action at $1.25.
Bullish and Bearish Scenarios
Bullish Scenario — Hold $1.25, Target $1.40
If XRP holds $1.25 on a 3-day closing basis, the TD Sequential buy signal aligns with all three prior precedents. The analyst’s stated rebound target is $1.40 — consistent with the lower end of the 18%–31% historical range applied from the $1.25 floor. Each prior signal resolved with at minimum an 18.65% counter-move from the signal zone.
Bearish Scenario — Loss of $1.25, Target $0.98
A 3-day close below $1.25 invalidates the TD Sequential setup entirely. Martinez has explicitly named $0.98 as the next downside target in that scenario — a 24.6% decline from the current $1.30 price. The bear case is driven by whale profit-taking pressure identified in the analyst’s concurrent thread, and the ETF outflow data does not yet offer a counterbalancing institutional bid.
What the Signal Says — and What It Doesn’t
The TD Sequential ‘9’ on XRP’s 3-day chart is a momentum exhaustion signal — it identifies that selling pressure has reached a statistically recurring extreme. It does not specify the direction of the next move, and it does not guarantee a rebound. What makes the current reading notable is the consistency of the prior three outcomes: every prior instance on this timeframe produced a positive counter-move, ranging from 18.65% to 31.26%. The signal is 3-for-3.
What it doesn’t say: the magnitude of the next move is predetermined, or that the rebound begins immediately. The pattern is still forming. Price has not yet confirmed a directional break. The signal creates a probability window — not a purchase order.
What to watch for continuation: a 3-day close above $1.25 that holds for at least one subsequent bar, with declining selling volume from the whale distribution identified by Martinez. Those two conditions together would mark the earliest confirmation that the fourth TD Sequential on this timeframe is tracking its predecessors. Readers tracking similar momentum exhaustion setups in other assets may also find the recent analysis on SUI hitting a buy-the-dip zone at $0.91 a useful parallel.
The $XRP TD Sequential is 3-for-3. Whether it becomes 4-for-4 will be answered at $1.25 and $1.40 in the sessions ahead.
Disclaimer: The views and analysis presented in this article are for informational purposes only and reflect the author’s perspective, not financial advice. Technical patterns and indicators discussed are subject to market volatility and may or may not yield the anticipated results. Investors are advised to exercise caution, conduct independent research, and make decisions aligned with their individual risk tolerance.
XRP TD Sequential Buy Signal — Last Three Led to 18%–31% Rebounds
Key Highlights
XRP is trading at $1.30 (+0.80% 24h) after printing a TD Sequential '9' buy signal on its 3-day chart per @alichartsThe last three identical TD Sequential '9' signals on XRP's 3-day chart produced rebounds of +31.26%, +24.38%, and +18.65% respectivelyAnalyst sets $1.25 as the critical hold level — a break below targets $0.98 (-24.6%); a hold targets $1.40XRP spot ETFs logged a $3.6M daily net outflow on Oct 26, with cumulative inflows since launch at $1.80B per SoSoValue
XRP is trading at $1.30 — up 0.80% in the past 24 hours, with a market cap of $82.3 billion — and a high-conviction technical signal has just appeared on its 3-day chart. The TD Sequential has printed a ‘9’ buy signal, a reading that has preceded rebounds of 31%, 24%, and 18% in its three most recent appearances. Three-for-three is a track record that demands attention.
Crypto analyst Ali Martinez (@alicharts) flagged the signal on October 27, 2026: “The TD Sequential has flashed a buy signal on the $XRP 3-day chart. The last three similar signals triggered rebounds of 31%, 24%, and 18%. That makes the latest signal worth paying attention to. But everything depends on $1.25.” The analyst identifies $1.25 as the line that separates a replay of those rebounds from a continuation of the current selling pressure — with $0.98 as the downside target if that level fails.
The TD Sequential — How It Works and What It Just Said
The TD Sequential counts nine consecutive candlesticks each closing lower than the close four bars prior. When the count reaches nine, it identifies momentum exhaustion — not a price level, not a trend reversal guarantee. It is a signal that selling pressure has statistically run its course and a counter-move is overdue. On XRP’s 3-day chart, that count has now completed for the fourth time in the visible history of this signal cycle.
The chart shared by @alicharts plots XRP/USD on a 3-day timeframe spanning approximately April through October 2026. Four TD Sequential signals are marked with triangles beneath candles. The three historical ‘9’ signals each produced labeled rebounds directly on the chart: +31.26%, +24.38%, and +18.65%. A fourth historical label of +71.88% appears over a completed August spike. The current ‘9’ signal appears at the rightmost bars, with XRP at $1.299 — marked with a dashed horizontal line at the signal trigger point. No confirmed breakout has occurred yet; the pattern is still forming.
XRP TD Sequential Buy Signal | Source: @alicharts (X)
The historical track record across all three prior instances is summarized below:
Signal Instance Signal Type Rebound Produced Prior Instance 1 TD Sequential ‘9’ (3-day) +31.26% Prior Instance 2 TD Sequential ‘9’ (3-day) +24.38% Prior Instance 3 TD Sequential ‘9’ (3-day) +18.65% Current Signal TD Sequential ‘9’ (3-day) Forming — hinges on$1.25
TD Sequential ‘9’ buy signal history on XRP 3-day chart | Source: @alicharts (X)
$1.25 — The Critical Support Level
Martinez is explicit: the entire thesis rests on $1.25. This is not an arbitrary technical level — it is the line the analyst has identified as the floor that must hold for the TD Sequential signal to activate. The current price of $1.30 sits just 3.8% above that threshold, meaning the margin is thin.
Hold $1.25 and the prior rebound range of 18%–31% puts the immediate target at $1.40, per Martinez’s published analysis. That would represent a roughly 7.7% move from current levels — modest by XRP standards but directionally consistent with each prior TD Sequential resolution on this timeframe.
Lose $1.25 and the analyst’s stated next destination is $0.98 — a drop of 24.6% from the current price of $1.30. That level aligns with a significant prior support zone and represents the scenario Martinez flagged in a separate thread dated October 25: “XRP WILL DROP TO $0.98 IF WHALES KEEP SELLING.” Ongoing whale profit-taking remains the primary risk to the buy signal playing out.
ETF Flows and Macro Context
XRP spot ETF data via SoSoValue adds a layer of nuance. The latest trading session on October 26 logged a daily net outflow of $3.6 million, with total ETF net assets standing at $1.47 billion and cumulative net inflows since launch at $1.80 billion. Over the past five trading days, the net position is a modest +$645,000 — split across two inflow days and three outflow days. The ETF flow picture is not yet confirming institutional conviction in either direction, which keeps the $1.25 hold test as the primary near-term determinant.
Macro data releases this week add timing sensitivity. Core PCE Price Index (MoM and YoY) and GDP (QoQ) are due on October 28 — the day after this signal was flagged. A hotter-than-expected PCE reading could pressure risk assets broadly and accelerate a test of the $1.25 level before the TD Sequential has time to resolve. GDP and PMI data through early November will determine whether the macro backdrop supports or suppresses an XRP rebound. Traders watching the signal would do well to track these releases alongside price action at $1.25.
Bullish and Bearish Scenarios
Bullish Scenario — Hold $1.25, Target $1.40
If XRP holds $1.25 on a 3-day closing basis, the TD Sequential buy signal aligns with all three prior precedents. The analyst’s stated rebound target is $1.40 — consistent with the lower end of the 18%–31% historical range applied from the $1.25 floor. Each prior signal resolved with at minimum an 18.65% counter-move from the signal zone.
Bearish Scenario — Loss of $1.25, Target $0.98
A 3-day close below $1.25 invalidates the TD Sequential setup entirely. Martinez has explicitly named $0.98 as the next downside target in that scenario — a 24.6% decline from the current $1.30 price. The bear case is driven by whale profit-taking pressure identified in the analyst’s concurrent thread, and the ETF outflow data does not yet offer a counterbalancing institutional bid.
What the Signal Says — and What It Doesn’t
The TD Sequential ‘9’ on XRP’s 3-day chart is a momentum exhaustion signal — it identifies that selling pressure has reached a statistically recurring extreme. It does not specify the direction of the next move, and it does not guarantee a rebound. What makes the current reading notable is the consistency of the prior three outcomes: every prior instance on this timeframe produced a positive counter-move, ranging from 18.65% to 31.26%. The signal is 3-for-3.
What it doesn’t say: the magnitude of the next move is predetermined, or that the rebound begins immediately. The pattern is still forming. Price has not yet confirmed a directional break. The signal creates a probability window — not a purchase order.
What to watch for continuation: a 3-day close above $1.25 that holds for at least one subsequent bar, with declining selling volume from the whale distribution identified by Martinez. Those two conditions together would mark the earliest confirmation that the fourth TD Sequential on this timeframe is tracking its predecessors. Readers tracking similar momentum exhaustion setups in other assets may also find the recent analysis on SUI hitting a buy-the-dip zone at $0.91 a useful parallel.
The $XRP TD Sequential is 3-for-3. Whether it becomes 4-for-4 will be answered at $1.25 and $1.40 in the sessions ahead.
Disclaimer: The views and analysis presented in this article are for informational purposes only and reflect the author’s perspective, not financial advice. Technical patterns and indicators discussed are subject to market volatility and may or may not yield the anticipated results. Investors are advised to exercise caution, conduct independent research, and make decisions aligned with their individual risk tolerance.
1
668
·
--
Partly True
Article
SUI Hits 'Buy The Dip' Zone at $0.91 — Analyst Calls Gradual Scale-InKey Highlights
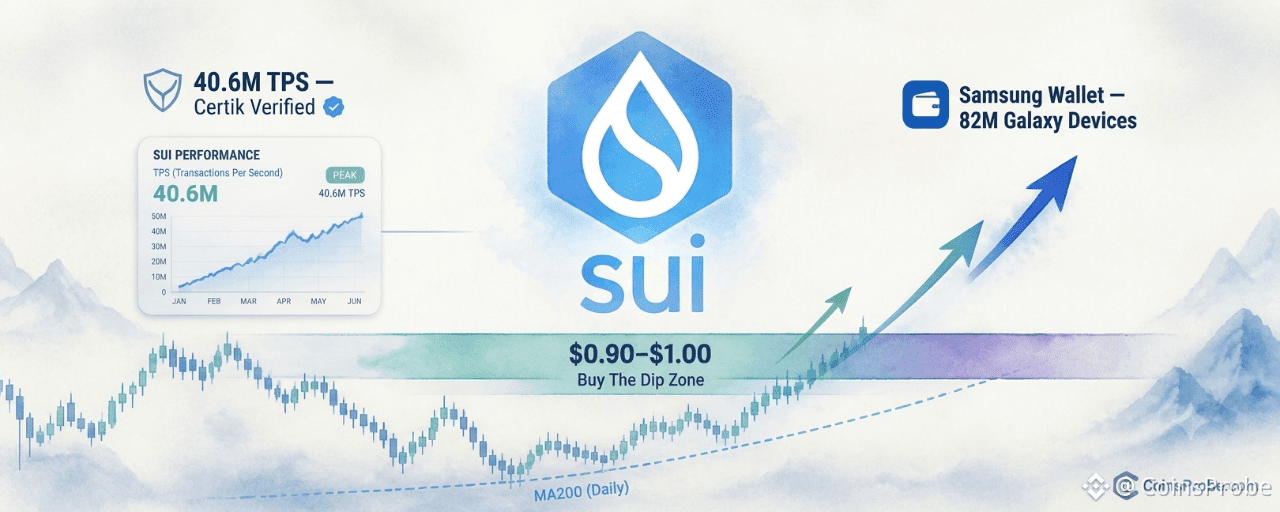
SUI is trading at $0.9113 — down 23.18% over 30 days — and has entered the $0.90–$1.00 'Buy The Dip' zone flagged by @CryptoBullet1Analyst @CryptoBullet1 calls for gradual scaling in; zone first identified October 13, 2026 — 14 days before current price touchSui holds a Certik-verified 40.6M TPS record and Samsung Wallet integration targeting 82M Galaxy devicesWatch $0.90 — a daily close below invalidates the accumulation zone; Core PCE data releases October 28
SUI is trading at $0.9113 — down 0.51% in the past 24 hours, 8.40% over the past week, and 23.18% over the past 30 days — and has now landed precisely inside the accumulation zone that analyst @CryptoBullet1 has been publicly tracking since mid-October. With a market cap of $3.75 billion, this is not a random pullback: the price has entered a defined structural support band that the analyst flagged two weeks before the current touch.
On October 27, 2026, @CryptoBullet1 issued a direct call: “$SUI has reached the ‘Buy The Dip’ zone — It’s time to gradually scale in.” This was not an impulsive update. A prior post from October 13, 2026 had already identified the same $0.90–$1.00 band as the target accumulation zone after SUI dipped below $1 twice within a seven-day window. The analyst’s framework has now been triggered.
The $0.90–$1.00 Zone — What Makes This Level Structural
SUI Hits ‘Buy The Dip’ Zone | Source: @CryptoBullet1 (X)
The daily chart shared by @CryptoBullet1 on Binance shows SUI’s current price at $0.9101 sitting at the lower boundary of a shaded horizontal support region — labeled the ‘Buy The Dip’ Zone. The MA200 (200-day moving average) runs as a dashed line directly beneath this zone, reinforcing it as a historically significant technical anchor. The projected path annotated on the chart is a zigzag recovery bouncing within the zone before trending sharply higher — but the analyst is explicit: this is a gradual scaling process, not a single-entry all-in call.
The pattern status is still forming. The recovery trajectory is forward-looking. What has been confirmed is the price arrival: SUI is at the zone, not approaching it. That distinction matters. @CryptoBullet1 flagged this zone on October 13 when SUI was testing $1 for the second time in a week. Now, more than two weeks later, the market has delivered the setup the analyst was waiting for. The word “gradually” in his call is deliberate — it signals staged entry as the zone is defended, not a single-candle catalyst.
The Fundamental Case — TPS Record and Samsung Integration
The technical setup does not exist in isolation. @CryptoBullet1 cites two specific fundamental drivers that form the bull case for SUI at this level. First: a 40.6 million TPS record certified by Certik — a throughput benchmark that positions Sui as one of the highest-performance Layer 1 networks by verified transaction speed. Second: Samsung Wallet is integrating Sui for USDC payments across 82 million Galaxy devices — a distribution milestone that would expose Sui’s network to one of the largest consumer hardware ecosystems in the world.
These are not speculative catalysts. The TPS figure is third-party verified. The Samsung integration is a named corporate deployment. At $0.91, with $3.75 billion in market cap, both fundamentals represent unpriced upside relative to where SUI was trading three months ago — particularly the Samsung channel, which has yet to generate measurable on-chain volume at scale.
On-Chain Data — Current Network State
DeFiLlama data shows Sui’s current TVL at $468.80 million, with 24-hour DEX volume at $20.74 million and 7-day DEX volume at $155.46 million. The 24-hour fee generation stands at $80.8K, with 7-day fees at $662K. These figures reflect a network that is active but not at peak utilization — which is consistent with the 23% monthly price drawdown. A recovery in on-chain activity metrics would be the first confirmatory signal that the $0.90–$1.00 accumulation zone is holding with genuine demand rather than passive price support.
This aligns with earlier CoinsProbe coverage: SUI/BTC held the August 2024 low with the range high as the upside target, and a prior SuperTrend buy signal on SUI preceded a 77.53% rally. The current zone entry is a third data point in a consistent technical sequence.
Macro Context — What Comes Next Week
Macro risk is not absent. Data via SoSoValue shows Core PCE Price Index (MoM and YoY) and GDP (QoQ) releasing on October 28 — the session immediately following this call. A hotter-than-expected Core PCE print would pressure risk assets broadly, potentially extending SUI’s drawdown below the $0.90 floor of the analyst’s stated zone. ISM Manufacturing PMI follows on November 1, with CPI (MoM and YoY) on November 9. The next two weeks carry sequential macro inflection points that could either compress or catalyze the gradual scaling thesis.
Bullish Scenario
SUI defends the $0.90–$1.00 zone with rising DEX volume and fee generation, MA200 holds as dynamic support, and the Samsung Wallet integration begins generating measurable on-chain USDC flows. Price path per analyst’s annotated chart: zigzag recovery through the zone, then a sustained directional move higher. Prior coverage flagged $1.40 as the channel top target once $SUI reclaims $1.
Bearish Scenario
A macro-driven flush on Core PCE data (October 28) pushes SUI below $0.90 — the floor of the defined ‘Buy The Dip’ zone. A daily close below $0.90 would invalidate the current zone thesis and shift the structure back to price discovery below the MA200. @CryptoBullet1’s call specifies gradual scaling precisely because this risk exists.
SUI has entered the exact zone @CryptoBullet1 identified 14 days before the current touch, supported by a Certik-verified 40.6M TPS record and a Samsung Wallet integration reaching 82 million Galaxy devices. The daily chart shows price at the lower boundary of the $0.90–$1.00 accumulation band with the MA200 immediately beneath it — the structure is intact, but the pattern is still forming.
The analyst’s call is explicit: gradual scaling, not a single-entry bet. The most immediate risk to this framework is the October 28 Core PCE release. Watch $0.90 — a daily close below that level is the structural invalidation of this zone.
**Disclaimer: **The views and analysis presented in this article are for informational purposes only and reflect the author’s perspective, not financial advice. Technical patterns and indicators discussed are subject to market volatility and may or may not yield the anticipated results. Investors are advised to exercise caution, conduct independent research, and make decisions aligned with their individual risk tolerance.
SUI Hits 'Buy The Dip' Zone at $0.91 — Analyst Calls Gradual Scale-In
Key Highlights
SUI is trading at $0.9113 — down 23.18% over 30 days — and has entered the $0.90–$1.00 'Buy The Dip' zone flagged by @CryptoBullet1Analyst @CryptoBullet1 calls for gradual scaling in; zone first identified October 13, 2026 — 14 days before current price touchSui holds a Certik-verified 40.6M TPS record and Samsung Wallet integration targeting 82M Galaxy devicesWatch $0.90 — a daily close below invalidates the accumulation zone; Core PCE data releases October 28
SUI is trading at $0.9113 — down 0.51% in the past 24 hours, 8.40% over the past week, and 23.18% over the past 30 days — and has now landed precisely inside the accumulation zone that analyst @CryptoBullet1 has been publicly tracking since mid-October. With a market cap of $3.75 billion, this is not a random pullback: the price has entered a defined structural support band that the analyst flagged two weeks before the current touch.
On October 27, 2026, @CryptoBullet1 issued a direct call: “$SUI has reached the ‘Buy The Dip’ zone — It’s time to gradually scale in.” This was not an impulsive update. A prior post from October 13, 2026 had already identified the same $0.90–$1.00 band as the target accumulation zone after SUI dipped below $1 twice within a seven-day window. The analyst’s framework has now been triggered.
The $0.90–$1.00 Zone — What Makes This Level Structural
SUI Hits ‘Buy The Dip’ Zone | Source: @CryptoBullet1 (X)
The daily chart shared by @CryptoBullet1 on Binance shows SUI’s current price at $0.9101 sitting at the lower boundary of a shaded horizontal support region — labeled the ‘Buy The Dip’ Zone. The MA200 (200-day moving average) runs as a dashed line directly beneath this zone, reinforcing it as a historically significant technical anchor. The projected path annotated on the chart is a zigzag recovery bouncing within the zone before trending sharply higher — but the analyst is explicit: this is a gradual scaling process, not a single-entry all-in call.
The pattern status is still forming. The recovery trajectory is forward-looking. What has been confirmed is the price arrival: SUI is at the zone, not approaching it. That distinction matters. @CryptoBullet1 flagged this zone on October 13 when SUI was testing $1 for the second time in a week. Now, more than two weeks later, the market has delivered the setup the analyst was waiting for. The word “gradually” in his call is deliberate — it signals staged entry as the zone is defended, not a single-candle catalyst.
The Fundamental Case — TPS Record and Samsung Integration
The technical setup does not exist in isolation. @CryptoBullet1 cites two specific fundamental drivers that form the bull case for SUI at this level. First: a 40.6 million TPS record certified by Certik — a throughput benchmark that positions Sui as one of the highest-performance Layer 1 networks by verified transaction speed. Second: Samsung Wallet is integrating Sui for USDC payments across 82 million Galaxy devices — a distribution milestone that would expose Sui’s network to one of the largest consumer hardware ecosystems in the world.
These are not speculative catalysts. The TPS figure is third-party verified. The Samsung integration is a named corporate deployment. At $0.91, with $3.75 billion in market cap, both fundamentals represent unpriced upside relative to where SUI was trading three months ago — particularly the Samsung channel, which has yet to generate measurable on-chain volume at scale.
On-Chain Data — Current Network State
DeFiLlama data shows Sui’s current TVL at $468.80 million, with 24-hour DEX volume at $20.74 million and 7-day DEX volume at $155.46 million. The 24-hour fee generation stands at $80.8K, with 7-day fees at $662K. These figures reflect a network that is active but not at peak utilization — which is consistent with the 23% monthly price drawdown. A recovery in on-chain activity metrics would be the first confirmatory signal that the $0.90–$1.00 accumulation zone is holding with genuine demand rather than passive price support.
This aligns with earlier CoinsProbe coverage: SUI/BTC held the August 2024 low with the range high as the upside target, and a prior SuperTrend buy signal on SUI preceded a 77.53% rally. The current zone entry is a third data point in a consistent technical sequence.
Macro Context — What Comes Next Week
Macro risk is not absent. Data via SoSoValue shows Core PCE Price Index (MoM and YoY) and GDP (QoQ) releasing on October 28 — the session immediately following this call. A hotter-than-expected Core PCE print would pressure risk assets broadly, potentially extending SUI’s drawdown below the $0.90 floor of the analyst’s stated zone. ISM Manufacturing PMI follows on November 1, with CPI (MoM and YoY) on November 9. The next two weeks carry sequential macro inflection points that could either compress or catalyze the gradual scaling thesis.
Bullish Scenario
SUI defends the $0.90–$1.00 zone with rising DEX volume and fee generation, MA200 holds as dynamic support, and the Samsung Wallet integration begins generating measurable on-chain USDC flows. Price path per analyst’s annotated chart: zigzag recovery through the zone, then a sustained directional move higher. Prior coverage flagged $1.40 as the channel top target once $SUI reclaims $1.
Bearish Scenario
A macro-driven flush on Core PCE data (October 28) pushes SUI below $0.90 — the floor of the defined ‘Buy The Dip’ zone. A daily close below $0.90 would invalidate the current zone thesis and shift the structure back to price discovery below the MA200. @CryptoBullet1’s call specifies gradual scaling precisely because this risk exists.
SUI has entered the exact zone @CryptoBullet1 identified 14 days before the current touch, supported by a Certik-verified 40.6M TPS record and a Samsung Wallet integration reaching 82 million Galaxy devices. The daily chart shows price at the lower boundary of the $0.90–$1.00 accumulation band with the MA200 immediately beneath it — the structure is intact, but the pattern is still forming.
The analyst’s call is explicit: gradual scaling, not a single-entry bet. The most immediate risk to this framework is the October 28 Core PCE release. Watch $0.90 — a daily close below that level is the structural invalidation of this zone.
**Disclaimer: **The views and analysis presented in this article are for informational purposes only and reflect the author’s perspective, not financial advice. Technical patterns and indicators discussed are subject to market volatility and may or may not yield the anticipated results. Investors are advised to exercise caution, conduct independent research, and make decisions aligned with their individual risk tolerance.
1
807
·
--
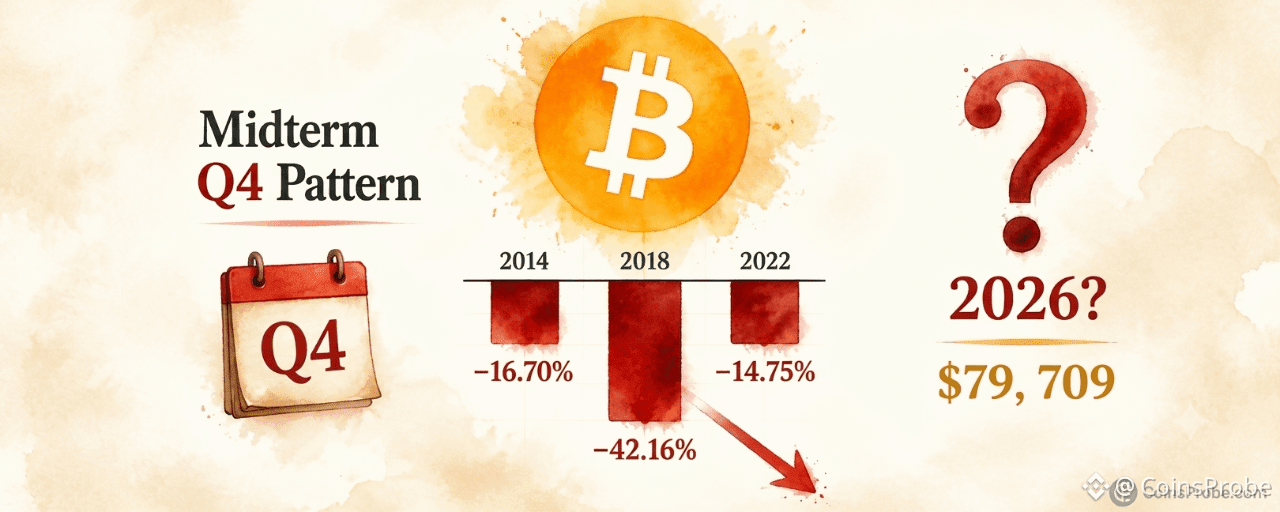
Article
Bitcoin Q4 Midterm Pattern: -16.70%, -42.16%, -14.75% — Will 2026 Repeat?Key Highlights
Bitcoin is trading at $79,709 (−0.46% 24h) as analyst @alicharts flags a three-for-three negative Q4 pattern in U.S. midterm election yearsHistorical Q4 returns in midterm years: 2014 (−16.70%), 2018 (−42.16%), 2022 (−14.75%) — all negative, per @alichartsSpot BTC ETFs recorded +$110.3M net inflow on Oct 26 (all from IBIT), but the 5-day trailing net remains −$111.5M per SoSoValueDecember 31 closing price will confirm or break the midterm Q4 pattern for the first time in three cycles
Bitcoin is trading at approximately $79,709 — down 0.46% in the past 24 hours and sitting below the $80,000 psychological threshold — as a historically significant seasonal pattern draws renewed attention. The asset has now declined in Q4 during each of the last three U.S. midterm election years without exception, and Q4 2026 is currently in progress.
Crypto analyst Ali Martinez (@alicharts), posting on October 26, 2026, flagged the pattern directly: “Q4 2026 COULD BE PAINFUL FOR BITCOIN. Bitcoin’s Q4 performance during recent U.S. midterm election years has been particularly interesting.” The post, which drew 12,500 views, lays out a three-instance track record that is difficult to dismiss as coincidence.
The Midterm Q4 Track Record — Three-for-Three Negative
The historical data Martinez presents is precise. In each U.S. midterm election year, Bitcoin has closed Q4 in the red:
Year Event Q4 Return 2014 U.S. Midterm Elections −16.70% 2018 U.S. Midterm Elections −42.16% 2022 U.S. Midterm Elections −14.75%
Source: @alicharts (X), October 26, 2026
BTC Quarterly P&L Analysis | Source: @alicharts (X)
The severity has varied — 2018’s drawdown was nearly three times deeper than the other two instances — but the direction has been consistent. Q4 2014 and Q4 2022 produced comparable declines in the −14% to −17% range, while 2018 delivered a collapse of −42.16% that marked the bottom of that bear market cycle. The sample is small at three instances, but the pattern is unbroken.
Why Midterm Years Specifically?
Martinez does not offer a mechanistic explanation for why midterm election years produce negative Bitcoin Q4s, and the facts do not support inventing one. What the data does show is that in each instance, broader macro uncertainty — fiscal policy, Congressional composition, regulatory outlook — coincided with risk-asset weakness in the October-to-December window. Whether that correlation is causal or structural requires more instances than three to confirm. What Martinez is presenting is a pattern flag, not a rule.
The 2026 macro backdrop adds weight to the concern. The Federal Reserve’s next meeting on October 28 carries an 89.5% probability of holding rates in the 3.75%–4.00% range, per data via SoSoValue. For December’s FOMC meeting, markets now price a 73.9% probability of rates moving to the 4.00%–4.25% band — implying a potential rate hike is back on the table. That is not a benign environment for risk assets heading into Q4’s final two months. Core PCE and GDP data releases on October 28 will add further clarity.
Spot ETF Flows — Institutional Activity Amid the Pattern
Despite the historical caution Martinez flags, spot Bitcoin ETF flows on October 26 showed a single-day net inflow of +$110.3 million, driven entirely by BlackRock’s IBIT, which absorbed the full $110.3 million in new capital. FBTC and GBTC recorded zero net flows on the same day, per SoSoValue data. The five-day trailing net figure remains negative at −$111.5 million across three inflow days and two outflow days, suggesting institutional positioning is mixed rather than decisively directional. Total ETF net assets stand at $102.84 billion, with cumulative inflows since launch at $57.29 billion. For more context on recent ETF flow dynamics, see Bitcoin ETFs Bleed $169M in a Day but Post $267M Weekly Gain.
On the corporate treasury side, Strategy (formerly MicroStrategy) holds 848,517 BTC as of October 19, having added 267 BTC for $22.1 million in its most recent purchase. Over the past three weeks, the firm acquired 851 BTC for $72.8 million — a pace that reflects continued conviction from the largest corporate Bitcoin holder, even as the seasonal pattern raises a near-term caution flag.
What the Pattern Says — and What It Doesn’t
The midterm Q4 signal is a directional pattern flag, not a price target. Martinez does not state a downside level, an invalidation price, or a recovery timeline. Applying the historical average decline — which would mean something between −14% and −42% from wherever Q4 opened — to generate a forward projection is not supported by the source, and the range is too wide to be actionable on its own.
What the pattern does establish with precision: Bitcoin has never posted a positive Q4 return in a U.S. midterm election year across the three instances on record. That is the stated fact. Bitcoin is currently trading at $79,709, already down from higher levels, meaning some Q4 weakness may already be priced in. Whether the pattern completes — or whether 2026 breaks it — will be visible in the December 31 closing price.
With BTC having recently broken a key technical level, traders are watching the 200-day EMA near $76,000 as the next structural reference. For that specific technical setup, see Bitcoin Breaks Key Support — EMA200 Near $76K Now in Focus.
Bullish Scenario
Bitcoin reclaims and holds above $82,000 through November, breaking the midterm Q4 negative pattern for the first time. A monthly close above current levels with sustained ETF inflows — particularly IBIT flows exceeding $200M per day — would be the clearest evidence that 2026 diverges from the 2014/2018/2022 template.
Bearish Scenario
The midterm pattern holds. A continued drift toward the $76,000 EMA200 zone, combined with net ETF outflows over the next four to six weeks, would align with the −14% to −16% range seen in 2014 and 2022. The 2018 analog — a −42.16% Q4 — would imply a significantly deeper drawdown from Q4’s open.
Martinez’s three-instance track record is the most specific seasonal warning currently on the table for Bitcoin. Q4 2026 is in progress. The December 31 close will determine whether the pattern holds at four-for-four or breaks for the first time — and right now, nothing in the ETF flow data, corporate treasury activity, or macro rate environment conclusively argues the pattern is already broken. Watch the monthly close in December as the definitive answer.
**Disclaimer: **The views and analysis presented in this article are for informational purposes only and reflect the author’s perspective, not financial advice. Technical patterns and indicators discussed are subject to market volatility and may or may not yield the anticipated results. Investors are advised to exercise caution, conduct independent research, and make decisions aligned with their individual risk tolerance.
Bitcoin Q4 Midterm Pattern: -16.70%, -42.16%, -14.75% — Will 2026 Repeat?
Key Highlights
Bitcoin is trading at $79,709 (−0.46% 24h) as analyst @alicharts flags a three-for-three negative Q4 pattern in U.S. midterm election yearsHistorical Q4 returns in midterm years: 2014 (−16.70%), 2018 (−42.16%), 2022 (−14.75%) — all negative, per @alichartsSpot BTC ETFs recorded +$110.3M net inflow on Oct 26 (all from IBIT), but the 5-day trailing net remains −$111.5M per SoSoValueDecember 31 closing price will confirm or break the midterm Q4 pattern for the first time in three cycles
Bitcoin is trading at approximately $79,709 — down 0.46% in the past 24 hours and sitting below the $80,000 psychological threshold — as a historically significant seasonal pattern draws renewed attention. The asset has now declined in Q4 during each of the last three U.S. midterm election years without exception, and Q4 2026 is currently in progress.
Crypto analyst Ali Martinez (@alicharts), posting on October 26, 2026, flagged the pattern directly: “Q4 2026 COULD BE PAINFUL FOR BITCOIN. Bitcoin’s Q4 performance during recent U.S. midterm election years has been particularly interesting.” The post, which drew 12,500 views, lays out a three-instance track record that is difficult to dismiss as coincidence.
The Midterm Q4 Track Record — Three-for-Three Negative
The historical data Martinez presents is precise. In each U.S. midterm election year, Bitcoin has closed Q4 in the red:
Year Event Q4 Return 2014 U.S. Midterm Elections −16.70% 2018 U.S. Midterm Elections −42.16% 2022 U.S. Midterm Elections −14.75%
Source: @alicharts (X), October 26, 2026
BTC Quarterly P&L Analysis | Source: @alicharts (X)
The severity has varied — 2018’s drawdown was nearly three times deeper than the other two instances — but the direction has been consistent. Q4 2014 and Q4 2022 produced comparable declines in the −14% to −17% range, while 2018 delivered a collapse of −42.16% that marked the bottom of that bear market cycle. The sample is small at three instances, but the pattern is unbroken.
Why Midterm Years Specifically?
Martinez does not offer a mechanistic explanation for why midterm election years produce negative Bitcoin Q4s, and the facts do not support inventing one. What the data does show is that in each instance, broader macro uncertainty — fiscal policy, Congressional composition, regulatory outlook — coincided with risk-asset weakness in the October-to-December window. Whether that correlation is causal or structural requires more instances than three to confirm. What Martinez is presenting is a pattern flag, not a rule.
The 2026 macro backdrop adds weight to the concern. The Federal Reserve’s next meeting on October 28 carries an 89.5% probability of holding rates in the 3.75%–4.00% range, per data via SoSoValue. For December’s FOMC meeting, markets now price a 73.9% probability of rates moving to the 4.00%–4.25% band — implying a potential rate hike is back on the table. That is not a benign environment for risk assets heading into Q4’s final two months. Core PCE and GDP data releases on October 28 will add further clarity.
Spot ETF Flows — Institutional Activity Amid the Pattern
Despite the historical caution Martinez flags, spot Bitcoin ETF flows on October 26 showed a single-day net inflow of +$110.3 million, driven entirely by BlackRock’s IBIT, which absorbed the full $110.3 million in new capital. FBTC and GBTC recorded zero net flows on the same day, per SoSoValue data. The five-day trailing net figure remains negative at −$111.5 million across three inflow days and two outflow days, suggesting institutional positioning is mixed rather than decisively directional. Total ETF net assets stand at $102.84 billion, with cumulative inflows since launch at $57.29 billion. For more context on recent ETF flow dynamics, see Bitcoin ETFs Bleed $169M in a Day but Post $267M Weekly Gain.
On the corporate treasury side, Strategy (formerly MicroStrategy) holds 848,517 BTC as of October 19, having added 267 BTC for $22.1 million in its most recent purchase. Over the past three weeks, the firm acquired 851 BTC for $72.8 million — a pace that reflects continued conviction from the largest corporate Bitcoin holder, even as the seasonal pattern raises a near-term caution flag.
What the Pattern Says — and What It Doesn’t
The midterm Q4 signal is a directional pattern flag, not a price target. Martinez does not state a downside level, an invalidation price, or a recovery timeline. Applying the historical average decline — which would mean something between −14% and −42% from wherever Q4 opened — to generate a forward projection is not supported by the source, and the range is too wide to be actionable on its own.
What the pattern does establish with precision: Bitcoin has never posted a positive Q4 return in a U.S. midterm election year across the three instances on record. That is the stated fact. Bitcoin is currently trading at $79,709, already down from higher levels, meaning some Q4 weakness may already be priced in. Whether the pattern completes — or whether 2026 breaks it — will be visible in the December 31 closing price.
With BTC having recently broken a key technical level, traders are watching the 200-day EMA near $76,000 as the next structural reference. For that specific technical setup, see Bitcoin Breaks Key Support — EMA200 Near $76K Now in Focus.
Bullish Scenario
Bitcoin reclaims and holds above $82,000 through November, breaking the midterm Q4 negative pattern for the first time. A monthly close above current levels with sustained ETF inflows — particularly IBIT flows exceeding $200M per day — would be the clearest evidence that 2026 diverges from the 2014/2018/2022 template.
Bearish Scenario
The midterm pattern holds. A continued drift toward the $76,000 EMA200 zone, combined with net ETF outflows over the next four to six weeks, would align with the −14% to −16% range seen in 2014 and 2022. The 2018 analog — a −42.16% Q4 — would imply a significantly deeper drawdown from Q4’s open.
Martinez’s three-instance track record is the most specific seasonal warning currently on the table for Bitcoin. Q4 2026 is in progress. The December 31 close will determine whether the pattern holds at four-for-four or breaks for the first time — and right now, nothing in the ETF flow data, corporate treasury activity, or macro rate environment conclusively argues the pattern is already broken. Watch the monthly close in December as the definitive answer.
**Disclaimer: **The views and analysis presented in this article are for informational purposes only and reflect the author’s perspective, not financial advice. Technical patterns and indicators discussed are subject to market volatility and may or may not yield the anticipated results. Investors are advised to exercise caution, conduct independent research, and make decisions aligned with their individual risk tolerance.
240
·
--
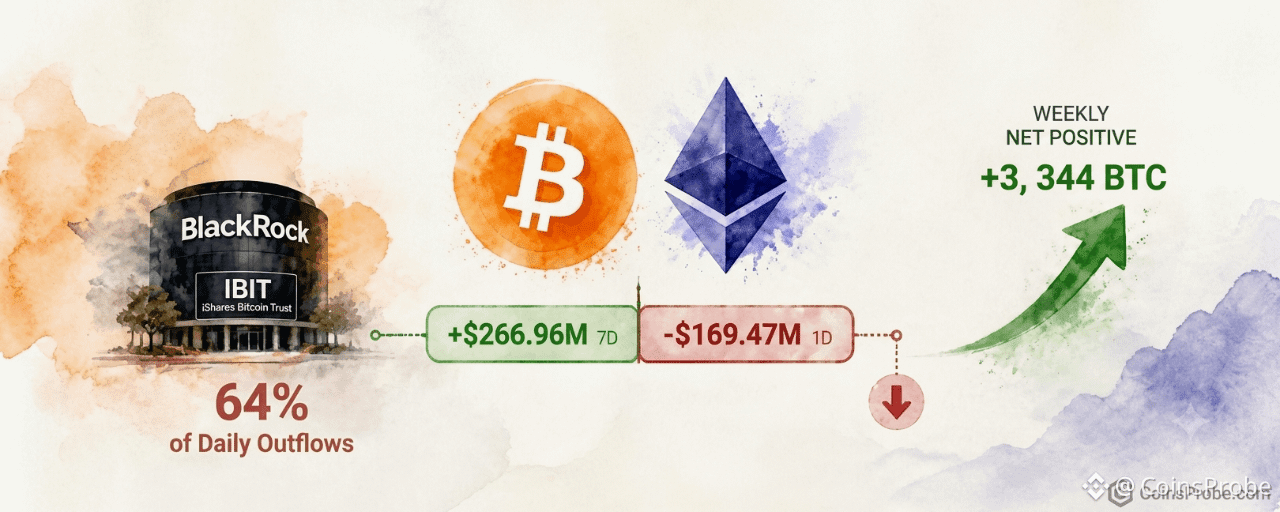
Article
Bitcoin ETFs Bleed $169M in a Day but Post $267M Weekly GainKey Highlights
Bitcoin ETFs posted a 1-day outflow of 2,123 BTC ($169.47M) on Oct 26 per LookonchainSeven-day Bitcoin ETF net inflows remain positive at +3,344 BTC (+$266.96M) — daily exit reversed 63.5% of weekly gainsBlackRock IBIT drove 64% of daily BTC outflows but generated 203% of weekly net BTC inflows — extreme single-fund concentrationEthereum ETFs posted dual red readings: −$16.07M daily and −$198.15M weekly, with ETHA's 7D outflow exceeding total ETH ETF redemptions by 113%
BREAKING
Bitcoin spot ETFs recorded a single-day net outflow of 2,123 BTC — equivalent to $169.47 million — on October 26, according to data published by Lookonchain. The daily bleed, however, sits inside a positive seven-day window: the same funds absorbed a net 3,344 BTC (+$266.96 million) over the trailing week, meaning Sunday’s selling reversed only 63.5% of the week’s institutional demand.
Bitcoin ETFs Bleed $169M in a Day but Post $267M Weekly Gain | Source: @lookonchain (Telegram)
At the time of writing, Bitcoin is trading at approximately $80,495 — down 0.08% over the past 24 hours.
Bitcoin ETF Flows — October 26
The fund-level breakdown from the Lookonchain data and the accompanying chart reveals a divergence in issuer behavior rather than a uniform sell-off. BlackRock’s IBIT — the largest holder at 809,780 BTC ($65.2B) — posted a 1-day outflow of 1,358 BTC, accounting for 64% of the total daily Bitcoin ETF redemptions. Grayscale (GBTC + BTC combined, 188,408 BTC) shed 368 BTC on the day. Fidelity’s FBTC (175,890 BTC) recorded the steepest proportional daily loss among the named funds at 391 BTC. Bitwise (BITB) and ARK 21Shares (ARKB) registered zero net movement for the session.
Fund 1D Net Flow (BTC) 7D Net Flow (BTC) BlackRock IBIT −1,358 +6,792 Grayscale GBTC + BTC −368 −589 Fidelity FBTC −391 −1,522 Bitwise BITB 0 −233 ARK 21Shares ARKB 0 −1,229 Others −5 +125 Total −2,123 +3,344
Source: Lookonchain / Chart data, October 26
The seven-day column tells a structurally different story. IBIT absorbed +6,792 BTC over the week — the only fund posting meaningful weekly inflows. Grayscale, Fidelity, Bitwise, and ARKB all recorded seven-day net outflows. IBIT’s weekly absorption represents 203% of the total seven-day net inflow figure, meaning the other four named funds were collectively net sellers while BlackRock alone drove the week positive.
Total Bitcoin held across all spot ETFs now stands at 1,275,191 BTC — valued at approximately $101.8 billion at current prices — per the chart breakdown via Lookonchain.
Ethereum ETFs — Both Timeframes Red
Ethereum spot ETFs offered no offset. The 1-day outflow registered 6,960 ETH ($16.07 million), and the seven-day figure deepened to 85,801 ETH ($198.15 million) — both firmly negative per Lookonchain. The ETH data presents a different composition: Fidelity’s FETH was the sole named fund posting a daily gain of +1,509 ETH. Grayscale (ETHE + ETH) shed 8,469 ETH on the day but was a net buyer over the week at +3,484 ETH. BlackRock’s ETHA — the largest ETH ETF at 3,264,757 ETH — recorded zero daily movement but carried a seven-day outflow of 96,824 ETH, the dominant driver of the weekly figure.
Fund 1D Net Flow (ETH) 7D Net Flow (ETH) BlackRock ETHA 0 −96,824 Grayscale ETHE + ETH −8,469 +3,484 Fidelity FETH +1,509 +6,807 Total (all funds) −6,960 −85,801
Source: Lookonchain / Chart data, October 26
ETHA’s 96,824 ETH seven-day outflow represents 113% of the total weekly ETH ETF redemption figure — meaning Fidelity and Grayscale’s combined weekly inflows were insufficient to offset BlackRock’s single-fund drawdown.
What the Numbers Actually Say
Three structural observations emerge from the October 26
1. Bitcoin’s daily outflow is a partial reversal, not a trend break. The $169.47M daily exit erased 63.5% of the $266.96M seven-day accumulation. The weekly net remains positive. No streak data is available to confirm whether this constitutes a break in a consecutive-inflow run, but the seven-day baseline has not flipped negative.
2. IBIT concentration is extreme on both sides. On the daily: IBIT contributed 64% of Bitcoin ETF outflows. On the weekly: IBIT alone generated 203% of total net Bitcoin ETF inflows (offsetting all other funds’ combined selling). This level of single-fund concentration means the aggregate headline number is increasingly a proxy for BlackRock’s institutional client behavior specifically.
3. ETH and BTC ETF dynamics are structurally diverging. Bitcoin’s seven-day figure is green (+$266.96M). Ethereum’s is red (−$198.15M). The dollar gap between those two weekly readings is $465.11M — a figure that quantifies the current institutional preference gap between the two assets in the spot ETF wrapper.
Daily ETF flow data is not a directional trading signal. A single session’s outflow inside a positive weekly trend reflects liquidity rotation, profit-taking, or portfolio rebalancing — not necessarily a change in structural demand. The metric to track: whether Bitcoin’s seven-day net inflow holds positive through the week, and whether ETHA’s weekly outflow pace moderates or accelerates.
Disclaimer: The views and analysis presented in this article are for informational purposes only and reflect the author’s perspective, not financial advice. Technical patterns and indicators discussed are subject to market volatility and may or may not yield the anticipated results. Investors are advised to exercise caution, conduct independent research, and make decisions aligned with their individual risk tolerance.
Bitcoin ETFs Bleed $169M in a Day but Post $267M Weekly Gain
Key Highlights
Bitcoin ETFs posted a 1-day outflow of 2,123 BTC ($169.47M) on Oct 26 per LookonchainSeven-day Bitcoin ETF net inflows remain positive at +3,344 BTC (+$266.96M) — daily exit reversed 63.5% of weekly gainsBlackRock IBIT drove 64% of daily BTC outflows but generated 203% of weekly net BTC inflows — extreme single-fund concentrationEthereum ETFs posted dual red readings: −$16.07M daily and −$198.15M weekly, with ETHA's 7D outflow exceeding total ETH ETF redemptions by 113%
BREAKING
Bitcoin spot ETFs recorded a single-day net outflow of 2,123 BTC — equivalent to $169.47 million — on October 26, according to data published by Lookonchain. The daily bleed, however, sits inside a positive seven-day window: the same funds absorbed a net 3,344 BTC (+$266.96 million) over the trailing week, meaning Sunday’s selling reversed only 63.5% of the week’s institutional demand.
Bitcoin ETFs Bleed $169M in a Day but Post $267M Weekly Gain | Source: @lookonchain (Telegram)
At the time of writing, Bitcoin is trading at approximately $80,495 — down 0.08% over the past 24 hours.
Bitcoin ETF Flows — October 26
The fund-level breakdown from the Lookonchain data and the accompanying chart reveals a divergence in issuer behavior rather than a uniform sell-off. BlackRock’s IBIT — the largest holder at 809,780 BTC ($65.2B) — posted a 1-day outflow of 1,358 BTC, accounting for 64% of the total daily Bitcoin ETF redemptions. Grayscale (GBTC + BTC combined, 188,408 BTC) shed 368 BTC on the day. Fidelity’s FBTC (175,890 BTC) recorded the steepest proportional daily loss among the named funds at 391 BTC. Bitwise (BITB) and ARK 21Shares (ARKB) registered zero net movement for the session.
Fund 1D Net Flow (BTC) 7D Net Flow (BTC) BlackRock IBIT −1,358 +6,792 Grayscale GBTC + BTC −368 −589 Fidelity FBTC −391 −1,522 Bitwise BITB 0 −233 ARK 21Shares ARKB 0 −1,229 Others −5 +125 Total −2,123 +3,344
Source: Lookonchain / Chart data, October 26
The seven-day column tells a structurally different story. IBIT absorbed +6,792 BTC over the week — the only fund posting meaningful weekly inflows. Grayscale, Fidelity, Bitwise, and ARKB all recorded seven-day net outflows. IBIT’s weekly absorption represents 203% of the total seven-day net inflow figure, meaning the other four named funds were collectively net sellers while BlackRock alone drove the week positive.
Total Bitcoin held across all spot ETFs now stands at 1,275,191 BTC — valued at approximately $101.8 billion at current prices — per the chart breakdown via Lookonchain.
Ethereum ETFs — Both Timeframes Red
Ethereum spot ETFs offered no offset. The 1-day outflow registered 6,960 ETH ($16.07 million), and the seven-day figure deepened to 85,801 ETH ($198.15 million) — both firmly negative per Lookonchain. The ETH data presents a different composition: Fidelity’s FETH was the sole named fund posting a daily gain of +1,509 ETH. Grayscale (ETHE + ETH) shed 8,469 ETH on the day but was a net buyer over the week at +3,484 ETH. BlackRock’s ETHA — the largest ETH ETF at 3,264,757 ETH — recorded zero daily movement but carried a seven-day outflow of 96,824 ETH, the dominant driver of the weekly figure.
Fund 1D Net Flow (ETH) 7D Net Flow (ETH) BlackRock ETHA 0 −96,824 Grayscale ETHE + ETH −8,469 +3,484 Fidelity FETH +1,509 +6,807 Total (all funds) −6,960 −85,801
Source: Lookonchain / Chart data, October 26
ETHA’s 96,824 ETH seven-day outflow represents 113% of the total weekly ETH ETF redemption figure — meaning Fidelity and Grayscale’s combined weekly inflows were insufficient to offset BlackRock’s single-fund drawdown.
What the Numbers Actually Say
Three structural observations emerge from the October 26
1. Bitcoin’s daily outflow is a partial reversal, not a trend break. The $169.47M daily exit erased 63.5% of the $266.96M seven-day accumulation. The weekly net remains positive. No streak data is available to confirm whether this constitutes a break in a consecutive-inflow run, but the seven-day baseline has not flipped negative.
2. IBIT concentration is extreme on both sides. On the daily: IBIT contributed 64% of Bitcoin ETF outflows. On the weekly: IBIT alone generated 203% of total net Bitcoin ETF inflows (offsetting all other funds’ combined selling). This level of single-fund concentration means the aggregate headline number is increasingly a proxy for BlackRock’s institutional client behavior specifically.
3. ETH and BTC ETF dynamics are structurally diverging. Bitcoin’s seven-day figure is green (+$266.96M). Ethereum’s is red (−$198.15M). The dollar gap between those two weekly readings is $465.11M — a figure that quantifies the current institutional preference gap between the two assets in the spot ETF wrapper.
Daily ETF flow data is not a directional trading signal. A single session’s outflow inside a positive weekly trend reflects liquidity rotation, profit-taking, or portfolio rebalancing — not necessarily a change in structural demand. The metric to track: whether Bitcoin’s seven-day net inflow holds positive through the week, and whether ETHA’s weekly outflow pace moderates or accelerates.
Disclaimer: The views and analysis presented in this article are for informational purposes only and reflect the author’s perspective, not financial advice. Technical patterns and indicators discussed are subject to market volatility and may or may not yield the anticipated results. Investors are advised to exercise caution, conduct independent research, and make decisions aligned with their individual risk tolerance.
605
·
--

Article
Bitcoin Trader Realized Price Rising Again — Dynamic Support in Bull CorrectionsKey Highlights
Bitcoin trades at $80,351 (+0.30% 24h) as CryptoQuant's @TraderGemin flags the Trader Realized Price rising againHistorically, the Trader Realized Price has acted as dynamic support during bull-phase BTC corrections — per @TraderGemin via CryptoQuantU.S. spot ETFs logged a $635.5M single-day outflow on Oct 22 (IBIT: -$110.3M), per SoSoValue — a macro test of support may be nearCore PCE and FOMC due Oct 28 with 90.6% rate-hold probability — key macro events that could trigger a correction toward the on-chain support level
Bitcoin is trading at $80,351 — up 0.30% in the past 24 hours, with a market cap of approximately $1.61 trillion — and a specific on-chain metric is now drawing institutional attention: the Trader Realized Price is rising again, and its historical behavior during bull market corrections makes it one of the most important levels to track if BTC pulls back from here.
The signal comes from @TraderGemin, a contributor at CryptoQuant, who published the observation via the platform’s official channel on October 26, 2026. His exact conclusion: “Historically, during bullish phases, this realized price has often acted as support when BTC corrected toward it.” The framing is conditional — support if BTC corrects, not a price target or purchase signal — but the pattern behind it is grounded in on-chain data spanning multiple cycles.
What the Trader Realized Price Actually Measures
The Trader Realized Price is not a technical indicator drawn from candlestick data. It is an on-chain metric derived from the average acquisition cost of short-to-medium-term Bitcoin holders — market participants who are actively trading rather than holding long-term. Unlike the broader Realized Price (which weights all coins ever moved), the Trader Realized Price isolates the cohort most likely to react to price changes, making it a live pulse of active-market cost basis.
When Bitcoin trades above this line, active traders are in aggregate profit — reducing sell pressure. When price dips toward it during a bull phase, it historically marks the zone where profit margins compress, traders reassess, and demand reappears. That is the mechanism behind @TraderGemin’s observation: not that the line is magic, but that it represents real-money cost basis for the most reactive participants in the market.
What the Chart Shows — Pattern Still Forming
The CryptoQuant chart shared by @cryptoquant_com covers Bitcoin’s price history from approximately mid-2019 through mid-2026. The Trader Realized Price (blue line) trends upward across the full timeframe — a rising dynamic support. Bitcoin’s price (white) oscillates above and below it cyclically, with an upper band (dotted orange) and max/min dashed lines forming an expanding channel around the blue line.
Bitcoin: Trader On-chain Realized Price Bands Analysis | Source: @cryptoquant_com (X)
Critically, at the most recent data point visible on the chart, Bitcoin is above the Trader Realized Price (blue line) and below the upper band (dotted orange line). The pattern is still forming — no breakout above the upper band or breakdown below the realized price line has occurred. Price is currently in the middle zone of the channel, trending upward. The rising slope of the Trader Realized Price itself is the signal @TraderGemin flags: it is moving higher again, meaning any correction that brings BTC back toward it would find a cost-basis floor that is itself advancing — not static.
Historical Behavior — Bull Phase Corrections
The value of this metric is most visible across prior bull phases visible in the chart. Across multiple cycle corrections — 2020, 2021, and 2023 — Bitcoin’s price has dipped toward the Trader Realized Price line before recovering. Each instance where BTC corrected to the blue line during a confirmed bull phase was followed by a resumption of the uptrend. The line did not hold during macro bear markets (2018–2019, mid-2022), which is an important caveat: the Trader Realized Price functions as support only when the broader market structure is bullish. It is a contextual tool, not an unconditional floor.
@TraderGemin’s qualifier — “during bullish phases” — is not a hedge. It is a defining condition. The indicator’s support behavior is regime-dependent. In the current context, with Bitcoin above $80,000 and the Trader Realized Price trending upward, the regime condition appears satisfied — but that determination requires ongoing verification against broader on-chain structure.
ETF Flow Context — Institutional Signal Divergence
Against this on-chain backdrop, spot Bitcoin ETF flows present a mixed picture worth noting. On October 22, 2026, U.S. spot ETFs logged a single-day net outflow of $635.5M — the largest recent outflow — with IBIT alone seeing $110.3M exit and FBTC shedding $31.8M, per data via SoSoValue. Total ETF net assets remain substantial at $104.71B, with cumulative net inflows since launch at $57.32B.
The divergence is worth flagging: the four-day window surrounding that outflow also produced $442.7M in net inflows across three positive days, suggesting the $635.5M figure may reflect rotation or single-fund rebalancing rather than structural institutional exit. Strategy (MSTR) added 267 BTC for $22.1M in its latest purchase, bringing total holdings to 848,517 BTC — a data point that sits firmly in the long-term conviction column regardless of short-term ETF mechanics.
That said, a $635.5M daily outflow is not noise. If ETF redemptions persist in the days following this signal, the Trader Realized Price support may face a more acute test than @TraderGemin’s base case anticipates. For context on Bitcoin’s broader technical structure at current levels, see our earlier analysis: Bitcoin Channel Breakdown — $82K Resistance, $72.5K Buy Zone: Analyst.
Macro Events This Week
The timing of this on-chain signal coincides with a dense macro calendar. Core PCE Price Index (MoM and YoY) and GDP (QoQ) data are due on October 28, the same day as the FOMC meeting where markets currently price a 90.6% probability of holding rates at 3.75%–4.00%, per SoSoValue. A surprise in either direction — an upside GDP print or a hotter PCE — could trigger the very BTC correction that would test the Trader Realized Price. The December 9 FOMC carries a 72.4% probability of moving to 4.00%–4.25%, meaning the rate path beyond October is not settled. These macro variables are the most likely near-term trigger for a test of the on-chain support @TraderGemin identifies.
Bullish Scenario
Bitcoin holds above the rising Trader Realized Price on any correction and resumes the uptrend toward the upper band (dotted orange) visible in the CryptoQuant chart. ETF inflows return to the three-day positive trend seen in the $442.7M rolling window, confirming institutional demand absorbs macro-driven selling. The pattern resolves to the upside within the expanding channel.
Bearish Scenario
A macro shock — hotter-than-expected Core PCE or GDP surprise on October 28 — drives BTC through the Trader Realized Price with sustained daily closes below it. @TraderGemin’s own framework conditions support on a bullish phase being intact; a breakdown below the blue line would invalidate that regime read and open the door to deeper correction toward lower realized price bands visible on the chart. Continued ETF outflows beyond the $635.5M single-day print would amplify this risk.
The Trader Realized Price is one tool among many. For a broader view of where altcoin risk sits in the current environment, see: AI Agent Altcoins Losing Momentum — VVV, TRAC, and ARC Face Key Breakdown Levels.
Bitcoin’s Trader Realized Price is rising, BTC is above it, and the historical pattern across bull-phase corrections is consistent: the line has repeatedly absorbed selling pressure when price pulled back toward it during confirmed uptrends. @TraderGemin’s signal from CryptoQuant is conditional — “during bullish phases” — and that condition must remain in force for the support to be meaningful.
With $635.5M in single-day ETF outflows logged October 22 and Core PCE plus FOMC due October 28, the test of this support may arrive sooner than the chart’s current calm suggests. The level to watch is the Trader Realized Price itself — its exact value is visible on the CryptoQuant chart and advances with each passing session.
**Disclaimer: **The views and analysis presented in this article are for informational purposes only and reflect the author’s perspective, not financial advice. Technical patterns and indicators discussed are subject to market volatility and may or may not yield the anticipated results. Investors are advised to exercise caution, conduct independent research, and make decisions aligned with their individual risk tolerance.
Bitcoin Trader Realized Price Rising Again — Dynamic Support in Bull Corrections
Key Highlights
Bitcoin trades at $80,351 (+0.30% 24h) as CryptoQuant's @TraderGemin flags the Trader Realized Price rising againHistorically, the Trader Realized Price has acted as dynamic support during bull-phase BTC corrections — per @TraderGemin via CryptoQuantU.S. spot ETFs logged a $635.5M single-day outflow on Oct 22 (IBIT: -$110.3M), per SoSoValue — a macro test of support may be nearCore PCE and FOMC due Oct 28 with 90.6% rate-hold probability — key macro events that could trigger a correction toward the on-chain support level
Bitcoin is trading at $80,351 — up 0.30% in the past 24 hours, with a market cap of approximately $1.61 trillion — and a specific on-chain metric is now drawing institutional attention: the Trader Realized Price is rising again, and its historical behavior during bull market corrections makes it one of the most important levels to track if BTC pulls back from here.
The signal comes from @TraderGemin, a contributor at CryptoQuant, who published the observation via the platform’s official channel on October 26, 2026. His exact conclusion: “Historically, during bullish phases, this realized price has often acted as support when BTC corrected toward it.” The framing is conditional — support if BTC corrects, not a price target or purchase signal — but the pattern behind it is grounded in on-chain data spanning multiple cycles.
What the Trader Realized Price Actually Measures
The Trader Realized Price is not a technical indicator drawn from candlestick data. It is an on-chain metric derived from the average acquisition cost of short-to-medium-term Bitcoin holders — market participants who are actively trading rather than holding long-term. Unlike the broader Realized Price (which weights all coins ever moved), the Trader Realized Price isolates the cohort most likely to react to price changes, making it a live pulse of active-market cost basis.
When Bitcoin trades above this line, active traders are in aggregate profit — reducing sell pressure. When price dips toward it during a bull phase, it historically marks the zone where profit margins compress, traders reassess, and demand reappears. That is the mechanism behind @TraderGemin’s observation: not that the line is magic, but that it represents real-money cost basis for the most reactive participants in the market.
What the Chart Shows — Pattern Still Forming
The CryptoQuant chart shared by @cryptoquant_com covers Bitcoin’s price history from approximately mid-2019 through mid-2026. The Trader Realized Price (blue line) trends upward across the full timeframe — a rising dynamic support. Bitcoin’s price (white) oscillates above and below it cyclically, with an upper band (dotted orange) and max/min dashed lines forming an expanding channel around the blue line.
Bitcoin: Trader On-chain Realized Price Bands Analysis | Source: @cryptoquant_com (X)
Critically, at the most recent data point visible on the chart, Bitcoin is above the Trader Realized Price (blue line) and below the upper band (dotted orange line). The pattern is still forming — no breakout above the upper band or breakdown below the realized price line has occurred. Price is currently in the middle zone of the channel, trending upward. The rising slope of the Trader Realized Price itself is the signal @TraderGemin flags: it is moving higher again, meaning any correction that brings BTC back toward it would find a cost-basis floor that is itself advancing — not static.
Historical Behavior — Bull Phase Corrections
The value of this metric is most visible across prior bull phases visible in the chart. Across multiple cycle corrections — 2020, 2021, and 2023 — Bitcoin’s price has dipped toward the Trader Realized Price line before recovering. Each instance where BTC corrected to the blue line during a confirmed bull phase was followed by a resumption of the uptrend. The line did not hold during macro bear markets (2018–2019, mid-2022), which is an important caveat: the Trader Realized Price functions as support only when the broader market structure is bullish. It is a contextual tool, not an unconditional floor.
@TraderGemin’s qualifier — “during bullish phases” — is not a hedge. It is a defining condition. The indicator’s support behavior is regime-dependent. In the current context, with Bitcoin above $80,000 and the Trader Realized Price trending upward, the regime condition appears satisfied — but that determination requires ongoing verification against broader on-chain structure.
ETF Flow Context — Institutional Signal Divergence
Against this on-chain backdrop, spot Bitcoin ETF flows present a mixed picture worth noting. On October 22, 2026, U.S. spot ETFs logged a single-day net outflow of $635.5M — the largest recent outflow — with IBIT alone seeing $110.3M exit and FBTC shedding $31.8M, per data via SoSoValue. Total ETF net assets remain substantial at $104.71B, with cumulative net inflows since launch at $57.32B.
The divergence is worth flagging: the four-day window surrounding that outflow also produced $442.7M in net inflows across three positive days, suggesting the $635.5M figure may reflect rotation or single-fund rebalancing rather than structural institutional exit. Strategy (MSTR) added 267 BTC for $22.1M in its latest purchase, bringing total holdings to 848,517 BTC — a data point that sits firmly in the long-term conviction column regardless of short-term ETF mechanics.
That said, a $635.5M daily outflow is not noise. If ETF redemptions persist in the days following this signal, the Trader Realized Price support may face a more acute test than @TraderGemin’s base case anticipates. For context on Bitcoin’s broader technical structure at current levels, see our earlier analysis: Bitcoin Channel Breakdown — $82K Resistance, $72.5K Buy Zone: Analyst.
Macro Events This Week
The timing of this on-chain signal coincides with a dense macro calendar. Core PCE Price Index (MoM and YoY) and GDP (QoQ) data are due on October 28, the same day as the FOMC meeting where markets currently price a 90.6% probability of holding rates at 3.75%–4.00%, per SoSoValue. A surprise in either direction — an upside GDP print or a hotter PCE — could trigger the very BTC correction that would test the Trader Realized Price. The December 9 FOMC carries a 72.4% probability of moving to 4.00%–4.25%, meaning the rate path beyond October is not settled. These macro variables are the most likely near-term trigger for a test of the on-chain support @TraderGemin identifies.
Bullish Scenario
Bitcoin holds above the rising Trader Realized Price on any correction and resumes the uptrend toward the upper band (dotted orange) visible in the CryptoQuant chart. ETF inflows return to the three-day positive trend seen in the $442.7M rolling window, confirming institutional demand absorbs macro-driven selling. The pattern resolves to the upside within the expanding channel.
Bearish Scenario
A macro shock — hotter-than-expected Core PCE or GDP surprise on October 28 — drives BTC through the Trader Realized Price with sustained daily closes below it. @TraderGemin’s own framework conditions support on a bullish phase being intact; a breakdown below the blue line would invalidate that regime read and open the door to deeper correction toward lower realized price bands visible on the chart. Continued ETF outflows beyond the $635.5M single-day print would amplify this risk.
The Trader Realized Price is one tool among many. For a broader view of where altcoin risk sits in the current environment, see: AI Agent Altcoins Losing Momentum — VVV, TRAC, and ARC Face Key Breakdown Levels.
Bitcoin’s Trader Realized Price is rising, BTC is above it, and the historical pattern across bull-phase corrections is consistent: the line has repeatedly absorbed selling pressure when price pulled back toward it during confirmed uptrends. @TraderGemin’s signal from CryptoQuant is conditional — “during bullish phases” — and that condition must remain in force for the support to be meaningful.
With $635.5M in single-day ETF outflows logged October 22 and Core PCE plus FOMC due October 28, the test of this support may arrive sooner than the chart’s current calm suggests. The level to watch is the Trader Realized Price itself — its exact value is visible on the CryptoQuant chart and advances with each passing session.
**Disclaimer: **The views and analysis presented in this article are for informational purposes only and reflect the author’s perspective, not financial advice. Technical patterns and indicators discussed are subject to market volatility and may or may not yield the anticipated results. Investors are advised to exercise caution, conduct independent research, and make decisions aligned with their individual risk tolerance.
174
·
--
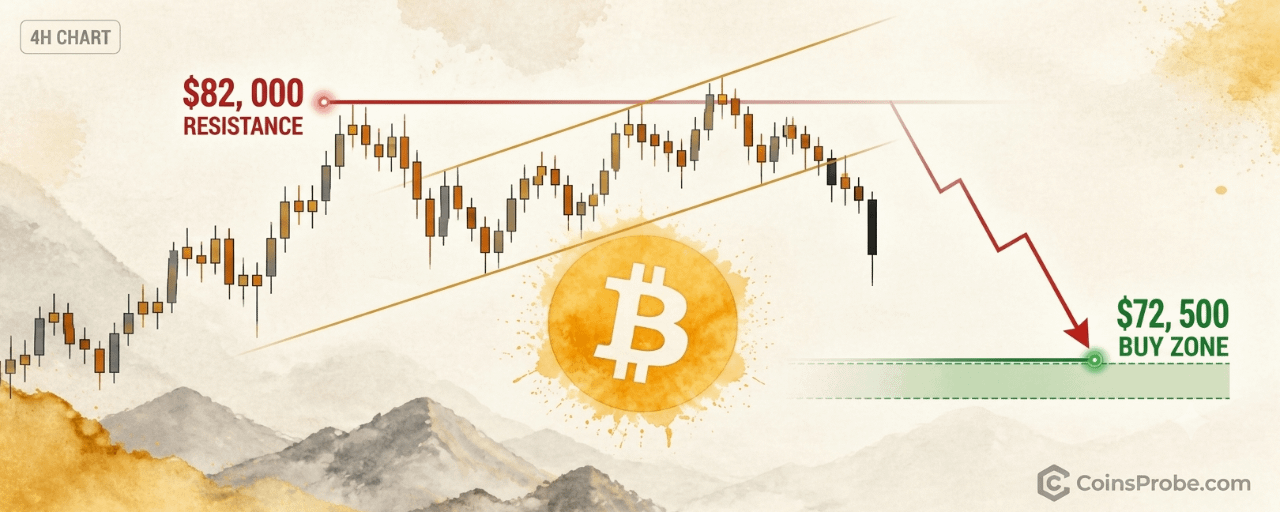
Article
Bitcoin Channel Breakdown — $82K Resistance, $72.5K Buy Zone: AnalystKey Highlights
Bitcoin trades at $80,027 (-0.52%) after breaking below a 4-hour rising parallel channel per @alicharts$82,000 must hold as resistance for the correction to continue — a reclaim invalidates the breakdown thesisAli Charts identifies $72,500 as his next buying opportunity — roughly 9.4% below current priceSpot Bitcoin ETFs recorded a $635.5M single-day outflow on Oct 22, with IBIT leading at -$110.3M (SoSoValue)
Bitcoin is trading at $80,027 — down 0.52% in the past 24 hours — after breaking below a rising parallel channel on the 4-hour chart. That structural breakdown, if confirmed with $82,000 holding as resistance, sets the stage for a continued correction toward $72,500: the level where one prominent analyst is already positioning to buy.
Analyst Ali Charts (@alicharts) flagged the breakdown on October 26, 2026, writing: “Bitcoin appears to have broken below a rising parallel channel on the 4-hour chart. As long as $82,000 holds as resistance, $BTC could continue correcting toward $72,500. That’s where I’ll be looking for the next buying opportunity.” The call is precise — not a range, not a zone. A single level where he intends to act.
The 4-Hour Channel Breakdown — What It Signals
A rising parallel channel on the 4-hour chart is a structure defined by two upward-sloping trendlines of equal gradient — one connecting swing lows, one connecting swing highs. When price breaks below the lower trendline with conviction, it signals that the sequence of higher lows sustaining the channel has been violated. The immediate implication: the market’s near-term bullish structure has broken down.
Ali Charts identifies $82,000 as the critical resistance level that must hold for the correction to continue. This is not a support-turned-resistance level in the classical sense — it is the structural significance of the broken channel’s lower boundary. A reclaim above $82,000 would invalidate the breakdown thesis and suggest the break was a false move. As long as that level caps any bounce, the corrective path toward $72,500 remains open.
BTC 4H Chart | Source: @alicharts (X)
Bitcoin is currently trading at $80,027 — already $1,973 below the $82,000 resistance threshold, meaning the resistance is already overhead, not ahead. The market has room to continue lower without first requiring a test of $82,000.
$72,500 — The Buy Zone
Ali Charts does not label $72,500 as a support level derived from a specific indicator. He identifies it as his next buying opportunity — a deliberate, pre-planned entry based on the measured move from the channel breakdown and prior structural context at that price area. The distance from current price ($80,027) to that level represents approximately 9.4% additional downside.
This framing matters. It separates a panic-driven sell target from a structured re-entry thesis. The analyst is not predicting capitulation — he is identifying a level where he believes risk/reward flips back in favor of bulls.
ETF Flows Add Context to the Sell Pressure
The channel breakdown does not exist in a vacuum. Spot Bitcoin ETF data via SoSoValue shows a $635.5M daily net outflow on the latest trading session (October 22), the heaviest single-day exit in recent sessions. IBIT alone recorded $110.3M in outflows, while FBTC shed another $31.8M. Total ETF net assets stand at $104.71B — still substantial, but the directional pressure from institutional redemptions is structurally consistent with the 4-hour chart’s message.
Over the past four trading sessions, the net ETF flow stands at +$442.7M (three inflow days, one outflow day), suggesting the trend is not a sustained institutional exit — but the magnitude of the single-day $635.5M outflow is notable context for why Bitcoin is struggling to hold structure above $80,000. For more on recent ETF redemption dynamics, see Bitcoin ETF Outflows Hit $137.9M on Oct 23 — Final Figure May Be Far Higher.
Macro Events This Week Could Accelerate the Move
Two macro data releases arrive on October 28 that could define near-term direction: Core PCE Price Index (MoM and YoY) and GDP (QoQ). These are the Federal Reserve’s preferred inflation and growth gauges. Markets currently price a 90.6% probability of a rate hold at the October 28 FOMC meeting (3.75%–4.00% target rate), per SoSoValue. A hotter-than-expected Core PCE print could pressure risk assets further, potentially accelerating Bitcoin’s path toward Ali Charts’ $72,500 target. A soft print could provide a relief bounce — but that bounce would need to stay below $82,000 to keep the bearish channel breakdown thesis intact.
It is also worth noting that Bitcoin’s behavior around macro-political cycles has precedent. Bitcoin’s Midterm Election Curse — Four Cycles, Four Crashes documents the historical pattern of Bitcoin underperforming into mid-term electoral windows — a backdrop that arguably adds structural context to this correction. Meanwhile, levered positions have already begun unwinding: Two Hyperliquid Whales were liquidated as Bitcoin dropped below $80K, a sign that the move below this psychological threshold carries real forced-selling consequences.
Strategy’s Conviction Provides an Institutional Counterpoint
Not all institutional actors are selling. Strategy (formerly MicroStrategy) added 267 BTC for $22.1M in its latest purchase, bringing total holdings to 848,517 BTC as of October 19. Over the past three weeks, Strategy acquired 851 BTC for $72.8M — a steady accumulation pace that reflects longer-term conviction regardless of near-term chart structure. This does not invalidate the 4-hour breakdown, but it does establish that at current price levels, at least one major institutional buyer remains active.
Bullish Scenario — Reclaim Above $82,000
A sustained 4-hour close above $82,000 would invalidate the channel breakdown thesis. It would suggest the lower trendline held as support on an intraday basis and that the break was a false move. In this scenario, the corrective setup toward $72,500 is off the table until price revisits and confirms the breakdown with a failed retest of $82,000 from below.
Bearish Scenario — $82,000 Caps and Correction Continues
If $82,000 continues to act as resistance on any bounce from current levels, Ali Charts’ base case plays out: Bitcoin continues lower toward $72,500, representing approximately 9.4% additional downside from the current $80,027 price. At that level, he has stated his intention to seek the next buying opportunity.
The 4-hour channel is broken. $82,000 is overhead resistance. Bitcoin at $80,027 is already 9.4% above the analyst’s stated buy zone. Two macro catalysts — Core PCE and GDP — arrive October 28 and will determine whether the correction accelerates or stalls. The level traders are watching: $82,000 to the upside as the invalidation point, and $72,500 to the downside as the structured re-entry.
**Disclaimer: **The views and analysis presented in this article are for informational purposes only and reflect the author’s perspective, not financial advice. Technical patterns and indicators discussed are subject to market volatility and may or may not yield the anticipated results. Investors are advised to exercise caution, conduct independent research, and make decisions aligned with their individual risk tolerance.
Bitcoin Channel Breakdown — $82K Resistance, $72.5K Buy Zone: Analyst
Key Highlights
Bitcoin trades at $80,027 (-0.52%) after breaking below a 4-hour rising parallel channel per @alicharts$82,000 must hold as resistance for the correction to continue — a reclaim invalidates the breakdown thesisAli Charts identifies $72,500 as his next buying opportunity — roughly 9.4% below current priceSpot Bitcoin ETFs recorded a $635.5M single-day outflow on Oct 22, with IBIT leading at -$110.3M (SoSoValue)
Bitcoin is trading at $80,027 — down 0.52% in the past 24 hours — after breaking below a rising parallel channel on the 4-hour chart. That structural breakdown, if confirmed with $82,000 holding as resistance, sets the stage for a continued correction toward $72,500: the level where one prominent analyst is already positioning to buy.
Analyst Ali Charts (@alicharts) flagged the breakdown on October 26, 2026, writing: “Bitcoin appears to have broken below a rising parallel channel on the 4-hour chart. As long as $82,000 holds as resistance, $BTC could continue correcting toward $72,500. That’s where I’ll be looking for the next buying opportunity.” The call is precise — not a range, not a zone. A single level where he intends to act.
The 4-Hour Channel Breakdown — What It Signals
A rising parallel channel on the 4-hour chart is a structure defined by two upward-sloping trendlines of equal gradient — one connecting swing lows, one connecting swing highs. When price breaks below the lower trendline with conviction, it signals that the sequence of higher lows sustaining the channel has been violated. The immediate implication: the market’s near-term bullish structure has broken down.
Ali Charts identifies $82,000 as the critical resistance level that must hold for the correction to continue. This is not a support-turned-resistance level in the classical sense — it is the structural significance of the broken channel’s lower boundary. A reclaim above $82,000 would invalidate the breakdown thesis and suggest the break was a false move. As long as that level caps any bounce, the corrective path toward $72,500 remains open.
BTC 4H Chart | Source: @alicharts (X)
Bitcoin is currently trading at $80,027 — already $1,973 below the $82,000 resistance threshold, meaning the resistance is already overhead, not ahead. The market has room to continue lower without first requiring a test of $82,000.
$72,500 — The Buy Zone
Ali Charts does not label $72,500 as a support level derived from a specific indicator. He identifies it as his next buying opportunity — a deliberate, pre-planned entry based on the measured move from the channel breakdown and prior structural context at that price area. The distance from current price ($80,027) to that level represents approximately 9.4% additional downside.
This framing matters. It separates a panic-driven sell target from a structured re-entry thesis. The analyst is not predicting capitulation — he is identifying a level where he believes risk/reward flips back in favor of bulls.
ETF Flows Add Context to the Sell Pressure
The channel breakdown does not exist in a vacuum. Spot Bitcoin ETF data via SoSoValue shows a $635.5M daily net outflow on the latest trading session (October 22), the heaviest single-day exit in recent sessions. IBIT alone recorded $110.3M in outflows, while FBTC shed another $31.8M. Total ETF net assets stand at $104.71B — still substantial, but the directional pressure from institutional redemptions is structurally consistent with the 4-hour chart’s message.
Over the past four trading sessions, the net ETF flow stands at +$442.7M (three inflow days, one outflow day), suggesting the trend is not a sustained institutional exit — but the magnitude of the single-day $635.5M outflow is notable context for why Bitcoin is struggling to hold structure above $80,000. For more on recent ETF redemption dynamics, see Bitcoin ETF Outflows Hit $137.9M on Oct 23 — Final Figure May Be Far Higher.
Macro Events This Week Could Accelerate the Move
Two macro data releases arrive on October 28 that could define near-term direction: Core PCE Price Index (MoM and YoY) and GDP (QoQ). These are the Federal Reserve’s preferred inflation and growth gauges. Markets currently price a 90.6% probability of a rate hold at the October 28 FOMC meeting (3.75%–4.00% target rate), per SoSoValue. A hotter-than-expected Core PCE print could pressure risk assets further, potentially accelerating Bitcoin’s path toward Ali Charts’ $72,500 target. A soft print could provide a relief bounce — but that bounce would need to stay below $82,000 to keep the bearish channel breakdown thesis intact.
It is also worth noting that Bitcoin’s behavior around macro-political cycles has precedent. Bitcoin’s Midterm Election Curse — Four Cycles, Four Crashes documents the historical pattern of Bitcoin underperforming into mid-term electoral windows — a backdrop that arguably adds structural context to this correction. Meanwhile, levered positions have already begun unwinding: Two Hyperliquid Whales were liquidated as Bitcoin dropped below $80K, a sign that the move below this psychological threshold carries real forced-selling consequences.
Strategy’s Conviction Provides an Institutional Counterpoint
Not all institutional actors are selling. Strategy (formerly MicroStrategy) added 267 BTC for $22.1M in its latest purchase, bringing total holdings to 848,517 BTC as of October 19. Over the past three weeks, Strategy acquired 851 BTC for $72.8M — a steady accumulation pace that reflects longer-term conviction regardless of near-term chart structure. This does not invalidate the 4-hour breakdown, but it does establish that at current price levels, at least one major institutional buyer remains active.
Bullish Scenario — Reclaim Above $82,000
A sustained 4-hour close above $82,000 would invalidate the channel breakdown thesis. It would suggest the lower trendline held as support on an intraday basis and that the break was a false move. In this scenario, the corrective setup toward $72,500 is off the table until price revisits and confirms the breakdown with a failed retest of $82,000 from below.
Bearish Scenario — $82,000 Caps and Correction Continues
If $82,000 continues to act as resistance on any bounce from current levels, Ali Charts’ base case plays out: Bitcoin continues lower toward $72,500, representing approximately 9.4% additional downside from the current $80,027 price. At that level, he has stated his intention to seek the next buying opportunity.
The 4-hour channel is broken. $82,000 is overhead resistance. Bitcoin at $80,027 is already 9.4% above the analyst’s stated buy zone. Two macro catalysts — Core PCE and GDP — arrive October 28 and will determine whether the correction accelerates or stalls. The level traders are watching: $82,000 to the upside as the invalidation point, and $72,500 to the downside as the structured re-entry.
**Disclaimer: **The views and analysis presented in this article are for informational purposes only and reflect the author’s perspective, not financial advice. Technical patterns and indicators discussed are subject to market volatility and may or may not yield the anticipated results. Investors are advised to exercise caution, conduct independent research, and make decisions aligned with their individual risk tolerance.
166
·
--

Article
Smart Trader 0xe813 Opens $63.88M ETH Long After Market Drop — 100% Win RateKey Highlights
Wallet 0xe813 opened a 26,974 ETH long worth $63.88M immediately after ETH's liquidation-driven dropPosition already shows $842K in unrealized profit — trader holds a 100% win rate with $3.3M prior profit on NEARETH faced $184M in 24h liquidations including $166.7M in longs — key support zone: $2,181–$2,256Spot ETH ETFs logged $110.6M in net outflows on October 22, compounding downside pressure
BREAKING
Ethereum is navigating a volatile session following a sharp market-wide selloff that triggered $184 million in 24-hour liquidations across ETH derivatives — of which $166.7 million were long liquidations. Open interest remains elevated near $44.26 billion, reflecting the scale of leveraged exposure still active in the market. The broader pressure was compounded by $110.6 million in net spot ETF outflows on October 22, per available reporting, amplifying downside as institutional exits coincided with the derivatives cascade.
Into that liquidation-driven drop, on-chain tracker Lookonchain flagged a decisive counter-move: wallet 0xe81309ec9b79309e4d108ae3a92d1aa618cd6d74 (abbreviated 0xe813) opened a leveraged long position on 26,974 ETH with a notional value of $63.88 million. The position was entered directly after the market dip — a deliberate buy-the-dip execution rather than a pre-existing hold. At the time Lookonchain reported the move, the position carried $842,000 in unrealized profit, indicating the entry was well-timed relative to immediate price recovery.
Smart Trader 0xe813 Opens $63.88M ETH Long | Source: @lookonchain (Telegram)
This wallet carries a 100% win rate across its tracked history on Hyperbot and previously extracted $3.3 million in profit from a $NEAR trade.
Smart Trader 0xe813 $NEAR Profits | Source: @lookonchain (Telegram)
On-chain analysts interpret a $63.88M long opened at the bottom of a liquidation cascade as a high-conviction dip-buy signal — not noise.
The context matters:
This was not accumulation during calm conditions. Wallet 0xe813 entered during peak fear, when $166.7 million in long liquidations were flushing overleveraged positions out of the market. A separate large BTC/ETH whale was also reported adding $9.21 million in USDC margin during the same session to avoid liquidation — suggesting the ETH liquidation zone near $2,181–$2,256 was the contested range. The 0xe813 long, sized at 26,974 ETH, suggests the trader expected that range to hold as structural support.
The level to watch:
ETH must defend the lower bound of that liquidation cluster. A breach below $2,181 would directly threaten the position’s thesis and could trigger a second cascade. A sustained hold above that level, followed by reclaim of the prior range, would validate the entry as a precision dip-buy into exhausted selling. For further context on how whale accumulation signals interact with broader market structure, see our analysis of the Bitcoin Whale Accumulation Signal and Bull Score reading.
What to watch next:
The Hyperbot tracker for 0xe813 will show whether the position is held, scaled up, or closed — each outcome carries a different signal. If the wallet adds to the 26,974 ETH long during any further weakness, it would suggest the trader sees deeper value below current levels. If it exits with profit quickly, it signals a short-term bounce trade rather than a macro conviction hold.
The 100% win rate across this wallet’s tracked history means community reaction on Lookonchain has been attentive — Ethereum’s broader recovery depends on whether the $2,181 support holds and ETF outflow pressure reverses. The Glamsterdam testnet delay adds no immediate bullish catalyst, meaning price recovery will need to be driven by on-chain demand and derivatives positioning alone.
Disclaimer: The views and analysis presented in this article are for informational purposes only and reflect the author’s perspective, not financial advice. Technical patterns and indicators discussed are subject to market volatility and may or may not yield the anticipated results. Investors are advised to exercise caution, conduct independent research, and make decisions aligned with their individual risk tolerance.
Smart Trader 0xe813 Opens $63.88M ETH Long After Market Drop — 100% Win Rate
Key Highlights
Wallet 0xe813 opened a 26,974 ETH long worth $63.88M immediately after ETH's liquidation-driven dropPosition already shows $842K in unrealized profit — trader holds a 100% win rate with $3.3M prior profit on NEARETH faced $184M in 24h liquidations including $166.7M in longs — key support zone: $2,181–$2,256Spot ETH ETFs logged $110.6M in net outflows on October 22, compounding downside pressure
BREAKING
Ethereum is navigating a volatile session following a sharp market-wide selloff that triggered $184 million in 24-hour liquidations across ETH derivatives — of which $166.7 million were long liquidations. Open interest remains elevated near $44.26 billion, reflecting the scale of leveraged exposure still active in the market. The broader pressure was compounded by $110.6 million in net spot ETF outflows on October 22, per available reporting, amplifying downside as institutional exits coincided with the derivatives cascade.
Into that liquidation-driven drop, on-chain tracker Lookonchain flagged a decisive counter-move: wallet 0xe81309ec9b79309e4d108ae3a92d1aa618cd6d74 (abbreviated 0xe813) opened a leveraged long position on 26,974 ETH with a notional value of $63.88 million. The position was entered directly after the market dip — a deliberate buy-the-dip execution rather than a pre-existing hold. At the time Lookonchain reported the move, the position carried $842,000 in unrealized profit, indicating the entry was well-timed relative to immediate price recovery.
Smart Trader 0xe813 Opens $63.88M ETH Long | Source: @lookonchain (Telegram)
This wallet carries a 100% win rate across its tracked history on Hyperbot and previously extracted $3.3 million in profit from a $NEAR trade.
Smart Trader 0xe813 $NEAR Profits | Source: @lookonchain (Telegram)
On-chain analysts interpret a $63.88M long opened at the bottom of a liquidation cascade as a high-conviction dip-buy signal — not noise.
The context matters:
This was not accumulation during calm conditions. Wallet 0xe813 entered during peak fear, when $166.7 million in long liquidations were flushing overleveraged positions out of the market. A separate large BTC/ETH whale was also reported adding $9.21 million in USDC margin during the same session to avoid liquidation — suggesting the ETH liquidation zone near $2,181–$2,256 was the contested range. The 0xe813 long, sized at 26,974 ETH, suggests the trader expected that range to hold as structural support.
The level to watch:
ETH must defend the lower bound of that liquidation cluster. A breach below $2,181 would directly threaten the position’s thesis and could trigger a second cascade. A sustained hold above that level, followed by reclaim of the prior range, would validate the entry as a precision dip-buy into exhausted selling. For further context on how whale accumulation signals interact with broader market structure, see our analysis of the Bitcoin Whale Accumulation Signal and Bull Score reading.
What to watch next:
The Hyperbot tracker for 0xe813 will show whether the position is held, scaled up, or closed — each outcome carries a different signal. If the wallet adds to the 26,974 ETH long during any further weakness, it would suggest the trader sees deeper value below current levels. If it exits with profit quickly, it signals a short-term bounce trade rather than a macro conviction hold.
The 100% win rate across this wallet’s tracked history means community reaction on Lookonchain has been attentive — Ethereum’s broader recovery depends on whether the $2,181 support holds and ETF outflow pressure reverses. The Glamsterdam testnet delay adds no immediate bullish catalyst, meaning price recovery will need to be driven by on-chain demand and derivatives positioning alone.
Disclaimer: The views and analysis presented in this article are for informational purposes only and reflect the author’s perspective, not financial advice. Technical patterns and indicators discussed are subject to market volatility and may or may not yield the anticipated results. Investors are advised to exercise caution, conduct independent research, and make decisions aligned with their individual risk tolerance.
508
·
--
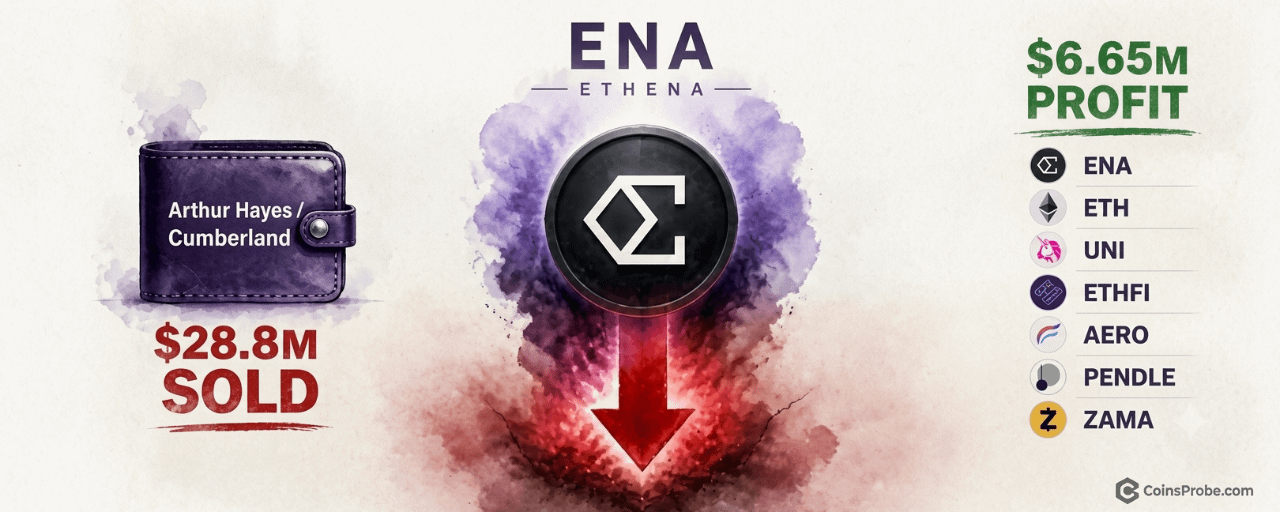
Article
Arthur Hayes Sells $28.8M in Tokens Over 24 Hours, Books $6.65M ProfitKey Highlights
Arthur Hayes sold $28.8M across 7 tokens in 24 hours, booking $6.65M net profit per LookonchainLatest move: 14M ENA ($2.73M) transferred to Cumberland institutional desk for liquidationProfits concentrated in ENA and ETH; UNI, ETHFI, AERO, PENDLE, ZAMA exited near breakeven$14.15M USDC withdrawn from trading platforms — confirms completed sales, not transfers
Ethena (ENA) has faced sustained selling following a series of large transfers tracked on-chain over a 24-hour window, with Lookonchain flagging the activity as it unfolded. ENA’s price action reflects the overhang — supply hitting the market at scale from a single identifiable wallet creates a specific, measurable headwind that differs from broad sentiment shifts.
The Move:
Arthur Hayes (@CryptoHayes), co-founder of BitMEX and managing partner of Maelstrom, transferred 14 million ENA — valued at approximately $2.73 million — to Cumberland, the institutional trading desk, for sale, according to data flagged by Lookonchain. This single transfer was the latest in a series of moves: over the preceding 24 hours, Hayes sent tokens worth a combined $28.81 million to trading platforms and subsequently withdrew approximately $14.15 million USDC — a withdrawal pattern consistent with completed sales rather than in-transit repositioning.
Arthur Hayes Sells $28.8M in Tokens Over 24 Hours | Source: @lookonchain (Telegram)
Full wallet activity is traceable via Arkham Intelligence. The seven tokens involved were ENA, ETH, UNI, ETHFI, AERO, PENDLE, and ZAMA. Hayes reported a net profit of $6.65 million on the combined activity, with the bulk of gains attributed to ENA and ETH; positions in UNI, ETHFI, AERO, PENDLE, and ZAMA were exited near breakeven. This follows a prior documented transfer that CoinsProbe covered separately: Arthur Hayes Moves $22.28M — ETH, ENA, UNI, ETHFI Among Seven Tokens Sent to Market Makers.
What This Signals:
Exchange inflows of this scale from a named, high-profile wallet represent a specific supply-side event — not a sentiment proxy. On-chain analysts interpret sustained transfers to a named institutional desk like Cumberland as active liquidation rather than strategic repositioning, particularly when paired with a near-equivalent USDC withdrawal confirming the loop is closed. The profit concentration in ENA and ETH suggests Hayes held meaningful unrealized gains in both and chose this window to realize them.
For ENA specifically, the key question is absorption: whether spot market buyers can absorb $2.73 million in fresh supply from this transfer alone — let alone the full 24-hour total — without sustained downward price pressure. On-chain analysts note that breakeven exits across UNI, ETHFI, AERO, PENDLE, and ZAMA indicate those positions were not part of a profit-taking thesis but rather a broader portfolio de-risking. The signal is unambiguously bearish for short-term $ENA price structure. The level to watch: any sustained bid below the price at time of transfer would confirm the market is unable to absorb the flow without concession.
Forward Outlook:
The Arkham wallet linked to Hayes remains active and trackable in real time. The next confirmation to monitor is whether additional ENA or ETH transfers to Cumberland or comparable institutional desks appear in the coming 24–48 hours — continued outflows would indicate the liquidation is ongoing rather than complete. Conversely, if no further transfers to exchanges appear and the USDC balance stabilizes, the distribution phase may be nearing an end.
Community reaction on-chain focused on the speed and scale of the exit — $28.81 million across seven tokens in a single 24-hour window is a coordinated unwind, not opportunistic dip selling. No new positions were flagged entering the wallet during this window, which rules out a simultaneous rotation into another asset as the motivation.
Disclaimer: The views and analysis presented in this article are for informational purposes only and reflect the author’s perspective, not financial advice. Technical patterns and indicators discussed are subject to market volatility and may or may not yield the anticipated results. Investors are advised to exercise caution, conduct independent research, and make decisions aligned with their individual risk tolerance.
Arthur Hayes Sells $28.8M in Tokens Over 24 Hours, Books $6.65M Profit
Key Highlights
Arthur Hayes sold $28.8M across 7 tokens in 24 hours, booking $6.65M net profit per LookonchainLatest move: 14M ENA ($2.73M) transferred to Cumberland institutional desk for liquidationProfits concentrated in ENA and ETH; UNI, ETHFI, AERO, PENDLE, ZAMA exited near breakeven$14.15M USDC withdrawn from trading platforms — confirms completed sales, not transfers
Ethena (ENA) has faced sustained selling following a series of large transfers tracked on-chain over a 24-hour window, with Lookonchain flagging the activity as it unfolded. ENA’s price action reflects the overhang — supply hitting the market at scale from a single identifiable wallet creates a specific, measurable headwind that differs from broad sentiment shifts.
The Move:
Arthur Hayes (@CryptoHayes), co-founder of BitMEX and managing partner of Maelstrom, transferred 14 million ENA — valued at approximately $2.73 million — to Cumberland, the institutional trading desk, for sale, according to data flagged by Lookonchain. This single transfer was the latest in a series of moves: over the preceding 24 hours, Hayes sent tokens worth a combined $28.81 million to trading platforms and subsequently withdrew approximately $14.15 million USDC — a withdrawal pattern consistent with completed sales rather than in-transit repositioning.
Arthur Hayes Sells $28.8M in Tokens Over 24 Hours | Source: @lookonchain (Telegram)
Full wallet activity is traceable via Arkham Intelligence. The seven tokens involved were ENA, ETH, UNI, ETHFI, AERO, PENDLE, and ZAMA. Hayes reported a net profit of $6.65 million on the combined activity, with the bulk of gains attributed to ENA and ETH; positions in UNI, ETHFI, AERO, PENDLE, and ZAMA were exited near breakeven. This follows a prior documented transfer that CoinsProbe covered separately: Arthur Hayes Moves $22.28M — ETH, ENA, UNI, ETHFI Among Seven Tokens Sent to Market Makers.
What This Signals:
Exchange inflows of this scale from a named, high-profile wallet represent a specific supply-side event — not a sentiment proxy. On-chain analysts interpret sustained transfers to a named institutional desk like Cumberland as active liquidation rather than strategic repositioning, particularly when paired with a near-equivalent USDC withdrawal confirming the loop is closed. The profit concentration in ENA and ETH suggests Hayes held meaningful unrealized gains in both and chose this window to realize them.
For ENA specifically, the key question is absorption: whether spot market buyers can absorb $2.73 million in fresh supply from this transfer alone — let alone the full 24-hour total — without sustained downward price pressure. On-chain analysts note that breakeven exits across UNI, ETHFI, AERO, PENDLE, and ZAMA indicate those positions were not part of a profit-taking thesis but rather a broader portfolio de-risking. The signal is unambiguously bearish for short-term $ENA price structure. The level to watch: any sustained bid below the price at time of transfer would confirm the market is unable to absorb the flow without concession.
Forward Outlook:
The Arkham wallet linked to Hayes remains active and trackable in real time. The next confirmation to monitor is whether additional ENA or ETH transfers to Cumberland or comparable institutional desks appear in the coming 24–48 hours — continued outflows would indicate the liquidation is ongoing rather than complete. Conversely, if no further transfers to exchanges appear and the USDC balance stabilizes, the distribution phase may be nearing an end.
Community reaction on-chain focused on the speed and scale of the exit — $28.81 million across seven tokens in a single 24-hour window is a coordinated unwind, not opportunistic dip selling. No new positions were flagged entering the wallet during this window, which rules out a simultaneous rotation into another asset as the motivation.
Disclaimer: The views and analysis presented in this article are for informational purposes only and reflect the author’s perspective, not financial advice. Technical patterns and indicators discussed are subject to market volatility and may or may not yield the anticipated results. Investors are advised to exercise caution, conduct independent research, and make decisions aligned with their individual risk tolerance.
1
1.3k
·
--
Article
Cardano Breaks Below Rising Channel — $0.166 in Focus After SuperTrend FlipKey Highlights
ADA trades at $0.2086 — down 3.36% — after breaking below a rising parallel channel that held since late June per @alichartsSuperTrend flipped bearish; last flip in May 2025 preceded a 46% correction on ADA$0.220 is the critical resistance — a sustained hold below targets $0.166, roughly 20% lowerWhale holdings (100M–1B ADA bracket) were flat over prior 10 days — no confirmed selling conviction yet
Cardano is trading at $0.2086 — down 3.36% in the last 24 hours — and the chart structure that supported the token since late June has now officially cracked. This is not a routine pullback. Analyst Ali Martinez (@alicharts) has confirmed a breakdown from the rising parallel channel that carried $ADA from $0.138 to $0.282 over four months, and the technicals now point toward a deeper leg lower.
“CARDANO BREAKDOWN CONFIRMED,” Martinez wrote on October 24, 2026, flagging that ADA has broken below the channel’s lower boundary — a level that, if it holds as resistance, sets up an approximately 20% decline from the $0.220 zone down to $0.166. This is the second bearish signal Martinez has flagged on Cardano within the same week, following a SuperTrend flip that he noted last flipped bearish in May 2025 — immediately preceding a 46% correction.
The Channel That Broke — Structure and Significance
From late June through mid-October 2026, ADA built a clean rising parallel channel — a structure defined by two parallel trendlines bounding price action on both sides. The lower boundary of this channel served as dynamic support through multiple retests, absorbing selling pressure each time price approached it. The channel’s range was substantial: a $0.144 swing from the $0.138 floor to the $0.282 peak, representing a 104% move at its peak.
ADA Daily Chart | Source: @alicharts (X)
That structure is now broken. Martinez’s analysis, published with a video chart illustrating the channel break, confirms that ADA has closed below the lower boundary. The breakdown is not an intraday wick — it is a confirmed structural breach. The prior support level near $0.21, which Martinez had identified in a referenced thread from October 20 as the critical daily close line, has been lost. At $0.2086 at time of writing, ADA is sitting just below that former boundary, which now acts as immediate overhead resistance.
SuperTrend Flips Bearish — The Last Time This Happened, ADA Fell 46%
The channel breakdown does not exist in isolation. In the October 20 thread (post 5 of 5), Martinez flagged that ADA’s SuperTrend indicator had flipped bearish — a signal he explicitly anchored to historical precedent. The last time the SuperTrend flipped bearish on ADA was May 22, 2025. What followed was a 46% correction.
The SuperTrend is a trend-following indicator built on Average True Range (ATR). It does not predict direction — it confirms it. When price closes below the SuperTrend line, the indicator flips from bullish to bearish, signaling that the prevailing trend has reversed. A flip is not noise. It is a structural regime change in trend momentum, and on ADA’s chart, it has now aligned with the channel breakdown — two independent signals pointing in the same direction simultaneously. The prior instance of this flip in May 2025 produced a 46% correction; the current setup places the next meaningful downside target at $0.166.
It is also worth noting the broader on-chain context. As covered previously on CoinsProbe, ADA whales had already dumped 110 million tokens as network activity fell 41% — a deterioration in fundamentals that makes the technical breakdown harder to dismiss as a temporary dip. Additionally, LINK, ADA, and SOL had already flashed bearish setups in earlier analyst flags, suggesting ADA’s current breakdown fits a pattern of coordinated technical deterioration across major altcoins.
Whale Activity — No Conviction Either Way, Yet
Martinez’s October 20 thread included an on-chain check on whale holdings in the 100 million–1 billion ADA bracket. His finding: flat over the prior 10 days — no significant accumulation, no significant distribution. At the time, this neutral reading meant neither bulls nor bears had whale-level conviction on their side. The breakdown since then has not yet been accompanied by confirmed whale selling, which Martinez cited as a secondary confirmation signal to watch alongside the $0.21 daily close criterion.
That $0.21 level has now been lost. Whether whales begin selling into this breakdown — or whether they accumulate into it — will determine the pace and depth of the correction. A spike in large-wallet outflows from ADA would validate the bearish scenario; renewed whale accumulation near current levels could slow the decline or produce a relief bounce.
The Levels That Matter From Here
Martinez’s analysis produces two specific numbers that define the trade structure going forward.
$0.220 — The Resistance That Must Hold. This is the level Martinez cites as the critical overhead zone. For the bearish thesis to remain intact, $0.220 must continue to reject price. A daily close back above $0.220 would put ADA back inside — or at least back in contact with — the channel’s lower boundary, materially weakening the breakdown case.
$0.166 — The Primary Downside Target. If $0.220 holds as resistance and the breakdown is sustained, Martinez’s target is approximately $0.166 — a decline of roughly 20% from the $0.220 resistance zone, and approximately 20.4% from current price ($0.2086). This level aligns with a prior consolidation zone from the channel’s early formation phase in late June and early July 2026.
Bullish Scenario — Reclaim of $0.220
If ADA reclaims $0.220 on a daily close, the breakdown is invalidated. Price would need to sustain above this level — not merely touch it — to re-engage the channel structure. A confirmed reclaim of $0.220 would shift the near-term bias back to neutral and open the path toward the mid-channel range near $0.24–$0.25. Previously, on-chain data had flagged coordinated spikes across BTC, XRP, and ADA that could complicate directional clarity — making the $0.220 close the definitive arbiter.
Bearish Scenario — Sustained Hold Below $0.220
If $0.220 acts as resistance and ADA continues to trade below it, the 20% correction path to $0.166 becomes the primary scenario. A break below $0.195 — the nearest intraday support — would accelerate selling pressure toward that target. The SuperTrend remains bearish unless price closes back above its dynamic line, which currently sits above $0.220.
Cardano’s breakdown from a four-month rising channel, confirmed by analyst Ali Martinez (@alicharts), coincides with a SuperTrend flip that last occurred in May 2025 — preceding a 46% correction. ADA is now trading at $0.2086, below the $0.21 threshold Martinez identified as the breakdown confirmation level. The $0.220 zone is the resistance line: every daily close below it keeps the correction thesis alive. The $0.166 target — approximately 20% below current price — is what Martinez’s framework points toward. Watch $0.220 on a daily close basis as the single level that either confirms or invalidates this breakdown.
Disclaimer: The views and analysis presented in this article are for informational purposes only and reflect the author’s perspective, not financial advice. Technical patterns and indicators discussed are subject to market volatility and may or may not yield the anticipated results. Investors are advised to exercise caution, conduct independent research, and make decisions aligned with their individual risk tolerance.
Cardano Breaks Below Rising Channel — $0.166 in Focus After SuperTrend Flip
Key Highlights
ADA trades at $0.2086 — down 3.36% — after breaking below a rising parallel channel that held since late June per @alichartsSuperTrend flipped bearish; last flip in May 2025 preceded a 46% correction on ADA$0.220 is the critical resistance — a sustained hold below targets $0.166, roughly 20% lowerWhale holdings (100M–1B ADA bracket) were flat over prior 10 days — no confirmed selling conviction yet
Cardano is trading at $0.2086 — down 3.36% in the last 24 hours — and the chart structure that supported the token since late June has now officially cracked. This is not a routine pullback. Analyst Ali Martinez (@alicharts) has confirmed a breakdown from the rising parallel channel that carried $ADA from $0.138 to $0.282 over four months, and the technicals now point toward a deeper leg lower.
“CARDANO BREAKDOWN CONFIRMED,” Martinez wrote on October 24, 2026, flagging that ADA has broken below the channel’s lower boundary — a level that, if it holds as resistance, sets up an approximately 20% decline from the $0.220 zone down to $0.166. This is the second bearish signal Martinez has flagged on Cardano within the same week, following a SuperTrend flip that he noted last flipped bearish in May 2025 — immediately preceding a 46% correction.
The Channel That Broke — Structure and Significance
From late June through mid-October 2026, ADA built a clean rising parallel channel — a structure defined by two parallel trendlines bounding price action on both sides. The lower boundary of this channel served as dynamic support through multiple retests, absorbing selling pressure each time price approached it. The channel’s range was substantial: a $0.144 swing from the $0.138 floor to the $0.282 peak, representing a 104% move at its peak.
ADA Daily Chart | Source: @alicharts (X)
That structure is now broken. Martinez’s analysis, published with a video chart illustrating the channel break, confirms that ADA has closed below the lower boundary. The breakdown is not an intraday wick — it is a confirmed structural breach. The prior support level near $0.21, which Martinez had identified in a referenced thread from October 20 as the critical daily close line, has been lost. At $0.2086 at time of writing, ADA is sitting just below that former boundary, which now acts as immediate overhead resistance.
SuperTrend Flips Bearish — The Last Time This Happened, ADA Fell 46%
The channel breakdown does not exist in isolation. In the October 20 thread (post 5 of 5), Martinez flagged that ADA’s SuperTrend indicator had flipped bearish — a signal he explicitly anchored to historical precedent. The last time the SuperTrend flipped bearish on ADA was May 22, 2025. What followed was a 46% correction.
The SuperTrend is a trend-following indicator built on Average True Range (ATR). It does not predict direction — it confirms it. When price closes below the SuperTrend line, the indicator flips from bullish to bearish, signaling that the prevailing trend has reversed. A flip is not noise. It is a structural regime change in trend momentum, and on ADA’s chart, it has now aligned with the channel breakdown — two independent signals pointing in the same direction simultaneously. The prior instance of this flip in May 2025 produced a 46% correction; the current setup places the next meaningful downside target at $0.166.
It is also worth noting the broader on-chain context. As covered previously on CoinsProbe, ADA whales had already dumped 110 million tokens as network activity fell 41% — a deterioration in fundamentals that makes the technical breakdown harder to dismiss as a temporary dip. Additionally, LINK, ADA, and SOL had already flashed bearish setups in earlier analyst flags, suggesting ADA’s current breakdown fits a pattern of coordinated technical deterioration across major altcoins.
Whale Activity — No Conviction Either Way, Yet
Martinez’s October 20 thread included an on-chain check on whale holdings in the 100 million–1 billion ADA bracket. His finding: flat over the prior 10 days — no significant accumulation, no significant distribution. At the time, this neutral reading meant neither bulls nor bears had whale-level conviction on their side. The breakdown since then has not yet been accompanied by confirmed whale selling, which Martinez cited as a secondary confirmation signal to watch alongside the $0.21 daily close criterion.
That $0.21 level has now been lost. Whether whales begin selling into this breakdown — or whether they accumulate into it — will determine the pace and depth of the correction. A spike in large-wallet outflows from ADA would validate the bearish scenario; renewed whale accumulation near current levels could slow the decline or produce a relief bounce.
The Levels That Matter From Here
Martinez’s analysis produces two specific numbers that define the trade structure going forward.
$0.220 — The Resistance That Must Hold. This is the level Martinez cites as the critical overhead zone. For the bearish thesis to remain intact, $0.220 must continue to reject price. A daily close back above $0.220 would put ADA back inside — or at least back in contact with — the channel’s lower boundary, materially weakening the breakdown case.
$0.166 — The Primary Downside Target. If $0.220 holds as resistance and the breakdown is sustained, Martinez’s target is approximately $0.166 — a decline of roughly 20% from the $0.220 resistance zone, and approximately 20.4% from current price ($0.2086). This level aligns with a prior consolidation zone from the channel’s early formation phase in late June and early July 2026.
Bullish Scenario — Reclaim of $0.220
If ADA reclaims $0.220 on a daily close, the breakdown is invalidated. Price would need to sustain above this level — not merely touch it — to re-engage the channel structure. A confirmed reclaim of $0.220 would shift the near-term bias back to neutral and open the path toward the mid-channel range near $0.24–$0.25. Previously, on-chain data had flagged coordinated spikes across BTC, XRP, and ADA that could complicate directional clarity — making the $0.220 close the definitive arbiter.
Bearish Scenario — Sustained Hold Below $0.220
If $0.220 acts as resistance and ADA continues to trade below it, the 20% correction path to $0.166 becomes the primary scenario. A break below $0.195 — the nearest intraday support — would accelerate selling pressure toward that target. The SuperTrend remains bearish unless price closes back above its dynamic line, which currently sits above $0.220.
Cardano’s breakdown from a four-month rising channel, confirmed by analyst Ali Martinez (@alicharts), coincides with a SuperTrend flip that last occurred in May 2025 — preceding a 46% correction. ADA is now trading at $0.2086, below the $0.21 threshold Martinez identified as the breakdown confirmation level. The $0.220 zone is the resistance line: every daily close below it keeps the correction thesis alive. The $0.166 target — approximately 20% below current price — is what Martinez’s framework points toward. Watch $0.220 on a daily close basis as the single level that either confirms or invalidates this breakdown.
Disclaimer: The views and analysis presented in this article are for informational purposes only and reflect the author’s perspective, not financial advice. Technical patterns and indicators discussed are subject to market volatility and may or may not yield the anticipated results. Investors are advised to exercise caution, conduct independent research, and make decisions aligned with their individual risk tolerance.
1
2
1k
·
--
Article
Apple Prints TD Sequential Sell 9 — Last Two Led to 15.66% and 13.63% CorrectionsKey Highlights
AAPL weekly chart prints TD Sequential sell '9' signal at $346.72 per @alichartsPrior two weekly sell signals preceded corrections of −15.66% and −13.63% respectivelyChannel lower boundary at $339 is the first confirmation level; $332 is the failure targetPattern status: still forming — no breakdown confirmed, price remains near recent highs
Apple Inc. ($AAPL) is trading at approximately $346.72 on the weekly chart — and a technical signal with a two-for-two track record of preceding double-digit corrections has just fired again. The TD Sequential has printed a sell “9” on the weekly timeframe, the same configuration that preceded pullbacks of 15.66% and 13.63% in its two most recent appearances.
The warning comes from analyst Ali Martinez (@alicharts), who flagged the setup on October 23, 2026, framing it directly: “APPLE BLOW-OFF TOP? The TD Sequential has flashed a sell signal on the weekly chart, suggesting $AAPL could be due for a retracement. This signal is worth paying attention to.” Martinez has tracked Apple’s technical structure closely, and the recurrence of this specific signal at elevated price levels warrants a precise breakdown of the mechanism and the prior track record.
What the TD Sequential “9” Actually Measures
The TD Sequential is a momentum exhaustion indicator developed by Tom DeMark. It does not identify a specific price level as resistance — it identifies the duration of a directional move. A sell “9” prints when price closes higher than the corresponding close four bars earlier for nine consecutive candles. On the weekly chart, that means nine straight weeks of relative upside momentum — a condition that historically marks not a reversal in itself, but a high-probability zone of exhaustion where buying pressure has become statistically extended.
The critical distinction: the TD Sequential is a non-directional momentum exhaustion signal. It does not predict magnitude or guarantee a reversal. What it does is identify conditions under which price has historically been vulnerable to mean-reversion. The signal becomes meaningful precisely because of its historical batting average — and in Apple’s case on the weekly timeframe, that record is two-for-two.
The Track Record — Two-for-Two on the Weekly Chart
The weekly chart of $AAPL shared by @alicharts marks three TD Sequential sell “9” signals across the February–November timeframe. The first two are annotated with their confirmed outcomes — percentage declines that are historical facts, not projections. The third is the current signal, still forming.
Signal Instance Signal Type Correction Produced Status First weekly sell 9 TD Sequential Sell −15.66% Confirmed (historical) Second weekly sell 9 TD Sequential Sell −13.63% Confirmed (historical) Third weekly sell 9 TD Sequential Sell TBD Signal active, no breakdown confirmed
Source: @alicharts (X), Apple Weekly Chart — October 2026
The average correction across the two prior instances is approximately 14.6%. Applied mechanically from the current chart price of $346.72, that would imply a hypothetical retracement zone — but the TD Sequential does not generate price targets. The historical percentages are data observations, not forward projections, and Martinez does not attach a target to this signal.
Channel Context — $347 Rejection, $339 and $332 in Focus
In a prior post on October 22, 2026 (ID: 2113283856723779630), which Martinez’s October 23 post quotes for channel context, he identified a rejection at $347 as a structural reference. The channel’s lower boundary sits at $339, which becomes the immediate focus if selling pressure materializes. A failure to hold $339 would shift attention to $332 as the next structural level. These levels are drawn from Martinez’s channel analysis and represent the price architecture framing the current TD Sequential signal.
Apple’s concentration in equity indices adds a macro dimension worth noting here. As covered previously, Nvidia and Apple together represent 15% of the S&P 500 — a concentration that surpassed the 1999 dot-com peak. A double-digit correction in AAPL at these weights is not isolated stock risk — it carries index-level implications. Separately, the degree to which 10 stocks have driven 70% of the S&P 500’s gains since March 30 means any rotation out of mega-cap names would be felt broadly.
What the Signal Says — and What It Doesn’t
What it says: Apple’s weekly chart has printed a TD Sequential sell 9 at $346.72 — a momentum exhaustion condition that preceded corrections of 15.66% and 13.63% in its two most recent weekly occurrences. The signal is active.
What it doesn’t say: It does not confirm a reversal has begun. No breakdown has occurred. The pattern status is still forming — price remains near recent highs. The TD Sequential flags exhaustion zones; price can extend further before resolving, and not every sell 9 produces a correction of comparable magnitude.
What to watch for confirmation: A weekly close below $339 — the channel lower boundary Martinez identifies — would be the first structural confirmation that the sell signal is being validated. Loss of $332 would confirm a deeper correction is underway.
Bullish Scenario — Signal Fails, Extension Continues
If $AAPLB holds above $347 on a weekly closing basis and the TD Sequential signal is absorbed without a directional breakdown, the pattern fails to confirm. In prior cycles where sell 9 signals have not preceded meaningful corrections, price has often ground higher as bulls exhausted the residual selling pressure. No specific upside target is warranted by the current data.
Bearish Scenario — Channel Breakdown Confirms the Signal
A weekly close below $339 opens the path toward $332, the failure level Martinez identified in his October 22 channel analysis. Applying the average of the two prior TD Sequential corrections (−14.6%) from the $346.72 chart price produces a hypothetical zone near $296 — but this is a mechanical observation, not a stated target, and the analyst has not assigned a correction magnitude to the current signal.
Apple’s technical setup at $346.72 is a two-for-two warning with an unresolved outcome. The sell “9” is printed. The channel rejection at $347 is documented. The prior corrections of 15.66% and 13.63% are on record. What remains is price confirmation — and that answer arrives at $339 on a weekly closing basis.
Disclaimer: The views and analysis presented in this article are for informational purposes only and reflect the author’s perspective, not financial advice. Technical patterns and indicators discussed are subject to market volatility and may or may not yield the anticipated results. Investors are advised to exercise caution, conduct independent research, and make decisions aligned with their individual risk tolerance.
Apple Prints TD Sequential Sell 9 — Last Two Led to 15.66% and 13.63% Corrections
Key Highlights
AAPL weekly chart prints TD Sequential sell '9' signal at $346.72 per @alichartsPrior two weekly sell signals preceded corrections of −15.66% and −13.63% respectivelyChannel lower boundary at $339 is the first confirmation level; $332 is the failure targetPattern status: still forming — no breakdown confirmed, price remains near recent highs
Apple Inc. ($AAPL ) is trading at approximately $346.72 on the weekly chart — and a technical signal with a two-for-two track record of preceding double-digit corrections has just fired again. The TD Sequential has printed a sell “9” on the weekly timeframe, the same configuration that preceded pullbacks of 15.66% and 13.63% in its two most recent appearances.
The warning comes from analyst Ali Martinez (@alicharts), who flagged the setup on October 23, 2026, framing it directly: “APPLE BLOW-OFF TOP? The TD Sequential has flashed a sell signal on the weekly chart, suggesting $AAPL could be due for a retracement. This signal is worth paying attention to.” Martinez has tracked Apple’s technical structure closely, and the recurrence of this specific signal at elevated price levels warrants a precise breakdown of the mechanism and the prior track record.
What the TD Sequential “9” Actually Measures
The TD Sequential is a momentum exhaustion indicator developed by Tom DeMark. It does not identify a specific price level as resistance — it identifies the duration of a directional move. A sell “9” prints when price closes higher than the corresponding close four bars earlier for nine consecutive candles. On the weekly chart, that means nine straight weeks of relative upside momentum — a condition that historically marks not a reversal in itself, but a high-probability zone of exhaustion where buying pressure has become statistically extended.
The critical distinction: the TD Sequential is a non-directional momentum exhaustion signal. It does not predict magnitude or guarantee a reversal. What it does is identify conditions under which price has historically been vulnerable to mean-reversion. The signal becomes meaningful precisely because of its historical batting average — and in Apple’s case on the weekly timeframe, that record is two-for-two.
The Track Record — Two-for-Two on the Weekly Chart
The weekly chart of $AAPL shared by @alicharts marks three TD Sequential sell “9” signals across the February–November timeframe. The first two are annotated with their confirmed outcomes — percentage declines that are historical facts, not projections. The third is the current signal, still forming.
Signal Instance Signal Type Correction Produced Status First weekly sell 9 TD Sequential Sell −15.66% Confirmed (historical) Second weekly sell 9 TD Sequential Sell −13.63% Confirmed (historical) Third weekly sell 9 TD Sequential Sell TBD Signal active, no breakdown confirmed
Source: @alicharts (X), Apple Weekly Chart — October 2026
The average correction across the two prior instances is approximately 14.6%. Applied mechanically from the current chart price of $346.72, that would imply a hypothetical retracement zone — but the TD Sequential does not generate price targets. The historical percentages are data observations, not forward projections, and Martinez does not attach a target to this signal.
Channel Context — $347 Rejection, $339 and $332 in Focus
In a prior post on October 22, 2026 (ID: 2113283856723779630), which Martinez’s October 23 post quotes for channel context, he identified a rejection at $347 as a structural reference. The channel’s lower boundary sits at $339, which becomes the immediate focus if selling pressure materializes. A failure to hold $339 would shift attention to $332 as the next structural level. These levels are drawn from Martinez’s channel analysis and represent the price architecture framing the current TD Sequential signal.
Apple’s concentration in equity indices adds a macro dimension worth noting here. As covered previously, Nvidia and Apple together represent 15% of the S&P 500 — a concentration that surpassed the 1999 dot-com peak. A double-digit correction in AAPL at these weights is not isolated stock risk — it carries index-level implications. Separately, the degree to which 10 stocks have driven 70% of the S&P 500’s gains since March 30 means any rotation out of mega-cap names would be felt broadly.
What the Signal Says — and What It Doesn’t
What it says: Apple’s weekly chart has printed a TD Sequential sell 9 at $346.72 — a momentum exhaustion condition that preceded corrections of 15.66% and 13.63% in its two most recent weekly occurrences. The signal is active.
What it doesn’t say: It does not confirm a reversal has begun. No breakdown has occurred. The pattern status is still forming — price remains near recent highs. The TD Sequential flags exhaustion zones; price can extend further before resolving, and not every sell 9 produces a correction of comparable magnitude.
What to watch for confirmation: A weekly close below $339 — the channel lower boundary Martinez identifies — would be the first structural confirmation that the sell signal is being validated. Loss of $332 would confirm a deeper correction is underway.
Bullish Scenario — Signal Fails, Extension Continues
If $AAPLB holds above $347 on a weekly closing basis and the TD Sequential signal is absorbed without a directional breakdown, the pattern fails to confirm. In prior cycles where sell 9 signals have not preceded meaningful corrections, price has often ground higher as bulls exhausted the residual selling pressure. No specific upside target is warranted by the current data.
Bearish Scenario — Channel Breakdown Confirms the Signal
A weekly close below $339 opens the path toward $332, the failure level Martinez identified in his October 22 channel analysis. Applying the average of the two prior TD Sequential corrections (−14.6%) from the $346.72 chart price produces a hypothetical zone near $296 — but this is a mechanical observation, not a stated target, and the analyst has not assigned a correction magnitude to the current signal.
Apple’s technical setup at $346.72 is a two-for-two warning with an unresolved outcome. The sell “9” is printed. The channel rejection at $347 is documented. The prior corrections of 15.66% and 13.63% are on record. What remains is price confirmation — and that answer arrives at $339 on a weekly closing basis.
Disclaimer: The views and analysis presented in this article are for informational purposes only and reflect the author’s perspective, not financial advice. Technical patterns and indicators discussed are subject to market volatility and may or may not yield the anticipated results. Investors are advised to exercise caution, conduct independent research, and make decisions aligned with their individual risk tolerance.
165
·
--
Article
Gold’s Head and Shoulders Tests Neckline — $4,000 in Focus If Support BreaksKey Highlights
Gold is testing a potential Head and Shoulders neckline near $4,022 — no confirmed breakdown yetAnalyst Ali Martinez notes market psychology stages, with $4,000 as a possible next support if the neckline failsA daily close below $4,022 would activate the pattern; a hold keeps the structure unconfirmedReclaim above $4,200 would invalidate the bearish setup
Gold is trading at approximately $4,037 — sitting directly on the neckline of a developing Head and Shoulders pattern that peaked at $5,418. Contrary to earlier reports of a confirmed breakdown, the daily chart has not yet closed decisively below the $4,022 neckline support. The pattern is under test, not resolved.
Analyst Ali Martinez (@alicharts) shared the chart on October 23, 2026, with the caption “gold is a safe haven, they said…” alongside a prior note outlining classic market psychology stages. His framework remains conditional: the structure is intact until price confirms a break.
The Head and Shoulders — Still Testing, Not Broken
Gold’s Head and Shoulders Pattern| Source: @alicharts (X)
The pattern shows a Left Shoulder during the prior rally, a Head at the $5,418 cycle peak, and a Right Shoulder that failed to make a new high. The neckline sits near $4,022. At the time of writing, price is holding around this level rather than closing below it.
Martinez’s earlier psychology-cycle post mapped potential stages if weakness continues: a move toward $4,000 (anger phase), followed by a possible relief rally into $4,100–$4,200, and only then a deeper decline if the pattern fully activates. These levels are contingent on a confirmed neckline break — which has not occurred.
The Roadmap Remains Conditional
Immediate support: $4,022 (neckline under test)Potential next downside if broken: $4,000Expected relief zone if $4,000 is reached: $4,100–$4,200Full measured-move targets (only if breakdown confirms): $3,085 and $2,843
A sustained daily close below $4,022 is required before the bearish measured move becomes active. Until that happens, the pattern is a potential setup, not a completed breakdown.
Bullish Scenario — Neckline Holds
Gold holds above $4,022 on a daily closing basis and reclaims $4,200. This would invalidate the Head and Shoulders structure and reopen the path toward higher levels, including the prior Right Shoulder zone near $4,500.
Bearish Scenario — Confirmed Break Below $4,022
A daily close below $4,022 activates the pattern. In that case, Martinez’s sequenced path toward $4,000, followed by a relief rally into $4,100–$4,200, and then deeper measured-move targets near $3,085 and $2,843 becomes the active roadmap.
Watch $4,022 on a daily close. That level remains the line between an unconfirmed pattern and a completed breakdown. A hold keeps the structure neutral; a break turns the measured-move thesis live.
Disclaimer: The views and analysis presented in this article are for informational purposes only and reflect the author’s perspective, not financial advice. Technical patterns and indicators discussed are subject to market volatility and may or may not yield the anticipated results. Investors are advised to exercise caution, conduct independent research, and make decisions aligned with their individual risk tolerance.
Gold’s Head and Shoulders Tests Neckline — $4,000 in Focus If Support Breaks
Key Highlights
Gold is testing a potential Head and Shoulders neckline near $4,022 — no confirmed breakdown yetAnalyst Ali Martinez notes market psychology stages, with $4,000 as a possible next support if the neckline failsA daily close below $4,022 would activate the pattern; a hold keeps the structure unconfirmedReclaim above $4,200 would invalidate the bearish setup
Gold is trading at approximately $4,037 — sitting directly on the neckline of a developing Head and Shoulders pattern that peaked at $5,418. Contrary to earlier reports of a confirmed breakdown, the daily chart has not yet closed decisively below the $4,022 neckline support. The pattern is under test, not resolved.
Analyst Ali Martinez (@alicharts) shared the chart on October 23, 2026, with the caption “gold is a safe haven, they said…” alongside a prior note outlining classic market psychology stages. His framework remains conditional: the structure is intact until price confirms a break.
The Head and Shoulders — Still Testing, Not Broken
Gold’s Head and Shoulders Pattern| Source: @alicharts (X)
The pattern shows a Left Shoulder during the prior rally, a Head at the $5,418 cycle peak, and a Right Shoulder that failed to make a new high. The neckline sits near $4,022. At the time of writing, price is holding around this level rather than closing below it.
Martinez’s earlier psychology-cycle post mapped potential stages if weakness continues: a move toward $4,000 (anger phase), followed by a possible relief rally into $4,100–$4,200, and only then a deeper decline if the pattern fully activates. These levels are contingent on a confirmed neckline break — which has not occurred.
The Roadmap Remains Conditional
Immediate support: $4,022 (neckline under test)Potential next downside if broken: $4,000Expected relief zone if $4,000 is reached: $4,100–$4,200Full measured-move targets (only if breakdown confirms): $3,085 and $2,843
A sustained daily close below $4,022 is required before the bearish measured move becomes active. Until that happens, the pattern is a potential setup, not a completed breakdown.
Bullish Scenario — Neckline Holds
Gold holds above $4,022 on a daily closing basis and reclaims $4,200. This would invalidate the Head and Shoulders structure and reopen the path toward higher levels, including the prior Right Shoulder zone near $4,500.
Bearish Scenario — Confirmed Break Below $4,022
A daily close below $4,022 activates the pattern. In that case, Martinez’s sequenced path toward $4,000, followed by a relief rally into $4,100–$4,200, and then deeper measured-move targets near $3,085 and $2,843 becomes the active roadmap.
Watch $4,022 on a daily close. That level remains the line between an unconfirmed pattern and a completed breakdown. A hold keeps the structure neutral; a break turns the measured-move thesis live.
Disclaimer: The views and analysis presented in this article are for informational purposes only and reflect the author’s perspective, not financial advice. Technical patterns and indicators discussed are subject to market volatility and may or may not yield the anticipated results. Investors are advised to exercise caution, conduct independent research, and make decisions aligned with their individual risk tolerance.
388
·
--
Article
Bitcoin Faces Macro Headwind as Brent Crude Holds Above $100Key Highlights
Bitcoin trades at $81,524 (-0.72% 24h) as Brent crude holds above $100, above its 365-day moving averageCryptoQuant analyst @Darkfost_Coc: "When Brent settles into a strong upward trend, above its annual average, Bitcoin has often slowed down"The headwind condition clears only when Brent sustains a move back below its 365-day moving average — not yet the case
Bitcoin is trading at $81,524 — down 0.72% in the past 24 hours — with a market capitalization of approximately $1.64 trillion, as a macro signal that has historically preceded periods of slowed BTC appreciation reasserts itself. Brent crude oil is holding above $100 per barrel, a level that CryptoQuant analyst @Darkfost_Coc identifies as a significant headwind for Bitcoin based on a decade-long correlation pattern.
In a note published via CryptoQuant’s Quicktake platform on October 23, 2026, Darkfost states directly: “Over the long term, we can see that when Brent settles into a strong upward trend, above its annual average, Bitcoin has often slowed down.” The operative condition here is not simply that oil is elevated — it is that Brent is trending above its 365-day moving average in a sustained, directional upward move. That is a structurally different environment from a brief oil spike.
The Signal — Brent Above Its 365-Day Moving Average
The mechanism Darkfost documents is a macro liquidity effect, not a direct Bitcoin correlation. When Brent crude trades in a sustained upward trend above its annual moving average, it signals persistent inflationary pressure in the global energy complex. That environment typically tightens real disposable income, raises input costs across industries, and pressures central banks toward restrictive monetary policy — all of which reduce the marginal appetite for risk assets, including Bitcoin.
The chart shared by @cryptoquant_com plots Bitcoin’s logarithmic price history against Brent crude from approximately 2014 through 2026. The gray shaded bars on the chart mark the periods when this condition — Brent sustaining a trend above its 365-day average — was active. The visual pattern is clear: those shaded periods cluster around Bitcoin consolidation phases and momentum slowdowns, not the explosive vertical legs of BTC bull markets. Brent’s current reading is annotated on the chart at approximately 104.2 on the left axis, placing it above the 365-day average line that is itself now trending upward.
Chart Analysis | Source: @cryptoquant_com (X)
This is not a claim that oil causes Bitcoin to fall. The analyst’s stated finding is more precise: Bitcoin has often slowed down in these environments. The implication for the current moment is a macro friction that does not support a clean continuation of Bitcoin’s prior upward momentum without resolution in the energy complex.
Why This Macro Backdrop Is Structurally Different
There is an important distinction between Brent being elevated and Brent being in a strong upward trend above its annual average. A single oil spike — caused by a geopolitical event, a hurricane, or a brief supply disruption — tends to be self-correcting and does not create the sustained macro drag that Darkfost’s model captures. What the current setup reflects is a durable trend: Brent’s 365-day moving average itself is now curving upward, meaning the benchmark is structurally rising, not just printing a one-time high.
That distinction matters for Bitcoin investors because it determines duration. If Brent were simply elevated on a transient shock, the macro friction would be temporary. A sustained trend above the annual average — the condition the chart specifically identifies — creates a persistent backdrop that has historically coincided with extended BTC consolidation, not a brief pause before resumption.
Bitcoin has not been immune to macro conditions in prior cycles. The long-term holder net position change, which hit +1.27M BTC but is already showing a pace slowdown, reflects a similar dynamic — accumulation exists, but momentum is decelerating at the macro level. Similarly, large-scale whale deposits of 949.7 BTC to Binance and Deribit in recent sessions suggest participants are actively managing exposure rather than adding with conviction.
What the Signal Says — and What It Doesn’t
Darkfost’s observation is directional, not a price target. The analyst does not provide a specific BTC downside level, a price at which Brent crude would stop being a headwind, or a numeric threshold for the oil condition to clear. The finding is explicitly a long-term pattern observation: when the condition is active, Bitcoin has often slowed down. “Often” is the analyst’s word — it is a statistical tendency, not a deterministic rule.
What the signal does not say: it does not predict an imminent Bitcoin collapse, assign a specific percentage drawdown, or establish a timeline. The chart covers over a decade of data, meaning the Brent-above-annual-average condition has appeared across multiple cycle phases, and Bitcoin’s response has varied in magnitude and duration. The consistent pattern is momentum attenuation — not outright reversal in every instance.
What to watch for a change in the macro setup: a sustained move by Brent crude back below its 365-day moving average would remove the headwind condition Darkfost identifies. Until that occurs, the structural macro friction remains active by the analyst’s own criteria.
Bullish Scenario
If Brent crude reverses below its 365-day moving average — removing the headwind condition Darkfost documents — Bitcoin’s historically observed drag from elevated oil prices would dissipate, potentially allowing momentum to resume. Any significant demand shock (demand destruction, OPEC production increase, or geopolitical resolution) that breaks Brent’s upward trend would change the macro backdrop identified in this analysis.
Bearish Scenario
If Brent crude continues trending above $100 and its 365-day moving average continues rising, the sustained headwind condition identified by Darkfost remains intact. Bitcoin at $81,524 would face the same macro friction that the chart shows has historically coincided with extended BTC consolidation periods rather than new all-time high extensions.
The core thesis here is macroeconomic, not technical. Darkfost’s analysis does not establish a Bitcoin price floor or a specific level at which the thesis fails — it documents an environmental condition. Traders watching this signal should track Brent crude’s relationship to its own 365-day moving average as the primary variable, not Bitcoin’s immediate price action. The condition is either active or it is not. At $100+ and trending, it is currently active.
Disclaimer: The views and analysis presented in this article are for informational purposes only and reflect the author’s perspective, not financial advice. Technical patterns and indicators discussed are subject to market volatility and may or may not yield the anticipated results. Investors are advised to exercise caution, conduct independent research, and make decisions aligned with their individual risk tolerance.
Bitcoin Faces Macro Headwind as Brent Crude Holds Above $100
Key Highlights
Bitcoin trades at $81,524 (-0.72% 24h) as Brent crude holds above $100, above its 365-day moving averageCryptoQuant analyst @Darkfost_Coc: "When Brent settles into a strong upward trend, above its annual average, Bitcoin has often slowed down"The headwind condition clears only when Brent sustains a move back below its 365-day moving average — not yet the case
Bitcoin is trading at $81,524 — down 0.72% in the past 24 hours — with a market capitalization of approximately $1.64 trillion, as a macro signal that has historically preceded periods of slowed BTC appreciation reasserts itself. Brent crude oil is holding above $100 per barrel, a level that CryptoQuant analyst @Darkfost_Coc identifies as a significant headwind for Bitcoin based on a decade-long correlation pattern.
In a note published via CryptoQuant’s Quicktake platform on October 23, 2026, Darkfost states directly: “Over the long term, we can see that when Brent settles into a strong upward trend, above its annual average, Bitcoin has often slowed down.” The operative condition here is not simply that oil is elevated — it is that Brent is trending above its 365-day moving average in a sustained, directional upward move. That is a structurally different environment from a brief oil spike.
The Signal — Brent Above Its 365-Day Moving Average
The mechanism Darkfost documents is a macro liquidity effect, not a direct Bitcoin correlation. When Brent crude trades in a sustained upward trend above its annual moving average, it signals persistent inflationary pressure in the global energy complex. That environment typically tightens real disposable income, raises input costs across industries, and pressures central banks toward restrictive monetary policy — all of which reduce the marginal appetite for risk assets, including Bitcoin.
The chart shared by @cryptoquant_com plots Bitcoin’s logarithmic price history against Brent crude from approximately 2014 through 2026. The gray shaded bars on the chart mark the periods when this condition — Brent sustaining a trend above its 365-day average — was active. The visual pattern is clear: those shaded periods cluster around Bitcoin consolidation phases and momentum slowdowns, not the explosive vertical legs of BTC bull markets. Brent’s current reading is annotated on the chart at approximately 104.2 on the left axis, placing it above the 365-day average line that is itself now trending upward.
Chart Analysis | Source: @cryptoquant_com (X)
This is not a claim that oil causes Bitcoin to fall. The analyst’s stated finding is more precise: Bitcoin has often slowed down in these environments. The implication for the current moment is a macro friction that does not support a clean continuation of Bitcoin’s prior upward momentum without resolution in the energy complex.
Why This Macro Backdrop Is Structurally Different
There is an important distinction between Brent being elevated and Brent being in a strong upward trend above its annual average. A single oil spike — caused by a geopolitical event, a hurricane, or a brief supply disruption — tends to be self-correcting and does not create the sustained macro drag that Darkfost’s model captures. What the current setup reflects is a durable trend: Brent’s 365-day moving average itself is now curving upward, meaning the benchmark is structurally rising, not just printing a one-time high.
That distinction matters for Bitcoin investors because it determines duration. If Brent were simply elevated on a transient shock, the macro friction would be temporary. A sustained trend above the annual average — the condition the chart specifically identifies — creates a persistent backdrop that has historically coincided with extended BTC consolidation, not a brief pause before resumption.
Bitcoin has not been immune to macro conditions in prior cycles. The long-term holder net position change, which hit +1.27M BTC but is already showing a pace slowdown, reflects a similar dynamic — accumulation exists, but momentum is decelerating at the macro level. Similarly, large-scale whale deposits of 949.7 BTC to Binance and Deribit in recent sessions suggest participants are actively managing exposure rather than adding with conviction.
What the Signal Says — and What It Doesn’t
Darkfost’s observation is directional, not a price target. The analyst does not provide a specific BTC downside level, a price at which Brent crude would stop being a headwind, or a numeric threshold for the oil condition to clear. The finding is explicitly a long-term pattern observation: when the condition is active, Bitcoin has often slowed down. “Often” is the analyst’s word — it is a statistical tendency, not a deterministic rule.
What the signal does not say: it does not predict an imminent Bitcoin collapse, assign a specific percentage drawdown, or establish a timeline. The chart covers over a decade of data, meaning the Brent-above-annual-average condition has appeared across multiple cycle phases, and Bitcoin’s response has varied in magnitude and duration. The consistent pattern is momentum attenuation — not outright reversal in every instance.
What to watch for a change in the macro setup: a sustained move by Brent crude back below its 365-day moving average would remove the headwind condition Darkfost identifies. Until that occurs, the structural macro friction remains active by the analyst’s own criteria.
Bullish Scenario
If Brent crude reverses below its 365-day moving average — removing the headwind condition Darkfost documents — Bitcoin’s historically observed drag from elevated oil prices would dissipate, potentially allowing momentum to resume. Any significant demand shock (demand destruction, OPEC production increase, or geopolitical resolution) that breaks Brent’s upward trend would change the macro backdrop identified in this analysis.
Bearish Scenario
If Brent crude continues trending above $100 and its 365-day moving average continues rising, the sustained headwind condition identified by Darkfost remains intact. Bitcoin at $81,524 would face the same macro friction that the chart shows has historically coincided with extended BTC consolidation periods rather than new all-time high extensions.
The core thesis here is macroeconomic, not technical. Darkfost’s analysis does not establish a Bitcoin price floor or a specific level at which the thesis fails — it documents an environmental condition. Traders watching this signal should track Brent crude’s relationship to its own 365-day moving average as the primary variable, not Bitcoin’s immediate price action. The condition is either active or it is not. At $100+ and trending, it is currently active.
Disclaimer: The views and analysis presented in this article are for informational purposes only and reflect the author’s perspective, not financial advice. Technical patterns and indicators discussed are subject to market volatility and may or may not yield the anticipated results. Investors are advised to exercise caution, conduct independent research, and make decisions aligned with their individual risk tolerance.
458
·
--
Article
Bitcoin LTH Net Position Change Hits +1.27M BTC — But the Pace Is SlowingKey Highlights
Bitcoin LTH Net Position Change is +1.27M BTC over 180 days — positive but decelerating, per @Alphractal (Oct 22, 2026)Slowing accumulation pace has historically preceded cycle tops — metric rollover to negative has aligned with every prior bear marketBTC is trading at $81,765 (-1.15% 24h) with a $1.64T market cap as the signal emergesWatch 180-day LTH Net Position Change trajectory: re-acceleration = mid-cycle pause; rollover toward zero = distribution phase beginning
Bitcoin is trading at $81,765 — down 1.15% in the past 24 hours — with a market cap of approximately $1.64 trillion. Beneath the price action, a critical on-chain shift is developing that has historically marked the boundary between accumulation and distribution in Bitcoin’s macro cycle.
On-chain analytics account @Alphractal flagged the dynamic on October 22, 2026: Bitcoin’s Long-Term Holder (LTH) Net Position Change remains positive at +1.27 million BTC over the past 180 days — but the pace of that growth is slowing significantly. The observation is not a buy or sell call. It is a structural warning: a metric that has historically signaled major cycle transitions is entering a zone of deceleration.
What the LTH Net Position Change Actually Measures
The Long-Term Holder Net Position Change tracks the 180-day rolling net accumulation or distribution of coins held by wallets that have not moved their BTC in at least 155 days — the threshold Glassnode and related platforms use to define a long-term holder. A positive reading means LTHs as a cohort are adding to their aggregate holdings. A negative reading means they are net sellers into the market.
Critically, it is not just the sign of the reading that matters — it is the rate of change. When the metric is positive but decelerating, it means LTHs are still accumulating in net terms, but the marginal pace of new coins being locked away is shrinking. Historically, that tapering precedes the phase where LTHs begin distributing into price strength — the exact mechanism that has capped every prior Bitcoin bull market cycle.
The Signal — +1.27M BTC Positive, But Momentum Decelerating
Bitcoin LTH Net Position Change | Source: @Alphractal (X)
As of October 22, 2026, the LTH Net Position Change stands at +1.27 million BTC on a 180-day rolling basis. The chart shared by @Alphractal — spanning Bitcoin’s full price history from 2013 to 2026 — shows alternating green accumulation bars and red distribution bars corresponding precisely to Bitcoin’s documented bull and bear cycles. The current reading is green, confirming net accumulation is still occurring. However, the visual shape of the bar at the far right of the chart is narrowing relative to prior green peaks, indicating the accumulation pace is tapering.
@Alphractal frames the core question directly: is this deceleration a temporary pause before another leg of accumulation resumes, or is it the early signal of the transition into a distribution phase? That distinction carries significant weight. In prior cycles, the metric crossing from positive to negative — or simply peaking and turning lower before going negative — has aligned with major market cycle tops. The current reading has not gone negative. But the slope is flattening.
Why Slowing Accumulation Matters More Than the Absolute Number
A common misreading of this metric is to focus only on whether it is positive or negative. That is incomplete. Long-term holders as a group tend to be the strongest-conviction participants in Bitcoin markets — accumulating through bear markets and gradually distributing as price climbs into euphoria. The velocity of their accumulation or distribution is the leading signal. A reading of +1.27 million BTC sounds strongly bullish in isolation. But if the same metric was at +2 million BTC sixty days ago and has been decelerating toward its current level, the direction of travel is as informative as the absolute level.
This dynamic has direct precedent. In prior cycles, LTH net accumulation peaked well before price peaked — with the distribution phase beginning as price continued to climb, meaning price and LTH behavior diverge at cycle tops. Retail and short-term speculators absorb the coins that LTHs are quietly offloading. If the current deceleration is the leading edge of that transition, Bitcoin at $81,765 could be in a later cycle stage than the price level alone suggests. For additional context on recent large-holder behavior, see Bitcoin Whale Liquidated for 121.33 BTC ($9.91M) as Market Drops.
What Alphractal’s Chart Reveals — Cycle Pattern Context
The full-history chart from @Alphractal places the current reading in explicit cycle context. Green bars — representing positive LTH net position change — dominated 2015–2017, 2019–2021, and again from late 2022 through the current period. Red bars representing net distribution coincided with the 2018 bear market, the mid-2021 correction, and the 2022 crash. The current green bar at the far right is still positive at +1.27 million BTC — but its visual height relative to the prior green peaks from 2020–2021 shows it is tapering, not accelerating. The chart’s left axis, labeled in increments of 1M BTC (3M, 2M, 1M, 0, -1M, -2M), places the current +1.27M reading at just above the midpoint of the prior accumulation range — not near its historical extreme.
That chart positioning matters. If the metric were at or near +2M to +3M and decelerating, the signal would be more urgently late-cycle. At +1.27M, there is room for the reading to re-accelerate — but the burden of evidence now sits with bulls to demonstrate that LTH accumulation is resuming, not ending. Recent large-holder rotation activity — such as the whale that dumped 1,917 BTC for $159M to rotate into ETH — adds texture to why the deceleration reading deserves scrutiny.
The Two Scenarios From Here
Bullish Scenario — Accumulation Re-Accelerates
If LTH Net Position Change stabilizes and begins re-accelerating from the +1.27M level, the deceleration would be classified as a mid-cycle consolidation rather than a cycle top signal. In prior instances where the metric briefly slowed before resuming, Bitcoin went on to register its highest prices of the cycle. A resumption of LTH accumulation velocity would shift the on-chain weight of evidence back toward continuation.
Bearish Scenario — Metric Rolls Over Toward Zero or Negative
If the 180-day rolling LTH Net Position Change continues to decelerate and approaches zero — or crosses negative — the historical pattern becomes unambiguous. Every prior instance of the metric transitioning from positive to negative has coincided with a major market cycle peak and subsequent bear market. At $81,765, a confirmed rollover in this metric would suggest distribution is underway at current price levels, with long-term holders offloading into market strength.
@Alphractal does not provide a specific price trigger — the signal here is metric-directional, not price-level dependent. Watch the 180-day LTH Net Position Change trajectory in the sessions and weeks ahead. That reading — not price action alone — will determine which of the two scenarios is playing out. For further reading on BTC relative to altcoin cycle signals, see SUI/BTC Holds August 2024 Low — Range High Is Now the Target.
The structure is this: +1.27 million BTC in net long-term holder accumulation over 180 days confirms the cohort has not yet become net sellers. But a decelerating positive reading, at this stage of the cycle, is historically the pre-distribution signal — the warning that appears before the inflection, not after it. Whether the current slowdown resolves into renewed accumulation or a genuine top-formation process is the single most consequential on-chain question Bitcoin faces at $81,765.
Disclaimer: The views and analysis presented in this article are for informational purposes only and reflect the author’s perspective, not financial advice. Technical patterns and indicators discussed are subject to market volatility and may or may not yield the anticipated results. Investors are advised to exercise caution, conduct independent research, and make decisions aligned with their individual risk tolerance.
Bitcoin LTH Net Position Change Hits +1.27M BTC — But the Pace Is Slowing
Key Highlights
Bitcoin LTH Net Position Change is +1.27M BTC over 180 days — positive but decelerating, per @Alphractal (Oct 22, 2026)Slowing accumulation pace has historically preceded cycle tops — metric rollover to negative has aligned with every prior bear marketBTC is trading at $81,765 (-1.15% 24h) with a $1.64T market cap as the signal emergesWatch 180-day LTH Net Position Change trajectory: re-acceleration = mid-cycle pause; rollover toward zero = distribution phase beginning
Bitcoin is trading at $81,765 — down 1.15% in the past 24 hours — with a market cap of approximately $1.64 trillion. Beneath the price action, a critical on-chain shift is developing that has historically marked the boundary between accumulation and distribution in Bitcoin’s macro cycle.
On-chain analytics account @Alphractal flagged the dynamic on October 22, 2026: Bitcoin’s Long-Term Holder (LTH) Net Position Change remains positive at +1.27 million BTC over the past 180 days — but the pace of that growth is slowing significantly. The observation is not a buy or sell call. It is a structural warning: a metric that has historically signaled major cycle transitions is entering a zone of deceleration.
What the LTH Net Position Change Actually Measures
The Long-Term Holder Net Position Change tracks the 180-day rolling net accumulation or distribution of coins held by wallets that have not moved their BTC in at least 155 days — the threshold Glassnode and related platforms use to define a long-term holder. A positive reading means LTHs as a cohort are adding to their aggregate holdings. A negative reading means they are net sellers into the market.
Critically, it is not just the sign of the reading that matters — it is the rate of change. When the metric is positive but decelerating, it means LTHs are still accumulating in net terms, but the marginal pace of new coins being locked away is shrinking. Historically, that tapering precedes the phase where LTHs begin distributing into price strength — the exact mechanism that has capped every prior Bitcoin bull market cycle.
The Signal — +1.27M BTC Positive, But Momentum Decelerating
Bitcoin LTH Net Position Change | Source: @Alphractal (X)
As of October 22, 2026, the LTH Net Position Change stands at +1.27 million BTC on a 180-day rolling basis. The chart shared by @Alphractal — spanning Bitcoin’s full price history from 2013 to 2026 — shows alternating green accumulation bars and red distribution bars corresponding precisely to Bitcoin’s documented bull and bear cycles. The current reading is green, confirming net accumulation is still occurring. However, the visual shape of the bar at the far right of the chart is narrowing relative to prior green peaks, indicating the accumulation pace is tapering.
@Alphractal frames the core question directly: is this deceleration a temporary pause before another leg of accumulation resumes, or is it the early signal of the transition into a distribution phase? That distinction carries significant weight. In prior cycles, the metric crossing from positive to negative — or simply peaking and turning lower before going negative — has aligned with major market cycle tops. The current reading has not gone negative. But the slope is flattening.
Why Slowing Accumulation Matters More Than the Absolute Number
A common misreading of this metric is to focus only on whether it is positive or negative. That is incomplete. Long-term holders as a group tend to be the strongest-conviction participants in Bitcoin markets — accumulating through bear markets and gradually distributing as price climbs into euphoria. The velocity of their accumulation or distribution is the leading signal. A reading of +1.27 million BTC sounds strongly bullish in isolation. But if the same metric was at +2 million BTC sixty days ago and has been decelerating toward its current level, the direction of travel is as informative as the absolute level.
This dynamic has direct precedent. In prior cycles, LTH net accumulation peaked well before price peaked — with the distribution phase beginning as price continued to climb, meaning price and LTH behavior diverge at cycle tops. Retail and short-term speculators absorb the coins that LTHs are quietly offloading. If the current deceleration is the leading edge of that transition, Bitcoin at $81,765 could be in a later cycle stage than the price level alone suggests. For additional context on recent large-holder behavior, see Bitcoin Whale Liquidated for 121.33 BTC ($9.91M) as Market Drops.
What Alphractal’s Chart Reveals — Cycle Pattern Context
The full-history chart from @Alphractal places the current reading in explicit cycle context. Green bars — representing positive LTH net position change — dominated 2015–2017, 2019–2021, and again from late 2022 through the current period. Red bars representing net distribution coincided with the 2018 bear market, the mid-2021 correction, and the 2022 crash. The current green bar at the far right is still positive at +1.27 million BTC — but its visual height relative to the prior green peaks from 2020–2021 shows it is tapering, not accelerating. The chart’s left axis, labeled in increments of 1M BTC (3M, 2M, 1M, 0, -1M, -2M), places the current +1.27M reading at just above the midpoint of the prior accumulation range — not near its historical extreme.
That chart positioning matters. If the metric were at or near +2M to +3M and decelerating, the signal would be more urgently late-cycle. At +1.27M, there is room for the reading to re-accelerate — but the burden of evidence now sits with bulls to demonstrate that LTH accumulation is resuming, not ending. Recent large-holder rotation activity — such as the whale that dumped 1,917 BTC for $159M to rotate into ETH — adds texture to why the deceleration reading deserves scrutiny.
The Two Scenarios From Here
Bullish Scenario — Accumulation Re-Accelerates
If LTH Net Position Change stabilizes and begins re-accelerating from the +1.27M level, the deceleration would be classified as a mid-cycle consolidation rather than a cycle top signal. In prior instances where the metric briefly slowed before resuming, Bitcoin went on to register its highest prices of the cycle. A resumption of LTH accumulation velocity would shift the on-chain weight of evidence back toward continuation.
Bearish Scenario — Metric Rolls Over Toward Zero or Negative
If the 180-day rolling LTH Net Position Change continues to decelerate and approaches zero — or crosses negative — the historical pattern becomes unambiguous. Every prior instance of the metric transitioning from positive to negative has coincided with a major market cycle peak and subsequent bear market. At $81,765, a confirmed rollover in this metric would suggest distribution is underway at current price levels, with long-term holders offloading into market strength.
@Alphractal does not provide a specific price trigger — the signal here is metric-directional, not price-level dependent. Watch the 180-day LTH Net Position Change trajectory in the sessions and weeks ahead. That reading — not price action alone — will determine which of the two scenarios is playing out. For further reading on BTC relative to altcoin cycle signals, see SUI/BTC Holds August 2024 Low — Range High Is Now the Target.
The structure is this: +1.27 million BTC in net long-term holder accumulation over 180 days confirms the cohort has not yet become net sellers. But a decelerating positive reading, at this stage of the cycle, is historically the pre-distribution signal — the warning that appears before the inflection, not after it. Whether the current slowdown resolves into renewed accumulation or a genuine top-formation process is the single most consequential on-chain question Bitcoin faces at $81,765.
Disclaimer: The views and analysis presented in this article are for informational purposes only and reflect the author’s perspective, not financial advice. Technical patterns and indicators discussed are subject to market volatility and may or may not yield the anticipated results. Investors are advised to exercise caution, conduct independent research, and make decisions aligned with their individual risk tolerance.
121
·
--

Article
SpaceX-Tesla Merger Could Put 30,221 BTC on One Balance SheetKey Highlights
SpaceX holds 18,712 BTC; Tesla holds 11,509 BTC — combined 30,221 BTC per CryptoQuant on-chain dataCombined Q3 revenue of potential merged entity: $42.63B (SpaceX $14.58B + Tesla $28.05B)30,221 BTC consolidated figure is conditional on merger closing — currently two separate verified on-chain positionsBitcoin trading at $81,769 (-1.96% 24h) as corporate treasury story develops off-chart
Bitcoin is trading at $81,769 — down 1.96% in the past 24 hours — while the most consequential corporate crypto story of 2026 is unfolding entirely off the price chart. If a SpaceX-Tesla merger closes, it would create a single corporate entity holding more Bitcoin than any institution has ever consolidated on one balance sheet.
CryptoQuant (@cryptoquant_com) flagged the data on October 22, 2026: “SpaceX and Tesla are exploring a merger. SpaceX holds 18,712 BTC. Tesla holds 11,509 BTC. Combined, that’s 30,221 BTC on one balance sheet if the merger happens.” The framing is deliberate — this is not a price call. It is a structural observation about what a corporate consolidation would mean for Bitcoin’s institutional supply picture.
The Holdings: What Each Company Currently Holds
The numbers are not estimates. CryptoQuant’s on-chain dashboards track verified corporate addresses. SpaceX holds 18,712 BTC — the larger of the two positions. Tesla holds 11,509 BTC, a position that has been public knowledge since the company’s 2021 disclosure. Together, the two Elon Musk-controlled entities already hold 30,221 BTC in aggregate, even before any formal merger structure is finalized.
For context: MicroStrategy (now Strategy) has spent years accumulating Bitcoin as its primary treasury strategy and currently holds the largest single corporate Bitcoin position on record. A merged SpaceX-Tesla entity at 30,221 BTC would represent one of the most significant concentrations of corporate Bitcoin holdings in the asset’s history — achieved not through a dedicated accumulation strategy, but as a byproduct of two separate corporate treasuries combining.
SpaceX’s Holdings — The Chart Shows a Staircase of Reductions
The CryptoQuant chart tracking SpaceX’s Bitcoin address balance against BTC price — spanning mid-2020 through late 2026 — shows a staircase pattern of step-downs in the holdings balance, with discrete red markers indicating specific dates when the address balance decreased. The current verified balance sits at 18,712 BTC. Green markers on the chart indicate accumulation events; the overall pattern reflects a company that has actively managed its Bitcoin position rather than holding passively. The chart correlation places these balance changes against BTC’s price cycle — sharp decline mid-2022, prolonged recovery into the 2024–2025 peak, and the subsequent pullback to current levels near $81,769.
Chart 1 of 2: Chart Analysis | Source: @cryptoquant_com (X)
Tesla’s Holdings — Two Distinct Sell Events, Then Flat
Tesla’s CryptoQuant address balance chart tells a different story. The yellow balance line shows two distinct step-downs: a first reduction around early 2021 and a second around mid-2022, after which the balance has remained essentially flat through the remainder of the chart — through 2025 and into late 2026. This flatline suggests Tesla has not meaningfully added to or reduced its 11,509 BTC position in several years. The company sold a significant portion of its original Bitcoin purchase in 2022 but has held its remaining position without further liquidation. Tesla’s own stock price — shown as the pink oscillating line on the same chart — has recovered and trended upward through 2025–2026 after its prolonged trough period, a separate dynamic that has context given Tesla’s recent market cap expansion following the Flying Roadster unveil.
Source: @cryptoquant_com (X)
The Revenue Picture: Why This Merger Would Be Enormous
CryptoQuant’s post includes the Q3 quarterly revenue figures for both entities. SpaceX generated $14.58 billion in Q3 revenue. Tesla generated $28.05 billion in the same quarter. A combined entity would represent over $42 billion in quarterly revenue — making it one of the largest private-public hybrid conglomerates ever assembled, with Bitcoin embedded directly on the unified balance sheet.
The significance for Bitcoin is structural, not speculative. Corporate treasuries at this scale do not trade in and out of positions the way retail or hedge fund participants do. A 30,221 BTC position on a $42B+ quarterly revenue balance sheet would be a long-duration hold — effectively removing that supply from liquid circulation for years. The SPCX ascending triangle breakout and TSLA price action that analysts have been watching takes on additional dimension when the underlying entities are also the second and third largest corporate Bitcoin holders in the world.
What the Data Says — and What It Doesn’t
CryptoQuant’s post is explicit that this is a data observation, not a trading signal or price target. No price levels, upside targets, or on-chain flow metrics were cited in the note. The merger itself remains exploratory — the post uses the phrase “are exploring,” not “have agreed to” or “have announced.” The 30,221 BTC figure is a conditional number: it describes what would exist on a combined balance sheet if the merger closes, not a confirmed outcome.
What the data does confirm with certainty: both SpaceX and Tesla have already made Bitcoin a treasury asset independently. The on-chain addresses are tracked and verified by CryptoQuant. The 30,221 BTC aggregate is not a projection — it is the sum of two already-existing, on-chain-verified positions. Whether those positions end up on one entity’s balance sheet is the only open variable.
Bullish Scenario
If the merger closes and the 30,221 BTC consolidates onto a single balance sheet, it signals institutional permanence for Bitcoin as a corporate treasury asset at a scale not previously seen outside dedicated Bitcoin accumulation vehicles. A combined entity with $42B+ in quarterly revenue and no stated intention to reduce the Bitcoin position would represent one of the most durable long-duration Bitcoin holders in existence — removing 30,221 BTC from liquid supply for the foreseeable future.
Bearish Scenario
If the merger does not materialize, or if the combined entity chooses to rationalize its balance sheet by liquidating one or both Bitcoin positions, the market would face unexpected supply from two historically inactive holders. Tesla’s 2022 Bitcoin sale — which moved price — established a precedent that corporate Bitcoin positions are not permanent even when they appear stable.
The single number that defines this story is 30,221 BTC — the combined on-chain-verified holdings of SpaceX (18,712 BTC) and Tesla (11,509 BTC). No price target attaches to it. No timeline attaches to it. What attaches to it is a structural question: whether the largest potential corporate Bitcoin consolidation in history accelerates institutional adoption’s second phase or remains two separate line items on two separate balance sheets. CryptoQuant’s on-chain dashboards will register any movement in either address in real time. Watch those balances — not the merger headlines — for the first signal that something has changed.
Disclaimer: The views and analysis presented in this article are for informational purposes only and reflect the author’s perspective, not financial advice. Technical patterns and indicators discussed are subject to market volatility and may or may not yield anticipated results. Investors are advised to exercise caution, conduct independent research, and make decisions aligned with their individual risk tolerance.
SpaceX-Tesla Merger Could Put 30,221 BTC on One Balance Sheet
Key Highlights
SpaceX holds 18,712 BTC; Tesla holds 11,509 BTC — combined 30,221 BTC per CryptoQuant on-chain dataCombined Q3 revenue of potential merged entity: $42.63B (SpaceX $14.58B + Tesla $28.05B)30,221 BTC consolidated figure is conditional on merger closing — currently two separate verified on-chain positionsBitcoin trading at $81,769 (-1.96% 24h) as corporate treasury story develops off-chart
Bitcoin is trading at $81,769 — down 1.96% in the past 24 hours — while the most consequential corporate crypto story of 2026 is unfolding entirely off the price chart. If a SpaceX-Tesla merger closes, it would create a single corporate entity holding more Bitcoin than any institution has ever consolidated on one balance sheet.
CryptoQuant (@cryptoquant_com) flagged the data on October 22, 2026: “SpaceX and Tesla are exploring a merger. SpaceX holds 18,712 BTC. Tesla holds 11,509 BTC. Combined, that’s 30,221 BTC on one balance sheet if the merger happens.” The framing is deliberate — this is not a price call. It is a structural observation about what a corporate consolidation would mean for Bitcoin’s institutional supply picture.
The Holdings: What Each Company Currently Holds
The numbers are not estimates. CryptoQuant’s on-chain dashboards track verified corporate addresses. SpaceX holds 18,712 BTC — the larger of the two positions. Tesla holds 11,509 BTC, a position that has been public knowledge since the company’s 2021 disclosure. Together, the two Elon Musk-controlled entities already hold 30,221 BTC in aggregate, even before any formal merger structure is finalized.
For context: MicroStrategy (now Strategy) has spent years accumulating Bitcoin as its primary treasury strategy and currently holds the largest single corporate Bitcoin position on record. A merged SpaceX-Tesla entity at 30,221 BTC would represent one of the most significant concentrations of corporate Bitcoin holdings in the asset’s history — achieved not through a dedicated accumulation strategy, but as a byproduct of two separate corporate treasuries combining.
SpaceX’s Holdings — The Chart Shows a Staircase of Reductions
The CryptoQuant chart tracking SpaceX’s Bitcoin address balance against BTC price — spanning mid-2020 through late 2026 — shows a staircase pattern of step-downs in the holdings balance, with discrete red markers indicating specific dates when the address balance decreased. The current verified balance sits at 18,712 BTC. Green markers on the chart indicate accumulation events; the overall pattern reflects a company that has actively managed its Bitcoin position rather than holding passively. The chart correlation places these balance changes against BTC’s price cycle — sharp decline mid-2022, prolonged recovery into the 2024–2025 peak, and the subsequent pullback to current levels near $81,769.
Chart 1 of 2: Chart Analysis | Source: @cryptoquant_com (X)
Tesla’s Holdings — Two Distinct Sell Events, Then Flat
Tesla’s CryptoQuant address balance chart tells a different story. The yellow balance line shows two distinct step-downs: a first reduction around early 2021 and a second around mid-2022, after which the balance has remained essentially flat through the remainder of the chart — through 2025 and into late 2026. This flatline suggests Tesla has not meaningfully added to or reduced its 11,509 BTC position in several years. The company sold a significant portion of its original Bitcoin purchase in 2022 but has held its remaining position without further liquidation. Tesla’s own stock price — shown as the pink oscillating line on the same chart — has recovered and trended upward through 2025–2026 after its prolonged trough period, a separate dynamic that has context given Tesla’s recent market cap expansion following the Flying Roadster unveil.
Source: @cryptoquant_com (X)
The Revenue Picture: Why This Merger Would Be Enormous
CryptoQuant’s post includes the Q3 quarterly revenue figures for both entities. SpaceX generated $14.58 billion in Q3 revenue. Tesla generated $28.05 billion in the same quarter. A combined entity would represent over $42 billion in quarterly revenue — making it one of the largest private-public hybrid conglomerates ever assembled, with Bitcoin embedded directly on the unified balance sheet.
The significance for Bitcoin is structural, not speculative. Corporate treasuries at this scale do not trade in and out of positions the way retail or hedge fund participants do. A 30,221 BTC position on a $42B+ quarterly revenue balance sheet would be a long-duration hold — effectively removing that supply from liquid circulation for years. The SPCX ascending triangle breakout and TSLA price action that analysts have been watching takes on additional dimension when the underlying entities are also the second and third largest corporate Bitcoin holders in the world.
What the Data Says — and What It Doesn’t
CryptoQuant’s post is explicit that this is a data observation, not a trading signal or price target. No price levels, upside targets, or on-chain flow metrics were cited in the note. The merger itself remains exploratory — the post uses the phrase “are exploring,” not “have agreed to” or “have announced.” The 30,221 BTC figure is a conditional number: it describes what would exist on a combined balance sheet if the merger closes, not a confirmed outcome.
What the data does confirm with certainty: both SpaceX and Tesla have already made Bitcoin a treasury asset independently. The on-chain addresses are tracked and verified by CryptoQuant. The 30,221 BTC aggregate is not a projection — it is the sum of two already-existing, on-chain-verified positions. Whether those positions end up on one entity’s balance sheet is the only open variable.
Bullish Scenario
If the merger closes and the 30,221 BTC consolidates onto a single balance sheet, it signals institutional permanence for Bitcoin as a corporate treasury asset at a scale not previously seen outside dedicated Bitcoin accumulation vehicles. A combined entity with $42B+ in quarterly revenue and no stated intention to reduce the Bitcoin position would represent one of the most durable long-duration Bitcoin holders in existence — removing 30,221 BTC from liquid supply for the foreseeable future.
Bearish Scenario
If the merger does not materialize, or if the combined entity chooses to rationalize its balance sheet by liquidating one or both Bitcoin positions, the market would face unexpected supply from two historically inactive holders. Tesla’s 2022 Bitcoin sale — which moved price — established a precedent that corporate Bitcoin positions are not permanent even when they appear stable.
The single number that defines this story is 30,221 BTC — the combined on-chain-verified holdings of SpaceX (18,712 BTC) and Tesla (11,509 BTC). No price target attaches to it. No timeline attaches to it. What attaches to it is a structural question: whether the largest potential corporate Bitcoin consolidation in history accelerates institutional adoption’s second phase or remains two separate line items on two separate balance sheets. CryptoQuant’s on-chain dashboards will register any movement in either address in real time. Watch those balances — not the merger headlines — for the first signal that something has changed.
Disclaimer: The views and analysis presented in this article are for informational purposes only and reflect the author’s perspective, not financial advice. Technical patterns and indicators discussed are subject to market volatility and may or may not yield anticipated results. Investors are advised to exercise caution, conduct independent research, and make decisions aligned with their individual risk tolerance.
214
·
--
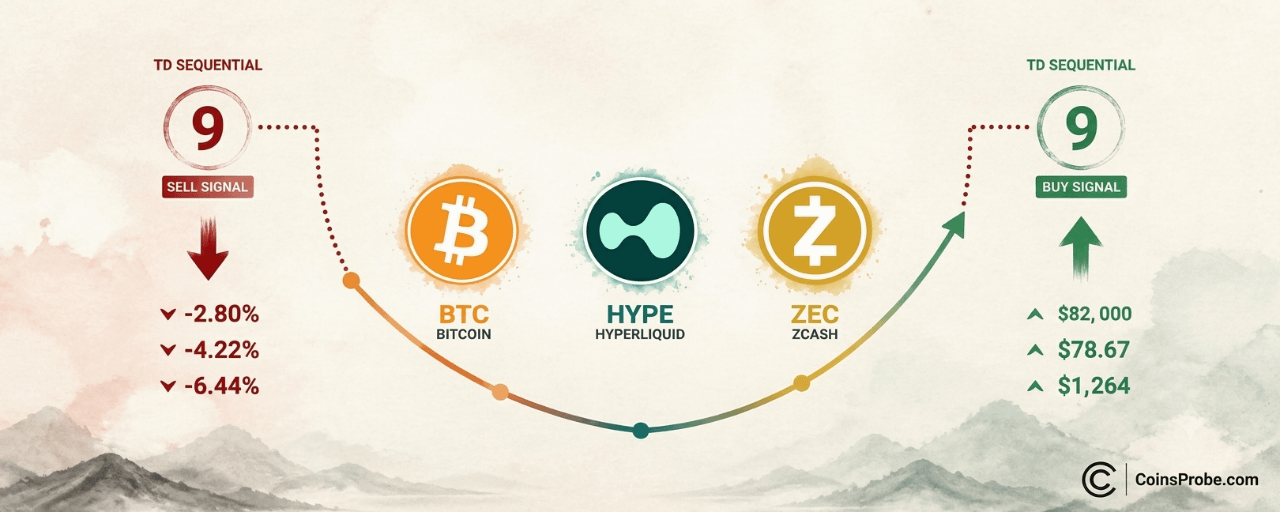
Article
BTC, HYPE, and ZEC Flash TD Sequential Buy Signals After 2.80%–6.44% PullbacksKey Highlights
Bitcoin TD Sequential sell-9 at $85,000 preceded a confirmed 2.80% drop to $82,000; buy-9 now active at $82,348HYPE dropped 4.22% from $82 local top; TD Sequential buy signal printed at $78.67 with $78 as key support per @alichartsZEC fell 6.44% from $1,350; buy signal active at $1,264 — analyst watching $1,250 as invalidation floor
Bitcoin is trading at $82,031 — down 1.22% in the last 24 hours and sitting on a market cap of $1.649 trillion — after a sharp pullback from the $85,000 zone. The decline was not random noise. It was preceded by a textbook TD Sequential sell signal, and now the same indicator has printed its mirror opposite: a buy signal at the lows.
Crypto analyst Ali Martinez (@alicharts) flagged the setup in a five-part thread, noting that Bitcoin, Hyperliquid, and Zcash all followed the same sequence — a sell signal near a local top, a measured correction, and a fresh buy signal at current lows. “Bitcoin, Hyperliquid, and Zcash retrace… but look ready to bounce back,” Martinez wrote, watching all three for buyer follow-through.
Signal 1 — Bitcoin: Sell at $85,000, Buy at $82,000
The TD Sequential indicator counts nine consecutive candles closing in the same direction — identifying momentum exhaustion rather than a price level. When a count of nine completes, it signals that the prevailing move has statistically run its course and a reversal or pause is likely.
On Bitcoin’s one-hour chart, the TD Sequential printed a sell-9 signal as price approached $85,000. What followed was precise: a 2.80% correction that brought BTC back toward the $82,000 zone — exactly where the chart now shows a completed buy-9 signal with an upward arrow near $82,348. The sell signal’s outcome is already printed on the chart; the -2.79% label is a realized move, not a projection. The buy signal is live.
BTC 1H TD Sequential Buy Signals | Source: @alicharts (X)
For broader context on where Bitcoin’s key rebound targets sit, CoinsProbe’s earlier analysis on BTC, ETH, XRP rebound targets — $86,500, $2,700, and $1.55 in focus remains directly relevant here.
Signal 2 — Hyperliquid: 4.22% Drop, Buy Signal Near $78.67
Hyperliquid (HYPE) followed an identical sequence on its one-hour chart. The TD Sequential printed a sell-9 near the local top around $82. A 4.22% correction followed — the label is already printed on the left side of the chart, marking a completed move. Price stairstepped lower in a sustained series of declining candles before a buy-9 signal appeared near current lows at approximately $78.67.
Per Martinez’s thread, the immediate support level to hold is $78, with a rebound target back toward $82+ if buyers step in at the buy signal. A count reset showing a “1” on the right side of the chart confirms the sequence has restarted — the structure is consistent with early-stage reversal positioning rather than continuation of the downtrend.
HYPE 1H Chart TD Sequential Buy Signal | Source: @alicharts (X)
Signal 3 — Zcash: 6.44% Correction, Buy Signal at $1,264
Zcash (ZEC) produced the largest correction of the three. The sell-9 appeared near the $1,350 local top on the one-hour chart. The subsequent decline measured 6.44% — again, already printed on the chart as a realized move. Price cascaded through $1,320 and $1,290 before the buy-9 signal appeared at the current low near $1,264.
Martinez is watching the $1,250 level as the key support — notably, this level is cited in the analyst’s thread and does not appear as a printed label on the chart itself. A hold above $1,250 with follow-through buying would target a rebound toward the prior top at $1,350.
ZEC 1H Chart Flash TD Sequential Buy Signal | Source: @alicharts (X)
Why Three Simultaneous Buy Signals Matter
Individually, a single TD Sequential buy signal on one asset’s hourly chart is a tactical observation. When the same setup — sell signal at top, measured correction, buy signal at lows — prints across three uncorrelated assets in the same session, the statistical weight increases. Bitcoin, Hyperliquid, and Zcash are structurally different assets with different market caps, use cases, and liquidity profiles. The fact that all three followed the same TD Sequential playbook in the same session is the core of Martinez’s thread.
The TD Sequential is a non-directional exhaustion indicator — it does not predict magnitude or guarantee reversal. What it confirms is that the selling pressure across a nine-candle sequence has statistically exhausted itself. Whether buyers respond is the variable that Martinez is explicitly watching: “all three assets show TD Sequential buy signals post-pullback; watching for buyer follow-through.”
For a comparable setup in a single asset, CoinsProbe’s analysis of PENGU’s 3-for-3 SuperTrend buy signal track record illustrates how technical exhaustion signals can precede measurable rebounds when follow-through confirms.
Bullish Scenario
Bitcoin holds the $82,000 zone and reclaims $83,000–$84,000 with volume — the buy-9 confirmation triggers a rebound attempt toward the prior $85,000 level. HYPE holds $78 and rebounds toward $82+. ZEC holds $1,250 and recovers toward $1,350. All three buy signals confirm simultaneously, consistent with the sell-signal pattern that preceded this pullback.
Bearish Scenario
Bitcoin loses the $82,000 level on a sustained hourly close, invalidating the buy-9 setup and opening a deeper test toward $80,000. HYPE loses $78, negating the support level Martinez identified. ZEC closes below $1,250, invalidating the buy signal’s primary support zone. A failure of all three setups would indicate the buy signals were absorbed without follow-through — a bearish continuation scenario.
The setup across Bitcoin, Hyperliquid, and Zcash is structurally clean: the TD Sequential’s sell signals called the corrections, the corrections printed the exact declines the signals warned of (2.80%, 4.22%, 6.44%), and buy signals have now appeared at the lows. The question Martinez is watching is whether buyers step in at these signal levels with enough conviction to initiate the symmetrical bounce. For Bitcoin, $82,000 is the level that keeps the buy signal intact — a sustained loss of that zone without recovery would be the first sign that the pattern is failing to hold.
Disclaimer: The views and analysis presented in this article are for informational purposes only and reflect the author’s perspective, not financial advice. Technical patterns and indicators discussed are subject to market volatility and may or may not yield anticipated results. Investors are advised to exercise caution, conduct independent research, and make decisions aligned with their individual risk tolerance.
BTC, HYPE, and ZEC Flash TD Sequential Buy Signals After 2.80%–6.44% Pullbacks
Key Highlights
Bitcoin TD Sequential sell-9 at $85,000 preceded a confirmed 2.80% drop to $82,000; buy-9 now active at $82,348HYPE dropped 4.22% from $82 local top; TD Sequential buy signal printed at $78.67 with $78 as key support per @alichartsZEC fell 6.44% from $1,350; buy signal active at $1,264 — analyst watching $1,250 as invalidation floor
Bitcoin is trading at $82,031 — down 1.22% in the last 24 hours and sitting on a market cap of $1.649 trillion — after a sharp pullback from the $85,000 zone. The decline was not random noise. It was preceded by a textbook TD Sequential sell signal, and now the same indicator has printed its mirror opposite: a buy signal at the lows.
Crypto analyst Ali Martinez (@alicharts) flagged the setup in a five-part thread, noting that Bitcoin, Hyperliquid, and Zcash all followed the same sequence — a sell signal near a local top, a measured correction, and a fresh buy signal at current lows. “Bitcoin, Hyperliquid, and Zcash retrace… but look ready to bounce back,” Martinez wrote, watching all three for buyer follow-through.
Signal 1 — Bitcoin: Sell at $85,000, Buy at $82,000
The TD Sequential indicator counts nine consecutive candles closing in the same direction — identifying momentum exhaustion rather than a price level. When a count of nine completes, it signals that the prevailing move has statistically run its course and a reversal or pause is likely.
On Bitcoin’s one-hour chart, the TD Sequential printed a sell-9 signal as price approached $85,000. What followed was precise: a 2.80% correction that brought BTC back toward the $82,000 zone — exactly where the chart now shows a completed buy-9 signal with an upward arrow near $82,348. The sell signal’s outcome is already printed on the chart; the -2.79% label is a realized move, not a projection. The buy signal is live.
BTC 1H TD Sequential Buy Signals | Source: @alicharts (X)
For broader context on where Bitcoin’s key rebound targets sit, CoinsProbe’s earlier analysis on BTC, ETH, XRP rebound targets — $86,500, $2,700, and $1.55 in focus remains directly relevant here.
Signal 2 — Hyperliquid: 4.22% Drop, Buy Signal Near $78.67
Hyperliquid (HYPE) followed an identical sequence on its one-hour chart. The TD Sequential printed a sell-9 near the local top around $82. A 4.22% correction followed — the label is already printed on the left side of the chart, marking a completed move. Price stairstepped lower in a sustained series of declining candles before a buy-9 signal appeared near current lows at approximately $78.67.
Per Martinez’s thread, the immediate support level to hold is $78, with a rebound target back toward $82+ if buyers step in at the buy signal. A count reset showing a “1” on the right side of the chart confirms the sequence has restarted — the structure is consistent with early-stage reversal positioning rather than continuation of the downtrend.
HYPE 1H Chart TD Sequential Buy Signal | Source: @alicharts (X)
Signal 3 — Zcash: 6.44% Correction, Buy Signal at $1,264
Zcash (ZEC) produced the largest correction of the three. The sell-9 appeared near the $1,350 local top on the one-hour chart. The subsequent decline measured 6.44% — again, already printed on the chart as a realized move. Price cascaded through $1,320 and $1,290 before the buy-9 signal appeared at the current low near $1,264.
Martinez is watching the $1,250 level as the key support — notably, this level is cited in the analyst’s thread and does not appear as a printed label on the chart itself. A hold above $1,250 with follow-through buying would target a rebound toward the prior top at $1,350.
ZEC 1H Chart Flash TD Sequential Buy Signal | Source: @alicharts (X)
Why Three Simultaneous Buy Signals Matter
Individually, a single TD Sequential buy signal on one asset’s hourly chart is a tactical observation. When the same setup — sell signal at top, measured correction, buy signal at lows — prints across three uncorrelated assets in the same session, the statistical weight increases. Bitcoin, Hyperliquid, and Zcash are structurally different assets with different market caps, use cases, and liquidity profiles. The fact that all three followed the same TD Sequential playbook in the same session is the core of Martinez’s thread.
The TD Sequential is a non-directional exhaustion indicator — it does not predict magnitude or guarantee reversal. What it confirms is that the selling pressure across a nine-candle sequence has statistically exhausted itself. Whether buyers respond is the variable that Martinez is explicitly watching: “all three assets show TD Sequential buy signals post-pullback; watching for buyer follow-through.”
For a comparable setup in a single asset, CoinsProbe’s analysis of PENGU’s 3-for-3 SuperTrend buy signal track record illustrates how technical exhaustion signals can precede measurable rebounds when follow-through confirms.
Bullish Scenario
Bitcoin holds the $82,000 zone and reclaims $83,000–$84,000 with volume — the buy-9 confirmation triggers a rebound attempt toward the prior $85,000 level. HYPE holds $78 and rebounds toward $82+. ZEC holds $1,250 and recovers toward $1,350. All three buy signals confirm simultaneously, consistent with the sell-signal pattern that preceded this pullback.
Bearish Scenario
Bitcoin loses the $82,000 level on a sustained hourly close, invalidating the buy-9 setup and opening a deeper test toward $80,000. HYPE loses $78, negating the support level Martinez identified. ZEC closes below $1,250, invalidating the buy signal’s primary support zone. A failure of all three setups would indicate the buy signals were absorbed without follow-through — a bearish continuation scenario.
The setup across Bitcoin, Hyperliquid, and Zcash is structurally clean: the TD Sequential’s sell signals called the corrections, the corrections printed the exact declines the signals warned of (2.80%, 4.22%, 6.44%), and buy signals have now appeared at the lows. The question Martinez is watching is whether buyers step in at these signal levels with enough conviction to initiate the symmetrical bounce. For Bitcoin, $82,000 is the level that keeps the buy signal intact — a sustained loss of that zone without recovery would be the first sign that the pattern is failing to hold.
Disclaimer: The views and analysis presented in this article are for informational purposes only and reflect the author’s perspective, not financial advice. Technical patterns and indicators discussed are subject to market volatility and may or may not yield anticipated results. Investors are advised to exercise caution, conduct independent research, and make decisions aligned with their individual risk tolerance.
622
·
--
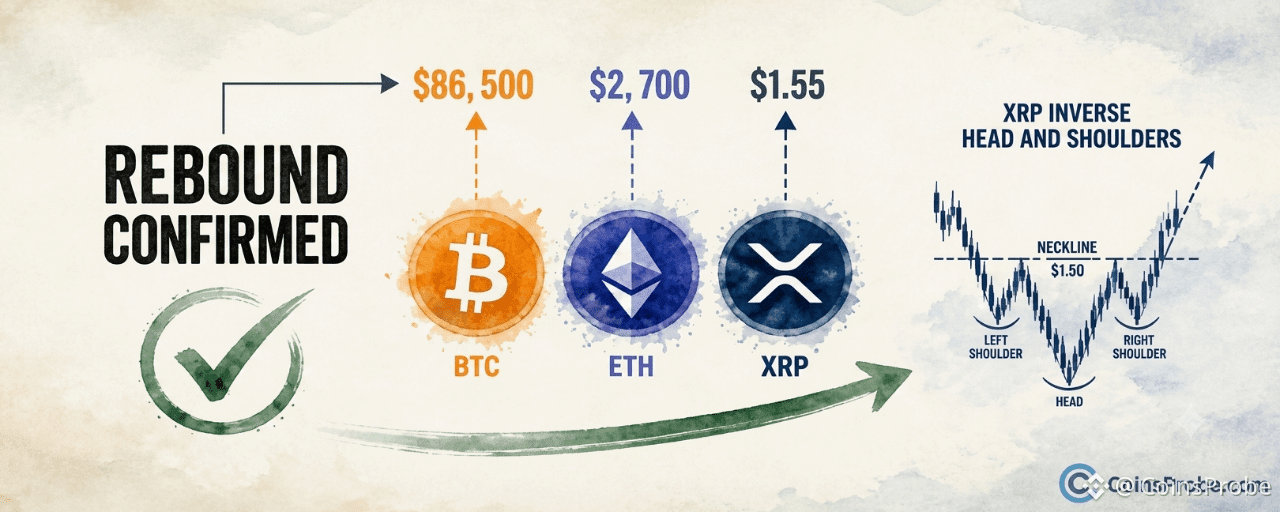
Article
BTC, ETH, XRP Rebound Targets: $86,500, $2,700, and $1.55 in FocusKey Highlights
BTC at $82,725 targets $86,500 — analyst Ali Martinez (@alicharts) confirmed rebound after October 18 support callETH bounced from $2,400 support to $2,512, with $2,700 as immediate target and $3,100 as channel extensionXRP inverse head and shoulders neckline at $1.50 — $1.55 close confirms breakout toward $2.00 measured moveMartinez: "Break these levels, and the rally extends further" — all three gates must clear for continuation
Bitcoin is trading at $82,725 — down 0.12% in the last 24 hours — while Ethereum holds near $2,512 and XRP sits at $1.39. The moves follow a market-wide rebound that chart analyst Ali Martinez (@alicharts) called in advance, with three specific support zones now confirmed as the floor for the next leg.
On October 21, Martinez posted: “MARKET REBOUND AS PREDICTED! Immediate targets: $BTC: $86,500 / $ETH: $2,700 / $XRP: $1.55. Break these levels, and the rally extends further.” The call follows his October 18 thread — titled “BITCOIN, ETHEREUM, XRP COULD REBOUND… But only if these levels hold” — in which he identified the exact support zones that have since acted as the base for the current bounce.
Bitcoin — $84,000 Reclaimed, $86,500 Is the Gate
The daily BTC chart shared by @alicharts shows price declining from the upper-left of the chart through mid-October, hitting a sharp trough around October 13 before recovering. The current price had reclaimed the $84,000 level at the time of the chart, with a dashed projection line pointing directly at $86,500 — Martinez’s stated immediate target. The $84,000 line is marked as the pivotal support-turned-floor on the chart, and $86,500 is annotated as the next resistance the rally must clear.
BTC Daily Chart | Source: @alicharts (X)
At $82,725 at the time of writing, Bitcoin is still below the $84,000 level visible on the chart as the reclaim zone. The analyst’s condition is explicit: a sustained break above $86,500 is what extends the rally further. Until that level is cleared, the bounce remains a recovery within the prior range rather than a confirmed continuation. Intermediate price labels on the chart include $85,250, $84,535, $84,000, $82,500, and $81,000 — with $82,500 serving as the closest visible support below the current spot price.
Ethereum — Bouncing From $2,400, Targeting $2,700 Then $3,100
The ETH daily chart reveals an ascending channel or rising wedge structure, with price testing the lower boundary near $2,400 before the bounce that brought it to approximately $2,512 — marked with a black label on the chart. Martinez’s dashed projection traces a zigzag path upward: first toward $2,700, then continuing toward $3,100 in alignment with the upper diagonal trendline of the channel.
ETH Daily Chart | Source: @alicharts (X)
The $2,700 level is Martinez’s stated immediate target for Ethereum. It represents the first meaningful resistance within the channel structure before the upper trendline at approximately $3,100. The bounce from $2,400 support — the level Martinez flagged on October 18 as the key zone that must hold — is what triggered the updated target confirmation in his October 21 post.
XRP — Inverse Head and Shoulders, Neckline at $1.50, Target $2.00
The XRP 3-day chart is the most structurally defined of the three. @alicharts annotates a completed inverse head and shoulders pattern, with the left shoulder, head (the deepest trough), and right shoulder all explicitly labeled. A horizontal neckline runs near $1.50. At the time of the chart, XRP was trading at $1.39 — just below neckline — with a dashed arrow projecting a breakout move toward $2.00.
XRP 3D Chart | Source: @alicharts (X)
Martinez’s stated immediate target of $1.55 for XRP is a neckline breakout confirmation level — sitting just above the $1.50 neckline drawn on the chart. The analyst’s logic: a sustained move above $1.55 confirms the inverse H&S breakout is live, opening the path to the $2.00 measured move target visible on the chart. Note the distinction: the chart’s neckline is drawn at $1.50, while the analyst explicitly states $1.55 as the level that confirms the break. Both figures refer to the same structural zone — $1.50 is the visual pattern boundary, $1.55 is his stated confirmation trigger.
The Condition That Determines Everything
Martinez’s framework across all three assets is identical in structure: the support levels held (as predicted October 18), the immediate bounce is now live, but the rally’s extension depends on breaking specific resistance levels — not merely bouncing from support. For Bitcoin that gate is $86,500. For Ethereum it is $2,700. For XRP it is $1.55. A failure to clear any of these levels converts the current move from a confirmed rally into a relief bounce within a broader downtrend.
This conditional structure matters. It is not a blanket all-clear signal — it is a staged thesis with explicit checkpoints. Traders watching this setup from a technical breakout perspective will recognize the pattern: support holds, bounce initiates, resistance becomes the next binary. Similar conditional setups have appeared across altcoins recently, including PENGU’s SuperTrend signals where each prior buy trigger required a specific confirmation level to validate the thesis.
Bullish Scenario
BTC closes above $86,500 with ETH simultaneously clearing $2,700 and XRP printing a daily close above $1.55. All three breaking their gates in sequence would confirm coordinated market-wide continuation, with XRP’s measured move pointing to $2.00 and ETH’s channel projecting toward $3,100 as extended targets per the chart annotations.
Bearish Scenario
Bitcoin fails to reclaim $84,000 on a sustained basis and rolls back below $82,500 — the nearest visible support on the daily chart. For XRP, a failure to break $1.55 and a drop back below the $1.39 right shoulder level would invalidate the inverse head and shoulders setup. For ETH, a loss of the $2,400 lower channel boundary reopens the $2,000 zone.
The rebound Martinez predicted on October 18 has materialized across Bitcoin, Ethereum, and XRP. The immediate targets — $86,500, $2,700, and $1.55 respectively — are not open-ended projections. They are the specific levels his analysis designates as rally-extension confirmations. Bitcoin at $82,725 remains the furthest from its gate. Watch $86,500 in BTC as the single level that determines whether this is a confirmed breakout or a bounce that exhausted itself before the next resistance.
Disclaimer: The views and analysis presented in this article are for informational purposes only and reflect the author’s perspective, not financial advice. Technical patterns and indicators discussed are subject to market volatility and may or may not yield anticipated results. Investors are advised to exercise caution, conduct independent research, and make decisions aligned with their individual risk tolerance.
BTC, ETH, XRP Rebound Targets: $86,500, $2,700, and $1.55 in Focus
Key Highlights
BTC at $82,725 targets $86,500 — analyst Ali Martinez (@alicharts) confirmed rebound after October 18 support callETH bounced from $2,400 support to $2,512, with $2,700 as immediate target and $3,100 as channel extensionXRP inverse head and shoulders neckline at $1.50 — $1.55 close confirms breakout toward $2.00 measured moveMartinez: "Break these levels, and the rally extends further" — all three gates must clear for continuation
Bitcoin is trading at $82,725 — down 0.12% in the last 24 hours — while Ethereum holds near $2,512 and XRP sits at $1.39. The moves follow a market-wide rebound that chart analyst Ali Martinez (@alicharts) called in advance, with three specific support zones now confirmed as the floor for the next leg.
On October 21, Martinez posted: “MARKET REBOUND AS PREDICTED! Immediate targets: $BTC: $86,500 / $ETH: $2,700 / $XRP: $1.55. Break these levels, and the rally extends further.” The call follows his October 18 thread — titled “BITCOIN, ETHEREUM, XRP COULD REBOUND… But only if these levels hold” — in which he identified the exact support zones that have since acted as the base for the current bounce.
Bitcoin — $84,000 Reclaimed, $86,500 Is the Gate
The daily BTC chart shared by @alicharts shows price declining from the upper-left of the chart through mid-October, hitting a sharp trough around October 13 before recovering. The current price had reclaimed the $84,000 level at the time of the chart, with a dashed projection line pointing directly at $86,500 — Martinez’s stated immediate target. The $84,000 line is marked as the pivotal support-turned-floor on the chart, and $86,500 is annotated as the next resistance the rally must clear.
BTC Daily Chart | Source: @alicharts (X)
At $82,725 at the time of writing, Bitcoin is still below the $84,000 level visible on the chart as the reclaim zone. The analyst’s condition is explicit: a sustained break above $86,500 is what extends the rally further. Until that level is cleared, the bounce remains a recovery within the prior range rather than a confirmed continuation. Intermediate price labels on the chart include $85,250, $84,535, $84,000, $82,500, and $81,000 — with $82,500 serving as the closest visible support below the current spot price.
Ethereum — Bouncing From $2,400, Targeting $2,700 Then $3,100
The ETH daily chart reveals an ascending channel or rising wedge structure, with price testing the lower boundary near $2,400 before the bounce that brought it to approximately $2,512 — marked with a black label on the chart. Martinez’s dashed projection traces a zigzag path upward: first toward $2,700, then continuing toward $3,100 in alignment with the upper diagonal trendline of the channel.
ETH Daily Chart | Source: @alicharts (X)
The $2,700 level is Martinez’s stated immediate target for Ethereum. It represents the first meaningful resistance within the channel structure before the upper trendline at approximately $3,100. The bounce from $2,400 support — the level Martinez flagged on October 18 as the key zone that must hold — is what triggered the updated target confirmation in his October 21 post.
XRP — Inverse Head and Shoulders, Neckline at $1.50, Target $2.00
The XRP 3-day chart is the most structurally defined of the three. @alicharts annotates a completed inverse head and shoulders pattern, with the left shoulder, head (the deepest trough), and right shoulder all explicitly labeled. A horizontal neckline runs near $1.50. At the time of the chart, XRP was trading at $1.39 — just below neckline — with a dashed arrow projecting a breakout move toward $2.00.
XRP 3D Chart | Source: @alicharts (X)
Martinez’s stated immediate target of $1.55 for XRP is a neckline breakout confirmation level — sitting just above the $1.50 neckline drawn on the chart. The analyst’s logic: a sustained move above $1.55 confirms the inverse H&S breakout is live, opening the path to the $2.00 measured move target visible on the chart. Note the distinction: the chart’s neckline is drawn at $1.50, while the analyst explicitly states $1.55 as the level that confirms the break. Both figures refer to the same structural zone — $1.50 is the visual pattern boundary, $1.55 is his stated confirmation trigger.
The Condition That Determines Everything
Martinez’s framework across all three assets is identical in structure: the support levels held (as predicted October 18), the immediate bounce is now live, but the rally’s extension depends on breaking specific resistance levels — not merely bouncing from support. For Bitcoin that gate is $86,500. For Ethereum it is $2,700. For XRP it is $1.55. A failure to clear any of these levels converts the current move from a confirmed rally into a relief bounce within a broader downtrend.
This conditional structure matters. It is not a blanket all-clear signal — it is a staged thesis with explicit checkpoints. Traders watching this setup from a technical breakout perspective will recognize the pattern: support holds, bounce initiates, resistance becomes the next binary. Similar conditional setups have appeared across altcoins recently, including PENGU’s SuperTrend signals where each prior buy trigger required a specific confirmation level to validate the thesis.
Bullish Scenario
BTC closes above $86,500 with ETH simultaneously clearing $2,700 and XRP printing a daily close above $1.55. All three breaking their gates in sequence would confirm coordinated market-wide continuation, with XRP’s measured move pointing to $2.00 and ETH’s channel projecting toward $3,100 as extended targets per the chart annotations.
Bearish Scenario
Bitcoin fails to reclaim $84,000 on a sustained basis and rolls back below $82,500 — the nearest visible support on the daily chart. For XRP, a failure to break $1.55 and a drop back below the $1.39 right shoulder level would invalidate the inverse head and shoulders setup. For ETH, a loss of the $2,400 lower channel boundary reopens the $2,000 zone.
The rebound Martinez predicted on October 18 has materialized across Bitcoin, Ethereum, and XRP. The immediate targets — $86,500, $2,700, and $1.55 respectively — are not open-ended projections. They are the specific levels his analysis designates as rally-extension confirmations. Bitcoin at $82,725 remains the furthest from its gate. Watch $86,500 in BTC as the single level that determines whether this is a confirmed breakout or a bounce that exhausted itself before the next resistance.
Disclaimer: The views and analysis presented in this article are for informational purposes only and reflect the author’s perspective, not financial advice. Technical patterns and indicators discussed are subject to market volatility and may or may not yield anticipated results. Investors are advised to exercise caution, conduct independent research, and make decisions aligned with their individual risk tolerance.
1
668
Log in to explore more content
Join global crypto users on Binance Square
⚡️ Get latest and useful information about crypto.
💬 Trusted by the world’s largest crypto exchange.
👍 Discover real insights from verified creators.
Email / Phone number