
Chipollin0_VVV
76 Posts

Chipollin0_VVV
Report
Block User
Daily BTC & ETH options map: walls, gamma flip, expected move. Free map: @OptionLogicMapBot
Frequent Trader
6.9 Years
3 Following
19 Followers
74 Liked
Posts
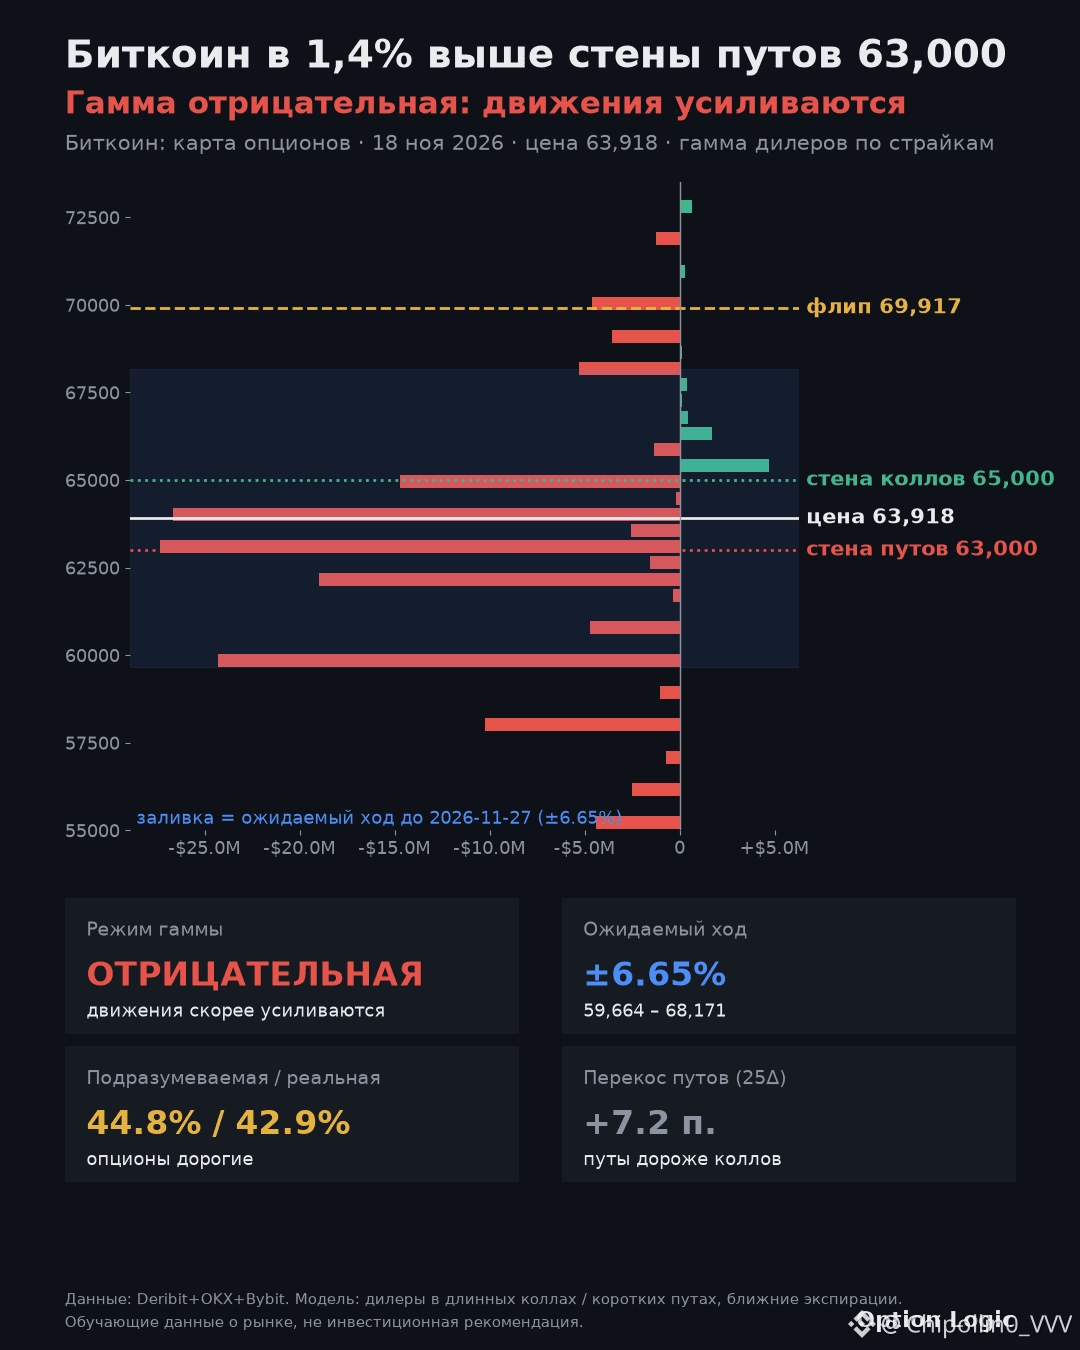
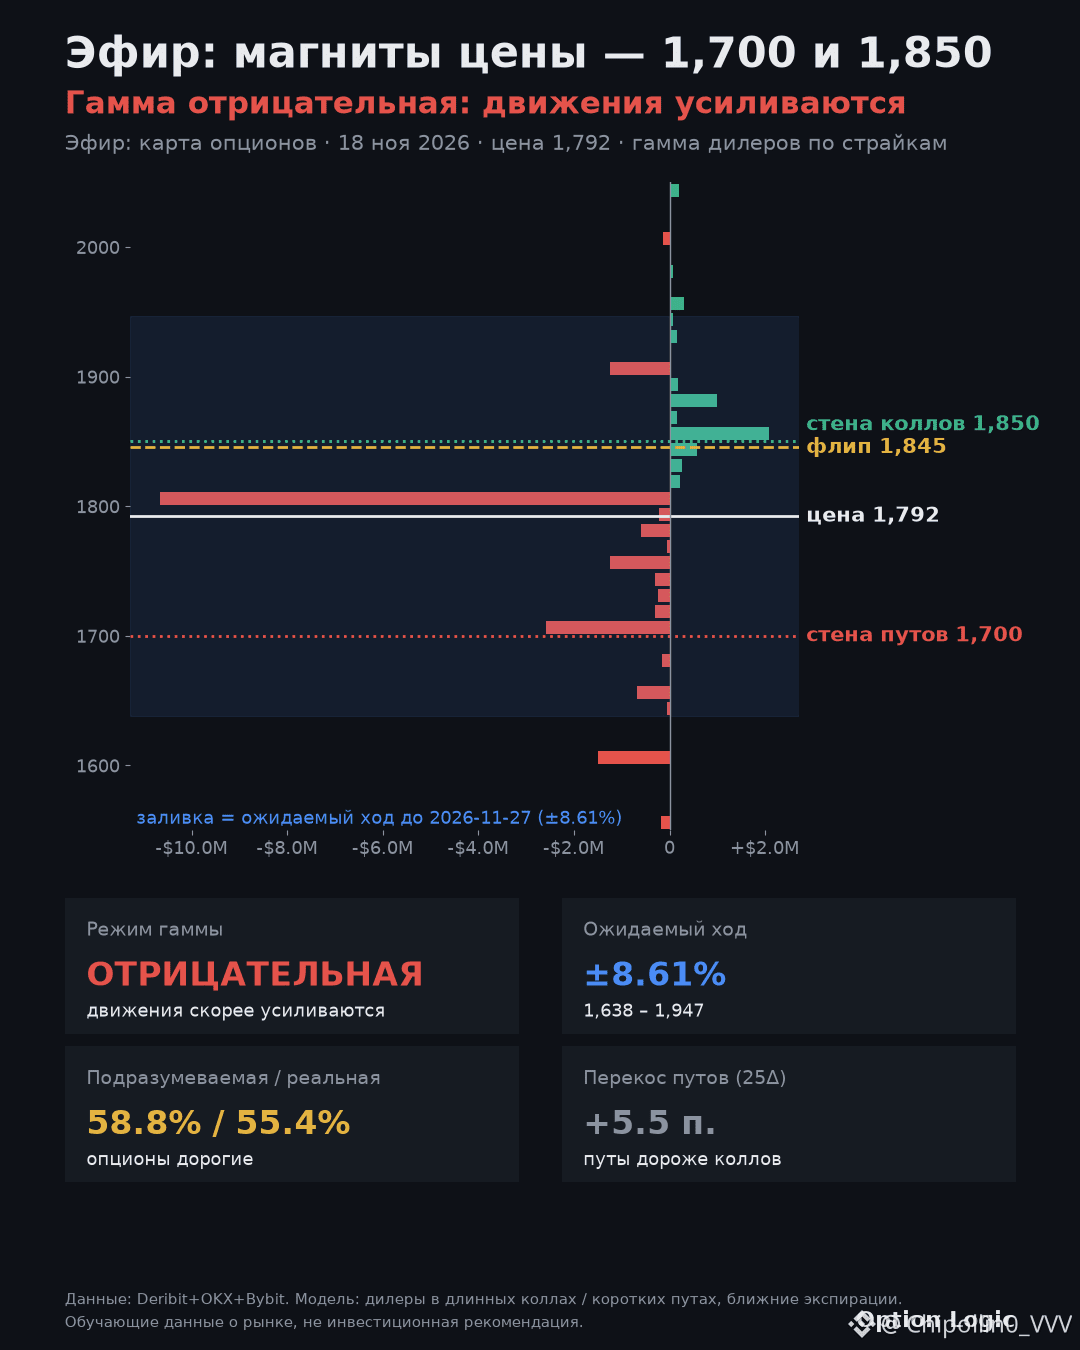
Are short sellers already rubbing their hands while the market holds its breath? I'm sitting in front of my monitor, watching the options map and gamma, which is now turning negative for $BTC and $ETH. You can feel the tension right there in the order book.
Bitcoin is currently at 63,343, with a wall of puts at 63,000 holding us up from below—it's just a hair's breadth away. If we break through it, longs will start getting flushed out hard, while above us, a wall of calls at 65,000 blocks the way. Meanwhile, the gamma flip point is a long way off at 69,917, and the expected move through expiration is ±6.65%.
It's a similar picture with Ether: we're trading at 1,764, with support below at the 1,700 put wall, while a ceiling of calls at 1,850 is pressing down. The gamma flip point at 1,845 is just around the corner, and the potential move here is even wider—±8.61%. The crowd is heavily long everywhere, while futures keep applying pressure.
Which side of this drama are you on? $BTC $ETH
Are short sellers already rubbing their hands while the market holds its breath? I'm sitting in front of my monitor, watching the options map and gamma, which is now turning negative for $BTC and $ETH . You can feel the tension right there in the order book.
Bitcoin is currently at 63,343, with a wall of puts at 63,000 holding us up from below—it's just a hair's breadth away. If we break through it, longs will start getting flushed out hard, while above us, a wall of calls at 65,000 blocks the way. Meanwhile, the gamma flip point is a long way off at 69,917, and the expected move through expiration is ±6.65%.
It's a similar picture with Ether: we're trading at 1,764, with support below at the 1,700 put wall, while a ceiling of calls at 1,850 is pressing down. The gamma flip point at 1,845 is just around the corner, and the potential move here is even wider—±8.61%. The crowd is heavily long everywhere, while futures keep applying pressure.
Which side of this drama are you on? $BTC $ETH
Bitcoin is currently at 63,343, with a wall of puts at 63,000 holding us up from below—it's just a hair's breadth away. If we break through it, longs will start getting flushed out hard, while above us, a wall of calls at 65,000 blocks the way. Meanwhile, the gamma flip point is a long way off at 69,917, and the expected move through expiration is ±6.65%.
It's a similar picture with Ether: we're trading at 1,764, with support below at the 1,700 put wall, while a ceiling of calls at 1,850 is pressing down. The gamma flip point at 1,845 is just around the corner, and the potential move here is even wider—±8.61%. The crowd is heavily long everywhere, while futures keep applying pressure.
Which side of this drama are you on? $BTC $ETH
1
1.9k
Know that feeling when price just hangs right above the floor and everyone holds their breath?
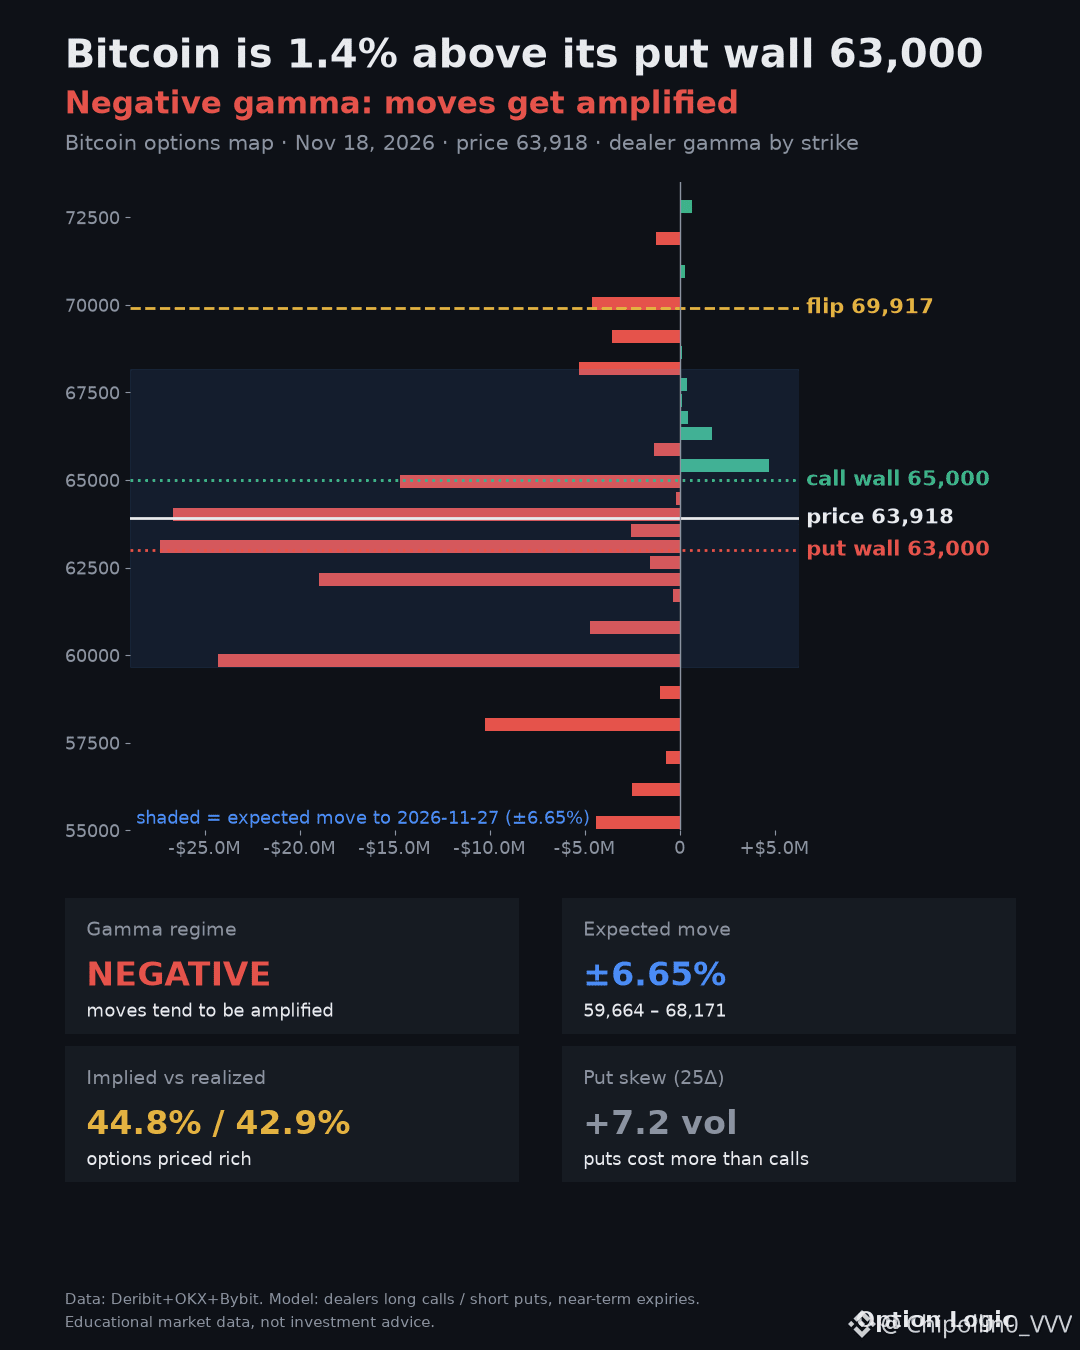
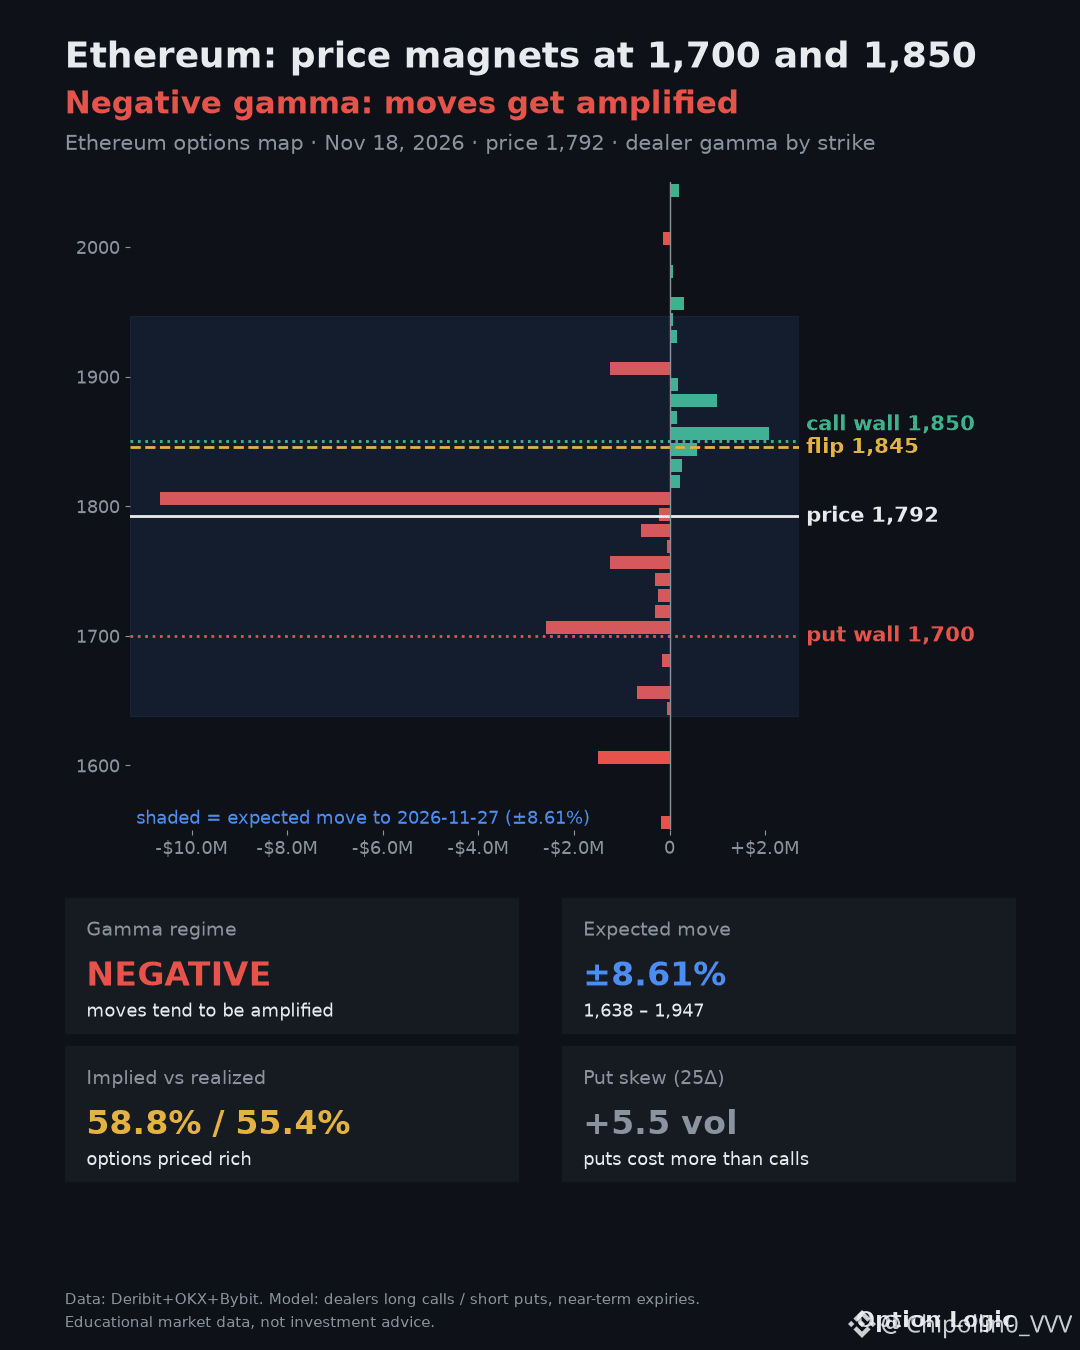
Looking at the options map for $BTC, I think we are in a very twitchy spot with negative gamma. Price is at 63,343, sitting just 0.5% above the put wall at 63,000 which acts as our main support below. The call wall sits way up at 65,000, and the gamma flip point is way higher at 69,917 with an expected move of ±6.65%. The way the market looks, my guess is if 63,000 holds, longs can breathe and eye that 65,000 ceiling, but break that floor and the shorts get paid while the crowd gets squeezed out.
Over on $ETH, it's a similar nerve-wracking dance with negative gamma at 1,764. We have the put wall down at 1,700 and the call wall at 1,850, while the gamma flip sits right near it at 1,845 with an expected move of ±8.61%. I'd watch how it reacts around these bounds because things get really hot here.
Which side are you on in this mess, and what level are you watching closest? #BTC #ETH
Know that feeling when price just hangs right above the floor and everyone holds their breath?
Looking at the options map for $BTC , I think we are in a very twitchy spot with negative gamma. Price is at 63,343, sitting just 0.5% above the put wall at 63,000 which acts as our main support below. The call wall sits way up at 65,000, and the gamma flip point is way higher at 69,917 with an expected move of ±6.65%. The way the market looks, my guess is if 63,000 holds, longs can breathe and eye that 65,000 ceiling, but break that floor and the shorts get paid while the crowd gets squeezed out.
Over on $ETH , it's a similar nerve-wracking dance with negative gamma at 1,764. We have the put wall down at 1,700 and the call wall at 1,850, while the gamma flip sits right near it at 1,845 with an expected move of ±8.61%. I'd watch how it reacts around these bounds because things get really hot here.
Which side are you on in this mess, and what level are you watching closest? #BTC #ETH
Looking at the options map for $BTC , I think we are in a very twitchy spot with negative gamma. Price is at 63,343, sitting just 0.5% above the put wall at 63,000 which acts as our main support below. The call wall sits way up at 65,000, and the gamma flip point is way higher at 69,917 with an expected move of ±6.65%. The way the market looks, my guess is if 63,000 holds, longs can breathe and eye that 65,000 ceiling, but break that floor and the shorts get paid while the crowd gets squeezed out.
Over on $ETH , it's a similar nerve-wracking dance with negative gamma at 1,764. We have the put wall down at 1,700 and the call wall at 1,850, while the gamma flip sits right near it at 1,845 with an expected move of ±8.61%. I'd watch how it reacts around these bounds because things get really hot here.
Which side are you on in this mess, and what level are you watching closest? #BTC #ETH
172
Do you recognize that feeling when the price gets pinned at a level, even though in my previous post I was expecting completely different dynamics? My previous take on $BTC worked pretty well — the put wall at 64k held the price, while for $ETH the put wall at 1.8k was being breached, with price heading toward a low of 1,784.
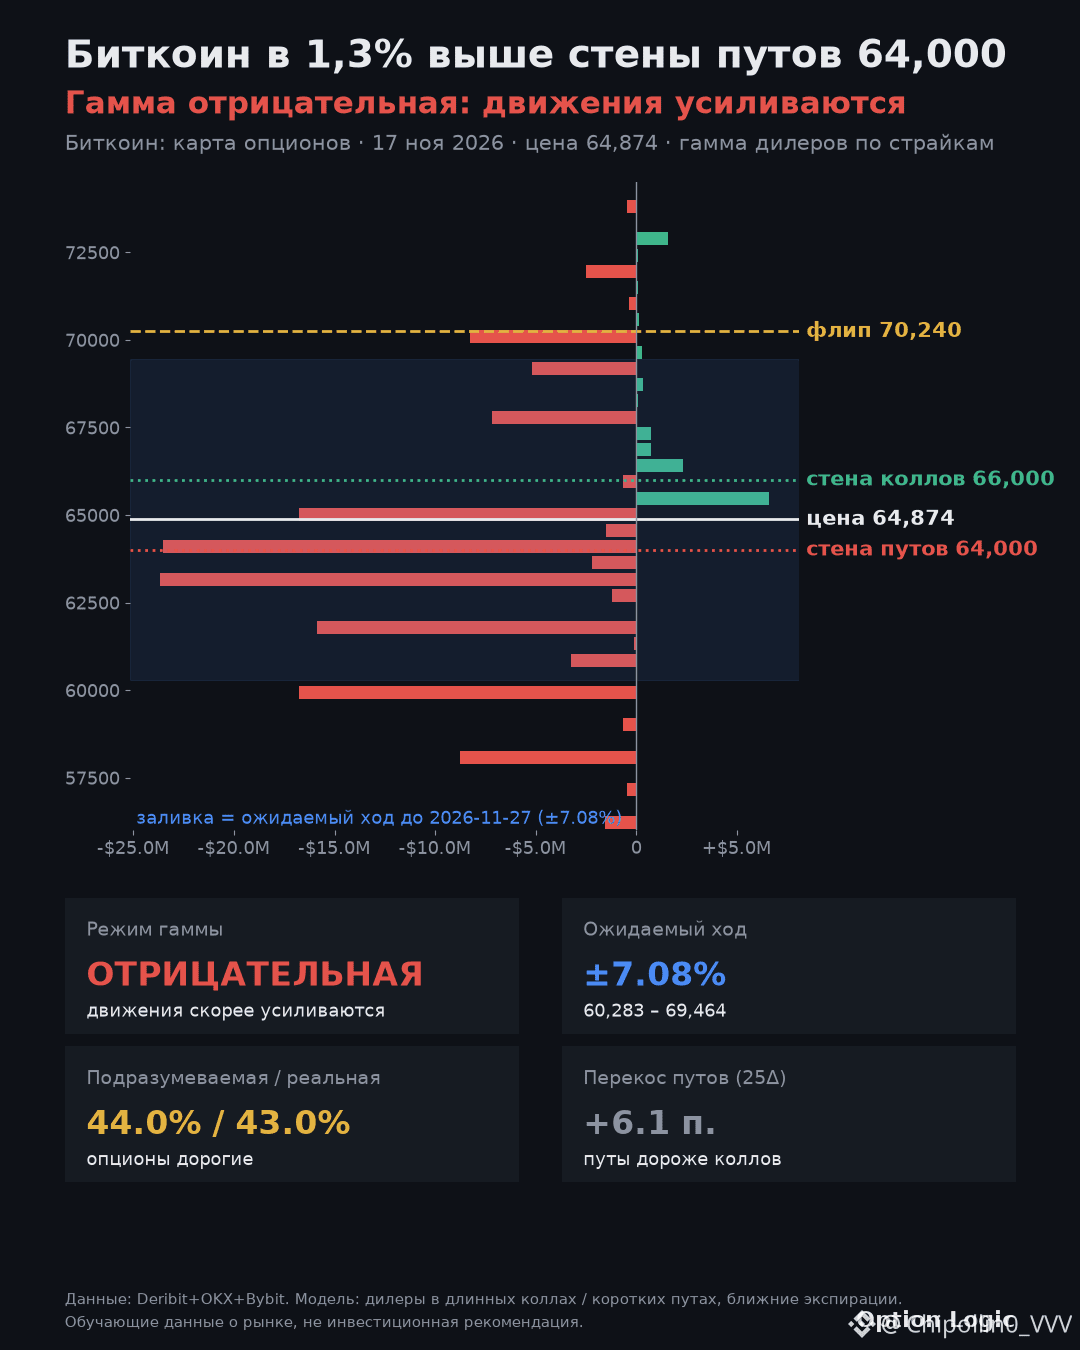
I’m looking at the options map now, and I think negative gamma on both assets is setting a tense tone again. Bitcoin is trading at 64,956, right between the put wall at 64k and the call wall at 66k, with the gamma flip point at 70,240 still a long way off. The crowd is piling into aggressive longs — as many as 71% on Bybit — but futures are being sold at the same time.
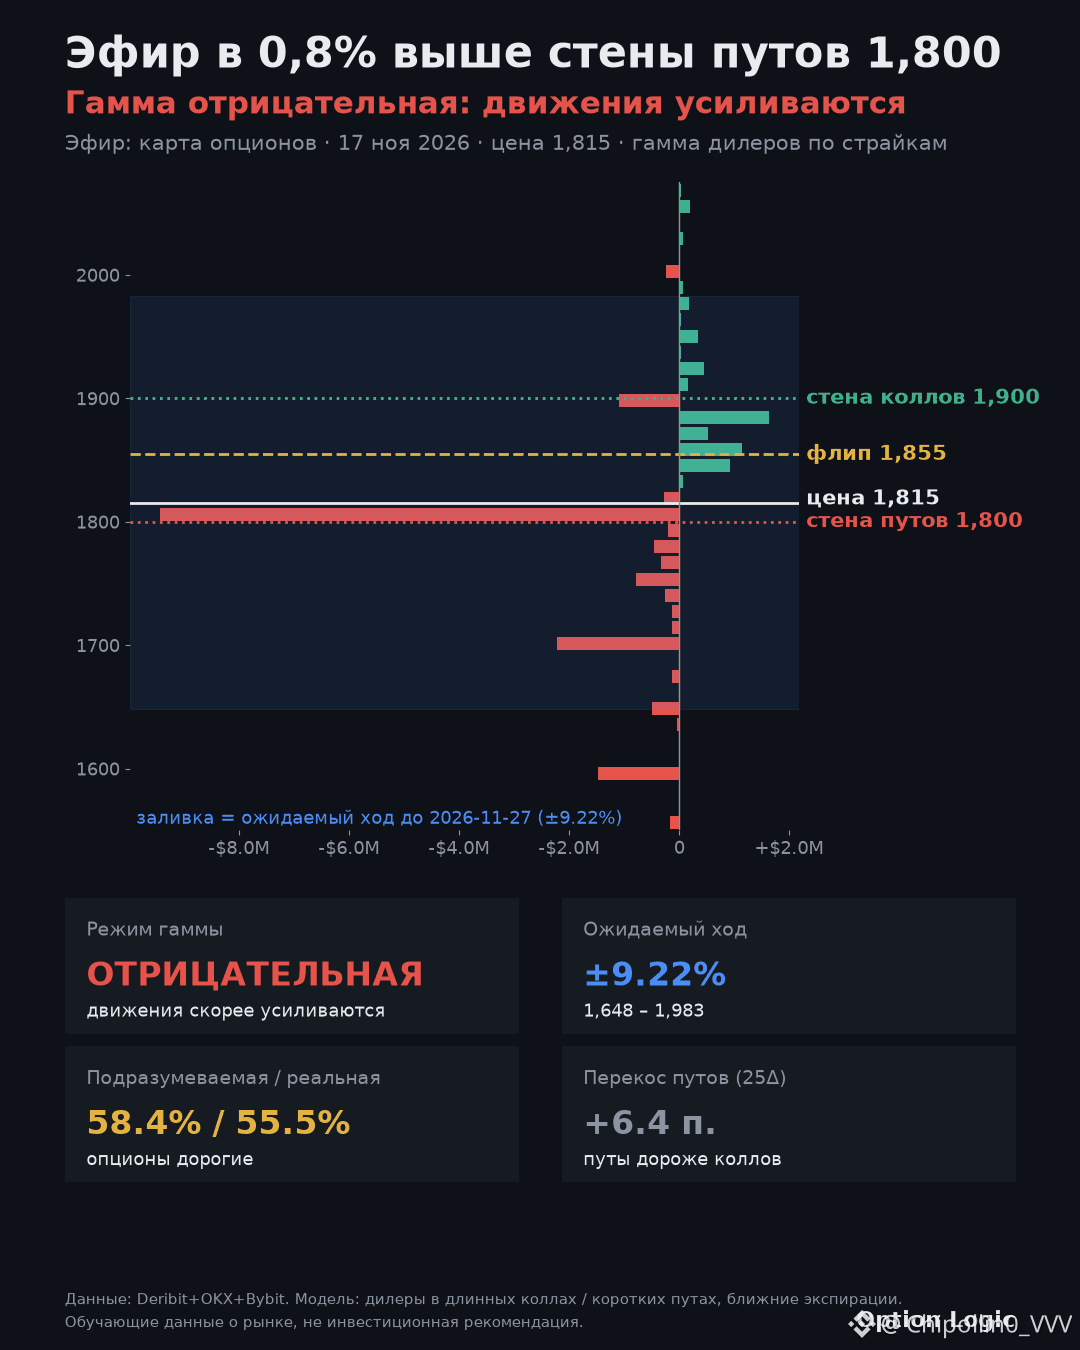
Ethereum is a similar drama: at a price of 1,811, support at 1,800 is holding by a thread, while the gamma flip point is at 1,855. If sellers push ETH below 1,800, longs will start getting stopped out hard.
Which side are you on in this meat grinder, and where are you setting your stops? 🤔
Do you recognize that feeling when the price gets pinned at a level, even though in my previous post I was expecting completely different dynamics? My previous take on $BTC worked pretty well — the put wall at 64k held the price, while for $ETH the put wall at 1.8k was being breached, with price heading toward a low of 1,784.
I’m looking at the options map now, and I think negative gamma on both assets is setting a tense tone again. Bitcoin is trading at 64,956, right between the put wall at 64k and the call wall at 66k, with the gamma flip point at 70,240 still a long way off. The crowd is piling into aggressive longs — as many as 71% on Bybit — but futures are being sold at the same time.
Ethereum is a similar drama: at a price of 1,811, support at 1,800 is holding by a thread, while the gamma flip point is at 1,855. If sellers push ETH below 1,800, longs will start getting stopped out hard.
Which side are you on in this meat grinder, and where are you setting your stops? 🤔
I’m looking at the options map now, and I think negative gamma on both assets is setting a tense tone again. Bitcoin is trading at 64,956, right between the put wall at 64k and the call wall at 66k, with the gamma flip point at 70,240 still a long way off. The crowd is piling into aggressive longs — as many as 71% on Bybit — but futures are being sold at the same time.
Ethereum is a similar drama: at a price of 1,811, support at 1,800 is holding by a thread, while the gamma flip point is at 1,855. If sellers push ETH below 1,800, longs will start getting stopped out hard.
Which side are you on in this meat grinder, and where are you setting your stops? 🤔
1
501
Holding $BTC and wondering why it’s stuck between 64k and 66k? 🎯
Last post I said 64k would hold. BTC played it — back near 64.9k. I missed on $ETH: the 1.8k put wall broke, now at 1.8k. That’s on me.
Both $BTC and $ETH show negative gamma. Dealers are short gamma, so price gravitates to walls instead of blowing through.
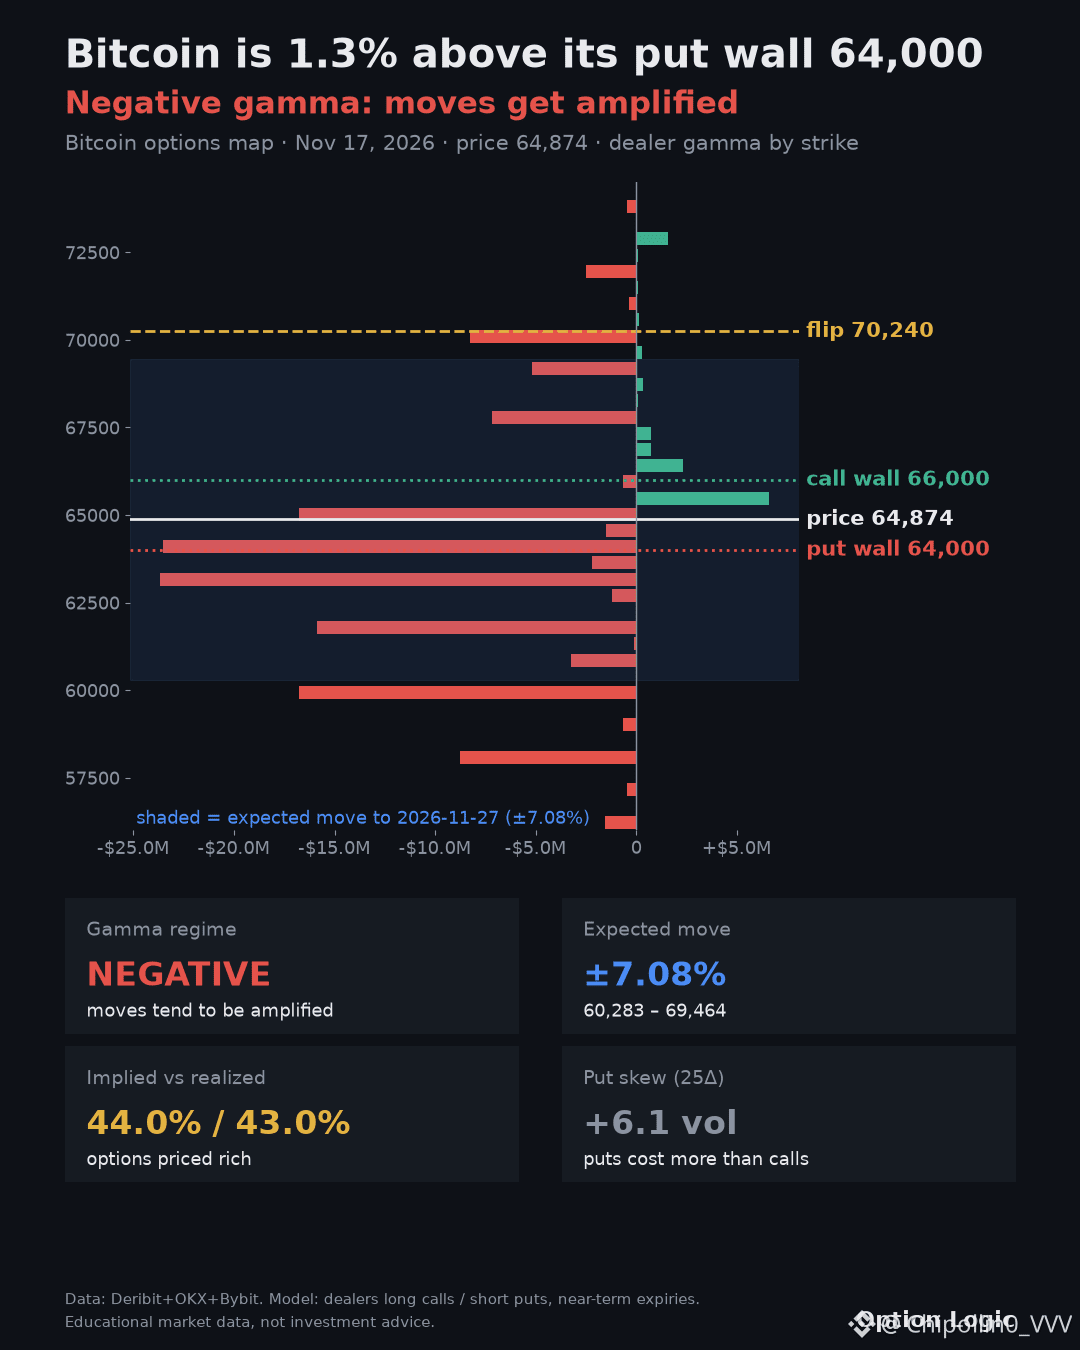
For $BTC: 64k floor, 66k ceiling. Hold 64k and longs breathe, path to 66k opens. Lose 64k and it gets messy toward the flip at 70.2k — not there yet. Funding is calm, spot buying while futures sell. Crowd is heavily long, so a dip could squeeze.
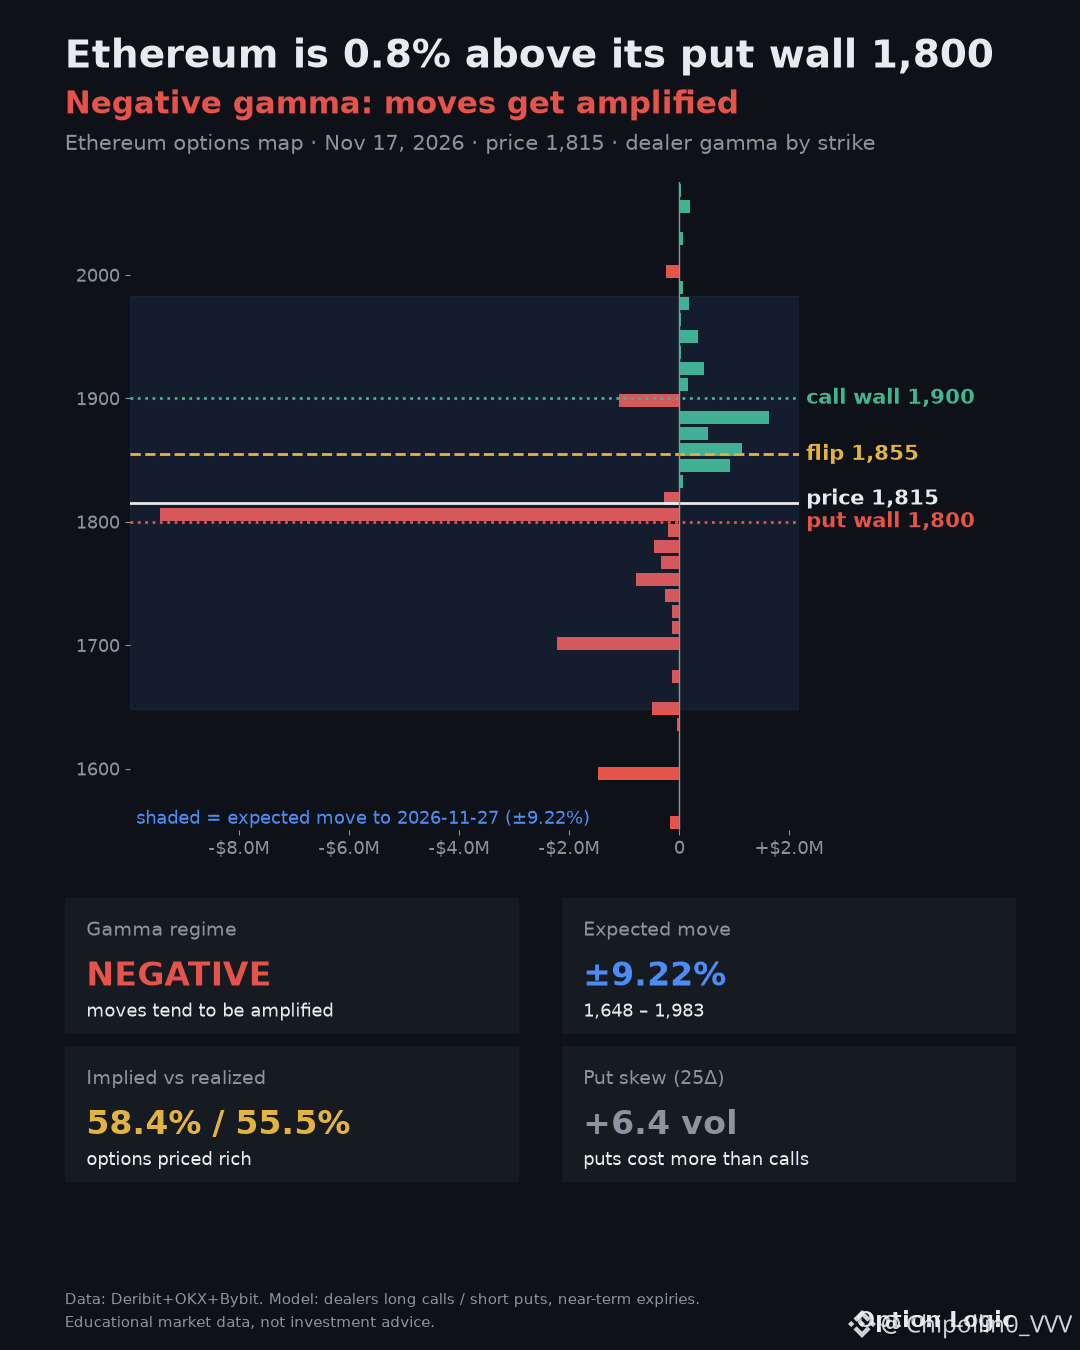
For $ETH: 1.8k is the line in the sand. Ceiling 1.9k, flip at 1,855. Spot and futures selling on OKX, crowd 77% long on Bybit. Break 1.8k and longs get liquidated. Hold it and 1.9k opens up.
Map says range-bound with downward tilt until gamma flips. My guess: $BTC hugs 64k–66k, $ETH fights for 1.8k first.
Where’s your line in the sand? 📉
Holding $BTC and wondering why it’s stuck between 64k and 66k? 🎯
Last post I said 64k would hold. BTC played it — back near 64.9k. I missed on $ETH : the 1.8k put wall broke, now at 1.8k. That’s on me.
Both $BTC and $ETH show negative gamma. Dealers are short gamma, so price gravitates to walls instead of blowing through.
For $BTC : 64k floor, 66k ceiling. Hold 64k and longs breathe, path to 66k opens. Lose 64k and it gets messy toward the flip at 70.2k — not there yet. Funding is calm, spot buying while futures sell. Crowd is heavily long, so a dip could squeeze.
For $ETH : 1.8k is the line in the sand. Ceiling 1.9k, flip at 1,855. Spot and futures selling on OKX, crowd 77% long on Bybit. Break 1.8k and longs get liquidated. Hold it and 1.9k opens up.
Map says range-bound with downward tilt until gamma flips. My guess: $BTC hugs 64k–66k, $ETH fights for 1.8k first.
Where’s your line in the sand? 📉
Last post I said 64k would hold. BTC played it — back near 64.9k. I missed on $ETH : the 1.8k put wall broke, now at 1.8k. That’s on me.
Both $BTC and $ETH show negative gamma. Dealers are short gamma, so price gravitates to walls instead of blowing through.
For $BTC : 64k floor, 66k ceiling. Hold 64k and longs breathe, path to 66k opens. Lose 64k and it gets messy toward the flip at 70.2k — not there yet. Funding is calm, spot buying while futures sell. Crowd is heavily long, so a dip could squeeze.
For $ETH : 1.8k is the line in the sand. Ceiling 1.9k, flip at 1,855. Spot and futures selling on OKX, crowd 77% long on Bybit. Break 1.8k and longs get liquidated. Hold it and 1.9k opens up.
Map says range-bound with downward tilt until gamma flips. My guess: $BTC hugs 64k–66k, $ETH fights for 1.8k first.
Where’s your line in the sand? 📉
1
225
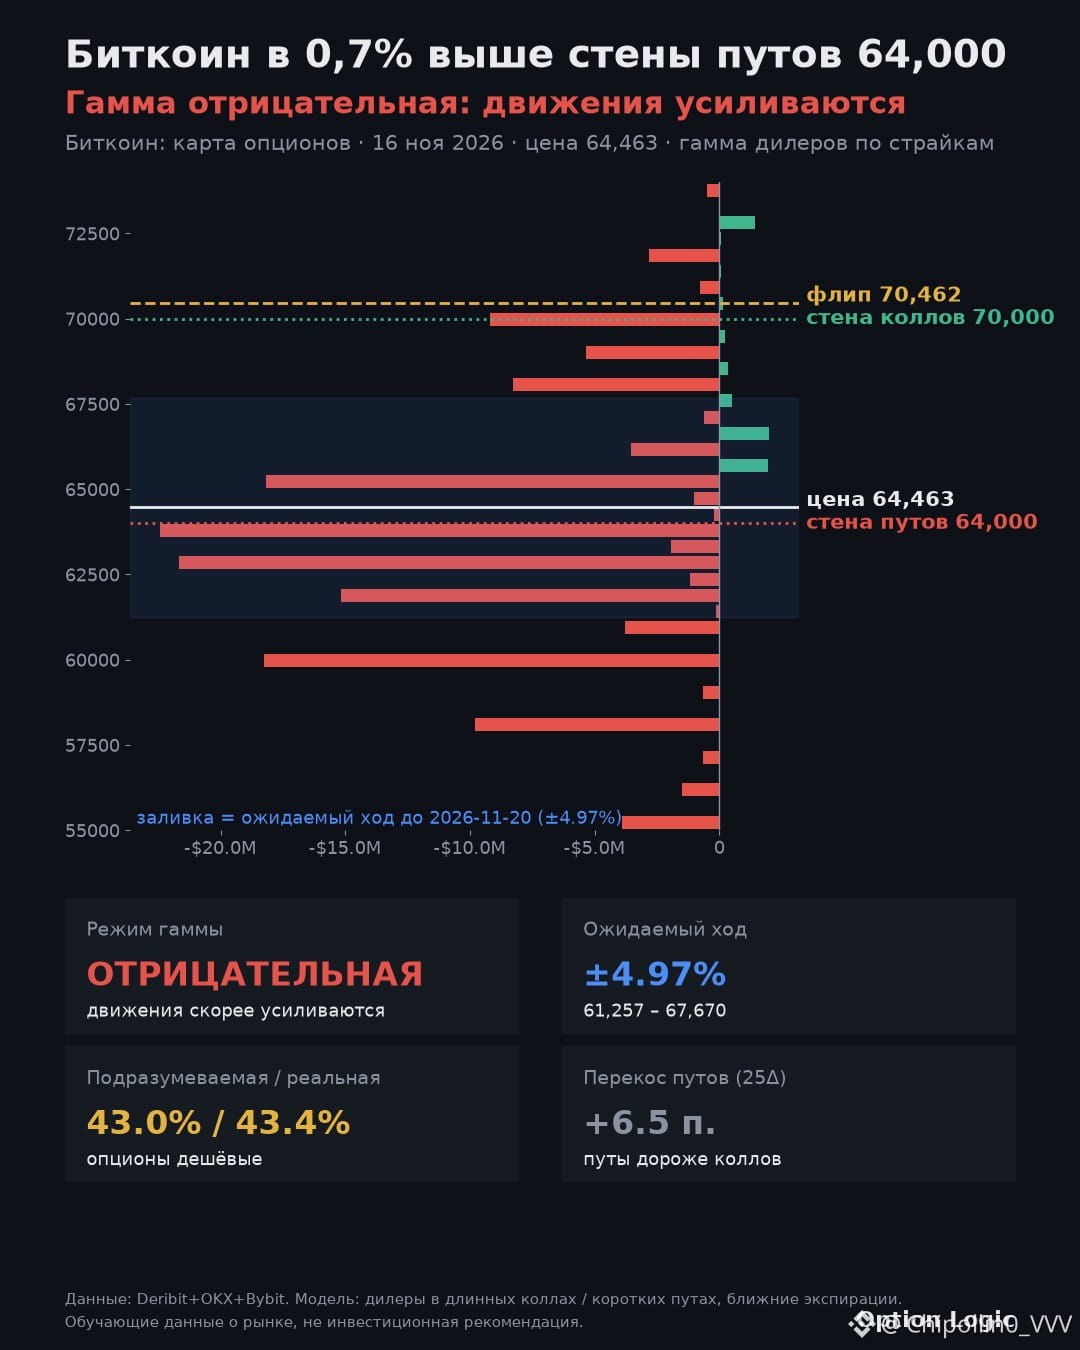
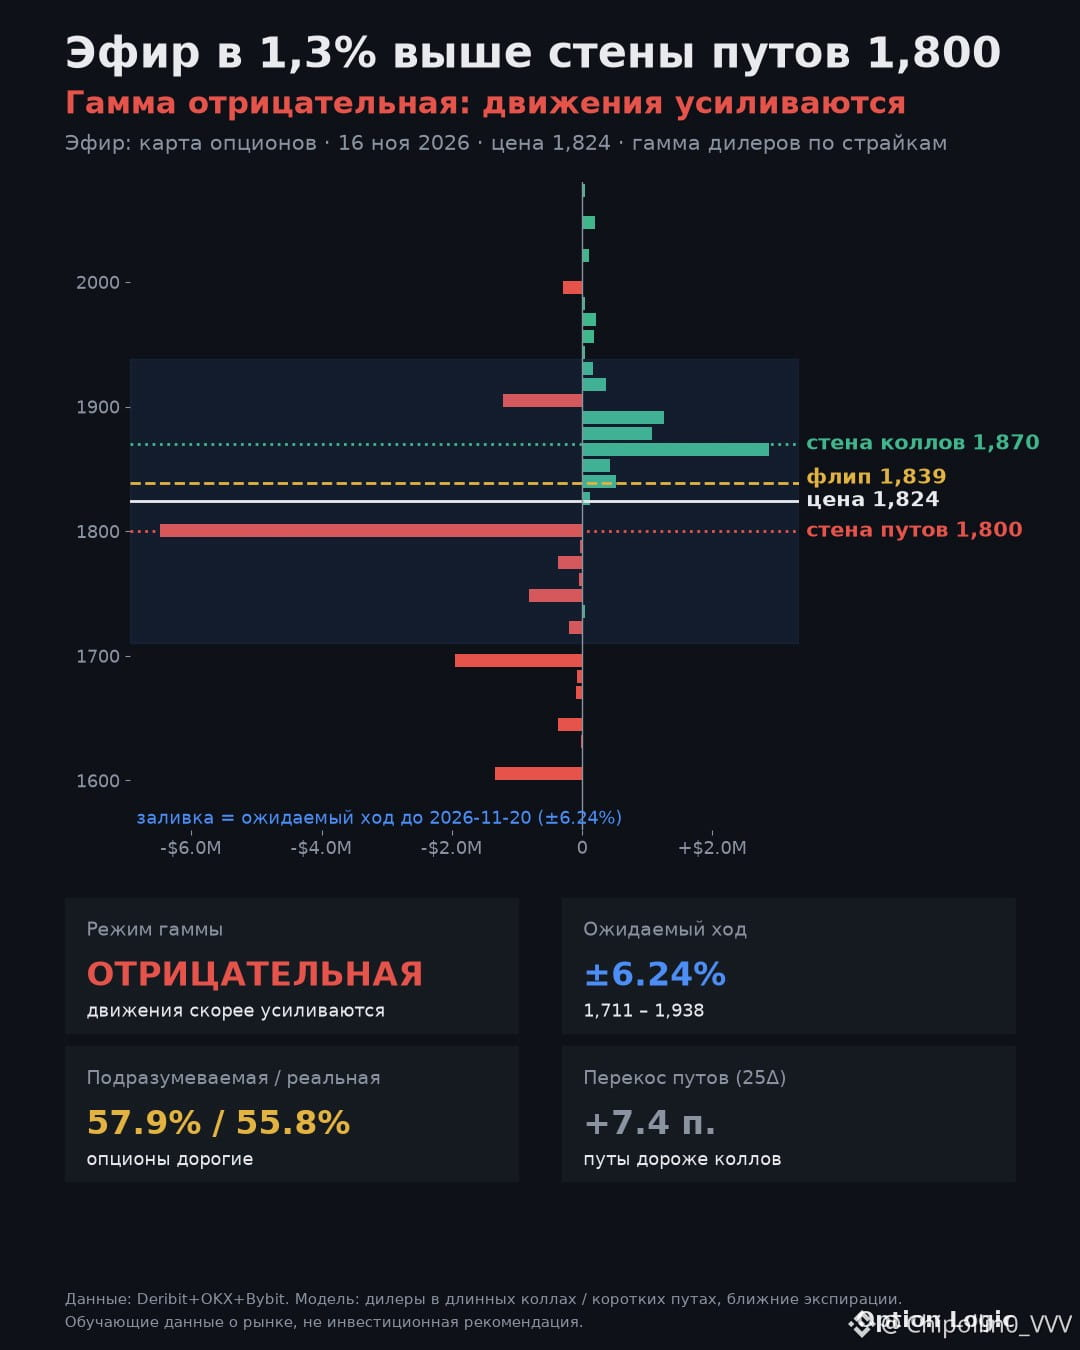
Options Map 16.11: Where the Market Is Holding BTC and ETH
$BTC — Bitcoin is 0.7% above the 64,000 put wall
Negative gamma: moves are amplified
Levels: 64,000 put wall · flip 70,462 · 70,000 call wall
Expected move through 20.11: 61,257–67,670 (±4.97%)
How the map frames a directional trade:
• Upside: The 70,000 call wall and 70,462 flip are close together, forming a strong ceiling; holding above 70,462 changes the picture.
• Downside: A break below the 64,000 put wall usually accelerates in negative gamma; the map’s boundary is 61,257.
• Options are cheap: IV 43.0% versus realized volatility of 43.4%.
• Under the market’s hood: On OKX, there are 2.8 times more long accounts than short accounts.
$ETH — Ether is 1.3% above the 1,800 put wall
Negative gamma: moves are amplified
Levels: 1,800 put wall · flip 1,839 · 1,870 call wall
Expected move through 20.11: 1,711–1,938 (±6.24%)
How the map frames a directional trade:
• Upside: First, price needs to reclaim the 1,839 flip—dealer hedging starts dampening moves there; the next magnet is 1,870.
• Downside: A break below the 1,800 put wall usually accelerates in negative gamma; the map’s boundary is 1,711.
• Options are expensive: IV 57.9% versus realized volatility of 55.8%.
Not investment advice — data on options market structure.
#BTC #ETH #опционы #OptionLogic
Options Map 16.11: Where the Market Is Holding BTC and ETH
$BTC — Bitcoin is 0.7% above the 64,000 put wall
Negative gamma: moves are amplified
Levels: 64,000 put wall · flip 70,462 · 70,000 call wall
Expected move through 20.11: 61,257–67,670 (±4.97%)
How the map frames a directional trade:
• Upside: The 70,000 call wall and 70,462 flip are close together, forming a strong ceiling; holding above 70,462 changes the picture.
• Downside: A break below the 64,000 put wall usually accelerates in negative gamma; the map’s boundary is 61,257.
• Options are cheap: IV 43.0% versus realized volatility of 43.4%.
• Under the market’s hood: On OKX, there are 2.8 times more long accounts than short accounts.
$ETH — Ether is 1.3% above the 1,800 put wall
Negative gamma: moves are amplified
Levels: 1,800 put wall · flip 1,839 · 1,870 call wall
Expected move through 20.11: 1,711–1,938 (±6.24%)
How the map frames a directional trade:
• Upside: First, price needs to reclaim the 1,839 flip—dealer hedging starts dampening moves there; the next magnet is 1,870.
• Downside: A break below the 1,800 put wall usually accelerates in negative gamma; the map’s boundary is 1,711.
• Options are expensive: IV 57.9% versus realized volatility of 55.8%.
Not investment advice — data on options market structure.
#BTC #ETH #опционы #OptionLogic
$BTC — Bitcoin is 0.7% above the 64,000 put wall
Negative gamma: moves are amplified
Levels: 64,000 put wall · flip 70,462 · 70,000 call wall
Expected move through 20.11: 61,257–67,670 (±4.97%)
How the map frames a directional trade:
• Upside: The 70,000 call wall and 70,462 flip are close together, forming a strong ceiling; holding above 70,462 changes the picture.
• Downside: A break below the 64,000 put wall usually accelerates in negative gamma; the map’s boundary is 61,257.
• Options are cheap: IV 43.0% versus realized volatility of 43.4%.
• Under the market’s hood: On OKX, there are 2.8 times more long accounts than short accounts.
$ETH — Ether is 1.3% above the 1,800 put wall
Negative gamma: moves are amplified
Levels: 1,800 put wall · flip 1,839 · 1,870 call wall
Expected move through 20.11: 1,711–1,938 (±6.24%)
How the map frames a directional trade:
• Upside: First, price needs to reclaim the 1,839 flip—dealer hedging starts dampening moves there; the next magnet is 1,870.
• Downside: A break below the 1,800 put wall usually accelerates in negative gamma; the map’s boundary is 1,711.
• Options are expensive: IV 57.9% versus realized volatility of 55.8%.
Not investment advice — data on options market structure.
#BTC #ETH #опционы #OptionLogic
1
285
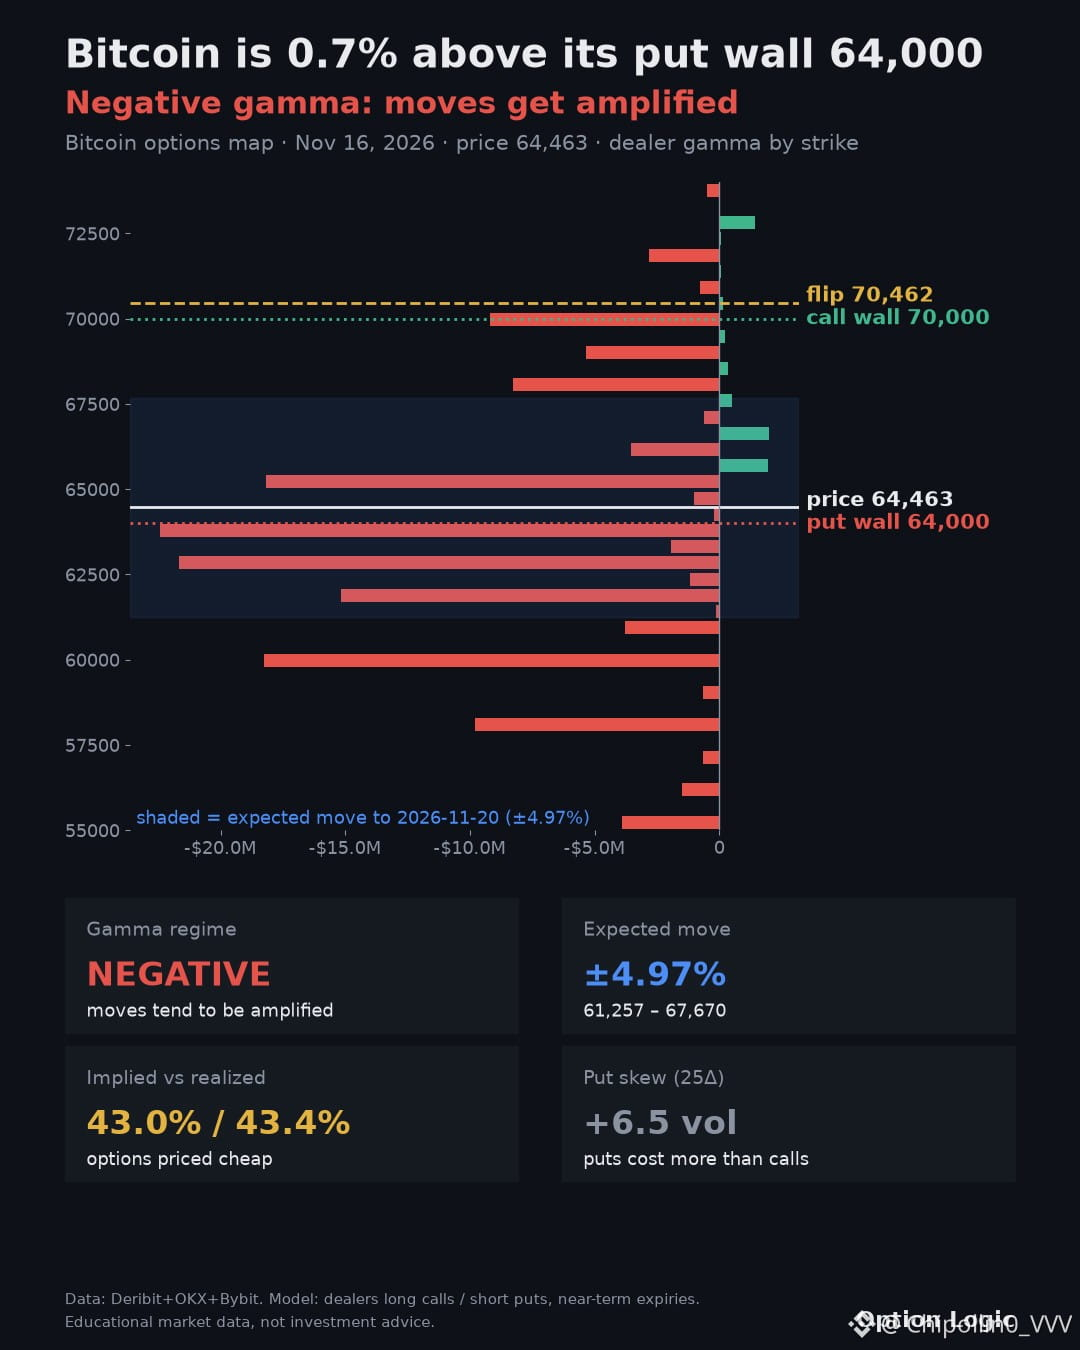
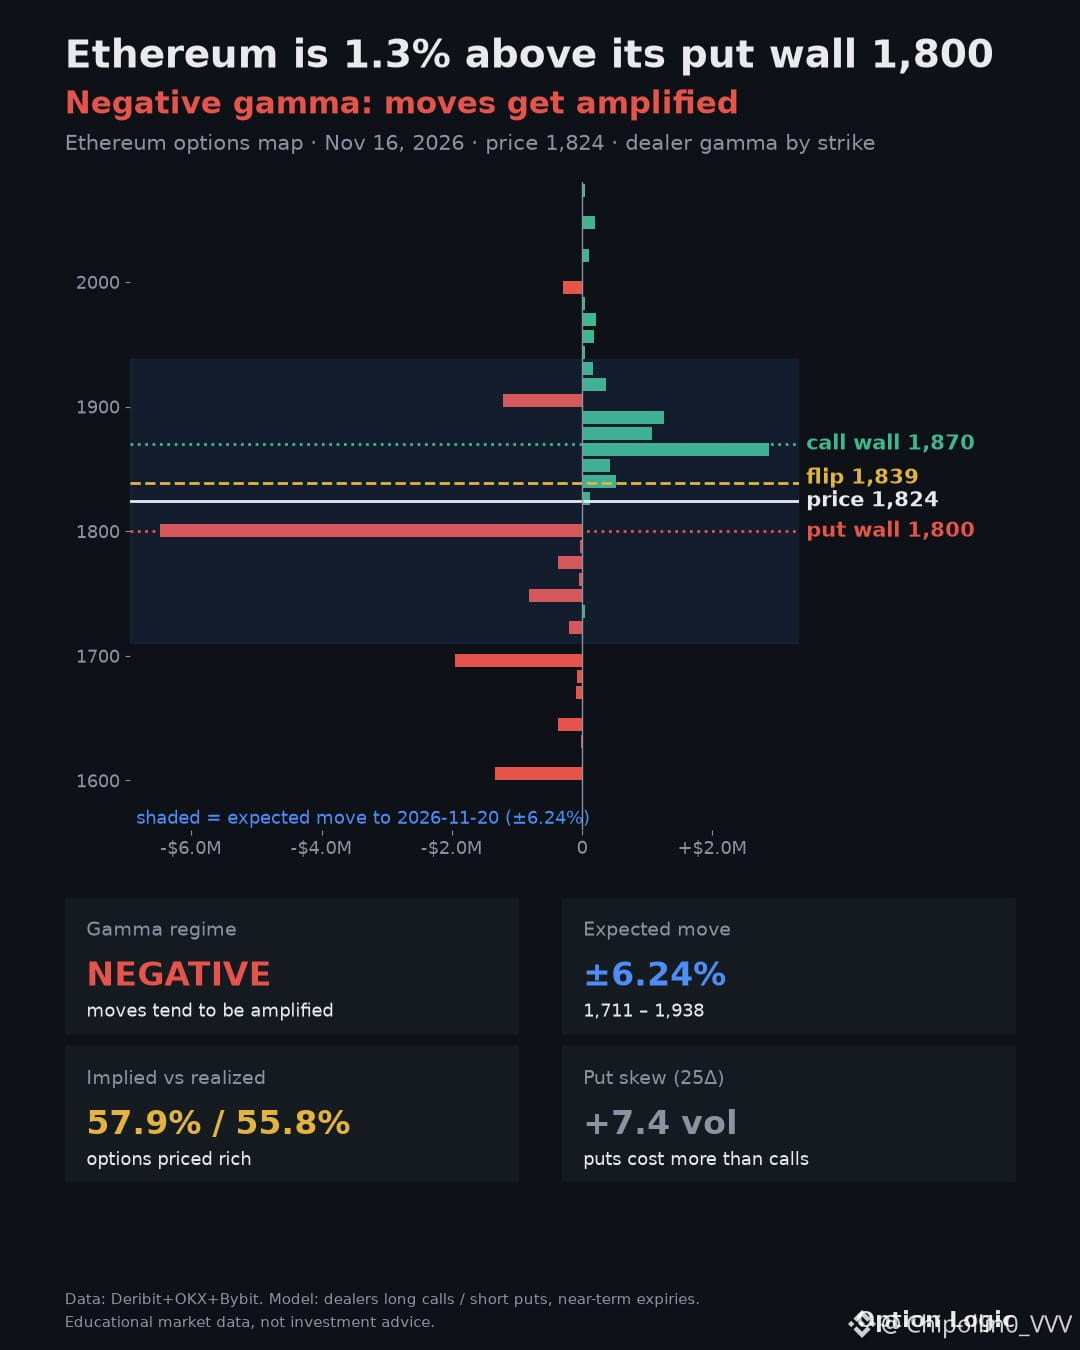
Options map, Nov 16: where the market holds BTC and ETH
$BTC — Bitcoin is 0.7% above its put wall 64,000
Negative gamma: moves get amplified
Levels: put wall 64,000 · flip 70,462 · call wall 70,000
Expected move to 11-20: 61,257–67,670 (±4.97%)
How the map frames a directional trade:
• Long case: the call wall 70,000 and the flip 70,462 sit together — a heavy lid overhead; holding above 70,462 changes the picture.
• Short case: a break of the put wall 64,000 in negative gamma tends to accelerate; the map's boundary is 61,257.
• Options priced cheap: IV 43.0% vs realized 43.4%.
• Under the hood: OKX accounts are 2.8× long vs short.
$ETH — Ethereum is 1.3% above its put wall 1,800
Negative gamma: moves get amplified
Levels: put wall 1,800 · flip 1,839 · call wall 1,870
Expected move to 11-20: 1,711–1,938 (±6.24%)
How the map frames a directional trade:
• Long case: needs a reclaim of the flip 1,839 — above it dealer hedging starts dampening moves; next magnet 1,870.
• Short case: a break of the put wall 1,800 in negative gamma tends to accelerate; the map's boundary is 1,711.
• Options priced rich: IV 57.9% vs realized 55.8%.
Not financial advice — options market structure data.
#BTC #ETH #options #OptionLogic
Options map, Nov 16: where the market holds BTC and ETH
$BTC — Bitcoin is 0.7% above its put wall 64,000
Negative gamma: moves get amplified
Levels: put wall 64,000 · flip 70,462 · call wall 70,000
Expected move to 11-20: 61,257–67,670 (±4.97%)
How the map frames a directional trade:
• Long case: the call wall 70,000 and the flip 70,462 sit together — a heavy lid overhead; holding above 70,462 changes the picture.
• Short case: a break of the put wall 64,000 in negative gamma tends to accelerate; the map's boundary is 61,257.
• Options priced cheap: IV 43.0% vs realized 43.4%.
• Under the hood: OKX accounts are 2.8× long vs short.
$ETH — Ethereum is 1.3% above its put wall 1,800
Negative gamma: moves get amplified
Levels: put wall 1,800 · flip 1,839 · call wall 1,870
Expected move to 11-20: 1,711–1,938 (±6.24%)
How the map frames a directional trade:
• Long case: needs a reclaim of the flip 1,839 — above it dealer hedging starts dampening moves; next magnet 1,870.
• Short case: a break of the put wall 1,800 in negative gamma tends to accelerate; the map's boundary is 1,711.
• Options priced rich: IV 57.9% vs realized 55.8%.
Not financial advice — options market structure data.
#BTC #ETH #options #OptionLogic
$BTC — Bitcoin is 0.7% above its put wall 64,000
Negative gamma: moves get amplified
Levels: put wall 64,000 · flip 70,462 · call wall 70,000
Expected move to 11-20: 61,257–67,670 (±4.97%)
How the map frames a directional trade:
• Long case: the call wall 70,000 and the flip 70,462 sit together — a heavy lid overhead; holding above 70,462 changes the picture.
• Short case: a break of the put wall 64,000 in negative gamma tends to accelerate; the map's boundary is 61,257.
• Options priced cheap: IV 43.0% vs realized 43.4%.
• Under the hood: OKX accounts are 2.8× long vs short.
$ETH — Ethereum is 1.3% above its put wall 1,800
Negative gamma: moves get amplified
Levels: put wall 1,800 · flip 1,839 · call wall 1,870
Expected move to 11-20: 1,711–1,938 (±6.24%)
How the map frames a directional trade:
• Long case: needs a reclaim of the flip 1,839 — above it dealer hedging starts dampening moves; next magnet 1,870.
• Short case: a break of the put wall 1,800 in negative gamma tends to accelerate; the map's boundary is 1,711.
• Options priced rich: IV 57.9% vs realized 55.8%.
Not financial advice — options market structure data.
#BTC #ETH #options #OptionLogic
1
104
$ETH Interesting, are there any options traders here?
MARKET STATE: "Artificial Stabilization"
The ETH market is caught in a squeeze. Major players (market makers) are acting like a dampener, quelling any fluctuations. Technically, they are forced to sell on the upswing and buy on dips, which 'cements' the chart in a narrow corridor. Any trend right now quickly fizzles out.
🔷 PRICE TARGETS
Magnet ($2,300): The main liquidity node. The price is tethered to it like a rubber band: deviations of $20–30 quickly snap back.
Ceiling ($2,300 – $2,325): A solid sell wall. Without an abnormal buying impulse, breaking through this barrier won't happen.
Cliff edge ($2,200): Critical support. If the price settles below this, market defenders could turn into aggressive sellers, triggering a drop to $2,000.
🔮 LIKELY SCENARIOS
Sideways: Continuation of the 'saw' in the range of $2,280 – $2,320.
Trap up: A short squeeze to $2,350 followed by a quick return to $2,300 under the pressure of liquidity walls.
Test of lows: A sharp spike to $2,200 to collect stop-losses followed by a subsequent buyback. #GEX levels #маркетмейкер
$ETH Interesting, are there any options traders here?
MARKET STATE: "Artificial Stabilization"
The ETH market is caught in a squeeze. Major players (market makers) are acting like a dampener, quelling any fluctuations. Technically, they are forced to sell on the upswing and buy on dips, which 'cements' the chart in a narrow corridor. Any trend right now quickly fizzles out.
🔷 PRICE TARGETS
Magnet ($2,300): The main liquidity node. The price is tethered to it like a rubber band: deviations of $20–30 quickly snap back.
Ceiling ($2,300 – $2,325): A solid sell wall. Without an abnormal buying impulse, breaking through this barrier won't happen.
Cliff edge ($2,200): Critical support. If the price settles below this, market defenders could turn into aggressive sellers, triggering a drop to $2,000.
🔮 LIKELY SCENARIOS
Sideways: Continuation of the 'saw' in the range of $2,280 – $2,320.
Trap up: A short squeeze to $2,350 followed by a quick return to $2,300 under the pressure of liquidity walls.
Test of lows: A sharp spike to $2,200 to collect stop-losses followed by a subsequent buyback. #GEX levels #маркетмейкер
MARKET STATE: "Artificial Stabilization"
The ETH market is caught in a squeeze. Major players (market makers) are acting like a dampener, quelling any fluctuations. Technically, they are forced to sell on the upswing and buy on dips, which 'cements' the chart in a narrow corridor. Any trend right now quickly fizzles out.
🔷 PRICE TARGETS
Magnet ($2,300): The main liquidity node. The price is tethered to it like a rubber band: deviations of $20–30 quickly snap back.
Ceiling ($2,300 – $2,325): A solid sell wall. Without an abnormal buying impulse, breaking through this barrier won't happen.
Cliff edge ($2,200): Critical support. If the price settles below this, market defenders could turn into aggressive sellers, triggering a drop to $2,000.
🔮 LIKELY SCENARIOS
Sideways: Continuation of the 'saw' in the range of $2,280 – $2,320.
Trap up: A short squeeze to $2,350 followed by a quick return to $2,300 under the pressure of liquidity walls.
Test of lows: A sharp spike to $2,200 to collect stop-losses followed by a subsequent buyback. #GEX levels #маркетмейкер
2
142
Large capital is at work! Who has stocked up the most?
The past week has shown that interest in crypto is only growing. Let's look at the purchases of top funds:
101 627 $ETH went to Bitmine's storage.
34 164 $BTC added to Strategy's balance.
When such players enter with such volumes — it’s a reason to think about the strength of the current trend. Do you believe in the continuation of the rally?
#BitcoinPriceTrends
Large capital is at work! Who has stocked up the most?
The past week has shown that interest in crypto is only growing. Let's look at the purchases of top funds:
101 627 $ETH went to Bitmine's storage.
34 164 $BTC added to Strategy's balance.
When such players enter with such volumes — it’s a reason to think about the strength of the current trend. Do you believe in the continuation of the rally?
#BitcoinPriceTrends
The past week has shown that interest in crypto is only growing. Let's look at the purchases of top funds:
101 627 $ETH went to Bitmine's storage.
34 164 $BTC added to Strategy's balance.
When such players enter with such volumes — it’s a reason to think about the strength of the current trend. Do you believe in the continuation of the rally?
#BitcoinPriceTrends
135
$BTC VMCIX, Vanguard fund, acquired shares of Strategy (MSTR) for a total of $5.05 billion #BTC100kNext? #StrategyBTCPurchase
{future}(BTCUSDT)
$BTC VMCIX, Vanguard fund, acquired shares of Strategy (MSTR) for a total of $5.05 billion #BTC100kNext? #StrategyBTCPurchase
111
$JST
{future}(JSTUSDT)
Justin Sun announced (<a>https://t.me/justinsunX/2883</a>) that Just DAO burned 10% of the total JST supply.
$JST
Justin Sun announced (<a>https://t.me/justinsunX/2883</a>) that Just DAO burned 10% of the total JST supply.
Justin Sun announced (<a>https://t.me/justinsunX/2883</a>) that Just DAO burned 10% of the total JST supply.
11
$ETH Daily transaction volume on the Ethereum network yesterday exceeded 2.59 million, reaching a record level.
{future}(ETHUSDT)
$ETH Daily transaction volume on the Ethereum network yesterday exceeded 2.59 million, reaching a record level.
130
$ETH
{future}(ETHUSDT)
Santiment: On average, 327.1 thousand new ETH wallets were created daily over the past week, including 393.6 thousand on Sunday (the highest figure in history).
$ETH
Santiment: On average, 327.1 thousand new ETH wallets were created daily over the past week, including 393.6 thousand on Sunday (the highest figure in history).
Santiment: On average, 327.1 thousand new ETH wallets were created daily over the past week, including 393.6 thousand on Sunday (the highest figure in history).
93
James Wynn opened long $BTC and $PEPE
{spot}(PEPEUSDT)
{future}(BTCUSDT)
James Wynn opened long $BTC and $PEPE
20
$TRUMP
{future}(TRUMPUSDT)
$MELANIA $WLFI today on the pump with active purchases. Also, all tokens are in the top for growth in open interest, with WLFI appearing in first place in this top around ~10:39 Moscow time (after which the price of the token began to rise).
{future}(WLFIUSDT)
{future}(MELANIAUSDT)
$TRUMP
$MELANIA $WLFI today on the pump with active purchases. Also, all tokens are in the top for growth in open interest, with WLFI appearing in first place in this top around ~10:39 Moscow time (after which the price of the token began to rise).
$MELANIA $WLFI today on the pump with active purchases. Also, all tokens are in the top for growth in open interest, with WLFI appearing in first place in this top around ~10:39 Moscow time (after which the price of the token began to rise).
1
2.1k
$ETH
{future}(ETHUSDT)
Tom Lee, chairman of BitMine, is proposing to pump the number of authorized shares to 1000 times, up to $50 billion.
According to him, hitting the ETH milestone of $250,000 means the 'implied price' of BitMine shares is around ~$5000, which is way too steep for most retail investors: "not everyone wants a share price at $500, $1500, or $5000. Most folks prefer the shares to hover around ~$25". cointelegraph (https://cointelegraph.com/news/bitmine-chairman-1-000x-increase-authorized-shares-50b)
$ETH
Tom Lee, chairman of BitMine, is proposing to pump the number of authorized shares to 1000 times, up to $50 billion.
According to him, hitting the ETH milestone of $250,000 means the 'implied price' of BitMine shares is around ~$5000, which is way too steep for most retail investors: "not everyone wants a share price at $500, $1500, or $5000. Most folks prefer the shares to hover around ~$25". cointelegraph (https://cointelegraph.com/news/bitmine-chairman-1-000x-increase-authorized-shares-50b)
Tom Lee, chairman of BitMine, is proposing to pump the number of authorized shares to 1000 times, up to $50 billion.
According to him, hitting the ETH milestone of $250,000 means the 'implied price' of BitMine shares is around ~$5000, which is way too steep for most retail investors: "not everyone wants a share price at $500, $1500, or $5000. Most folks prefer the shares to hover around ~$25". cointelegraph (https://cointelegraph.com/news/bitmine-chairman-1-000x-increase-authorized-shares-50b)
33
$BTC On Polymarket, the probability of BTC reaching $150,000 this year is estimated at only 21%.
At the same time, many analysts, such as Standard Chartered, Strategy, and Bernstein, predict that the price $BTC
{spot}(BTCUSDT)
will reach $150,000 in 2026, while others, who are more optimistic, like Tom Lee from Fundstrat, expect a price around $200,000–250,000. cointelegraph
$BTC On Polymarket, the probability of BTC reaching $150,000 this year is estimated at only 21%.
At the same time, many analysts, such as Standard Chartered, Strategy, and Bernstein, predict that the price $BTC
will reach $150,000 in 2026, while others, who are more optimistic, like Tom Lee from Fundstrat, expect a price around $200,000–250,000. cointelegraph
At the same time, many analysts, such as Standard Chartered, Strategy, and Bernstein, predict that the price $BTC
will reach $150,000 in 2026, while others, who are more optimistic, like Tom Lee from Fundstrat, expect a price around $200,000–250,000. cointelegraph
2
1k
·
--
Bullish
$BTC
{future}(BTCUSDT)
BTC analysts at CF Benchmarks consider BTC an essential part of an investment portfolio and forecast (https://www.coindesk.com/markets/2025/12/18/cf-benchmarks-views-bitcoin-as-portfolio-staple-projects-usd1-4-million-price-target-by-2035) a target price of $1.4 million by 2035.
$BTC
BTC analysts at CF Benchmarks consider BTC an essential part of an investment portfolio and forecast (https://www.coindesk.com/markets/2025/12/18/cf-benchmarks-views-bitcoin-as-portfolio-staple-projects-usd1-4-million-price-target-by-2035) a target price of $1.4 million by 2035.
BTC analysts at CF Benchmarks consider BTC an essential part of an investment portfolio and forecast (https://www.coindesk.com/markets/2025/12/18/cf-benchmarks-views-bitcoin-as-portfolio-staple-projects-usd1-4-million-price-target-by-2035) a target price of $1.4 million by 2035.
6
·
--
Bullish
$POL Polygon Labs made a strategic investment in Boys Club (https://polygon.technology/blog/polygon-labs-makes-strategic-investment-in-boys-club-to-advance-cultural-crypto-storytelling) to push forward the cultural crypto storytelling.
$POL Polygon Labs made a strategic investment in Boys Club (https://polygon.technology/blog/polygon-labs-makes-strategic-investment-in-boys-club-to-advance-cultural-crypto-storytelling) to push forward the cultural crypto storytelling.
2
$ETH
{spot}(ETHUSDT)
ETH CQ: Ethereum's offer on exchanges has fallen to its lowest level since 2016.
$ETH
ETH CQ: Ethereum's offer on exchanges has fallen to its lowest level since 2016.
ETH CQ: Ethereum's offer on exchanges has fallen to its lowest level since 2016.
21
·
--
Bullish
$BTC
{spot}(BTCUSDT)
BTC Santiment notes that the crowd is now expecting a continuation of BTC growth
$BTC
BTC Santiment notes that the crowd is now expecting a continuation of BTC growth
BTC Santiment notes that the crowd is now expecting a continuation of BTC growth
16
Log in to explore more content
Join global crypto users on Binance Square
⚡️ Get latest and useful information about crypto.
💬 Trusted by the world’s largest crypto exchange.
👍 Discover real insights from verified creators.
Email / Phone number
Trending Topics
AnthropicToDebutAfter$83IPOPricing
15,333 views
137 Discussing
Stock Futures Hold Near Flat as Anthropic Prices IPO at $83 Ahead of Debut
Binance News
·8 Likes
·7.4k views
BTCRemainsUnderPressureAfterHawkishFOMCMinutes
57,463 views
1,162 Discussing
NvidiaBoardReportedlySplitOverHuang’sReturn
19,065 views
551 Discussing