
Gas哥
122 Posts

Gas哥
 Square Verified
Frequent Trader
7.8 Years
47 Following
18 Followers
12 Liked
Posts
“Spot ETF has been getting inflows for ten straight weeks” sounds smooth, but don’t weld a catchy narrative into, “short-term positions should be held.” The single-week thickness is already very thin, and the price action is speaking first.
Main chart $SOL : Binance USD-basis perpetual spot price is around 103.27, about -1.63% over 24 hours. The breakout line (SAR—parabolic support for the short term) is about 104.47. Price is now roughly 1.20 below it. Last hour it was still trading above that line—this candle is a breach, not a wiggle along the line. Momentum J is about 32.56 (K42.60/D47.62). After being somewhat overheated earlier, it has rolled back into the cool zone—more like momentum pressure is bleeding off. Don’t read it as, “oversold means it’s time to buy.” 24-hour high 105.88, low 102.66; trading volume about 1.479 billion USDT. Open interest notional is about $818 million. Funding rate is around -0.0026%—longs aren’t paying much.
Supporting cast $XRP : current price about 1.394, -0.69% over 24 hours; breakout line around 1.3731, still roughly 0.021 above it. J is about 49.52, hovering near neutral. Volume is about 784 million; OI notional about $430 million. Among mainstream altcoins both are falling—one breaks the line and releases pressure, the other still hangs above the line. Same direction ≠ same structure.
Fund ledger (SoSoValue/Chaincatcher, 2026-09-07): Last week’s SOL spot ETF net inflow was about $6.1751 million, counting as the consecutive tenth week of net inflows. But it’s still thin—GSOL weekly inflow is about $4.3765 million, MSOL about $1.3575 million, while the largest basket, BSOL, actually had a weekly outflow of about $0.7355 million. Category AUM is about $1.41 billion, with cumulative net inflows around $1.35 billion. Ten straight weeks of inflows are a fact; the inference that “inflows continuously means the chart can’t break the line” doesn’t hold.
Only talk about the next step after it breaks the breakout line. It’s too early to discuss that now.
Main chart $SOL : Binance USD-basis perpetual spot price is around 103.27, about -1.63% over 24 hours. The breakout line (SAR—parabolic support for the short term) is about 104.47. Price is now roughly 1.20 below it. Last hour it was still trading above that line—this candle is a breach, not a wiggle along the line. Momentum J is about 32.56 (K42.60/D47.62). After being somewhat overheated earlier, it has rolled back into the cool zone—more like momentum pressure is bleeding off. Don’t read it as, “oversold means it’s time to buy.” 24-hour high 105.88, low 102.66; trading volume about 1.479 billion USDT. Open interest notional is about $818 million. Funding rate is around -0.0026%—longs aren’t paying much.
Supporting cast $XRP : current price about 1.394, -0.69% over 24 hours; breakout line around 1.3731, still roughly 0.021 above it. J is about 49.52, hovering near neutral. Volume is about 784 million; OI notional about $430 million. Among mainstream altcoins both are falling—one breaks the line and releases pressure, the other still hangs above the line. Same direction ≠ same structure.
Fund ledger (SoSoValue/Chaincatcher, 2026-09-07): Last week’s SOL spot ETF net inflow was about $6.1751 million, counting as the consecutive tenth week of net inflows. But it’s still thin—GSOL weekly inflow is about $4.3765 million, MSOL about $1.3575 million, while the largest basket, BSOL, actually had a weekly outflow of about $0.7355 million. Category AUM is about $1.41 billion, with cumulative net inflows around $1.35 billion. Ten straight weeks of inflows are a fact; the inference that “inflows continuously means the chart can’t break the line” doesn’t hold.
Only talk about the next step after it breaks the breakout line. It’s too early to discuss that now.
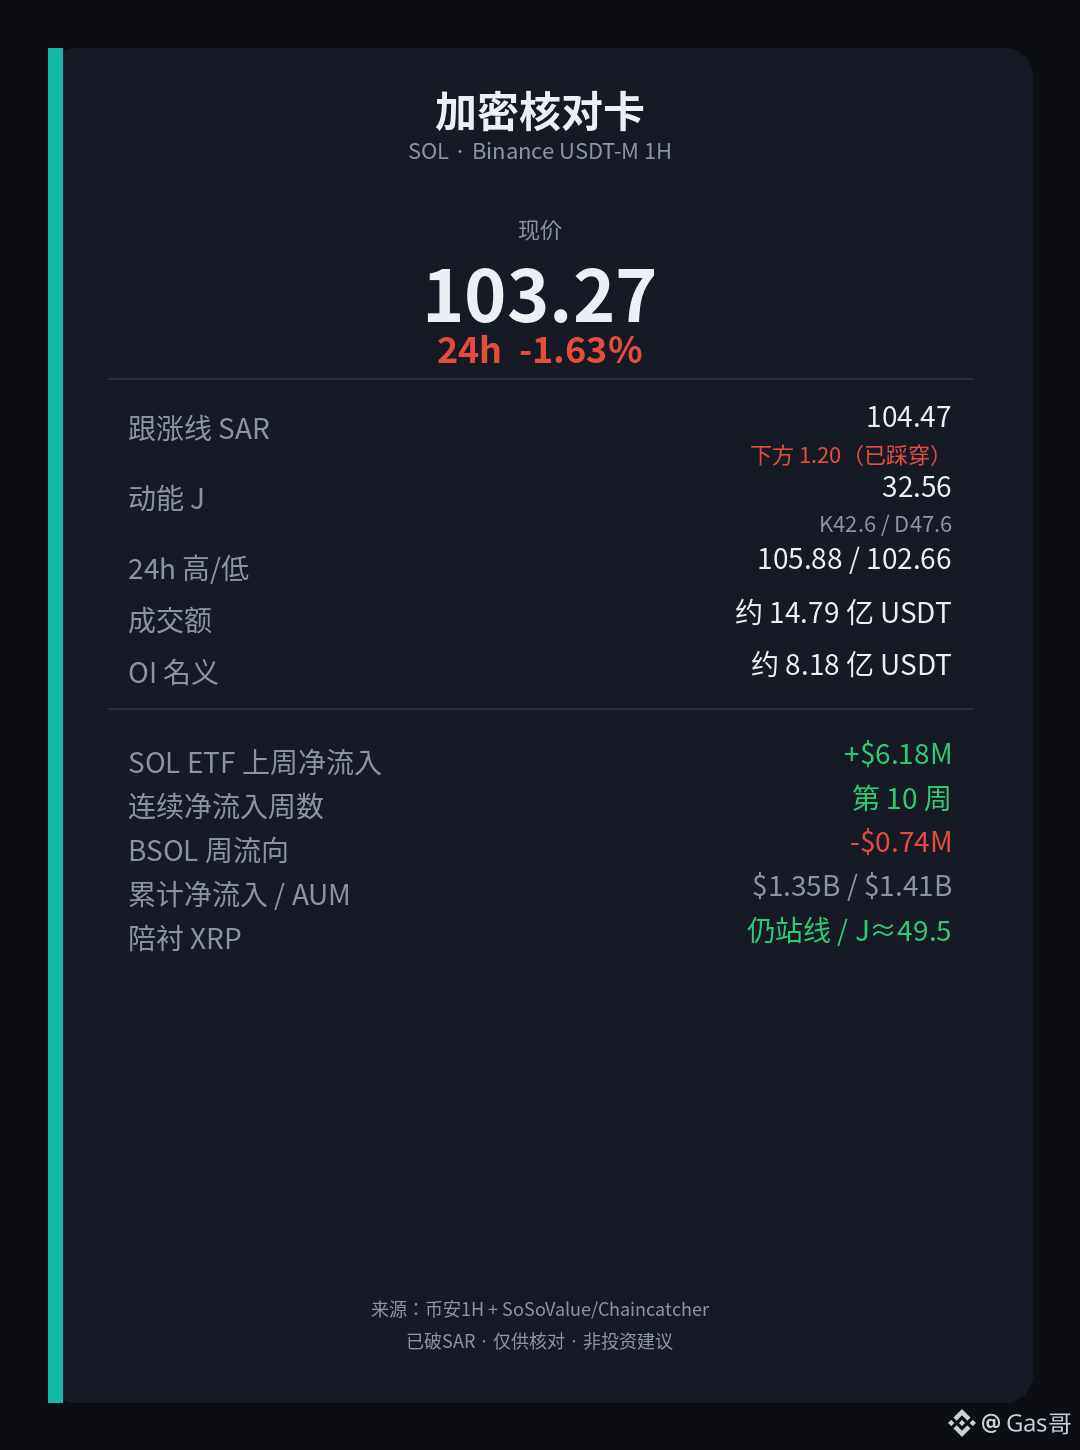
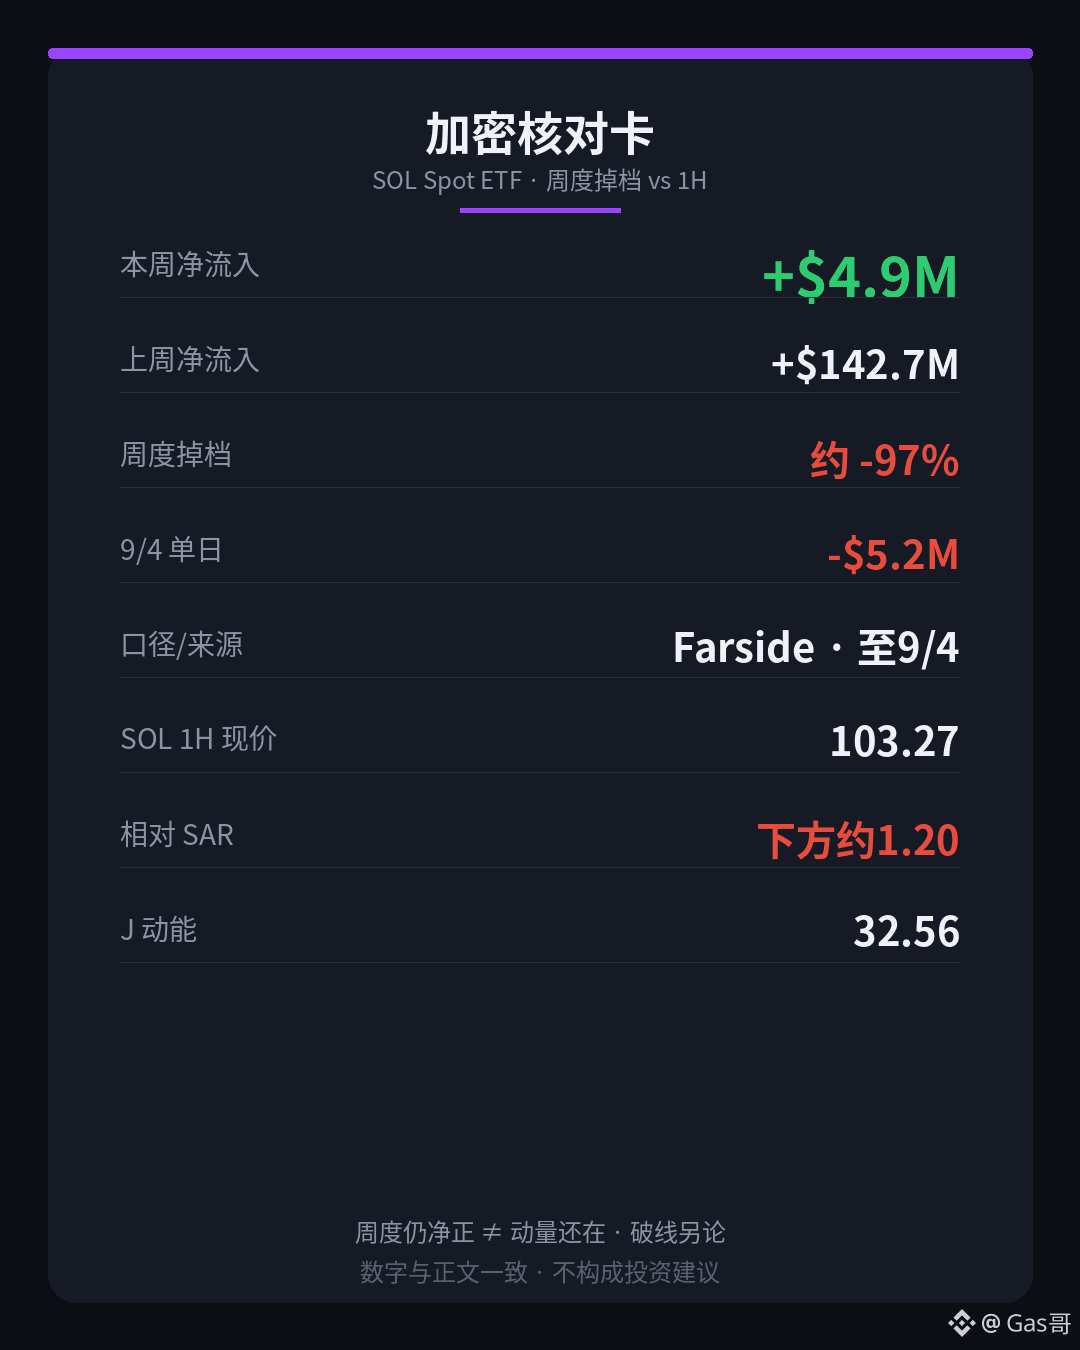
Last week’s U.S. spot SOL ETF saw net inflows of approximately $142.7 million. After the just-finished week (8/31–9/4), the total from the table is only about $4.9 million—down roughly 97% on a weekly basis. The ledger is still positive, but it’s been nearly emptied out; the 1-hour on-chart price has already fallen below the breakout line.
Main contract $SOL : Binance perpetual spot price is about 103.27, down about -1.63% over 24 hours, with turnover around 1.48 billion USDT. The follow-line (SAR) is about 104.47, and price is pressing about 1.20 below it—so as a short-term strength/weakness reference, this is leaning toward the weaker side. The momentum value J is about 32.56 (K42.60 / D47.62). It’s cooling off from a somewhat hot state, but it hasn’t cooled into extreme oversold yet. 24-hour high 105.88, low 102.66. Over the last two days, the high is about 107.36, and the rebound/fill from the top segment hasn’t been completed. Open interest is about 7.924 million contracts; converted by the mark price that’s roughly $818 million in notional. Funding rate is about -0.0026%, slightly bearish but not extreme. Breaking the line is a fact; the weekly drop is also a fact—don’t automatically decide to “buy just because the ETF is still seeing net inflows.”
News/flows that can be verified: Farside Investors (as of 2026-09-04)—For the prior week (8/24–8/28), U.S. spot SOL ETFs had net inflows of about +$142.7 million. This week (8/31–9/4) was about +$4.9 million, a weekly drop of about 97%. On 9/4 alone, it was about -$5.2 million. On the same day, BTC ETFs were about +$174.6 million and ETH ETFs about +$25.9 million—these three channels are not moving in sync. The non-zero net inflows are mainly concentrated in BSOL / FSOL / GSOL, while the other products have zero net flow for multiple days. Still net positive on a weekly basis only means it hasn’t flipped into net outflows yet; the 1-hour line break only indicates the short-term position.
Once you see it standing back above SAR, then talk. If you don’t, just hold it for now.
Main contract $SOL : Binance perpetual spot price is about 103.27, down about -1.63% over 24 hours, with turnover around 1.48 billion USDT. The follow-line (SAR) is about 104.47, and price is pressing about 1.20 below it—so as a short-term strength/weakness reference, this is leaning toward the weaker side. The momentum value J is about 32.56 (K42.60 / D47.62). It’s cooling off from a somewhat hot state, but it hasn’t cooled into extreme oversold yet. 24-hour high 105.88, low 102.66. Over the last two days, the high is about 107.36, and the rebound/fill from the top segment hasn’t been completed. Open interest is about 7.924 million contracts; converted by the mark price that’s roughly $818 million in notional. Funding rate is about -0.0026%, slightly bearish but not extreme. Breaking the line is a fact; the weekly drop is also a fact—don’t automatically decide to “buy just because the ETF is still seeing net inflows.”
News/flows that can be verified: Farside Investors (as of 2026-09-04)—For the prior week (8/24–8/28), U.S. spot SOL ETFs had net inflows of about +$142.7 million. This week (8/31–9/4) was about +$4.9 million, a weekly drop of about 97%. On 9/4 alone, it was about -$5.2 million. On the same day, BTC ETFs were about +$174.6 million and ETH ETFs about +$25.9 million—these three channels are not moving in sync. The non-zero net inflows are mainly concentrated in BSOL / FSOL / GSOL, while the other products have zero net flow for multiple days. Still net positive on a weekly basis only means it hasn’t flipped into net outflows yet; the 1-hour line break only indicates the short-term position.
Once you see it standing back above SAR, then talk. If you don’t, just hold it for now.
Don’t just look at the directional cue in the sentence “ETH has returned above the follow-up line.” First, check the thickness of the order book and whether the suppliers line up.
Main headline $ETH : Binance USD-margined perpetual current price is about 2489.35, around -1.56% over the past 24h (green down), with trading volume roughly 6.20 billion USDT. The follow-up line (SAR) is about 2464.62; price has just moved back above it by roughly 24.73—last hour it was still below that level. This is a re-attach, not something that’s been holding there all along. Momentum J is about 68.19 (K66.63/D65.85). It’s cooled a bit from the earlier wave where J was more intense (around 88), but it’s still fairly hot—don’t read it as “cooling completed.” 24h high 2529.02, low 2464.62, and the low point is right up against this follow-up line. Open interest is about 2.31 million contracts, notional roughly 5.75 billion USD; funding rate is about 0.0038%.
Backdrop $SOL : current price about 103.56, -3.04% over the past 24h; follow-up line about 102.78, around 0.78 above it. J is about 60.62. Volume about 1.48 billion; OI notional about 816 million; rate slightly negative. $BNB : current price about 739.95, -1.97% over the past 24h; follow-up line about 733.81, roughly 6.14 above it. J about 70.89 is a bit hotter. Volume about 312 million; OI notional about 471 million. All three majors are trading above their lines, but the 24h drawdowns and the J “heat” aren’t aligned—same direction doesn’t mean the same thickness.
Check the news/funding side if you can (after the US Eastern Labor Day holiday there hasn’t been an update trading-day ledger; the most recently verifiable is the 9/4 close): SoSoValue/Chaincatcher—last week Ethereum spot ETF net inflows were about $218 million, with net inflows for three straight weeks. ETHA weekly inflow about $136 million, ETHB about $81.85 million, and ETHE weekly outflow about $36.97 million. Farside’s five-trading-day view (up to 9/4): total market about +$215.3 million; among these, BlackRock’s ETHA+ETHB sum to about +$218.2 million—so they contributed more than the entire market’s net inflow. The other issuers combined are basically bleeding out. Single-day 9/4 net inflow about $26.46 million: ETHA about +$57.79 million, ETHB about +$16.44 million; FETH about -$48.30 million used to hedge/counterbalance. What stands out is that the channel is still open, and the inflows are highly concentrated. With the 1-hour just re-standing above the line and J still hot, it only tells you the short-term structure—not that “weekly inflow = trend has already started” or “coming back above it = you should chase.”
First, figure out whether this is a bounce or a repair—then decide whether to get excited.
Main headline $ETH : Binance USD-margined perpetual current price is about 2489.35, around -1.56% over the past 24h (green down), with trading volume roughly 6.20 billion USDT. The follow-up line (SAR) is about 2464.62; price has just moved back above it by roughly 24.73—last hour it was still below that level. This is a re-attach, not something that’s been holding there all along. Momentum J is about 68.19 (K66.63/D65.85). It’s cooled a bit from the earlier wave where J was more intense (around 88), but it’s still fairly hot—don’t read it as “cooling completed.” 24h high 2529.02, low 2464.62, and the low point is right up against this follow-up line. Open interest is about 2.31 million contracts, notional roughly 5.75 billion USD; funding rate is about 0.0038%.
Backdrop $SOL : current price about 103.56, -3.04% over the past 24h; follow-up line about 102.78, around 0.78 above it. J is about 60.62. Volume about 1.48 billion; OI notional about 816 million; rate slightly negative. $BNB : current price about 739.95, -1.97% over the past 24h; follow-up line about 733.81, roughly 6.14 above it. J about 70.89 is a bit hotter. Volume about 312 million; OI notional about 471 million. All three majors are trading above their lines, but the 24h drawdowns and the J “heat” aren’t aligned—same direction doesn’t mean the same thickness.
Check the news/funding side if you can (after the US Eastern Labor Day holiday there hasn’t been an update trading-day ledger; the most recently verifiable is the 9/4 close): SoSoValue/Chaincatcher—last week Ethereum spot ETF net inflows were about $218 million, with net inflows for three straight weeks. ETHA weekly inflow about $136 million, ETHB about $81.85 million, and ETHE weekly outflow about $36.97 million. Farside’s five-trading-day view (up to 9/4): total market about +$215.3 million; among these, BlackRock’s ETHA+ETHB sum to about +$218.2 million—so they contributed more than the entire market’s net inflow. The other issuers combined are basically bleeding out. Single-day 9/4 net inflow about $26.46 million: ETHA about +$57.79 million, ETHB about +$16.44 million; FETH about -$48.30 million used to hedge/counterbalance. What stands out is that the channel is still open, and the inflows are highly concentrated. With the 1-hour just re-standing above the line and J still hot, it only tells you the short-term structure—not that “weekly inflow = trend has already started” or “coming back above it = you should chase.”
First, figure out whether this is a bounce or a repair—then decide whether to get excited.
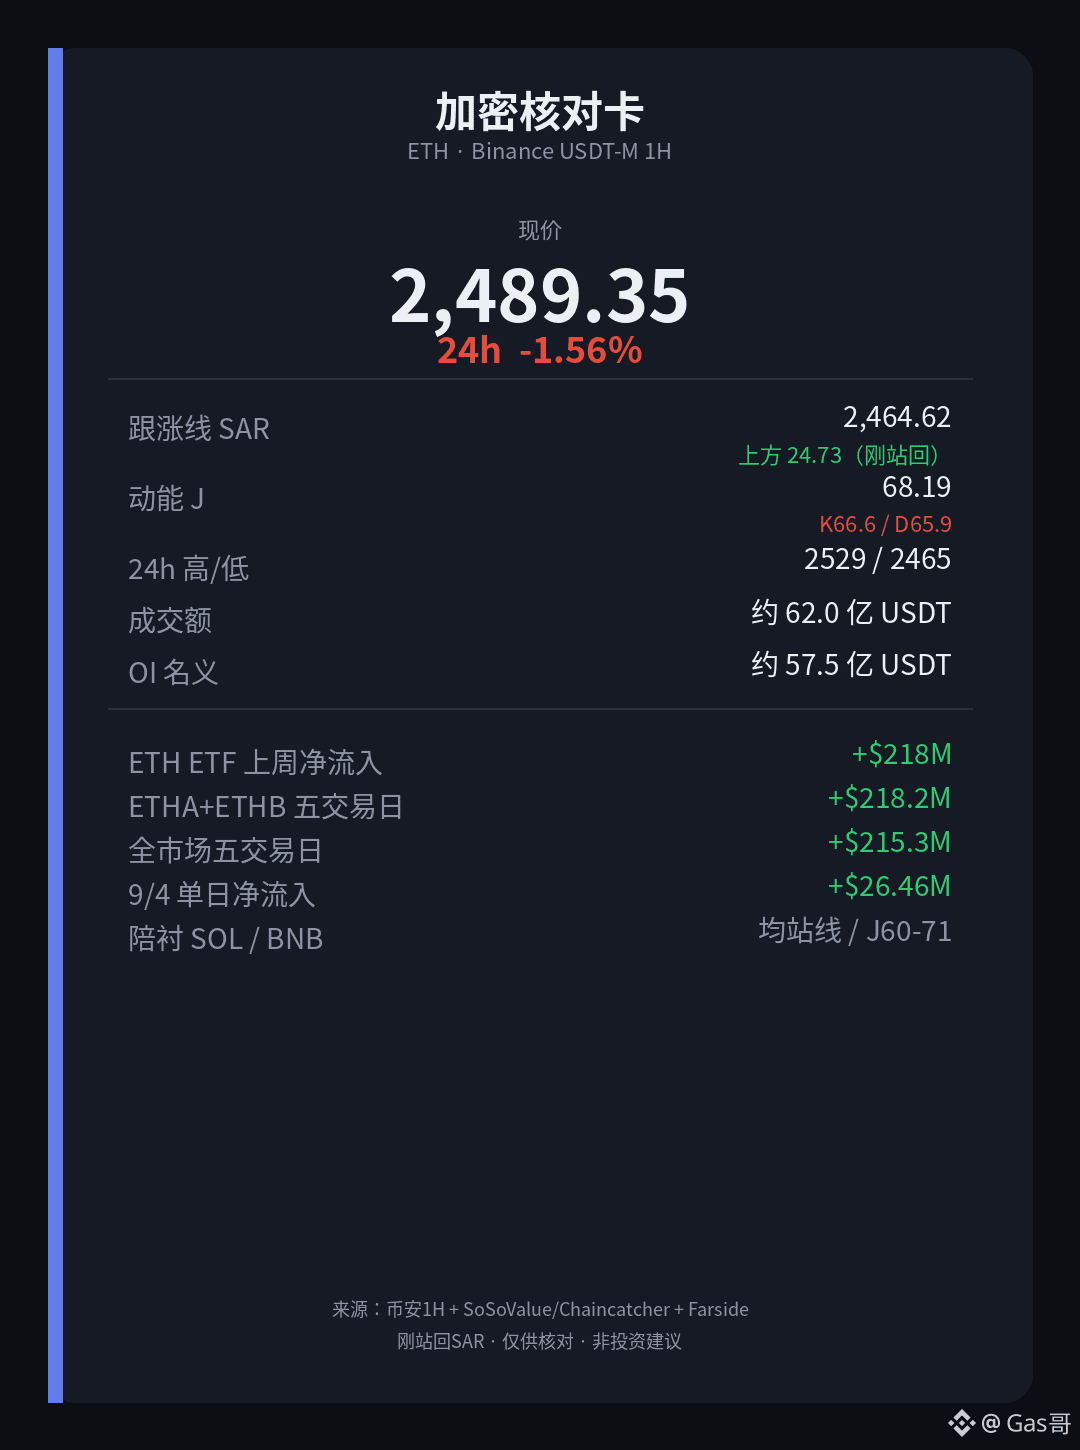
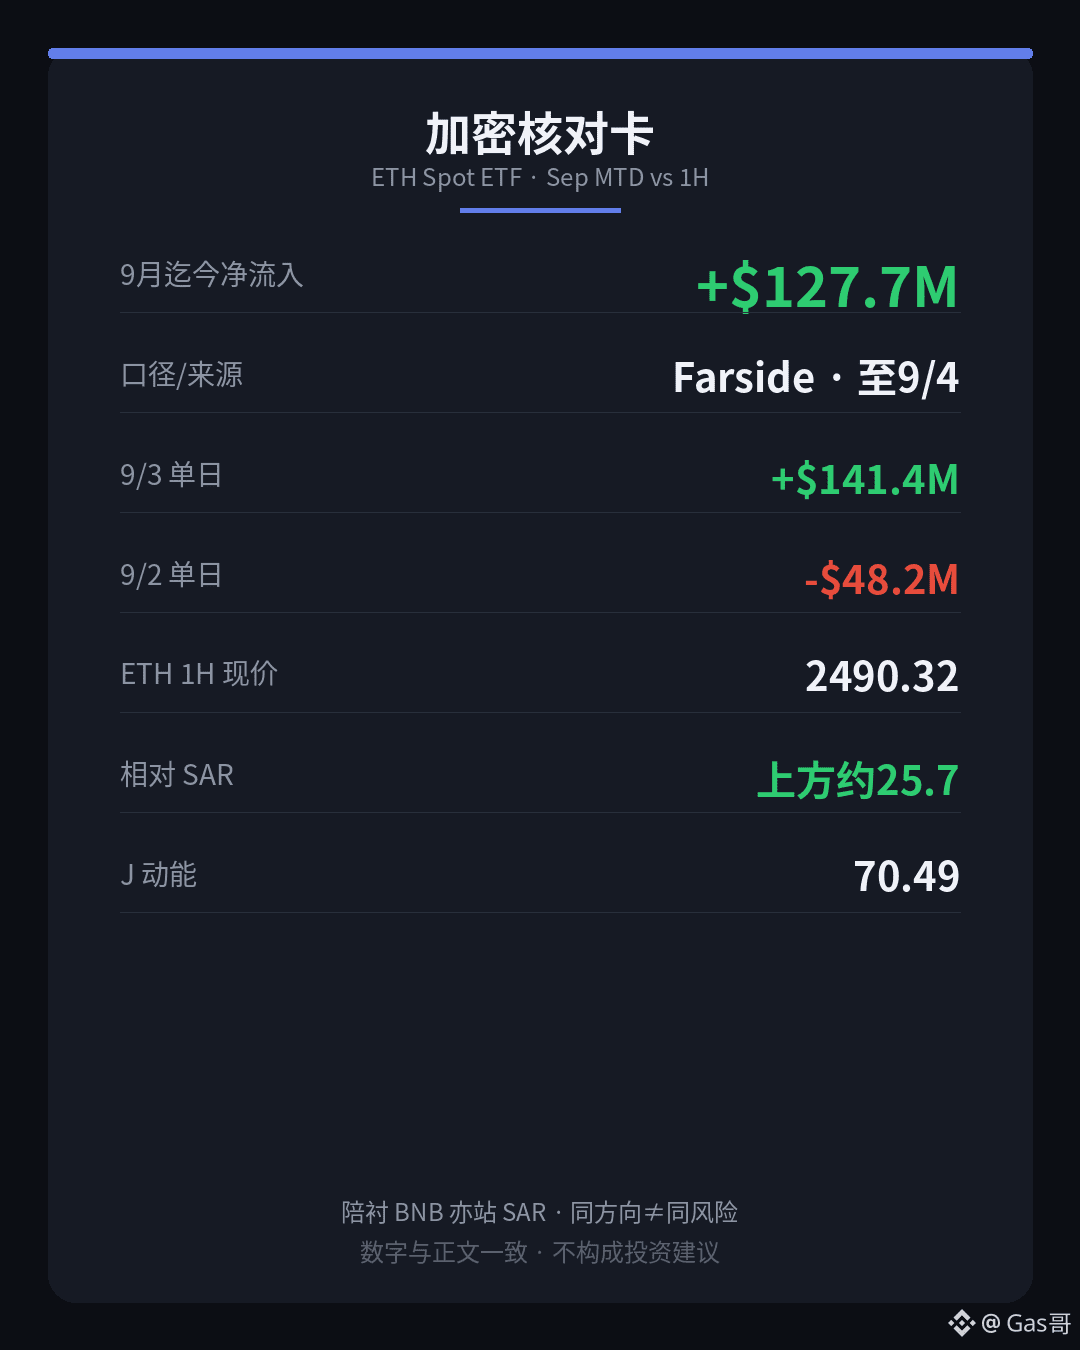
In August, US stock spot ETH ETFs saw net inflows that at one point climbed to roughly $1.76 billion; but through September so far, summed by the table, it’s only about $128 million—clearly the channel has dropped off. Still, on the 1-hour chart, ETH has already reclaimed the follow-up line. Money is getting thinner, but it doesn’t mean the short-term position has changed.
Main contract $ETH : Binance perpetual mark spot price about 2490.32, down about -1.56% over 24 hours, with turnover around 6.20 billion USDT. Follow-up line (SAR) is about 2464.62; price is sitting above it by roughly 25.7—short-term strength/weakness is flipping back to the bullish side. Momentum J is about 70.49 (K67.62 / D66.18), a bit hot, but not like the previous hours when it was pressing the accelerator to the floor. 24-hour high 2529.02, low 2464.62; recent two-day high around 2536, with another slice still capping overhead. Open interest is about 2.311 million contracts; nominal notional using the mark price is about $5.76 billion; funding rate is about +0.0038%. The standing of the lines is a fact, and the channel drop-off is also a fact—don’t automatically weld the idea that “reclaiming SAR means you should chase.”
Side-by-side comparison: $BNB current price about 740.04, down about -1.97% over 24 hours, with turnover about 312 million. Follow-up line about 733.81; price is above it by about 6.23. J is about 71.82 (K64.93 / D61.49). Both have their lines holding, and both J readings are relatively hot—being in the same direction doesn’t mean the same risk; position thickness and volatility elasticity get mixed together if you read them as one.
News/Funds that can be verified: Farside Investors (as of trading day 2026-09-04)—US spot ETH ETF net inflows in September so far are about +$127.7 million (4 trading days: 3 up, 1 out). Largest single day 9/3 about +$141.4 million, 9/4 about +$25.9 million; 9/2 was about -$48.2 million, 9/1 about +$8.6 million. Public summaries (SoSoValue 기준) say August’s full-month net inflows were about $1.76 billion. Monthly thickness is shown in the table; the 1-hour line holding only indicates the short-term location.
Same direction doesn’t equal the same risk—don’t mix this layer up.
Main contract $ETH : Binance perpetual mark spot price about 2490.32, down about -1.56% over 24 hours, with turnover around 6.20 billion USDT. Follow-up line (SAR) is about 2464.62; price is sitting above it by roughly 25.7—short-term strength/weakness is flipping back to the bullish side. Momentum J is about 70.49 (K67.62 / D66.18), a bit hot, but not like the previous hours when it was pressing the accelerator to the floor. 24-hour high 2529.02, low 2464.62; recent two-day high around 2536, with another slice still capping overhead. Open interest is about 2.311 million contracts; nominal notional using the mark price is about $5.76 billion; funding rate is about +0.0038%. The standing of the lines is a fact, and the channel drop-off is also a fact—don’t automatically weld the idea that “reclaiming SAR means you should chase.”
Side-by-side comparison: $BNB current price about 740.04, down about -1.97% over 24 hours, with turnover about 312 million. Follow-up line about 733.81; price is above it by about 6.23. J is about 71.82 (K64.93 / D61.49). Both have their lines holding, and both J readings are relatively hot—being in the same direction doesn’t mean the same risk; position thickness and volatility elasticity get mixed together if you read them as one.
News/Funds that can be verified: Farside Investors (as of trading day 2026-09-04)—US spot ETH ETF net inflows in September so far are about +$127.7 million (4 trading days: 3 up, 1 out). Largest single day 9/3 about +$141.4 million, 9/4 about +$25.9 million; 9/2 was about -$48.2 million, 9/1 about +$8.6 million. Public summaries (SoSoValue 기준) say August’s full-month net inflows were about $1.76 billion. Monthly thickness is shown in the table; the 1-hour line holding only indicates the short-term location.
Same direction doesn’t equal the same risk—don’t mix this layer up.
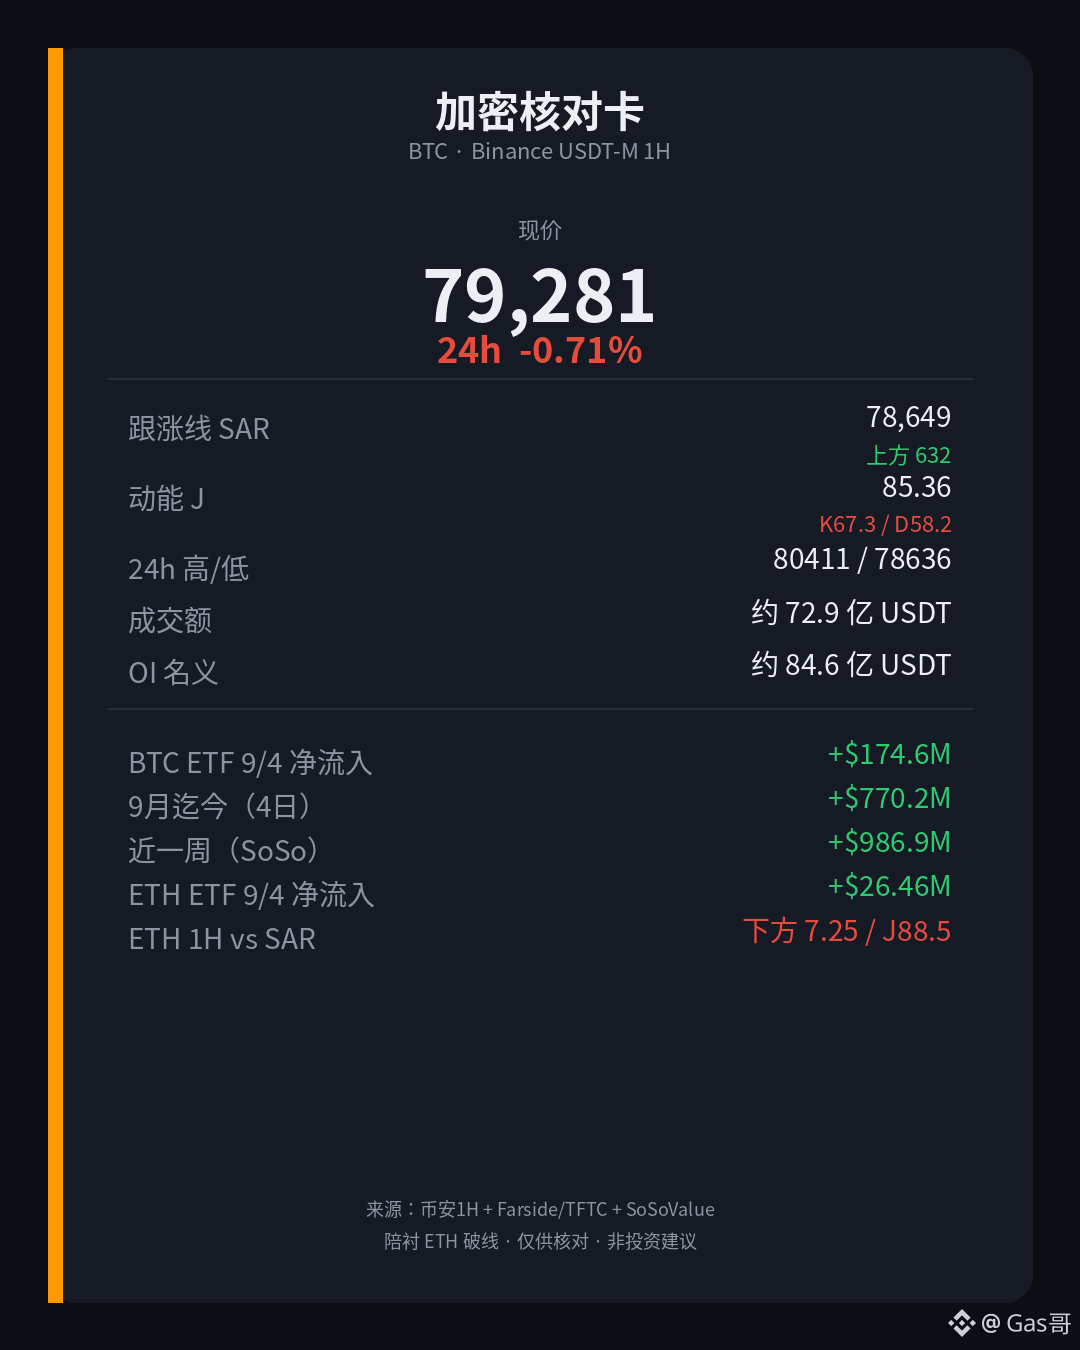
On the ledger, US stock spot Bitcoin ETFs are still pulling in money; what’s noisier on the 1-hour chart is that the momentum is already running hot—don’t weld these two things into a single takeaway: “institutional buying means you should chase it short-term.”
Main chart $BTC : Binance USD-margined perpetual spot price around 79,281, down about -0.71% over 24 hours (green/red down). Trading volume is roughly 7.29 billion USDT. The follow-up line (SAR) is around 78,649; price is still about 632 above it—short-term support hasn’t broken, but the “buffer” situation is real. The direction is not a slogan. The J value for momentum is about 85.36 (K67.27/D58.22), too hot. It’s like you’ve stomped the accelerator. Whether it’s at the line is a fact, and whether J is hot is also a fact—don’t automatically translate this into “ETF weekly inflows have already been cashed out into this candle” or “you should chase it.” 24-hour high 80,410.8, low 78,636. Over the past two days, the high is about 80,536, and there’s still a bit of overhead pressure above. Open interest is about 106.7k contracts; notional by mark price is about $8.46 billion. Funding rate is about 0.0071%.
Side chart $ETH : Current price about 2,498.54, down about -0.09% over 24 hours. Follow-up line is around 2,505.79; it’s already dropped to about 7.25 below it—short-term support has been broken through (on the line). J is about 88.48, even hotter. Volume is about 6.39 billion USDT, and OI notional is about $5.74 billion. Same-segment contracts: BTC is still holding lines while ETH broke first—the “script thickness” isn’t shared.
News/funding-side data can be cross-checked (after US Eastern Labor Day, there’s no updated trading-day flow yet; the latest checkable record is still the 9/4 close book): Farside/TFTC table—US spot Bitcoin ETF 9/4 net inflow about $174.6 million (IBIT about +117.4 million, FBTC about +57.2 million). From 9/1 to 9/4, net inflows for the month-to-date about $770.2 million. SoSoValue weekly figures (as of tracking through 9/5) net inflows about $986.9 million, with the last three weeks totaling about $3.8 billion. For Ethereum spot ETFs on the same day (SoSoValue), net inflow about $26.46 million: ETHA about +57.79 million, ETHB about +16.44 million; FETH about outflow $48.30 million as an offset. The takeaway from the “results sheet” is that the institutional channel is still bringing in funds. With the 1-hour J too hot and ETH breaking the line, all it can说明 is short-term temperature and structure—it can’t be welded into “weekly inflows = the trend has already started” or “breaking the line = the ETF story is over.”
First, keep your focus on whether the price is still hanging above the follow-up line—don’t rush to conclusions.
Main chart $BTC : Binance USD-margined perpetual spot price around 79,281, down about -0.71% over 24 hours (green/red down). Trading volume is roughly 7.29 billion USDT. The follow-up line (SAR) is around 78,649; price is still about 632 above it—short-term support hasn’t broken, but the “buffer” situation is real. The direction is not a slogan. The J value for momentum is about 85.36 (K67.27/D58.22), too hot. It’s like you’ve stomped the accelerator. Whether it’s at the line is a fact, and whether J is hot is also a fact—don’t automatically translate this into “ETF weekly inflows have already been cashed out into this candle” or “you should chase it.” 24-hour high 80,410.8, low 78,636. Over the past two days, the high is about 80,536, and there’s still a bit of overhead pressure above. Open interest is about 106.7k contracts; notional by mark price is about $8.46 billion. Funding rate is about 0.0071%.
Side chart $ETH : Current price about 2,498.54, down about -0.09% over 24 hours. Follow-up line is around 2,505.79; it’s already dropped to about 7.25 below it—short-term support has been broken through (on the line). J is about 88.48, even hotter. Volume is about 6.39 billion USDT, and OI notional is about $5.74 billion. Same-segment contracts: BTC is still holding lines while ETH broke first—the “script thickness” isn’t shared.
News/funding-side data can be cross-checked (after US Eastern Labor Day, there’s no updated trading-day flow yet; the latest checkable record is still the 9/4 close book): Farside/TFTC table—US spot Bitcoin ETF 9/4 net inflow about $174.6 million (IBIT about +117.4 million, FBTC about +57.2 million). From 9/1 to 9/4, net inflows for the month-to-date about $770.2 million. SoSoValue weekly figures (as of tracking through 9/5) net inflows about $986.9 million, with the last three weeks totaling about $3.8 billion. For Ethereum spot ETFs on the same day (SoSoValue), net inflow about $26.46 million: ETHA about +57.79 million, ETHB about +16.44 million; FETH about outflow $48.30 million as an offset. The takeaway from the “results sheet” is that the institutional channel is still bringing in funds. With the 1-hour J too hot and ETH breaking the line, all it can说明 is short-term temperature and structure—it can’t be welded into “weekly inflows = the trend has already started” or “breaking the line = the ETF story is over.”
First, keep your focus on whether the price is still hanging above the follow-up line—don’t rush to conclusions.
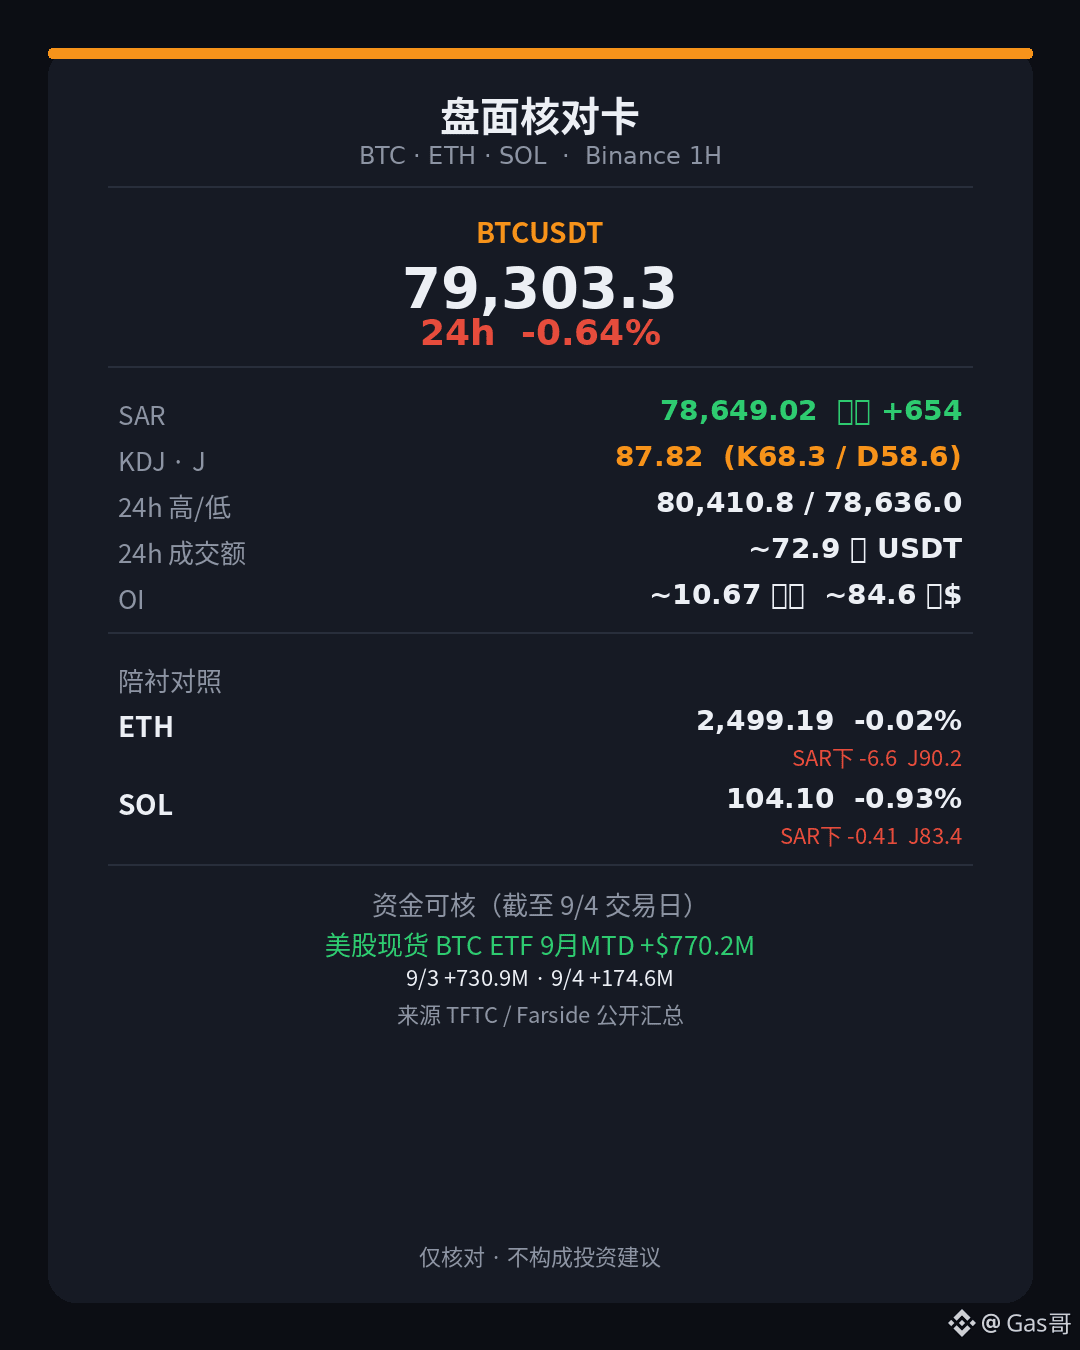
In September, the net inflow into the U.S. spot Bitcoin ETFs so far is already about $770 million. But over the past hour, BTC, ETH, and SOL on the chart are not moving in lockstep—money is flowing through the channel, but that doesn’t mean the three coins are standing on the exact same support.
Main contract $BTC : Binance perpetual mark price is about 79,303.3, around -0.64% over 24 hours, with trading volume roughly $7.29 billion USDT. The trailing stop line (SAR) is about 78,649, and price is still sitting above it by about 654—so for short-term strength/weakness reference, there hasn’t been a flip to the downside. The momentum J value is about 87.82 (K 68.32 / D 58.57), fairly hot—like the gas pedal is pressed hard, yet the price is giving some of it back. 24-hour high 80,410.8, low 78,636; the past two days’ high is about 80,536, and there’s still a bit of overhead pressure. Open interest is about 106,700 contracts; based on the mark price, the notional is roughly $8.46 billion. Funding rate is about +0.007%. The line is a fact, and the hot J is also a fact—don’t automatically weld the idea into “since the ETF is absorbing, you should chase.”
Supporting comparison: $ETH current price is about 2,499.19, nearly flat over 24 hours (about -0.02%), with trading volume about $6.40 billion—liquidity isn’t thin. The trailing stop line is about 2,505.79, and price has already dropped below it by about 6.6; J is about 90.16, even hotter. Now look at $SOL : current price about 104.10, about -0.93% over 24 hours, trading volume about $1.54 billion; SAR about 104.51, price is below it by about 0.41, and J is about 83.36. One line is grinding, two break lines are still hot—same narrative doesn’t mean the same structure.
News/capital flow you can verify: publicly compiled (TFTC citing Farside / SoSoValue definitions; as of the 2026-09-04 trading day)—U.S. spot BTC ETF net inflow for September-to-date is about +$770.2 million (4 trading days: 3 up, 1 out); the biggest single day on 9/3 was about +$730.9 million, and on 9/4 about +$174.6 million (IBIT about +$117.4 million, FBTC about +$57.2 million); on 9/1 it was around -$236.5 million. The channel thickness is shown in the table; the 1-hour line break divergence only indicates the short-term position.
Hand the time to the next K for confirmation—waiting for proof is more useful than guessing the endpoint.
Main contract $BTC : Binance perpetual mark price is about 79,303.3, around -0.64% over 24 hours, with trading volume roughly $7.29 billion USDT. The trailing stop line (SAR) is about 78,649, and price is still sitting above it by about 654—so for short-term strength/weakness reference, there hasn’t been a flip to the downside. The momentum J value is about 87.82 (K 68.32 / D 58.57), fairly hot—like the gas pedal is pressed hard, yet the price is giving some of it back. 24-hour high 80,410.8, low 78,636; the past two days’ high is about 80,536, and there’s still a bit of overhead pressure. Open interest is about 106,700 contracts; based on the mark price, the notional is roughly $8.46 billion. Funding rate is about +0.007%. The line is a fact, and the hot J is also a fact—don’t automatically weld the idea into “since the ETF is absorbing, you should chase.”
Supporting comparison: $ETH current price is about 2,499.19, nearly flat over 24 hours (about -0.02%), with trading volume about $6.40 billion—liquidity isn’t thin. The trailing stop line is about 2,505.79, and price has already dropped below it by about 6.6; J is about 90.16, even hotter. Now look at $SOL : current price about 104.10, about -0.93% over 24 hours, trading volume about $1.54 billion; SAR about 104.51, price is below it by about 0.41, and J is about 83.36. One line is grinding, two break lines are still hot—same narrative doesn’t mean the same structure.
News/capital flow you can verify: publicly compiled (TFTC citing Farside / SoSoValue definitions; as of the 2026-09-04 trading day)—U.S. spot BTC ETF net inflow for September-to-date is about +$770.2 million (4 trading days: 3 up, 1 out); the biggest single day on 9/3 was about +$730.9 million, and on 9/4 about +$174.6 million (IBIT about +$117.4 million, FBTC about +$57.2 million); on 9/1 it was around -$236.5 million. The channel thickness is shown in the table; the 1-hour line break divergence only indicates the short-term position.
Hand the time to the next K for confirmation—waiting for proof is more useful than guessing the endpoint.
See translation
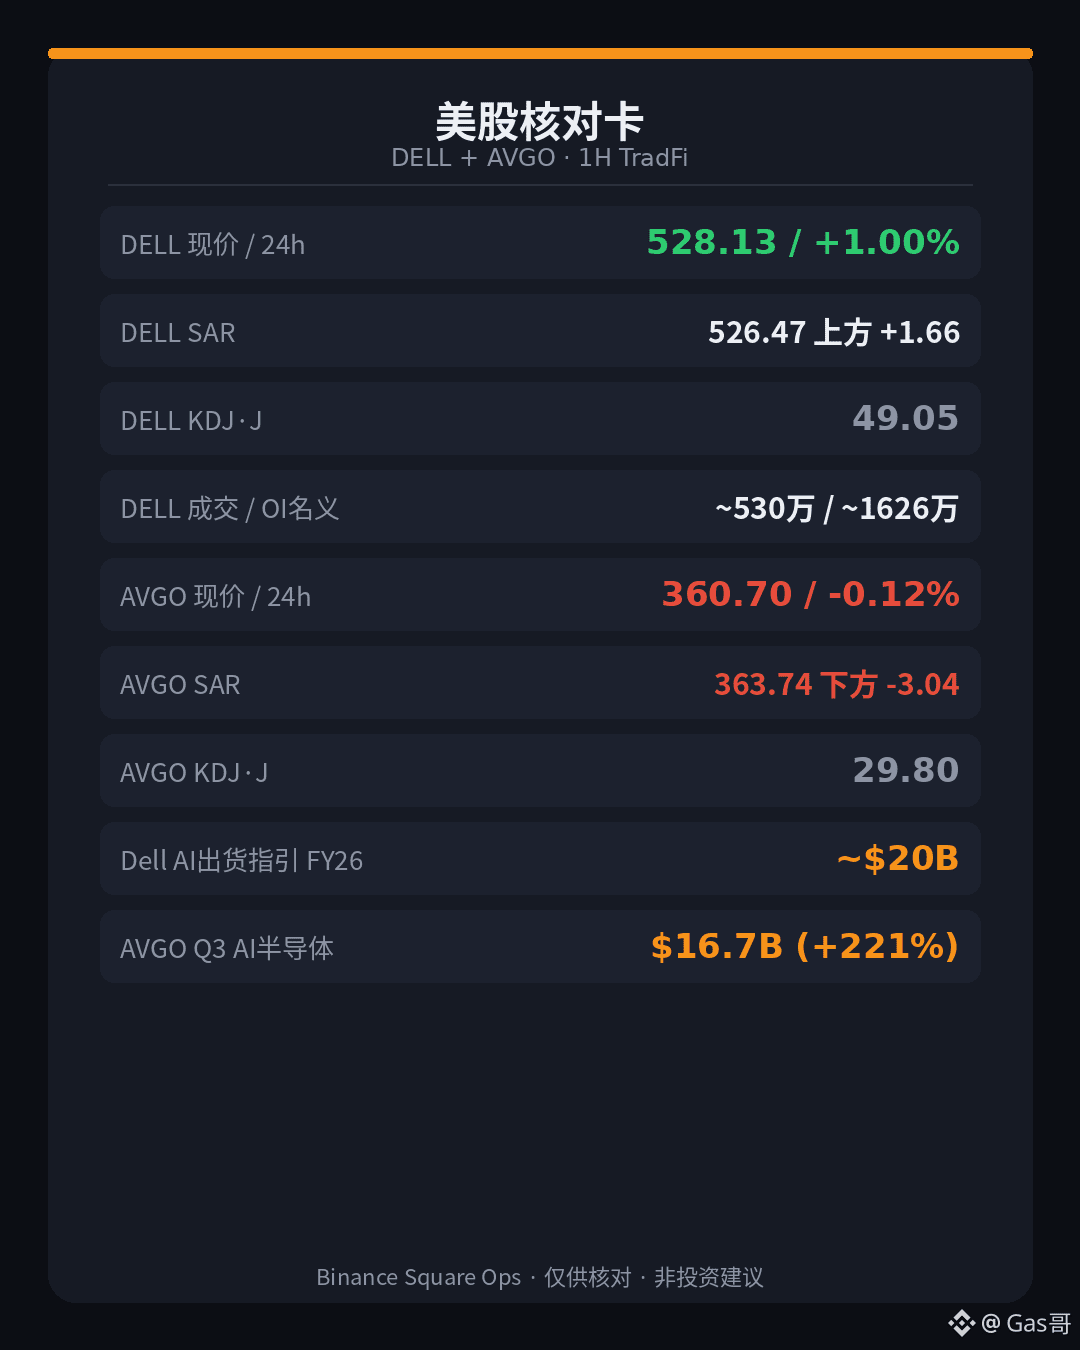
AI硬件上下游账本都在刷纪录,夜盘却一个还压在跟涨线上、一个已经掉下去——别把供应链当成同一根K。
主标 $DELL :币安 TradFi 永续现价约 528.13,24 小时约 +1.00%,成交额大约 530 万 USDT。跟涨线(SAR)约 526.47,价还在它上面大约 1.66——短线强弱参考没翻空。动能 J 值约 49.05(K45.64 / D43.93),不热不冰,像油门踩到一半在磨。24 小时高 531.73、低 520.25;未平仓约 3.08 万张,按标记价折名义大约 1626 万美元;资金费率约 0。站线是事实,涨幅也不算炸,别自动焊成「AI服务器指引上调就该追」。
陪衬对照:$AVGO 现价约 360.70,24 小时约 -0.12%,成交约 965 万——流动性比 DELL 厚一截。跟涨线约 363.74,价已经掉到下面大约 3.04;J 约 29.80,更凉。一个站线磨、一个破线冷——同叙事≠同结构。
新闻/资金可核:Dell 官方投资者关系(2025-08-28)——Q2 FY2026 营收约 298 亿(同比 +19%);ISG 约 168 亿(+44%);Servers & Networking 约 129 亿(+69%);上半年 AI 解决方案出货约 100 亿,已超过整个 FY25;全年 AI 服务器出货指引上调至约 200 亿;全年营收指引 1050–1090 亿(中值约 1070 亿,+12%)。Broadcom 官方 / PR Newswire(2026-09-02)——Q3 FY2026 营收约 296 亿(+86%);AI 半导体约 167 亿(同比 +221%,环比 +54%);自由现金流约 137 亿;Q4 营收指引约 348 亿(+93%),其中 AI 半导体指引约 217 亿(+236%)。成绩单讲厚度;1 小时站破线分裂,只说明短线位置。
涨跌都允许,关键是别把一次波动读成趋势反转。
主标 $DELL :币安 TradFi 永续现价约 528.13,24 小时约 +1.00%,成交额大约 530 万 USDT。跟涨线(SAR)约 526.47,价还在它上面大约 1.66——短线强弱参考没翻空。动能 J 值约 49.05(K45.64 / D43.93),不热不冰,像油门踩到一半在磨。24 小时高 531.73、低 520.25;未平仓约 3.08 万张,按标记价折名义大约 1626 万美元;资金费率约 0。站线是事实,涨幅也不算炸,别自动焊成「AI服务器指引上调就该追」。
陪衬对照:$AVGO 现价约 360.70,24 小时约 -0.12%,成交约 965 万——流动性比 DELL 厚一截。跟涨线约 363.74,价已经掉到下面大约 3.04;J 约 29.80,更凉。一个站线磨、一个破线冷——同叙事≠同结构。
新闻/资金可核:Dell 官方投资者关系(2025-08-28)——Q2 FY2026 营收约 298 亿(同比 +19%);ISG 约 168 亿(+44%);Servers & Networking 约 129 亿(+69%);上半年 AI 解决方案出货约 100 亿,已超过整个 FY25;全年 AI 服务器出货指引上调至约 200 亿;全年营收指引 1050–1090 亿(中值约 1070 亿,+12%)。Broadcom 官方 / PR Newswire(2026-09-02)——Q3 FY2026 营收约 296 亿(+86%);AI 半导体约 167 亿(同比 +221%,环比 +54%);自由现金流约 137 亿;Q4 营收指引约 348 亿(+93%),其中 AI 半导体指引约 217 亿(+236%)。成绩单讲厚度;1 小时站破线分裂,只说明短线位置。
涨跌都允许,关键是别把一次波动读成趋势反转。
See translation
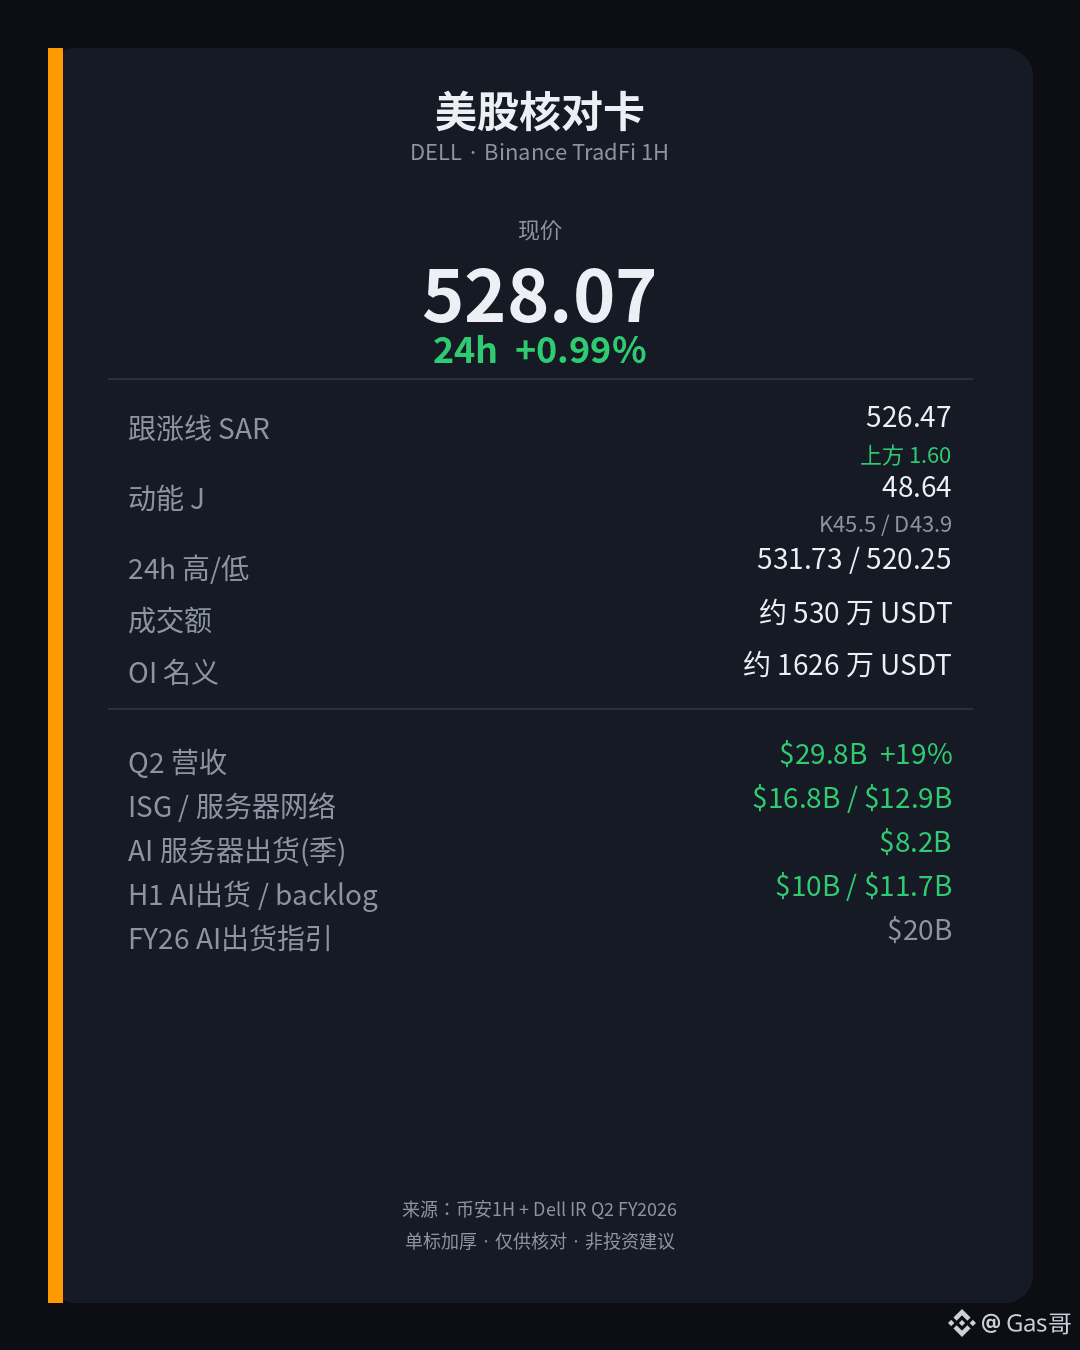
先别急着把「AI服务器出货纪录」直接读成夜盘该追:先把官方数字和1小时位置拆开看。
主标 $DELL (单标加厚):币安TradFi永续现价约528.07,24小时约+0.99%(红涨),成交额大约530万USDT。跟涨线(SAR)约526.47,价在它上面大约1.60——比上轮当陪衬时(约524、上方约3)更贴线了,短线还挂着,但缓冲变薄。动能J值约48.64(K45.47/D43.88),中性,不像油门踩穿,也不像超卖见底;站线是事实,J不烫也是事实,别自动翻译成「AI出货指引已经兑现在K线上」或「该追了」。24小时高531.73、低520.25;未平仓约3.08万张,按标记价折名义大约1626万美元;资金费率约0。
新闻/资金侧可核:Dell Technologies官方IR(二季度财报,营收约298亿美元、同比约+19%;经营利润约18亿美元、同比约+27%,non-GAAP经营利润约23亿美元、约+10%;稀释EPS约1.70美元、约+38%,non-GAAP稀释EPS约2.32美元、约+19%;经营现金流约25亿美元)。Infrastructure Solutions Group(ISG)营收约168亿美元(约+44%);Servers & Networking约129亿美元(约+69%)。AI侧:当季AI服务器出货约82亿美元创纪录,上半年合计约100亿美元(已超过整个FY25出货),季度末AI backlog约117亿美元;公司把FY26 AI服务器出货指引上调至约200亿美元;全年营收指引约1050亿至1090亿美元(中枢约1070亿)。成绩单亮的是AI出货与ISG;夜盘1小时贴线+J中性,只能说明短线位置,不能焊成「出货指引=趋势已启动」或「站线=可以加仓」。
今天这篇只记数字,不做英雄叙事。
主标 $DELL (单标加厚):币安TradFi永续现价约528.07,24小时约+0.99%(红涨),成交额大约530万USDT。跟涨线(SAR)约526.47,价在它上面大约1.60——比上轮当陪衬时(约524、上方约3)更贴线了,短线还挂着,但缓冲变薄。动能J值约48.64(K45.47/D43.88),中性,不像油门踩穿,也不像超卖见底;站线是事实,J不烫也是事实,别自动翻译成「AI出货指引已经兑现在K线上」或「该追了」。24小时高531.73、低520.25;未平仓约3.08万张,按标记价折名义大约1626万美元;资金费率约0。
新闻/资金侧可核:Dell Technologies官方IR(二季度财报,营收约298亿美元、同比约+19%;经营利润约18亿美元、同比约+27%,non-GAAP经营利润约23亿美元、约+10%;稀释EPS约1.70美元、约+38%,non-GAAP稀释EPS约2.32美元、约+19%;经营现金流约25亿美元)。Infrastructure Solutions Group(ISG)营收约168亿美元(约+44%);Servers & Networking约129亿美元(约+69%)。AI侧:当季AI服务器出货约82亿美元创纪录,上半年合计约100亿美元(已超过整个FY25出货),季度末AI backlog约117亿美元;公司把FY26 AI服务器出货指引上调至约200亿美元;全年营收指引约1050亿至1090亿美元(中枢约1070亿)。成绩单亮的是AI出货与ISG;夜盘1小时贴线+J中性,只能说明短线位置,不能焊成「出货指引=趋势已启动」或「站线=可以加仓」。
今天这篇只记数字,不做英雄叙事。
See translation
表面上是 AWS 同比加速的胜利;骨子里是 AI 基建把自由现金流打成负数,外加净利里掺进了 Anthropic 投资收益——三件事别焊成一句「全面爆发」。
主标 $AMZN :币安TradFi永续现价约258.24,24小时约-0.33%(绿跌),成交额大约540万USDT。跟涨线(SAR)约257.35,价在它上面大约0.89——短线还挂着,但离线很近,像贴着走。动能J值58.93(K56.68/D55.55),中性略偏热,不像油门踩穿,也不像超卖见底;站线是事实,J不烫也是事实,别自动翻译成「AWS故事已经兑现完」或「该追了」。24小时高259.37、低257.09;未平仓约4.63万张,按标记价折名义大约1196万美元;资金费率约0。凌晨当陪衬时(约257.84、微站线、J约61.66),结构没翻盘,只是继续贴线磨。
同段美股名单里顺手看两眼陪衬:$DELL 现价约524.20,24小时约+0.29%,跟涨线约521.12、上方约3.08,J约47.75,中性;成交约440万USDT,OI名义约1603万。$TSLA 现价约355.41,24小时约-0.01%,跟涨线约354.35、上方约1.06,J约46.05;成交约2458万USDT更热闹,OI名义约5824万。三个都在线上方,但主标离线最近、J也不烫——同属夜盘站线,剧本厚度并不共用。
新闻/资金侧可核:Amazon官方IR(2026-07-30发布,对应截至2026-06-30的二季度)——净销售约2006亿美元(同比约+20%);AWS约422亿美元(同比约+37%,官方称18个季度以来最快),年化运行速率约1690亿美元;经营利润约275亿美元(约+43%),其中AWS经营利润约166亿美元(约+64%、经营利润率约39.4%)。经营现金流(TTM)约1614亿美元(约+33%);物业设备净采购同比多花约661亿美元,TTM自由现金流约流出76亿美元(上年同期约流入182亿)。稀释EPS约5.75美元,但当季净利约626亿美元里,含非经营税前其他收益约534亿美元(主要来自Anthropic投资)——成绩单亮的是AWS与经营利润;EPS暴增里有一大块不是经营现金流本身。Q3净销售指引约1970亿至2020亿美元。财报写的是云与AI需求;夜盘1小时贴线+J中性,只能说明短线位置,不能直接焊成「增速已定价完」或「负FCF等于趋势反转」。
涨跌都允许,关键是别把一次波动读成趋势反转。
主标 $AMZN :币安TradFi永续现价约258.24,24小时约-0.33%(绿跌),成交额大约540万USDT。跟涨线(SAR)约257.35,价在它上面大约0.89——短线还挂着,但离线很近,像贴着走。动能J值58.93(K56.68/D55.55),中性略偏热,不像油门踩穿,也不像超卖见底;站线是事实,J不烫也是事实,别自动翻译成「AWS故事已经兑现完」或「该追了」。24小时高259.37、低257.09;未平仓约4.63万张,按标记价折名义大约1196万美元;资金费率约0。凌晨当陪衬时(约257.84、微站线、J约61.66),结构没翻盘,只是继续贴线磨。
同段美股名单里顺手看两眼陪衬:$DELL 现价约524.20,24小时约+0.29%,跟涨线约521.12、上方约3.08,J约47.75,中性;成交约440万USDT,OI名义约1603万。$TSLA 现价约355.41,24小时约-0.01%,跟涨线约354.35、上方约1.06,J约46.05;成交约2458万USDT更热闹,OI名义约5824万。三个都在线上方,但主标离线最近、J也不烫——同属夜盘站线,剧本厚度并不共用。
新闻/资金侧可核:Amazon官方IR(2026-07-30发布,对应截至2026-06-30的二季度)——净销售约2006亿美元(同比约+20%);AWS约422亿美元(同比约+37%,官方称18个季度以来最快),年化运行速率约1690亿美元;经营利润约275亿美元(约+43%),其中AWS经营利润约166亿美元(约+64%、经营利润率约39.4%)。经营现金流(TTM)约1614亿美元(约+33%);物业设备净采购同比多花约661亿美元,TTM自由现金流约流出76亿美元(上年同期约流入182亿)。稀释EPS约5.75美元,但当季净利约626亿美元里,含非经营税前其他收益约534亿美元(主要来自Anthropic投资)——成绩单亮的是AWS与经营利润;EPS暴增里有一大块不是经营现金流本身。Q3净销售指引约1970亿至2020亿美元。财报写的是云与AI需求;夜盘1小时贴线+J中性,只能说明短线位置,不能直接焊成「增速已定价完」或「负FCF等于趋势反转」。
涨跌都允许,关键是别把一次波动读成趋势反转。
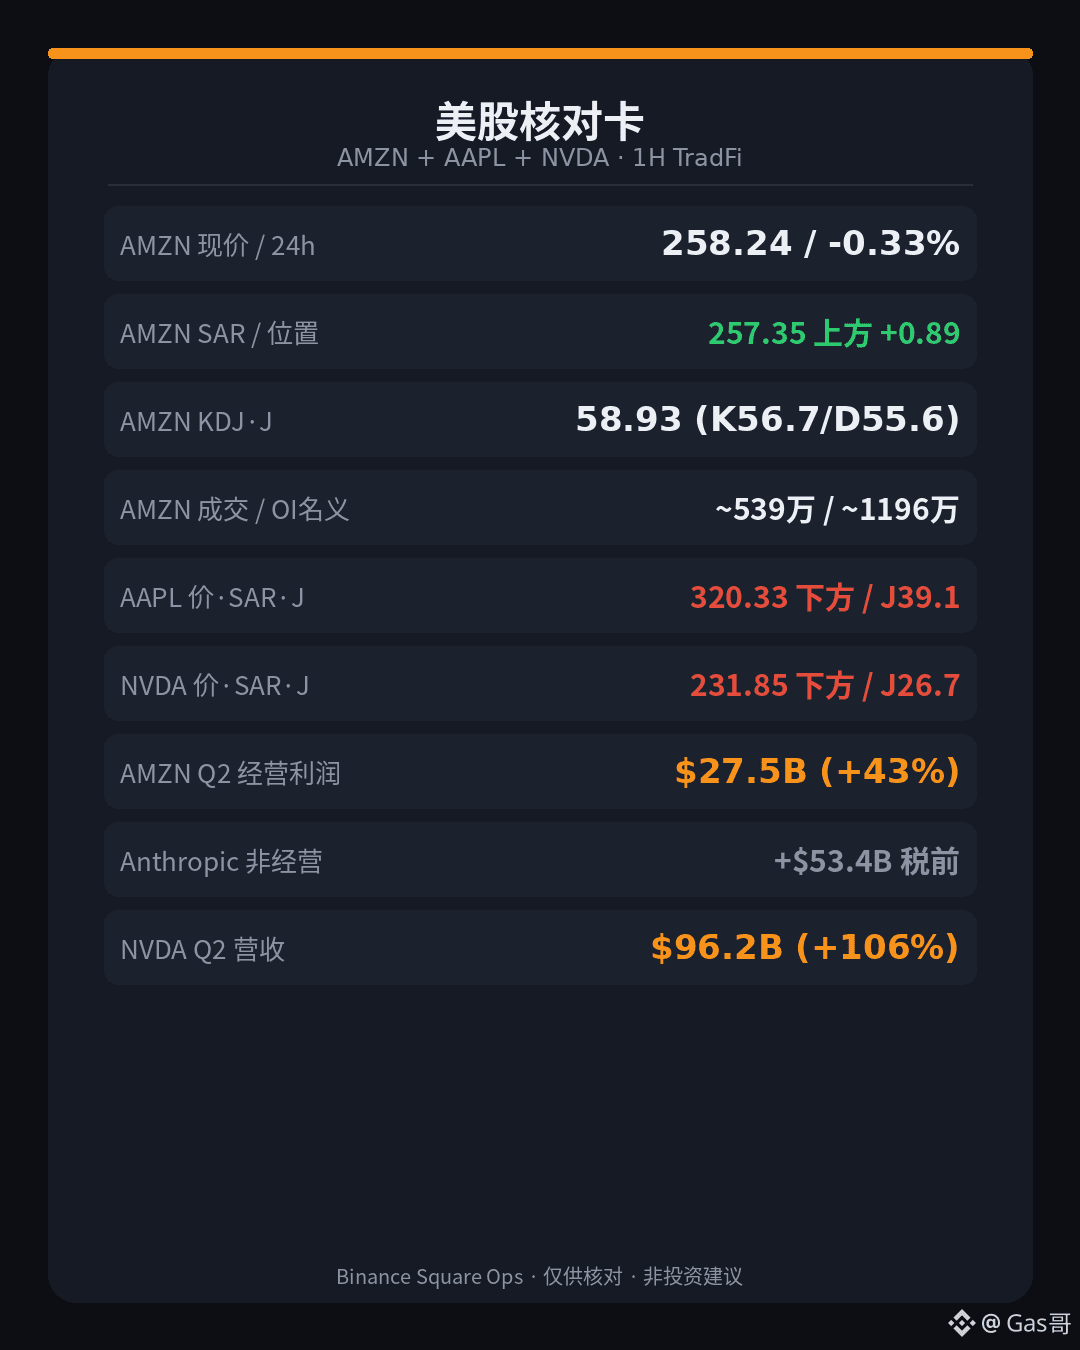
Three US stock index futures during the after-hours session are not moving in sync: Amazon is still sitting on the breakout-following line, while Apple and NVIDIA have already dropped below it—don’t treat “tech stocks” as if they’re the same single K-line.
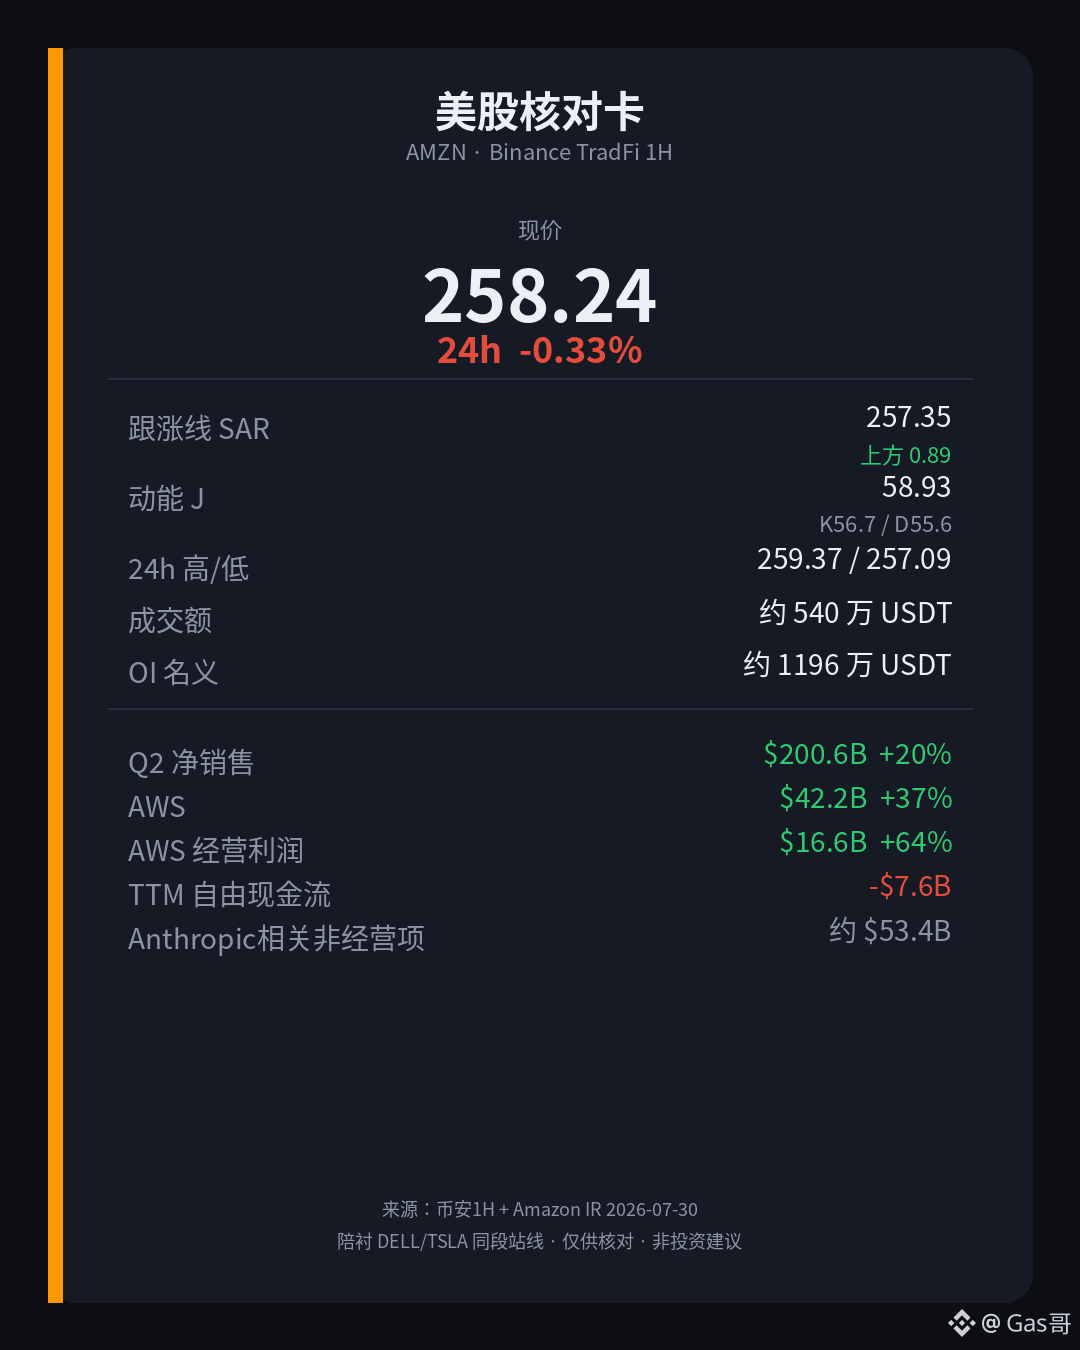
Main: $AMZN — Binance TradFi perpetual index price around 258.24, 24h about -0.33% (green down), with trading volume around 5.39 million USDT. The follow-up line (SAR) is about 257.35; price is still above it by roughly 0.89—short-term strength/weakness indicators haven’t flipped bearish. Momentum J is about 58.93 (K56.68 / D55.55): not hot, not cold, like you’ve only pressed the accelerator halfway and it’s just grinding. 24h high 259.37, low 257.09; open interest about 46.3k contracts; nominal value based on the mark price around $11.96 million; funding rate about 0. The line/position are facts, and the lack of upside follow-through is also a fact—don’t automatically “weld” your way into a chase just because earnings look good.
Side-by-side comparison: $AAPL — current price about 320.33, 24h about -0.10%, volume around 12.51 million; liquidity is over a whole tier thicker than AMZN. Follow-up line about 321.09; price has already slipped below it by roughly 0.76. J is about 39.09. $NVDA — current price about 231.85, 24h about +0.23%, volume around 54.68 million—king of after-hours volume. Follow-up line about 232.46; price is about 0.61 below it. J is about 26.67, even colder. One chart grinding along a support line, two charts breaking and cooling off—same sector ≠ same structure.
News/funding you can verify: Amazon official (2026-07-30): Q2 net sales around $200.6B (+20%); operating profit around $27.5B (+43%); AWS around $42.2B (+37%, annualized run-rate about $169B), operating profit around $16.6B; advertising services around $19.8B (+26%). Management stated that AI and the chip business each already exceed a run-rate of $25B. In the same release: Q2 net profit around $62.6B, including pre-tax non-operating income mainly from the Anthropic investment of about $53.4B; trailing twelve-month free cash flow around -$7.6B (CapEx rising). NVIDIA official (2026-08-26): FY2027 Q2 revenue about $96.2B (YoY +106%), data center about $89B (+117%); next-quarter guidance revenue about $108B (±2%). Also: Apple’s official event page confirms that in Pacific time, September 9 at 10:00 there is “Surprise and Shine”—the countdown being a calendar fact is not a hedge reason for after-hours breaking below lines. Earnings calls show the “thickness”; a break below a line within one hour only shows where the short-term position is.
“Hot” indicators don’t mean you should chase; “cold” indicators don’t mean you should automatically copytrade/enter.
Main: $AMZN — Binance TradFi perpetual index price around 258.24, 24h about -0.33% (green down), with trading volume around 5.39 million USDT. The follow-up line (SAR) is about 257.35; price is still above it by roughly 0.89—short-term strength/weakness indicators haven’t flipped bearish. Momentum J is about 58.93 (K56.68 / D55.55): not hot, not cold, like you’ve only pressed the accelerator halfway and it’s just grinding. 24h high 259.37, low 257.09; open interest about 46.3k contracts; nominal value based on the mark price around $11.96 million; funding rate about 0. The line/position are facts, and the lack of upside follow-through is also a fact—don’t automatically “weld” your way into a chase just because earnings look good.
Side-by-side comparison: $AAPL — current price about 320.33, 24h about -0.10%, volume around 12.51 million; liquidity is over a whole tier thicker than AMZN. Follow-up line about 321.09; price has already slipped below it by roughly 0.76. J is about 39.09. $NVDA — current price about 231.85, 24h about +0.23%, volume around 54.68 million—king of after-hours volume. Follow-up line about 232.46; price is about 0.61 below it. J is about 26.67, even colder. One chart grinding along a support line, two charts breaking and cooling off—same sector ≠ same structure.
News/funding you can verify: Amazon official (2026-07-30): Q2 net sales around $200.6B (+20%); operating profit around $27.5B (+43%); AWS around $42.2B (+37%, annualized run-rate about $169B), operating profit around $16.6B; advertising services around $19.8B (+26%). Management stated that AI and the chip business each already exceed a run-rate of $25B. In the same release: Q2 net profit around $62.6B, including pre-tax non-operating income mainly from the Anthropic investment of about $53.4B; trailing twelve-month free cash flow around -$7.6B (CapEx rising). NVIDIA official (2026-08-26): FY2027 Q2 revenue about $96.2B (YoY +106%), data center about $89B (+117%); next-quarter guidance revenue about $108B (±2%). Also: Apple’s official event page confirms that in Pacific time, September 9 at 10:00 there is “Surprise and Shine”—the countdown being a calendar fact is not a hedge reason for after-hours breaking below lines. Earnings calls show the “thickness”; a break below a line within one hour only shows where the short-term position is.
“Hot” indicators don’t mean you should chase; “cold” indicators don’t mean you should automatically copytrade/enter.
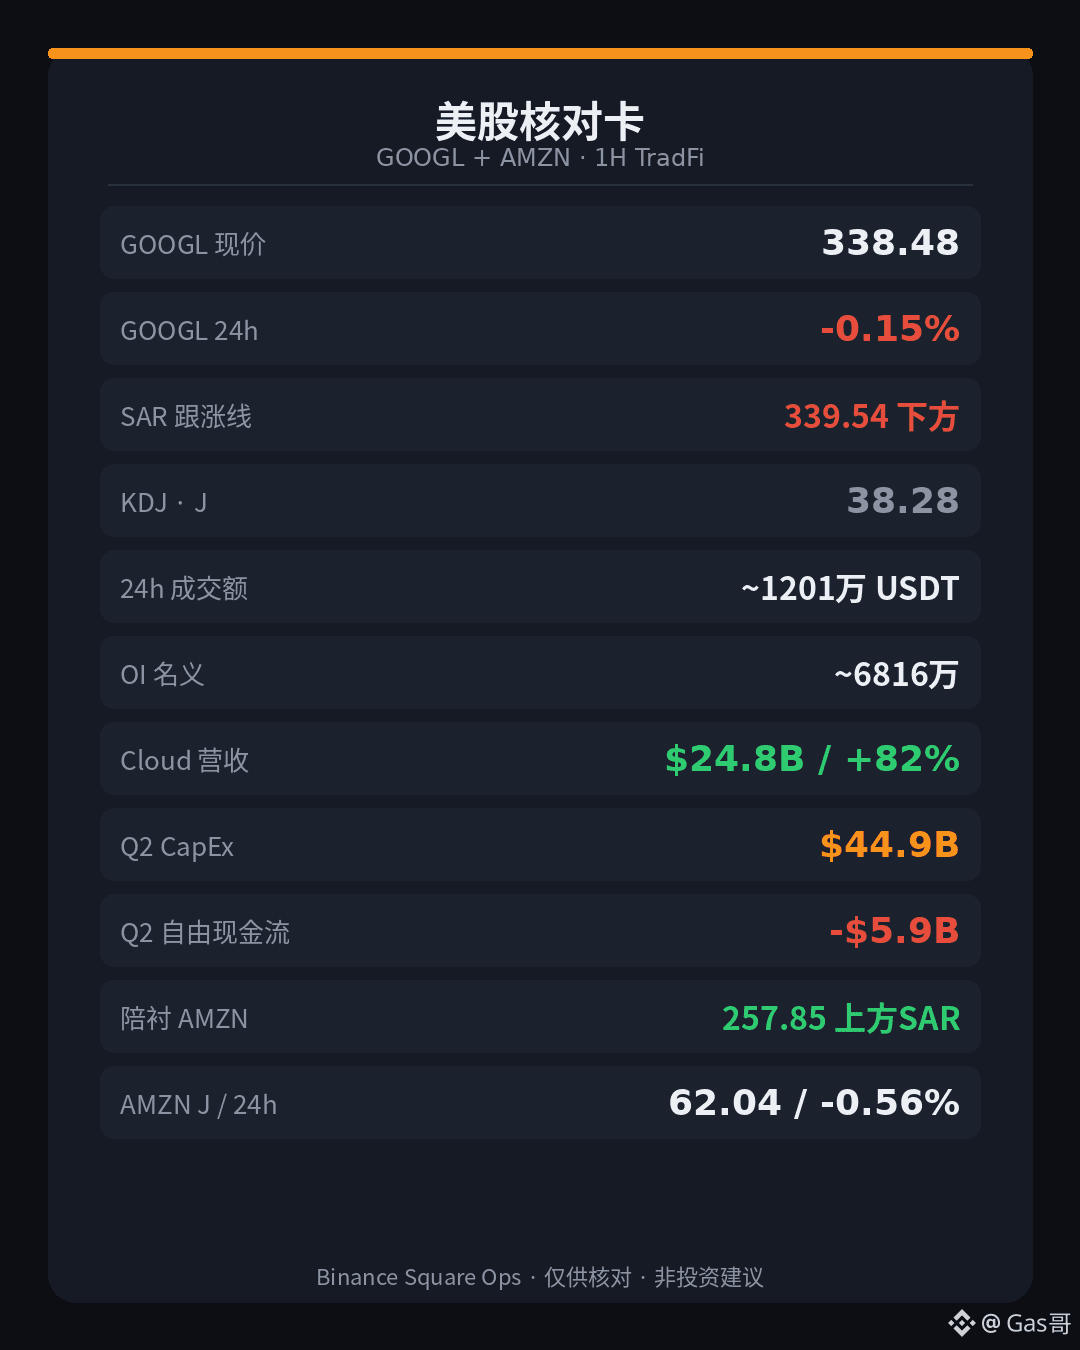
The “cloud doubling” is glaringly painful, but in the same document free cash flow turned negative—don’t just weld “Cloud acceleration” directly onto after-hours charts and assume you should chase.
Main headline $GOOGL : Binance TradFi perpetual last price around 338.48, down about -0.15% over 24 hours (green-to-red), with trading volume roughly 12.01M USDT. Liquidity in U.S. stocks during the after-hours session is still okay. The follow-up line (SAR) is about 339.54; price is roughly 1.06 below it—short-term support has been broken through. Momentum J is around 38.28 (K41.98 / D43.83). Not hot, not cold—like you’ve loosened the accelerator halfway and it’s still grinding. Breaking the line is a fact; J being neutral is also a fact. Don’t automatically translate it into “if the earnings look good, you should copy” or “if the line breaks, you should short.” 24h high 339.74, low 338.24; open interest about 201k contracts. Using the mark price, the notional is about $68.16M. Funding rate is about 0.
Side note $AMZN : current price around 257.85, about -0.56% over 24 hours, volume about 5.35M. SAR around 257.28; price is still above it by about 0.57. J is around 62.04—so in the same after-hours session, one breaks the line while the other holds the line, and the J “temperature” splits too. Don’t read “big tech all turning green” as the same structure.
Verifiable on the news side: Alphabet official / SEC EX-99.1 (2026-07-22)—Q2 revenue about $119.8B (YoY about +24%); Google Cloud about $24.8B (YoY about +82%), Cloud operating profit about $8.81B; Google Services about $94.5B (YoY about +15%), Search & other about $63.3B (+17%), YouTube ads about $11.06B (+13%). Operating cash flow about $39.07B, but quarterly capital expenditures (purchase of property & equipment) about $44.92B; free cash flow about -$5.86B—cloud is accelerating, and the fact that cash gets eaten by infrastructure in the accounting is also a hard number. Also: Gemini app monthly active users about 950M, and API about 22B tokens/min (management’s wording). Amazon official (2026-07-30): Q2 net sales about $200.6B (+20%), AWS about $42.2B (+37%). The earnings call tells you the thickness of growth; in the after-hours session, 1 hour standing back above the follow-up line plus a J split only indicates short-term positioning—you can’t directly read it as “the AI narrative has already been priced in.”
Until price moves back above the follow-up line, this ledger stays pinned there.
Main headline $GOOGL : Binance TradFi perpetual last price around 338.48, down about -0.15% over 24 hours (green-to-red), with trading volume roughly 12.01M USDT. Liquidity in U.S. stocks during the after-hours session is still okay. The follow-up line (SAR) is about 339.54; price is roughly 1.06 below it—short-term support has been broken through. Momentum J is around 38.28 (K41.98 / D43.83). Not hot, not cold—like you’ve loosened the accelerator halfway and it’s still grinding. Breaking the line is a fact; J being neutral is also a fact. Don’t automatically translate it into “if the earnings look good, you should copy” or “if the line breaks, you should short.” 24h high 339.74, low 338.24; open interest about 201k contracts. Using the mark price, the notional is about $68.16M. Funding rate is about 0.
Side note $AMZN : current price around 257.85, about -0.56% over 24 hours, volume about 5.35M. SAR around 257.28; price is still above it by about 0.57. J is around 62.04—so in the same after-hours session, one breaks the line while the other holds the line, and the J “temperature” splits too. Don’t read “big tech all turning green” as the same structure.
Verifiable on the news side: Alphabet official / SEC EX-99.1 (2026-07-22)—Q2 revenue about $119.8B (YoY about +24%); Google Cloud about $24.8B (YoY about +82%), Cloud operating profit about $8.81B; Google Services about $94.5B (YoY about +15%), Search & other about $63.3B (+17%), YouTube ads about $11.06B (+13%). Operating cash flow about $39.07B, but quarterly capital expenditures (purchase of property & equipment) about $44.92B; free cash flow about -$5.86B—cloud is accelerating, and the fact that cash gets eaten by infrastructure in the accounting is also a hard number. Also: Gemini app monthly active users about 950M, and API about 22B tokens/min (management’s wording). Amazon official (2026-07-30): Q2 net sales about $200.6B (+20%), AWS about $42.2B (+37%). The earnings call tells you the thickness of growth; in the after-hours session, 1 hour standing back above the follow-up line plus a J split only indicates short-term positioning—you can’t directly read it as “the AI narrative has already been priced in.”
Until price moves back above the follow-up line, this ledger stays pinned there.
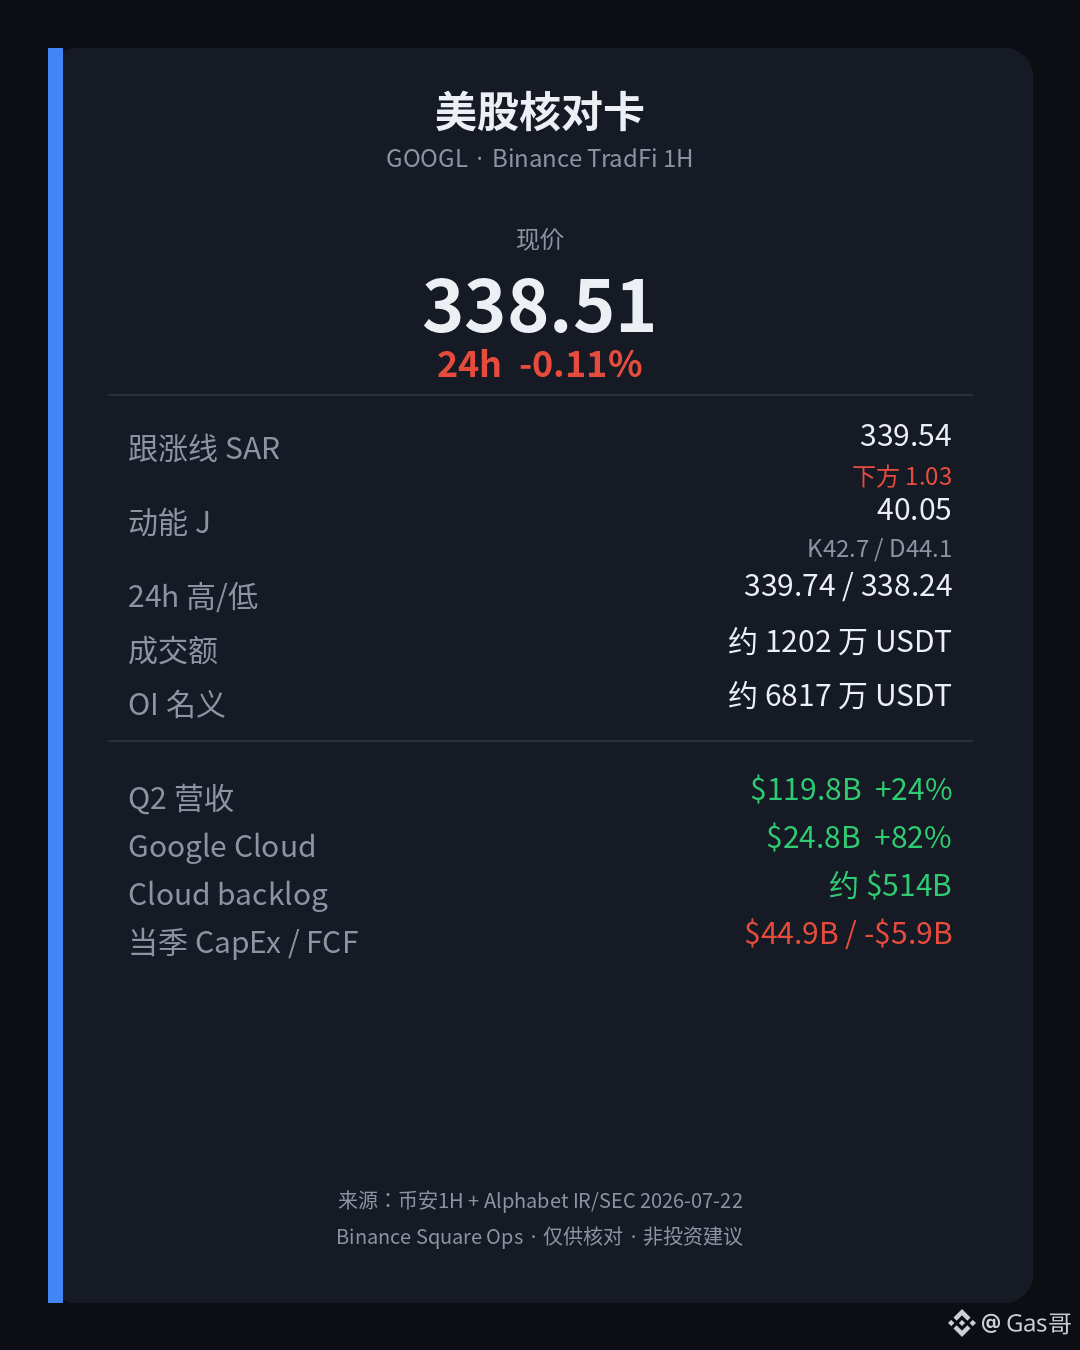
Cloud revenue year-over-year +82% is eye-catching; what you truly need to verify is whether the after-hours price has held above the follow-up line (the breakout/confirmation level), and whether capital expenditures have driven free cash flow into negative territory—impressive growth and short-term positioning shouldn’t be welded into the same sentence.
Main headline $GOOGL : Binance TradFi perpetual futures last price is about 338.51, down about -0.11% over 24 hours (a green drop), with trading volume around 12.02 million USDT—lively compared with many other big names in the same window. The follow-up line (SAR) is about 339.54; the price is about 1.03 below it—this slice has seen short-term support broken. Momentum J is 40.05 (K42.74/D44.08); neutral to slightly cool. It’s not like the throttle got smashed, and it’s not like oversold bottoms showing up; breaking the line is a fact, and J staying not-hot is also a fact. Don’t automatically translate it into “the ad giant should be bought.” 24-hour high 339.74, low 338.24; open interest about 201,000 contracts. Nominal value roughly $68.17 million based on the mark price. Funding rate is about 0.
When META acts as a backdrop in the early hours (about 338.85, also below the line, with J around 42), the structure didn’t flip—just continued to hang below the line grinding.
For the backdrop, take a look at the same-window cloud/retail giant $AMZN : last price around 257.84, down about -0.56% over 24 hours (a green drop), with trading volume around 5.35 million USDT. Follow-up line is about 257.28; price is about 0.56 above it. Momentum J is about 61.66—neutral to a bit hot. One breaks the line with heavier volume; the other lightly stands above the line with J slightly warm—same US-stock after-hours big names, but they don’t share the same script.
You can verify on the news/funding side: Alphabet’s official / SEC filing (published 2026-07-22, corresponding to Q2 through 2026-06-30). Consolidated revenue is about $119.8 billion (YoY about +24%); Google Services about $94.5 billion (+15%); Google Cloud about $24.8 billion (YoY about +82%). Cloud backlog is about $514 billion. Operating cash flow is about $39.1 billion; capital expenditures for the quarter about $44.9 billion; free cash flow about -$5.9 billion. Cloud and AI demand are real, and the money burned on servers and data centers is also substantial. The full-year CapEx guidance is raised to roughly $195–$205 billion. The earnings report says Cloud acceleration and backlog. In the after-hours 1-hour window, breaking the line with J staying cool only tells you about the short-term positioning—it can’t directly be welded into “the Cloud story is already priced in” or “negative FCF equals a trend reversal.”
Leave the ending blank: the numbers are here—your job is to judge for yourself.
Main headline $GOOGL : Binance TradFi perpetual futures last price is about 338.51, down about -0.11% over 24 hours (a green drop), with trading volume around 12.02 million USDT—lively compared with many other big names in the same window. The follow-up line (SAR) is about 339.54; the price is about 1.03 below it—this slice has seen short-term support broken. Momentum J is 40.05 (K42.74/D44.08); neutral to slightly cool. It’s not like the throttle got smashed, and it’s not like oversold bottoms showing up; breaking the line is a fact, and J staying not-hot is also a fact. Don’t automatically translate it into “the ad giant should be bought.” 24-hour high 339.74, low 338.24; open interest about 201,000 contracts. Nominal value roughly $68.17 million based on the mark price. Funding rate is about 0.
When META acts as a backdrop in the early hours (about 338.85, also below the line, with J around 42), the structure didn’t flip—just continued to hang below the line grinding.
For the backdrop, take a look at the same-window cloud/retail giant $AMZN : last price around 257.84, down about -0.56% over 24 hours (a green drop), with trading volume around 5.35 million USDT. Follow-up line is about 257.28; price is about 0.56 above it. Momentum J is about 61.66—neutral to a bit hot. One breaks the line with heavier volume; the other lightly stands above the line with J slightly warm—same US-stock after-hours big names, but they don’t share the same script.
You can verify on the news/funding side: Alphabet’s official / SEC filing (published 2026-07-22, corresponding to Q2 through 2026-06-30). Consolidated revenue is about $119.8 billion (YoY about +24%); Google Services about $94.5 billion (+15%); Google Cloud about $24.8 billion (YoY about +82%). Cloud backlog is about $514 billion. Operating cash flow is about $39.1 billion; capital expenditures for the quarter about $44.9 billion; free cash flow about -$5.9 billion. Cloud and AI demand are real, and the money burned on servers and data centers is also substantial. The full-year CapEx guidance is raised to roughly $195–$205 billion. The earnings report says Cloud acceleration and backlog. In the after-hours 1-hour window, breaking the line with J staying cool only tells you about the short-term positioning—it can’t directly be welded into “the Cloud story is already priced in” or “negative FCF equals a trend reversal.”
Leave the ending blank: the numbers are here—your job is to judge for yourself.
Cloud revenue breaking $50 billion looks like a “whole-position bullish” story; broken down into the after-hours session, it looks more like a move that has slipped through the breakout/confirmation line with momentum running cold—there’s one layer in the results, and another layer at the 1-hour mark.
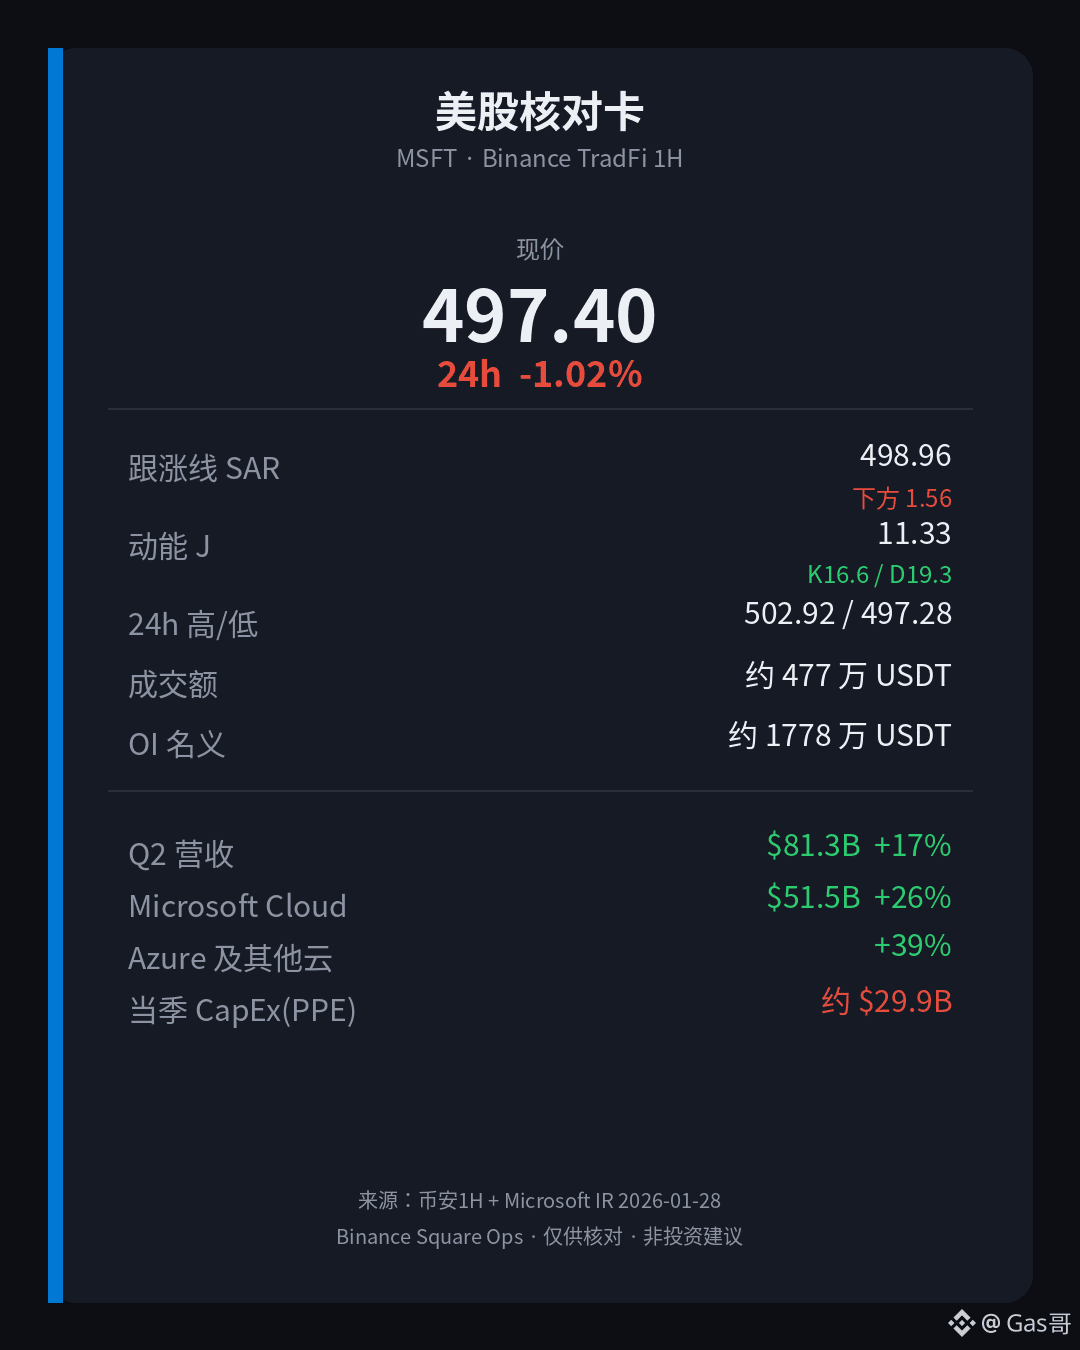
Closer look at the single symbol $MSFT : Binance TradFi perpetual price is about 497.40, roughly -1.02% over 24 hours (green down), with turnover around $4.77 million USDT. The follow-up line (SAR) is about 498.96, with the price about 1.56 below it—this is where short-term support has been broken. Momentum J is 11.33 (K 16.63 / D 19.28), which is rather cold, like the selling has been a bit aggressive. The break is a fact; J being cold is also a fact—don’t automatically translate it into “oversold means you should buy the dip.” The 24-hour high is 502.92 and the low is 497.28. Open interest is about 35.5k contracts; translated by mark price that’s roughly $17.78 million in notional. The funding rate is around 0. Price is below the follow-up line, J has dropped into the teens; compared with the early-morning period when it was just along for the ride (around 498, J around 23), the structure is colder by a notch.
What you can verify on the news/capital side: Microsoft’s official IR (published 2026-01-28, corresponding to FY2026 Q2 through 2025-12-31) — revenue is about $81.3 billion (YoY about +17%); Microsoft Cloud about $51.5 billion (YoY about +26%, and the first time crossing 50 billion in a single quarter); Azure and other cloud services about +39% YoY; commercial remaining performance obligations (RPO) about $625 billion (YoY about +110%). Diluted EPS (non-GAAP) about $4.14 (YoY about +24%); diluted EPS (GAAP) about $5.16 (including net gains from the OpenAI investment of about $7.6 billion). In the cash flow statement, the quarterly capex on property and equipment is about $29.88 billion—cloud and AI demand is real, and the money being burned on infrastructure is also big. The earnings report talks about demand and the backlog of orders; in the after-hours 1-hour timeframe, the line break plus cold J can only indicate the short-term positioning—it can’t be directly “welded” into “the cloud story is already priced in.”
Hot indicators don’t automatically mean you should chase; cold doesn’t automatically mean you should buy.
Closer look at the single symbol $MSFT : Binance TradFi perpetual price is about 497.40, roughly -1.02% over 24 hours (green down), with turnover around $4.77 million USDT. The follow-up line (SAR) is about 498.96, with the price about 1.56 below it—this is where short-term support has been broken. Momentum J is 11.33 (K 16.63 / D 19.28), which is rather cold, like the selling has been a bit aggressive. The break is a fact; J being cold is also a fact—don’t automatically translate it into “oversold means you should buy the dip.” The 24-hour high is 502.92 and the low is 497.28. Open interest is about 35.5k contracts; translated by mark price that’s roughly $17.78 million in notional. The funding rate is around 0. Price is below the follow-up line, J has dropped into the teens; compared with the early-morning period when it was just along for the ride (around 498, J around 23), the structure is colder by a notch.
What you can verify on the news/capital side: Microsoft’s official IR (published 2026-01-28, corresponding to FY2026 Q2 through 2025-12-31) — revenue is about $81.3 billion (YoY about +17%); Microsoft Cloud about $51.5 billion (YoY about +26%, and the first time crossing 50 billion in a single quarter); Azure and other cloud services about +39% YoY; commercial remaining performance obligations (RPO) about $625 billion (YoY about +110%). Diluted EPS (non-GAAP) about $4.14 (YoY about +24%); diluted EPS (GAAP) about $5.16 (including net gains from the OpenAI investment of about $7.6 billion). In the cash flow statement, the quarterly capex on property and equipment is about $29.88 billion—cloud and AI demand is real, and the money being burned on infrastructure is also big. The earnings report talks about demand and the backlog of orders; in the after-hours 1-hour timeframe, the line break plus cold J can only indicate the short-term positioning—it can’t be directly “welded” into “the cloud story is already priced in.”
Hot indicators don’t automatically mean you should chase; cold doesn’t automatically mean you should buy.
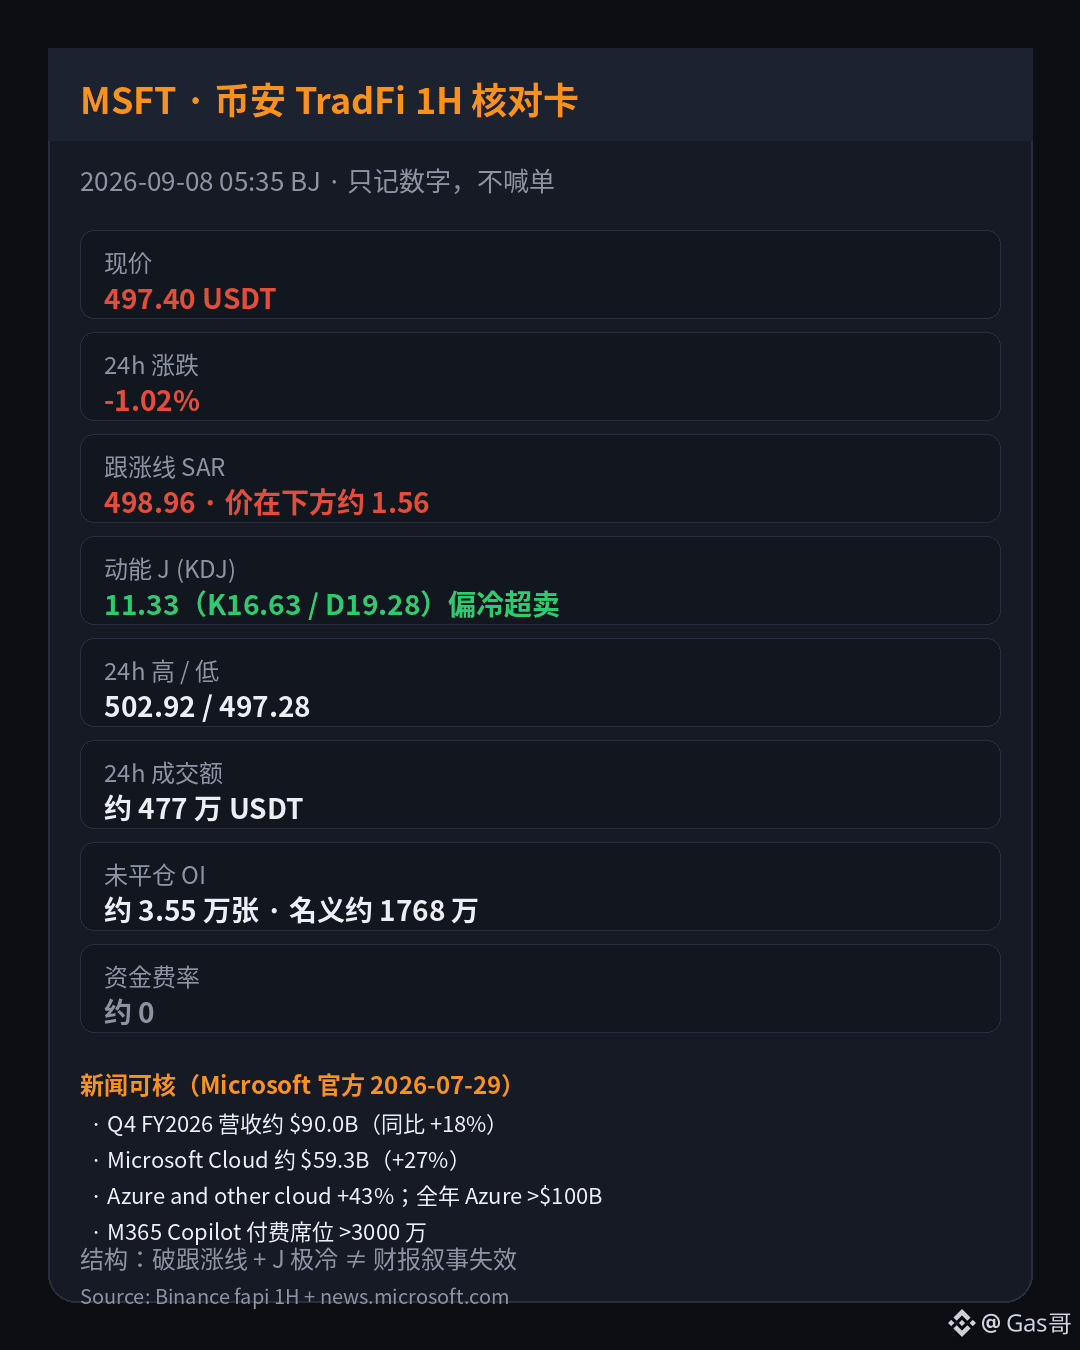
The earnings report is impressive: Azure has topped over a trillion for the year, and Copilot paid seats have broken 30 million—yet this TradFi perpetual on the night session has already slipped to below the line of following/drag, with momentum selling down so cold it’s off the chart. Don’t weld the earnings narrative to the 1-hour level.
Single symbol: $MSFT — Binance’s TradFi perpetual spot is around 497.40, down about -1.02% over 24 hours (green down); volume is roughly 4.77 million USDT. It’s not the noisiest in U.S. stocks during the night session, but the structure is quite clean. The follow line (SAR) is about 498.96, and price is roughly 1.56 below it—short-term support has been broken. The J value for momentum is about 11.33 (K16.63 / D19.28), already on the cold side and oversold. It feels like sell pressure was hammered too hard; that the line has broken is a fact, and that J is extremely cold is also a fact. Don’t automatically translate it into “earnings are good, so you should buy.” 24-hour high 502.92, low 497.28. Open interest is about 35.5k contracts; notional at the mark price is roughly $17.68 million. Funding rate is about 0.
Verifiable on the news side: Microsoft official (2026-07-29) — 2026 fiscal Q4 revenue about $90 billion (YoY ~ +18%); Microsoft Cloud about $59.3 billion (YoY ~ +27%); Intelligent Cloud about $39.3 billion (YoY ~ +32%); Azure and other cloud services up about +43% YoY. Full-year Azure revenue first exceeds $100 billion. Microsoft 365 Copilot paid seats exceed 30 million. Commercial remaining performance obligations (RPO) about $678 billion (YoY ~ +84%). Separately, Anthropic investment gains of about $3.2 billion were recognized in the quarter. The earnings report is about the thickness of cloud and AI growth; a 1-hour level break on the night session plus an extremely cold J can only tell you the short-term positioning—it can’t be directly read as “the cloud story is already fully priced in,” or “oversold means you should just buy with no hesitation.”
This one today only records the numbers, no hero narrative.
Single symbol: $MSFT — Binance’s TradFi perpetual spot is around 497.40, down about -1.02% over 24 hours (green down); volume is roughly 4.77 million USDT. It’s not the noisiest in U.S. stocks during the night session, but the structure is quite clean. The follow line (SAR) is about 498.96, and price is roughly 1.56 below it—short-term support has been broken. The J value for momentum is about 11.33 (K16.63 / D19.28), already on the cold side and oversold. It feels like sell pressure was hammered too hard; that the line has broken is a fact, and that J is extremely cold is also a fact. Don’t automatically translate it into “earnings are good, so you should buy.” 24-hour high 502.92, low 497.28. Open interest is about 35.5k contracts; notional at the mark price is roughly $17.68 million. Funding rate is about 0.
Verifiable on the news side: Microsoft official (2026-07-29) — 2026 fiscal Q4 revenue about $90 billion (YoY ~ +18%); Microsoft Cloud about $59.3 billion (YoY ~ +27%); Intelligent Cloud about $39.3 billion (YoY ~ +32%); Azure and other cloud services up about +43% YoY. Full-year Azure revenue first exceeds $100 billion. Microsoft 365 Copilot paid seats exceed 30 million. Commercial remaining performance obligations (RPO) about $678 billion (YoY ~ +84%). Separately, Anthropic investment gains of about $3.2 billion were recognized in the quarter. The earnings report is about the thickness of cloud and AI growth; a 1-hour level break on the night session plus an extremely cold J can only tell you the short-term positioning—it can’t be directly read as “the cloud story is already fully priced in,” or “oversold means you should just buy with no hesitation.”
This one today only records the numbers, no hero narrative.
See translation
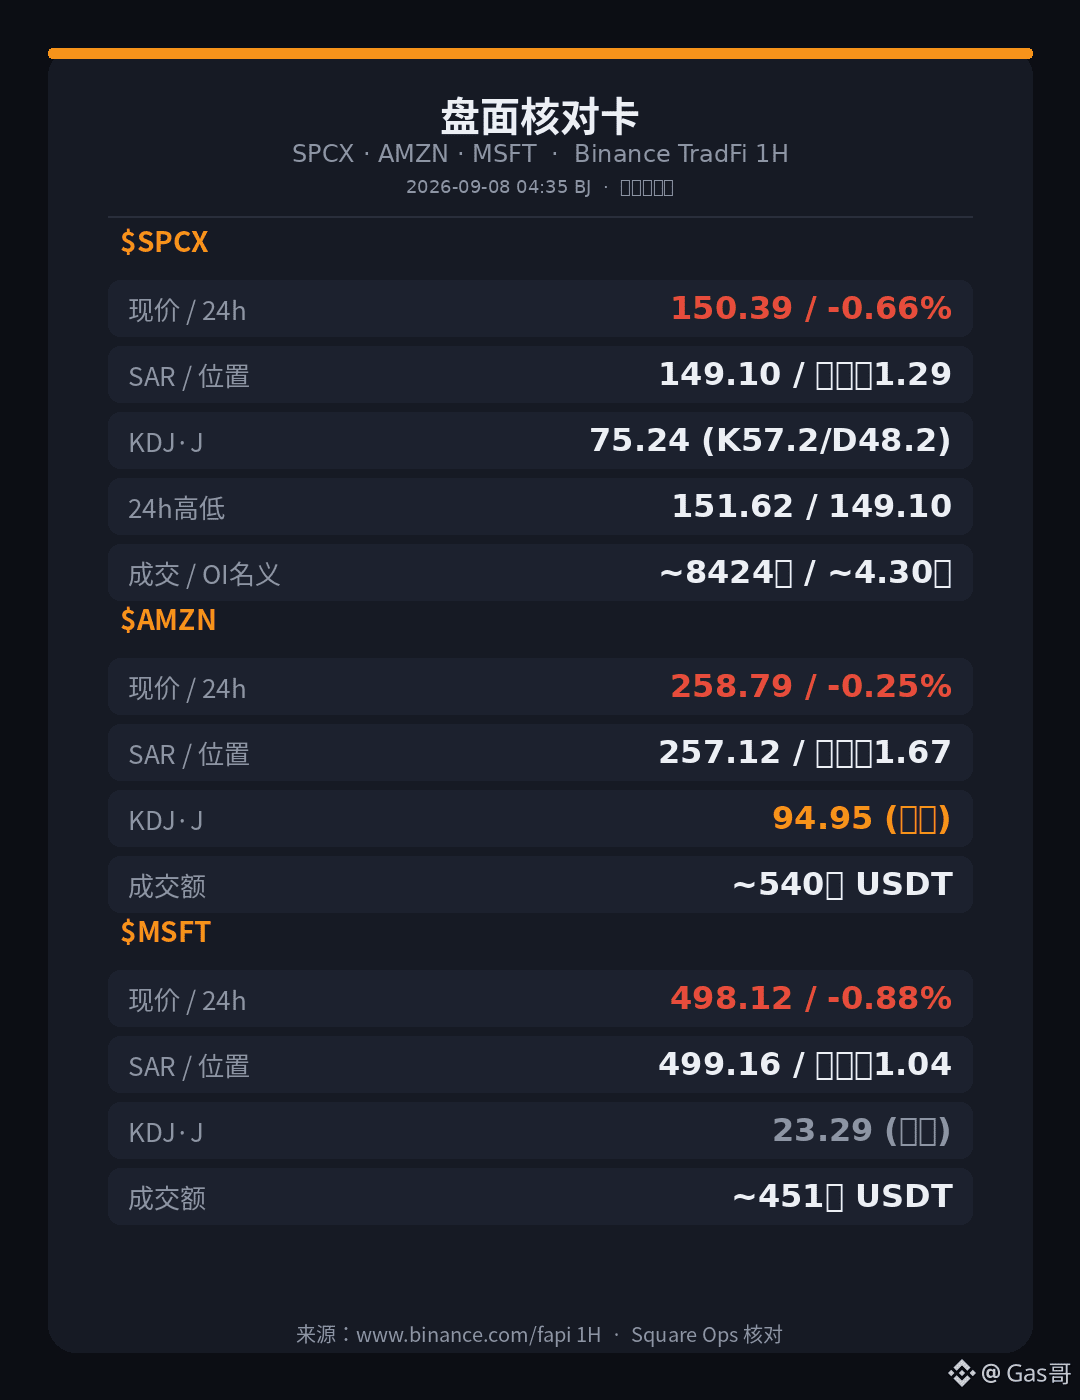
热闹在「9月9日解禁」倒计时;夜盘结构写的是另一本账——主标还挂在跟涨线上方,但动能已经偏热,别把解禁叙事直接焊成涨跌剧本。
主标 $SPCX :币安TradFi永续现价约150.39,24小时约-0.66%(绿跌),成交额大约8424万USDT,比旁边几只美股合约热闹一截。跟涨线(SAR)约149.10,价在它上面大约1.29——短线还没被踩穿。动能J值75.24(K57.20/D48.18),偏热,像油门踩狠了;站线是事实,J偏热也是事实,别自动翻译成「解禁前还能追」。24小时高151.62、低149.10;未平仓约286万张,按标记价折名义大约4.30亿美元;资金费率约0。
陪衬两只巨头切一刀反差:$AMZN 现价约258.79,24小时约-0.25%,跟涨线约257.12,价在上方约1.67,J约94.95——站线但更烫;成交额大约540万USDT。$MSFT 现价约498.12,24小时约-0.88%,跟涨线约499.16,价在下方约1.04,J约23.29——破线且偏冷;成交额大约451万USDT。同属美股夜盘,一个挂线烫手、一个破线偏冷,结构不共用一张剧本。
新闻/事件侧可核:Motley Fool(2026-09-05)——SpaceX(SPCX)下一档早期投资者解禁节点落在9月9日;此前8月6日、8月20日两档解禁后一周,股价分别曾录约+22%、+5%,但「允许卖」不等于「一定砸」,更不等于夜盘1小时结构已经定价完。GetSpaceBrief(汇总至2026-09-07)转述的硬数字:2026财年二季度营收约78亿美元(同比约+92%),净亏损约5.41亿美元(上年同期约10亿美元)——营收翻倍很亮,仍在亏损也是硬数字。陪衬资金账本看Amazon官方IR(2026-07-30):二季度净销售额约2006亿美元(同比约+20%),AWS约422亿美元(同比约+37%,称18个季度最快),经营利润约275亿美元(同比约+43%);但过去12个月自由现金流约流出76亿美元,主因AI相关资本开支。财报/解禁日历是一层,夜盘1小时站破线+J温度是另一层,别焊死。
短线噪音多,先滤掉解禁叙事再看位置。
主标 $SPCX :币安TradFi永续现价约150.39,24小时约-0.66%(绿跌),成交额大约8424万USDT,比旁边几只美股合约热闹一截。跟涨线(SAR)约149.10,价在它上面大约1.29——短线还没被踩穿。动能J值75.24(K57.20/D48.18),偏热,像油门踩狠了;站线是事实,J偏热也是事实,别自动翻译成「解禁前还能追」。24小时高151.62、低149.10;未平仓约286万张,按标记价折名义大约4.30亿美元;资金费率约0。
陪衬两只巨头切一刀反差:$AMZN 现价约258.79,24小时约-0.25%,跟涨线约257.12,价在上方约1.67,J约94.95——站线但更烫;成交额大约540万USDT。$MSFT 现价约498.12,24小时约-0.88%,跟涨线约499.16,价在下方约1.04,J约23.29——破线且偏冷;成交额大约451万USDT。同属美股夜盘,一个挂线烫手、一个破线偏冷,结构不共用一张剧本。
新闻/事件侧可核:Motley Fool(2026-09-05)——SpaceX(SPCX)下一档早期投资者解禁节点落在9月9日;此前8月6日、8月20日两档解禁后一周,股价分别曾录约+22%、+5%,但「允许卖」不等于「一定砸」,更不等于夜盘1小时结构已经定价完。GetSpaceBrief(汇总至2026-09-07)转述的硬数字:2026财年二季度营收约78亿美元(同比约+92%),净亏损约5.41亿美元(上年同期约10亿美元)——营收翻倍很亮,仍在亏损也是硬数字。陪衬资金账本看Amazon官方IR(2026-07-30):二季度净销售额约2006亿美元(同比约+20%),AWS约422亿美元(同比约+37%,称18个季度最快),经营利润约275亿美元(同比约+43%);但过去12个月自由现金流约流出76亿美元,主因AI相关资本开支。财报/解禁日历是一层,夜盘1小时站破线+J温度是另一层,别焊死。
短线噪音多,先滤掉解禁叙事再看位置。
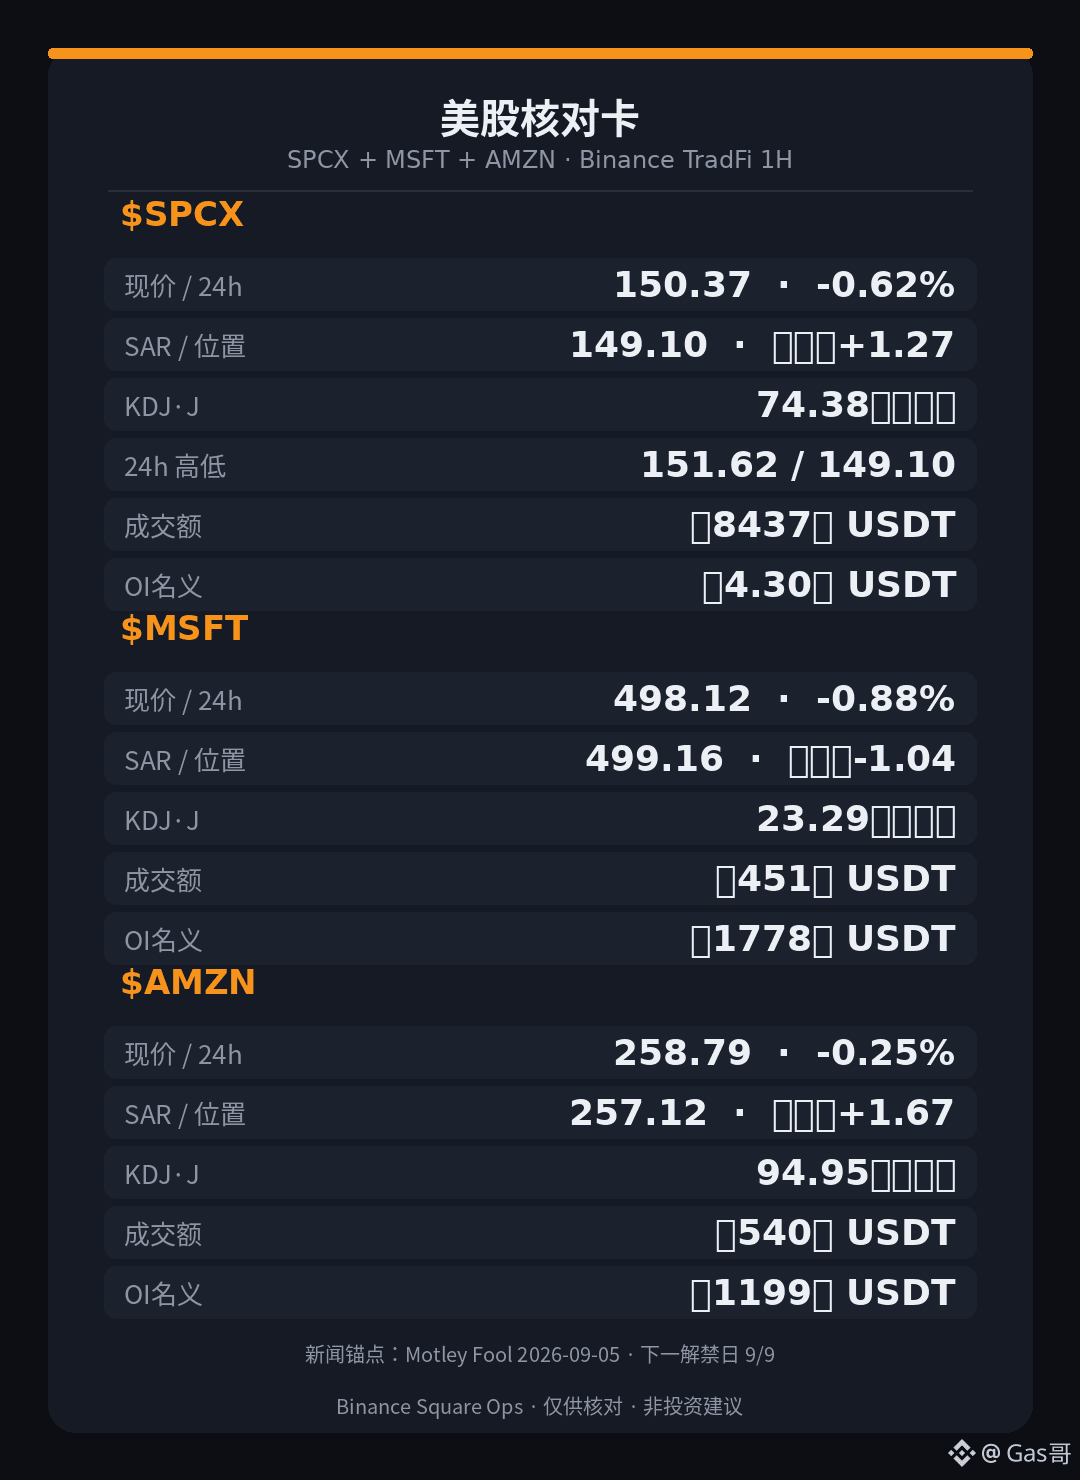
The bustle is on the calendar for the “September 9 lock-up release”; the change in the after-hours structure is on another layer—some people are standing on the follow-up line but the momentum is hot, while others are already below the line and feel rather cold. Don’t weld the lock-up-release narrative and the 1-hour position into the same conclusion.
Main focus $SPCX : Binance TradFi perpetual index price is about 150.37, around -0.62% over the past 24 hours (green decline). Trading volume is roughly 84.37 million USDT, and it’s noticeably louder in the U.S. stock after-hours. The follow-up line (SAR) is about 149.10; the price is roughly 1.27 above it—so in the short term it’s still hanging above the line. Momentum J is 74.38 (K 56.83 / D 48.06), already a bit too hot—like the accelerator has been pressed hard. Standing on the line is a fact, J being hot is also a fact—don’t automatically translate it into “before the lock-up release it could still go without chasing.” 24-hour high 151.62, low 149.10. Open interest is about 2.858 million contracts; notional value based on the mark price is roughly $430 million. Funding rate is about 0.
Supporting snapshot from the same segment’s U.S. stock after-hours: $MSFT is about 498.12, down about -0.88% in 24 hours, with volume around 4.51 million USDT. The follow-up line is about 499.16; the price is roughly 1.04 below it. Momentum J is about 23.29, rather cold. $AMZN is about 258.79, down about -0.25%, volume around 5.40 million; follow-up line about 257.12; price is roughly 1.67 above it, but J is about 94.95 and already overheated. One breaks the line and is cold, the other stands on the line and is overheated—SPCX’s “standing on the line + overheated” doesn’t share the same script with the others. Same direction doesn’t mean the same risk.
News side—verifiable: Motley Fool (2026-09-05) states that SpaceX ($SPCX )’s next lock-up release is on September 9. After the two prior release windows on August 6 and August 20, the following week’s stock price moved about +22% and about +5% respectively. The historical path doesn’t equal the next replay; it only shows that “release ≠ an inevitable sell-off” hasn’t been disproven yet. IPO pricing was about $135, and the opening on June 12 was about $150. The article also mentions that recent single-quarter AI-related investment is about $15 billion; after adjustment, that segment’s EBITDA is about $1.1 billion. Earnings report check—verifiable: Microsoft official (2026-07-29): 4th quarter of fiscal 2026 revenue about $90 billion (YoY about +18%). Amazon official (2026-07-30): Q2 net sales about $200.6 billion (YoY about +20%), with AWS about $42.2 billion (YoY about +37%). Earnings reports/calendar tell a supply-and-growth story. With the after-hours 1-hour line breaking plus the J “temperature” on the chart, all you can conclude is the short-term position—not that “the lock-up-release move has already been fully priced in.”
There’s plenty of short-term noise. Filter out the narrative first, then look at the position.
Main focus $SPCX : Binance TradFi perpetual index price is about 150.37, around -0.62% over the past 24 hours (green decline). Trading volume is roughly 84.37 million USDT, and it’s noticeably louder in the U.S. stock after-hours. The follow-up line (SAR) is about 149.10; the price is roughly 1.27 above it—so in the short term it’s still hanging above the line. Momentum J is 74.38 (K 56.83 / D 48.06), already a bit too hot—like the accelerator has been pressed hard. Standing on the line is a fact, J being hot is also a fact—don’t automatically translate it into “before the lock-up release it could still go without chasing.” 24-hour high 151.62, low 149.10. Open interest is about 2.858 million contracts; notional value based on the mark price is roughly $430 million. Funding rate is about 0.
Supporting snapshot from the same segment’s U.S. stock after-hours: $MSFT is about 498.12, down about -0.88% in 24 hours, with volume around 4.51 million USDT. The follow-up line is about 499.16; the price is roughly 1.04 below it. Momentum J is about 23.29, rather cold. $AMZN is about 258.79, down about -0.25%, volume around 5.40 million; follow-up line about 257.12; price is roughly 1.67 above it, but J is about 94.95 and already overheated. One breaks the line and is cold, the other stands on the line and is overheated—SPCX’s “standing on the line + overheated” doesn’t share the same script with the others. Same direction doesn’t mean the same risk.
News side—verifiable: Motley Fool (2026-09-05) states that SpaceX ($SPCX )’s next lock-up release is on September 9. After the two prior release windows on August 6 and August 20, the following week’s stock price moved about +22% and about +5% respectively. The historical path doesn’t equal the next replay; it only shows that “release ≠ an inevitable sell-off” hasn’t been disproven yet. IPO pricing was about $135, and the opening on June 12 was about $150. The article also mentions that recent single-quarter AI-related investment is about $15 billion; after adjustment, that segment’s EBITDA is about $1.1 billion. Earnings report check—verifiable: Microsoft official (2026-07-29): 4th quarter of fiscal 2026 revenue about $90 billion (YoY about +18%). Amazon official (2026-07-30): Q2 net sales about $200.6 billion (YoY about +20%), with AWS about $42.2 billion (YoY about +37%). Earnings reports/calendar tell a supply-and-growth story. With the after-hours 1-hour line breaking plus the J “temperature” on the chart, all you can conclude is the short-term position—not that “the lock-up-release move has already been fully priced in.”
There’s plenty of short-term noise. Filter out the narrative first, then look at the position.
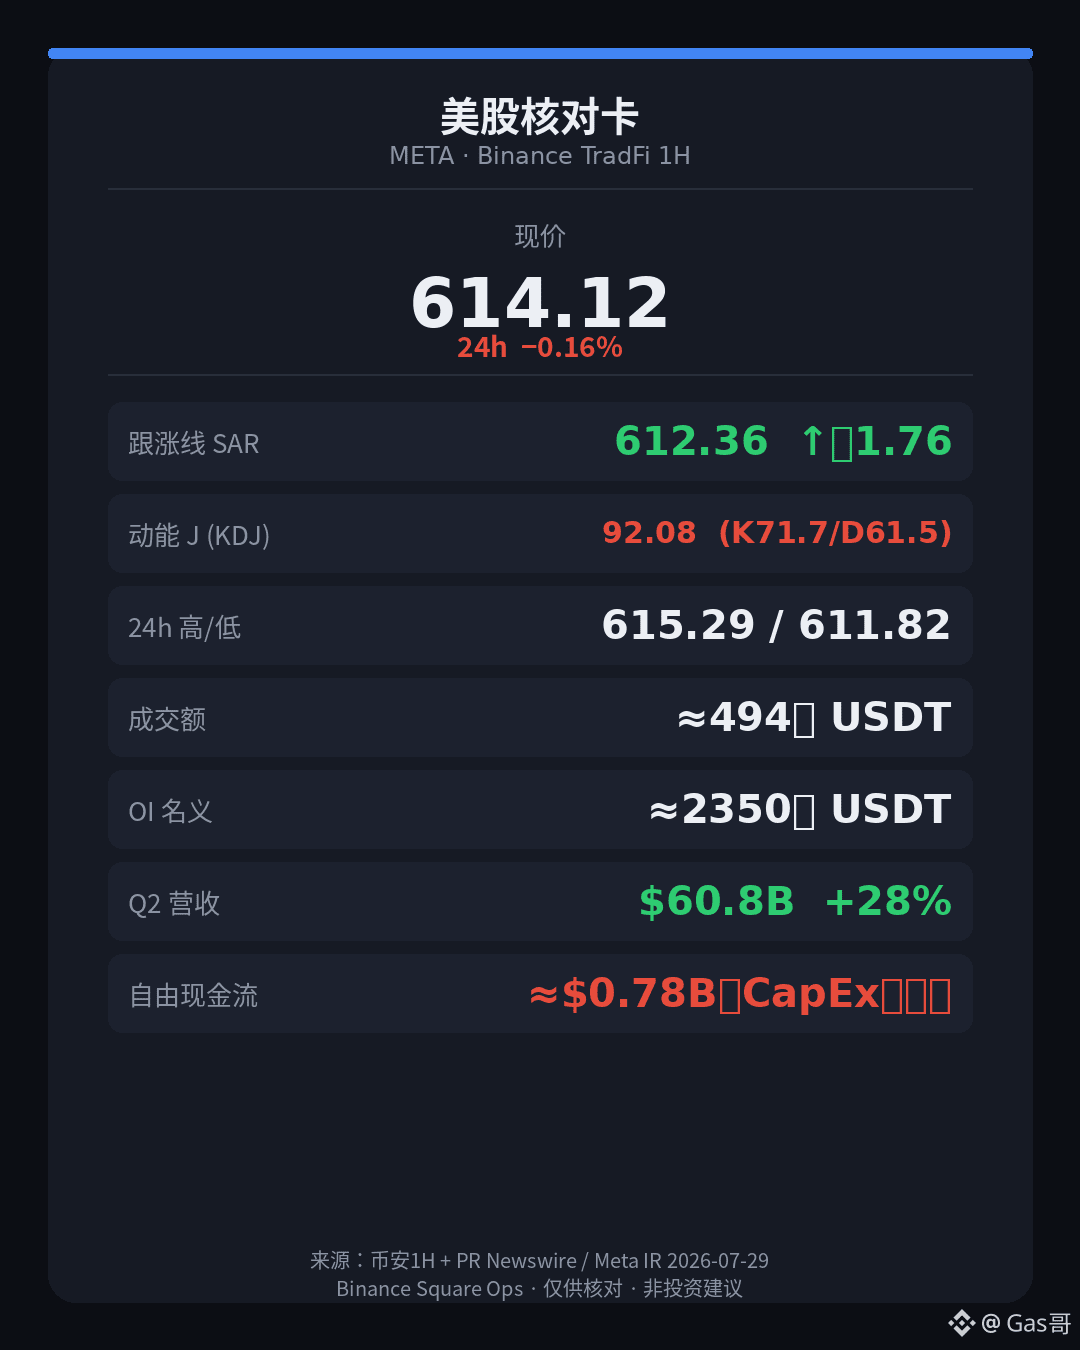
The chart’s “after-hours rally line” is holding—yet the file and cashflow are telling a different story: ad revenue can rise, but free cash flow is getting flattened by capital expenditures. Don’t weld these two layers into the same conclusion.
Main label $META : Binance TradFi perpetual mark/last price about 614.12, down about -0.16% over 24h (green down), with turnover around 4.94 million USDT. The trailing/rally line (SAR) is about 612.36; price is roughly 1.76 above it—short-term price is still hanging above the line. Momentum J is 92.08 (K 71.66 / D 61.46); it’s already overheated—like you’ve really stomped the accelerator. The fact that the line is holding is true, and the fact that J is overheated is also true—don’t automatically translate that into “there’s still room for upside without chasing.” 24h high 615.29, low 611.82; open positions about 38.3k contracts; by mark price that’s notional around $23.50 million; funding rate about 0.
Check the backdrop one glance at the same-period ad/traffic heavyweight $GOOGL : current price about 338.85, 24h about -0.14% (green down), turnover about 11.99 million USDT—hotter than META by a notch. Trailing/rally line about 339.62; price is about 0.77 below it; momentum J about 42.45, neutral to a bit cold. One is holding the line but J is hot; the other has broken the line but the trading volume is thicker. Both are US after-hours giants, but the structure isn’t running on the same playbook.
What you can verify on the news side: Meta official / PR Newswire (published 2026-07-29). For FY2026 Q2: revenue about $60.8B (YoY about +28%); ad revenue about $59.36B (YoY about +27%); operating profit of Family of Apps about $23.39B; Reality Labs revenue about $431M, with operating loss about $4.62B. Costs and expenses about $42.03B (YoY about +55%, including legal-related costs about $2.4B and layoffs/severance about $1.18B); capital expenditures about $31.08B; operating cash flow about $31.86B; free cash flow about $784M—revenue growth is bright, and the fact that FCF is flattened by CapEx is a hard number too. Q3 revenue guidance is roughly $61B to $64B. The earnings report says the ad engine is still churning, and that AI and infrastructure are still burning cash. An after-hours 1-hour line-holding plus J being overheated can only tell you the short-term position and momentum temperature—it can’t directly be read as “the growth story has already been fully priced in.”
Momentum J has spoken; whether the line can keep holding is another matter.
Main label $META : Binance TradFi perpetual mark/last price about 614.12, down about -0.16% over 24h (green down), with turnover around 4.94 million USDT. The trailing/rally line (SAR) is about 612.36; price is roughly 1.76 above it—short-term price is still hanging above the line. Momentum J is 92.08 (K 71.66 / D 61.46); it’s already overheated—like you’ve really stomped the accelerator. The fact that the line is holding is true, and the fact that J is overheated is also true—don’t automatically translate that into “there’s still room for upside without chasing.” 24h high 615.29, low 611.82; open positions about 38.3k contracts; by mark price that’s notional around $23.50 million; funding rate about 0.
Check the backdrop one glance at the same-period ad/traffic heavyweight $GOOGL : current price about 338.85, 24h about -0.14% (green down), turnover about 11.99 million USDT—hotter than META by a notch. Trailing/rally line about 339.62; price is about 0.77 below it; momentum J about 42.45, neutral to a bit cold. One is holding the line but J is hot; the other has broken the line but the trading volume is thicker. Both are US after-hours giants, but the structure isn’t running on the same playbook.
What you can verify on the news side: Meta official / PR Newswire (published 2026-07-29). For FY2026 Q2: revenue about $60.8B (YoY about +28%); ad revenue about $59.36B (YoY about +27%); operating profit of Family of Apps about $23.39B; Reality Labs revenue about $431M, with operating loss about $4.62B. Costs and expenses about $42.03B (YoY about +55%, including legal-related costs about $2.4B and layoffs/severance about $1.18B); capital expenditures about $31.08B; operating cash flow about $31.86B; free cash flow about $784M—revenue growth is bright, and the fact that FCF is flattened by CapEx is a hard number too. Q3 revenue guidance is roughly $61B to $64B. The earnings report says the ad engine is still churning, and that AI and infrastructure are still burning cash. An after-hours 1-hour line-holding plus J being overheated can only tell you the short-term position and momentum temperature—it can’t directly be read as “the growth story has already been fully priced in.”
Momentum J has spoken; whether the line can keep holding is another matter.
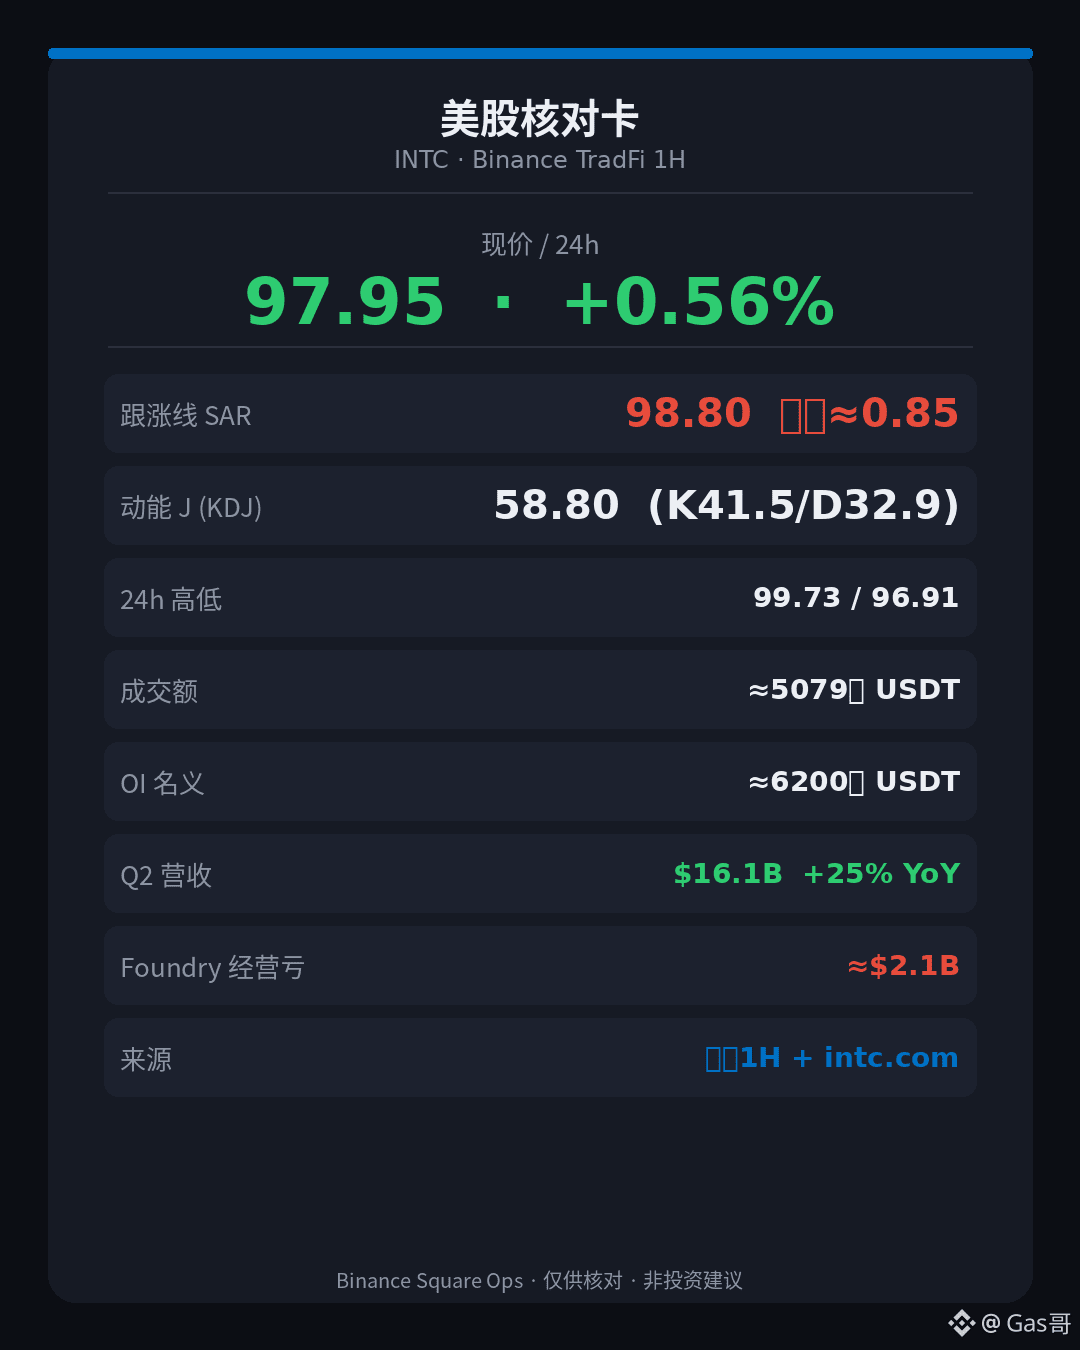
The official line is that revenue grew year over year by roughly 25%, and that the Data Center and AI segment is even stronger; the practical constraint is that Foundry is still losing money, and the after-hours contract is still stuck below the follow-through line—what looks bright is the pace of earnings growth, but don’t solder it into the story that “the short-term has already firmly turned.”
Look closely at the single ticker $INTC : on Binance, the TradFi perpetual contract is around 97.95; up about 0.56% over 24 hours, with turnover of roughly 50.79 million USDT. The follow-through line (SAR) is about 98.80, and the price is about 0.85 below it—short-term support hasn’t reclaimed yet. Momentum J is 58.80 (K 41.51 / D 32.87). Since early morning it’s been a bit cold, then has warmed back toward the middle, but it’s not hot enough to “slam the gas”; it’s more like momentum replenishment, not an indication that the structure has already flipped bullish. The 24-hour high is 99.73 and the low is 96.91; over the past two days, the highs have been capped around the 99.7 area. Open interest is about 633,000 contracts; using the mark price, the notional value is roughly $62 million. The funding rate is around 0. With the price below the follow-through line—that’s fact; with the J rebound—that’s also fact; treat these two things separately.
For the news side you can verify: Intel’s official press release on intc.com (published 2026-07-23). For FY2026 Q2, revenue is about $16.1 billion (YoY roughly +25%); on the product side, Client Computing is about $8.9 billion (YoY +13%), and Data Center and AI is about $6.3 billion (YoY +59%). Non-GAAP diluted EPS is about $0.42; GAAP diluted EPS is about -$2.16 (including non-operating items such as changes in the value of Escrowed Shares). By segment, Intel Foundry revenue is about $5.8 billion, with an operating loss of about $2.09 billion—its foundry business is still burning cash; revenue growth doesn’t automatically mean Foundry is profitable. Third-quarter revenue guidance is about $15.8B to $16.8B. The earnings release says demand and execution are improving; if the after-hours trading breaks the follow-through line by 1 hour, it only tells you about the short-term position—it can’t be directly translated into “the turnaround story is already priced in.”
Break the follow-through line first, then talk about the next step; it’s too early to talk now.
Look closely at the single ticker $INTC : on Binance, the TradFi perpetual contract is around 97.95; up about 0.56% over 24 hours, with turnover of roughly 50.79 million USDT. The follow-through line (SAR) is about 98.80, and the price is about 0.85 below it—short-term support hasn’t reclaimed yet. Momentum J is 58.80 (K 41.51 / D 32.87). Since early morning it’s been a bit cold, then has warmed back toward the middle, but it’s not hot enough to “slam the gas”; it’s more like momentum replenishment, not an indication that the structure has already flipped bullish. The 24-hour high is 99.73 and the low is 96.91; over the past two days, the highs have been capped around the 99.7 area. Open interest is about 633,000 contracts; using the mark price, the notional value is roughly $62 million. The funding rate is around 0. With the price below the follow-through line—that’s fact; with the J rebound—that’s also fact; treat these two things separately.
For the news side you can verify: Intel’s official press release on intc.com (published 2026-07-23). For FY2026 Q2, revenue is about $16.1 billion (YoY roughly +25%); on the product side, Client Computing is about $8.9 billion (YoY +13%), and Data Center and AI is about $6.3 billion (YoY +59%). Non-GAAP diluted EPS is about $0.42; GAAP diluted EPS is about -$2.16 (including non-operating items such as changes in the value of Escrowed Shares). By segment, Intel Foundry revenue is about $5.8 billion, with an operating loss of about $2.09 billion—its foundry business is still burning cash; revenue growth doesn’t automatically mean Foundry is profitable. Third-quarter revenue guidance is about $15.8B to $16.8B. The earnings release says demand and execution are improving; if the after-hours trading breaks the follow-through line by 1 hour, it only tells you about the short-term position—it can’t be directly translated into “the turnaround story is already priced in.”
Break the follow-through line first, then talk about the next step; it’s too early to talk now.
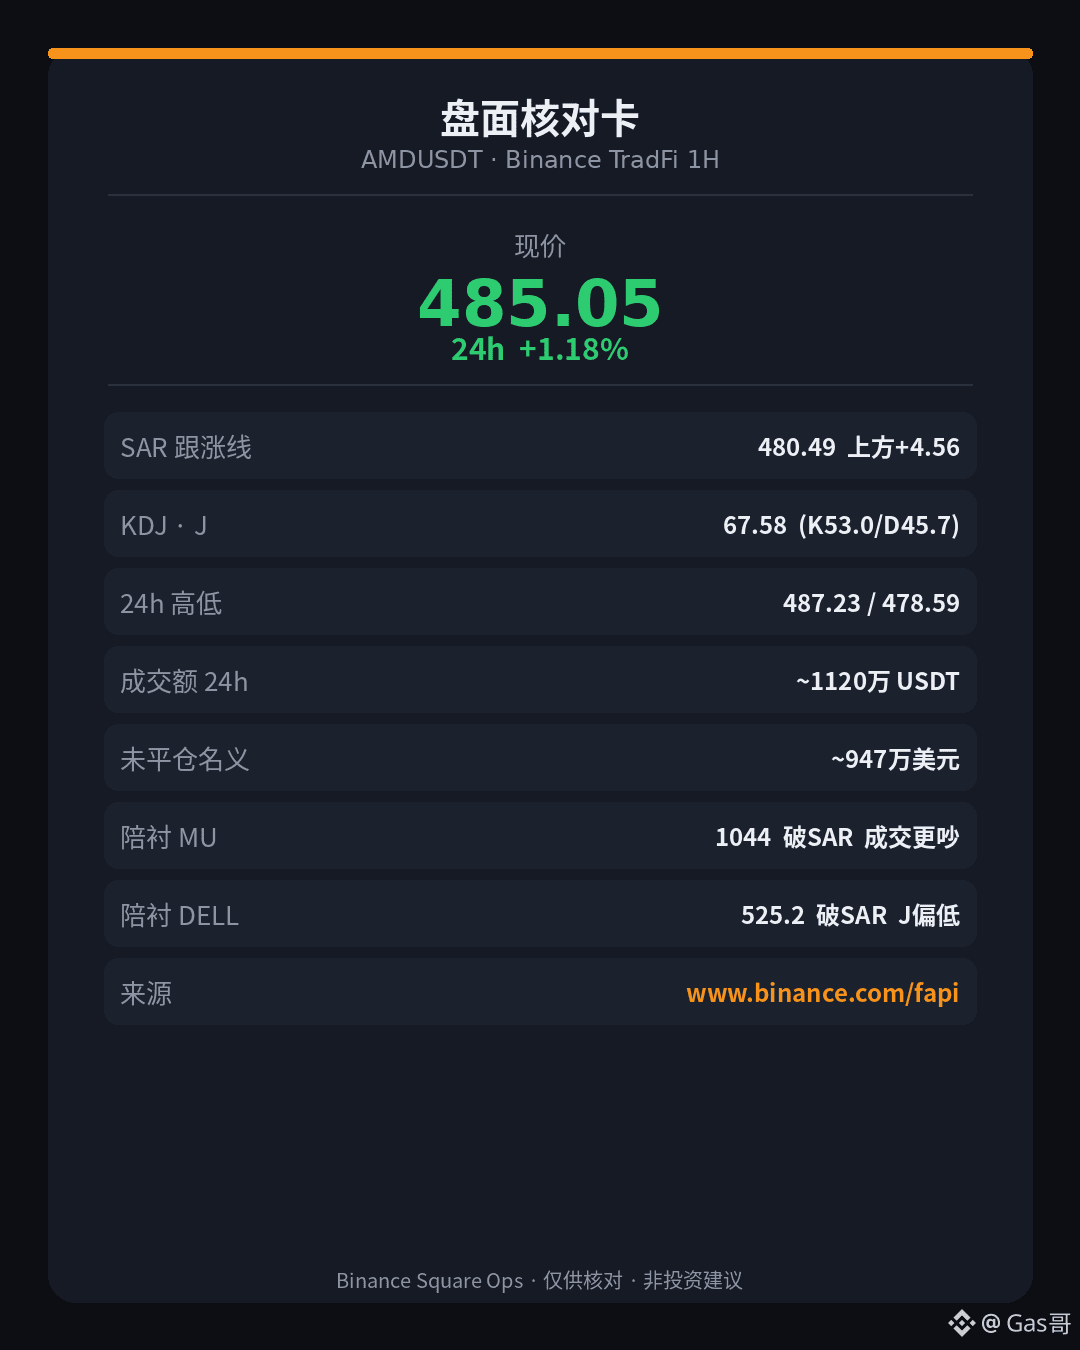
Revenue at data centers has more than doubled year over year—this performance is solid; the after-hours contract just crossed above the uptrend-following line, and the J value is already a bit overheated—what’s impressive is the earnings, what’s risky is the momentum. Don’t weld yourself to the idea of “buying now just because it’s up.”
Main contract $AMD : Binance TradFi perpetual mark price around 485.05, up about 1.18% over the past 24 hours; volume roughly 11.2 million USDT. The follow line (SAR) is about 480.49; price is about 4.56 above it—short-term support is still there for now. Momentum J value 67.58 (K 53.00 / D 45.72): it’s like stepping on the gas a bit too hard—this isn’t the type of oversold rebound. 24-hour high 487.23, low 478.59; the recent two-day peak is right around 487, and resistance overhead is very close. Open interest about 19.5k contracts; nominal value based on the mark price about 9.47 million USD; funding rate about 0. Being above the follow line is a fact, and J being hot is also a fact—don’t read the two together as one.
Side-by-side comparison: $MU current price about 1044.13, up about 2.42% in 24 hours; volume around 135 million USDT—about 12x AMD, noticeably louder. Follow line about 1045.44; price has already dropped to roughly 1.31 below it. J value 68.95, also on the hot side. $DELL current price about 525.20, almost flat over 24 hours (+0.16%); volume about 5.68 million; follow line about 526.56; price about 1.36 below it. J value 29.38—momentum is much cooler. Same hardware chain: AMD just crossed above the line, MU trades the loudest yet breaks the line, DELL is quieter—“trading louder” doesn’t mean the structure is moving in the same direction.
News you can verify: AMD official press release / SEC EX-99.1 (2026-08-04)—FY2026 Q2 revenue about $11.5 billion (YoY about +50%); Data Center segment about $6.7 billion (YoY about +107%), accounting for about 58% of company revenue. Non-GAAP gross margin about 56%; diluted EPS about $1.66. The company’s guidance for Q3 revenue about $13.0 billion (plus/minus $300 million), non-GAAP gross margin about 56%. The same release also discloses a partnership with Anthropic: plans to deploy up to about 2 gigawatts of MI450-series GPUs into Helios racks. Earnings and guidance are “what’s already happened + expectations”; for the after-hours 1-hour chart being above the line only tells you the short-term position—you can’t directly translate that into “the guidance has already been fully priced in.”
Let’s wait for the next confirmed K candle; if you don’t see it, then hold off first.
Main contract $AMD : Binance TradFi perpetual mark price around 485.05, up about 1.18% over the past 24 hours; volume roughly 11.2 million USDT. The follow line (SAR) is about 480.49; price is about 4.56 above it—short-term support is still there for now. Momentum J value 67.58 (K 53.00 / D 45.72): it’s like stepping on the gas a bit too hard—this isn’t the type of oversold rebound. 24-hour high 487.23, low 478.59; the recent two-day peak is right around 487, and resistance overhead is very close. Open interest about 19.5k contracts; nominal value based on the mark price about 9.47 million USD; funding rate about 0. Being above the follow line is a fact, and J being hot is also a fact—don’t read the two together as one.
Side-by-side comparison: $MU current price about 1044.13, up about 2.42% in 24 hours; volume around 135 million USDT—about 12x AMD, noticeably louder. Follow line about 1045.44; price has already dropped to roughly 1.31 below it. J value 68.95, also on the hot side. $DELL current price about 525.20, almost flat over 24 hours (+0.16%); volume about 5.68 million; follow line about 526.56; price about 1.36 below it. J value 29.38—momentum is much cooler. Same hardware chain: AMD just crossed above the line, MU trades the loudest yet breaks the line, DELL is quieter—“trading louder” doesn’t mean the structure is moving in the same direction.
News you can verify: AMD official press release / SEC EX-99.1 (2026-08-04)—FY2026 Q2 revenue about $11.5 billion (YoY about +50%); Data Center segment about $6.7 billion (YoY about +107%), accounting for about 58% of company revenue. Non-GAAP gross margin about 56%; diluted EPS about $1.66. The company’s guidance for Q3 revenue about $13.0 billion (plus/minus $300 million), non-GAAP gross margin about 56%. The same release also discloses a partnership with Anthropic: plans to deploy up to about 2 gigawatts of MI450-series GPUs into Helios racks. Earnings and guidance are “what’s already happened + expectations”; for the after-hours 1-hour chart being above the line only tells you the short-term position—you can’t directly translate that into “the guidance has already been fully priced in.”
Let’s wait for the next confirmed K candle; if you don’t see it, then hold off first.
AI semiconductor revenue on the ledger more than doubled year-over-year, but in the 1-hour chart the price even first stepped through the follow-up line—what stands out is the earnings report, what breaks is the price action. Don’t weld them into one thing.
Main contract $AVGO : Binance TradFi perpetual mark price around 362.33, still up about 0.25% over the past 24 hours, with trading volume roughly 8.78 million USDT. The follow-up line (SAR) is around 364.03, and price has already dropped about 1.7 below it—short-term support has been broken. Momentum J value is 27.41 (K33.47/D36.50); it’s not oversold, but the “throttle” has clearly loosened. 24-hour high 364.84, low 360.14; the recent two-day high is about 364.84—overhead pressure is right in front of you. Open interest about 61.8k contracts; notional value at the mark price about $22.39 million. Funding rate about 0. (Position thickness is still there, but price is grinding below the follow-up line.)
Side-by-side comparison: $INTC current price around 97.88, up about 0.78% in 24 hours, trading volume about 49.27 million—roughly more than 5 times AVGO, and it’s noisier. The follow-up line is around 99.09, and price is about 1.2 below it; J value is 21.10. Both are semiconductor contracts: INTC is busier in trading, AVGO’s earnings narrative is “harder,” yet on both sides they’ve both broken the follow-up line—high volume doesn’t necessarily mean the structure is strong.
News you can verify: Broadcom’s official/PR Newswire disclosure on 2026-09-02 said that for fiscal 2026 Q3 (as of August 2), revenue was about $29.6 billion (YoY about +86%). CEO Hock Tan’s words: AI semiconductor revenue about $16.7 billion (YoY +221%, QoQ +54%), and the company expects AI semiconductors in Q4 to be about $21.7 billion (YoY +236%). The company guidance for total revenue in Q4 is about $34.8 billion (YoY +93%); quarterly dividend is $0.65 per share, record date September 21 and payment date September 30. Earnings numbers are the existing results; even if guidance looks great, it doesn’t mean the 1-hour structure has already held.
The upside move you see, and the persistence the market is willing to give, are often not the same thing.
Main contract $AVGO : Binance TradFi perpetual mark price around 362.33, still up about 0.25% over the past 24 hours, with trading volume roughly 8.78 million USDT. The follow-up line (SAR) is around 364.03, and price has already dropped about 1.7 below it—short-term support has been broken. Momentum J value is 27.41 (K33.47/D36.50); it’s not oversold, but the “throttle” has clearly loosened. 24-hour high 364.84, low 360.14; the recent two-day high is about 364.84—overhead pressure is right in front of you. Open interest about 61.8k contracts; notional value at the mark price about $22.39 million. Funding rate about 0. (Position thickness is still there, but price is grinding below the follow-up line.)
Side-by-side comparison: $INTC current price around 97.88, up about 0.78% in 24 hours, trading volume about 49.27 million—roughly more than 5 times AVGO, and it’s noisier. The follow-up line is around 99.09, and price is about 1.2 below it; J value is 21.10. Both are semiconductor contracts: INTC is busier in trading, AVGO’s earnings narrative is “harder,” yet on both sides they’ve both broken the follow-up line—high volume doesn’t necessarily mean the structure is strong.
News you can verify: Broadcom’s official/PR Newswire disclosure on 2026-09-02 said that for fiscal 2026 Q3 (as of August 2), revenue was about $29.6 billion (YoY about +86%). CEO Hock Tan’s words: AI semiconductor revenue about $16.7 billion (YoY +221%, QoQ +54%), and the company expects AI semiconductors in Q4 to be about $21.7 billion (YoY +236%). The company guidance for total revenue in Q4 is about $34.8 billion (YoY +93%); quarterly dividend is $0.65 per share, record date September 21 and payment date September 30. Earnings numbers are the existing results; even if guidance looks great, it doesn’t mean the 1-hour structure has already held.
The upside move you see, and the persistence the market is willing to give, are often not the same thing.
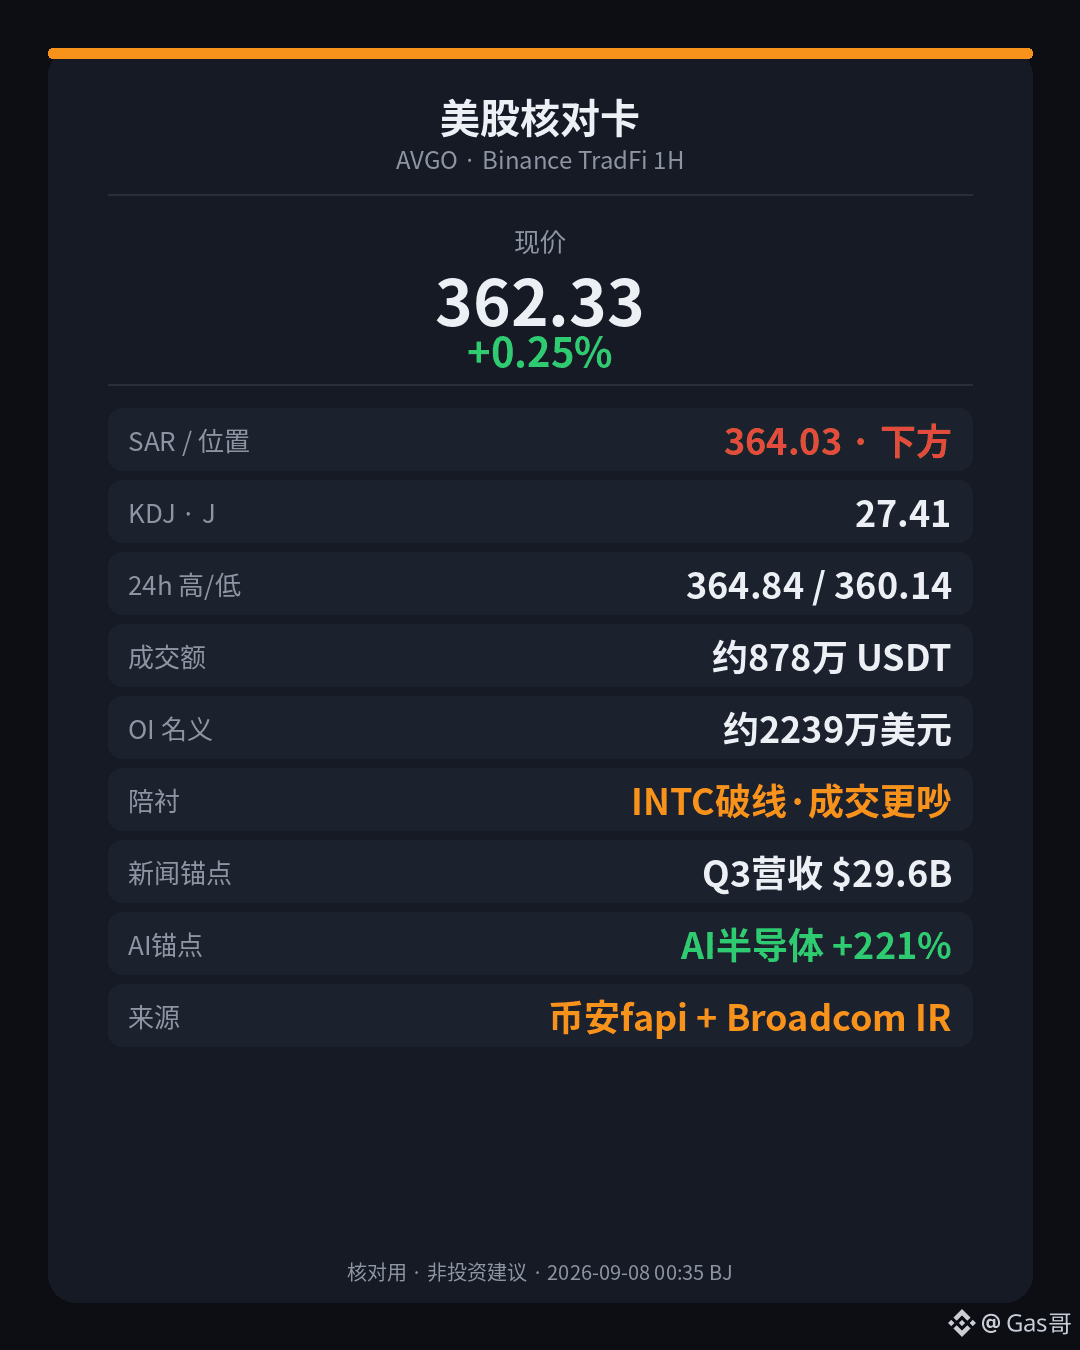
Log in to explore more content