

Ceo_crypto25
18.1k Posts

Ceo_crypto25
 Square Verified+
Report
Block User
Crypto Content Creator And Trader| X (Twitter) @Ceo_crypto25| DM For Collabo| Binance Square Two Times Best Creator Of Year

Creator Awards 2024

#BinanceTurns7 task 2

#BinanceTurns7
42 Following
64.7K+ Followers
92.4K+ Liked
4 Badges
Posts
All
Quotes
Videos
Live
PINNED
·
--
Bullish
Hello My People,
I'm currently Nominee in Blockchain 100 Awards 2026. please Vote For Me
[CLICK HERE TO VOTE FOR ME](https://app.binance.com/uni-qr/cact26user/626?uc=app_square_share_link&us=copylink)
let's bring it home as usual let's Go Guys
Hello My People,
I'm currently Nominee in Blockchain 100 Awards 2026. please Vote For Me
CLICK HERE TO VOTE FOR ME
let's bring it home as usual let's Go Guys
I'm currently Nominee in Blockchain 100 Awards 2026. please Vote For Me
CLICK HERE TO VOTE FOR ME
let's bring it home as usual let's Go Guys

36
11
592
PINNED
·
--
Bullish
When Will You Join VIP Community To Got First Signal Like $LUNC $VELVET $SIREN That's Make Huge Profits Today...
VIP Community They Enjoy Profits First
[Click Here To Join VVIP Community Signals](https://app.binance.com/uni-qr/group-chat-landing?channelToken=5-GGKAAqBHMNE2wFUAwRTg&type=1&entrySource=sharing_link)
When Will You Join VIP Community To Got First Signal Like $LUNC $VELVET $SIREN That's Make Huge Profits Today...
VIP Community They Enjoy Profits First
Click Here To Join VVIP Community Signals
VIP Community They Enjoy Profits First
Click Here To Join VVIP Community Signals

14
4
30
1k
·
--
Bullish
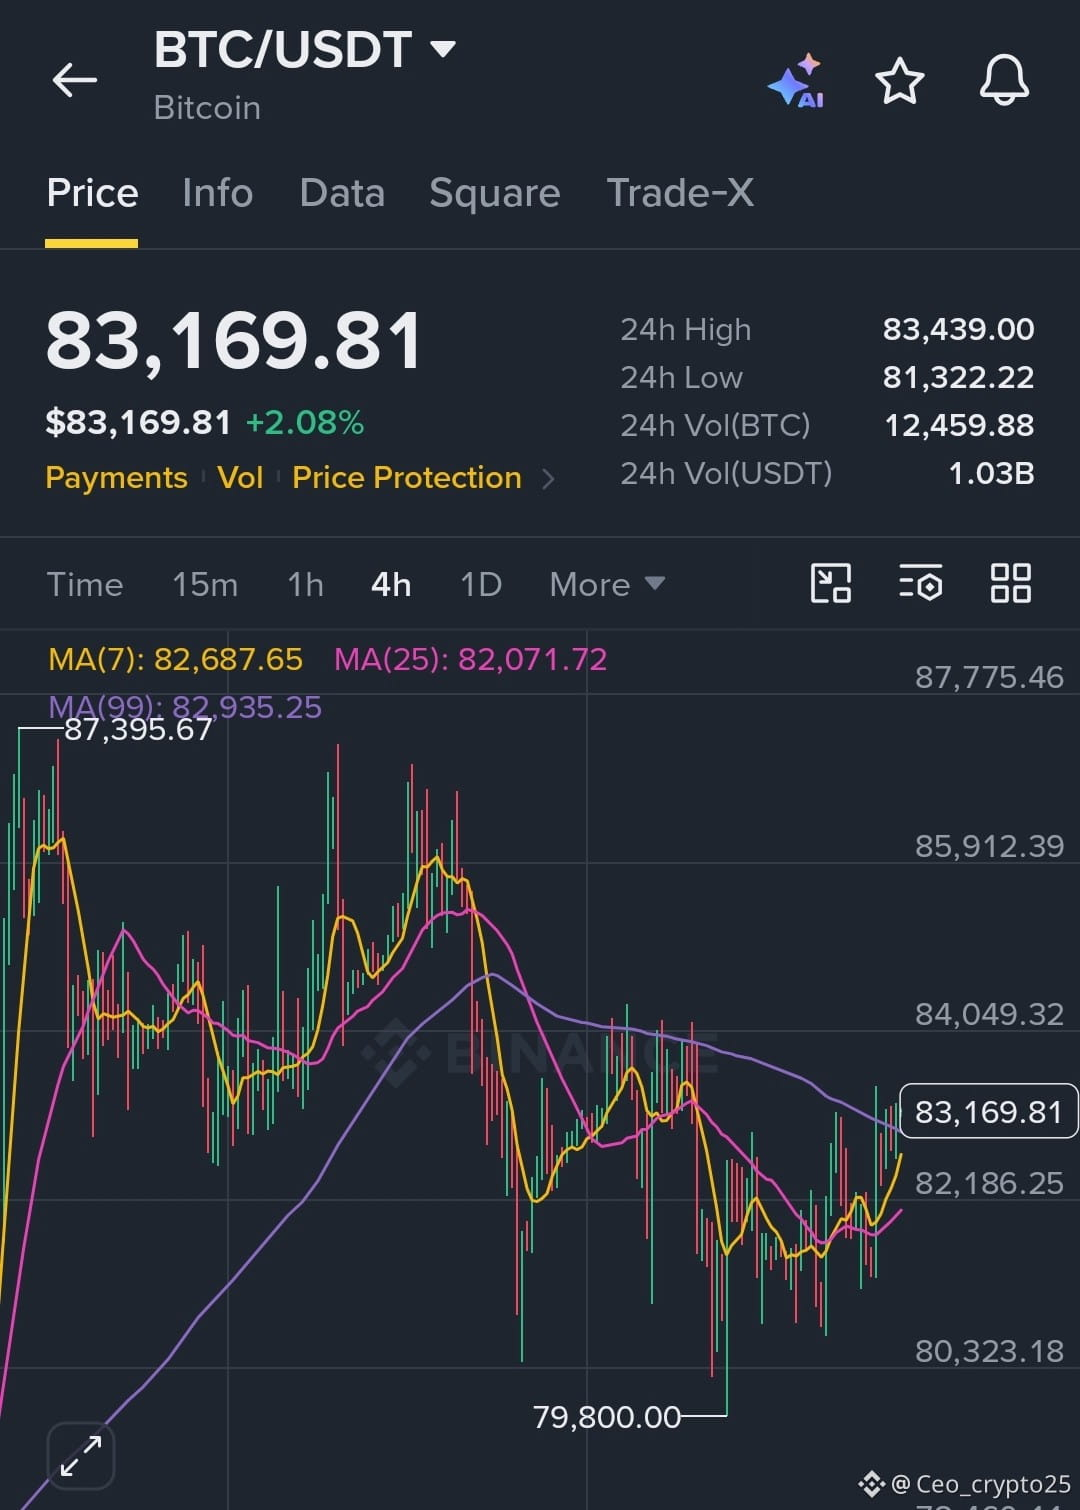
$BTC TESTS MA99 Reclaim Attempt Underway
Pair: $BTC /USDT
Direction: LONG
Entry: 83,169.81
TP1: 84,049.32 +1.1%
TP2: 85,912.39 +3.3%
TP3: 87,395.67 +5.1%
SL: 81,800.00
$BTC
{future}(BTCUSDT)
[Click Here To VOTE For Me](https://app.binance.com/uni-qr/cact26user/626?uc=app_square_share_link&us=copylink)
$BTC TESTS MA99 Reclaim Attempt Underway
Pair: $BTC /USDT
Direction: LONG
Entry: 83,169.81
TP1: 84,049.32 +1.1%
TP2: 85,912.39 +3.3%
TP3: 87,395.67 +5.1%
SL: 81,800.00
$BTC
Click Here To VOTE For Me
Pair: $BTC /USDT
Direction: LONG
Entry: 83,169.81
TP1: 84,049.32 +1.1%
TP2: 85,912.39 +3.3%
TP3: 87,395.67 +5.1%
SL: 81,800.00
$BTC
Click Here To VOTE For Me
1
275
·
--
Bullish
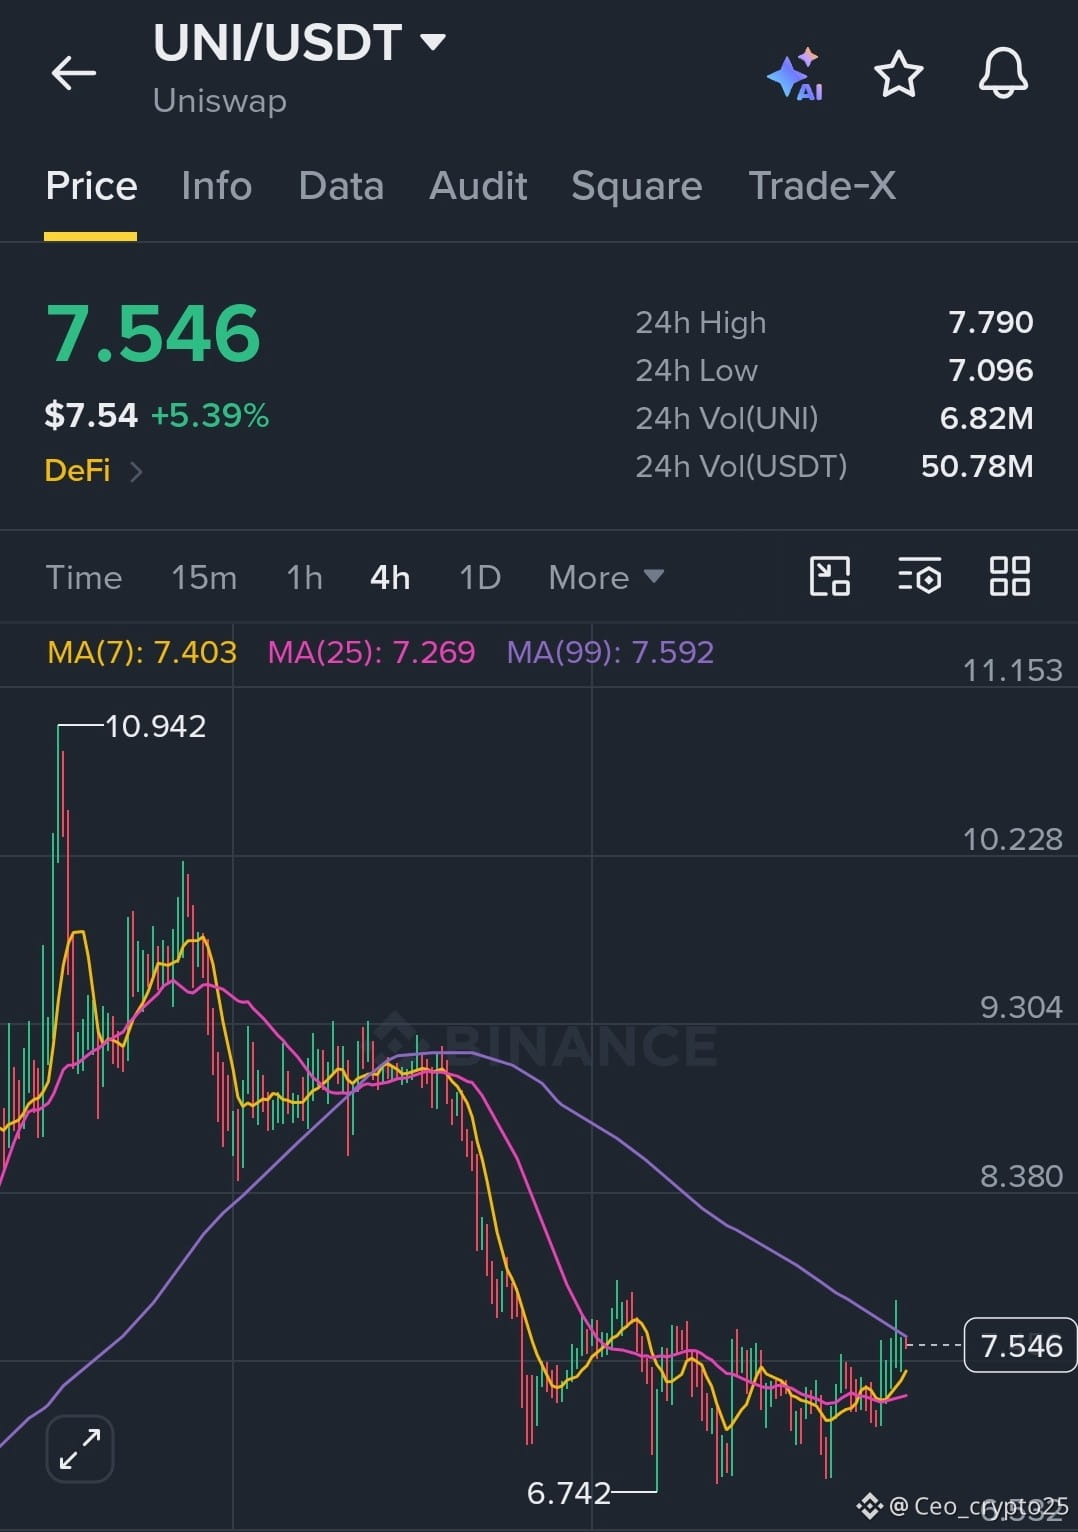
TRADE SIGNAL: $UNI /USDT
[Just Vote For Me Today](https://app.binance.com/uni-qr/cact26user/626?uc=app_square_share_link&us=copylink)
Direction: LONG 🟢
$UNI /USDT
Entry Zone: $7.400 – $7.550
Take-Profit Targets:
TP 1: $7.790
TP 2: $8.380
TP 3: $9.300
TP 4: $10.200
Stop-Loss (SL): $7.150
$UNI
{future}(UNIUSDT)
TRADE SIGNAL: $UNI /USDT
Just Vote For Me Today
Direction: LONG 🟢
$UNI /USDT
Entry Zone: $7.400 – $7.550
Take-Profit Targets:
TP 1: $7.790
TP 2: $8.380
TP 3: $9.300
TP 4: $10.200
Stop-Loss (SL): $7.150
$UNI
Just Vote For Me Today
Direction: LONG 🟢
$UNI /USDT
Entry Zone: $7.400 – $7.550
Take-Profit Targets:
TP 1: $7.790
TP 2: $8.380
TP 3: $9.300
TP 4: $10.200
Stop-Loss (SL): $7.150
$UNI
1
305
·
--
Bullish
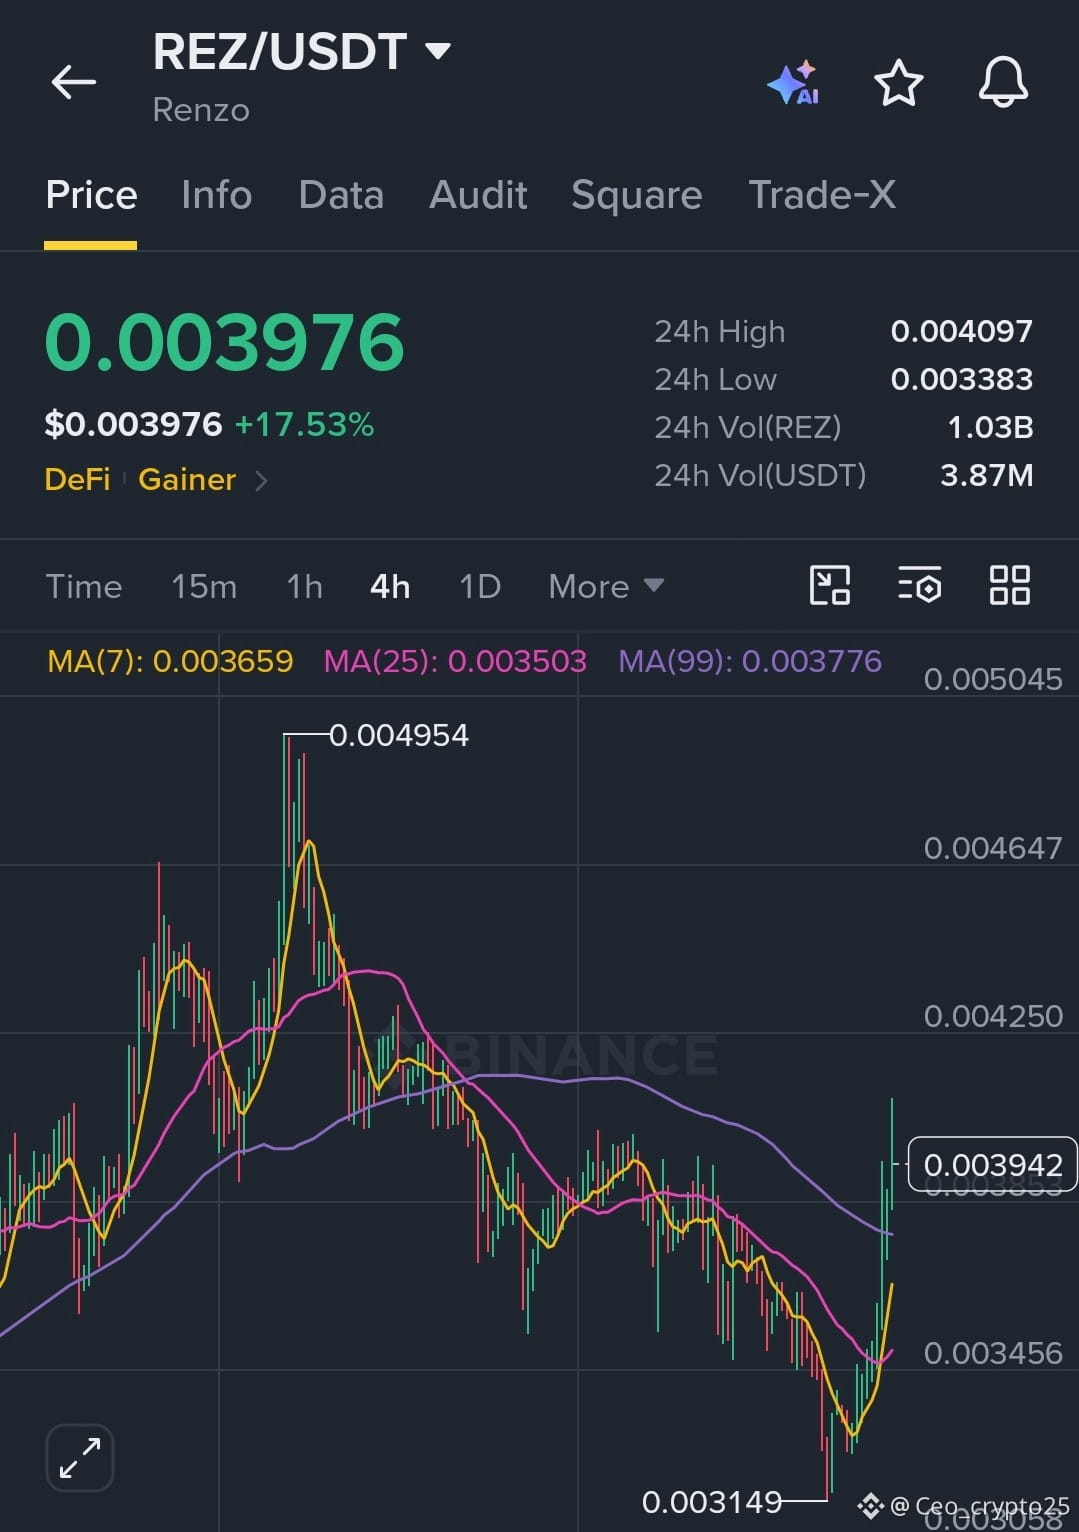
TRADE SIGNAL $REZ /USDT
Direction: LONG 🟢
$REZ /USDT
Entry Zone: $0.003850 – $0.003980
Take-Profit Targets:
TP 1: $0.004097
TP 2: $0.004250
TP 3: $0.004650
TP 4: $0.004950
Stop-Loss (SL): $0.003600
$REZ
{future}(REZUSDT)
TRADE SIGNAL $REZ /USDT
Direction: LONG 🟢
$REZ /USDT
Entry Zone: $0.003850 – $0.003980
Take-Profit Targets:
TP 1: $0.004097
TP 2: $0.004250
TP 3: $0.004650
TP 4: $0.004950
Stop-Loss (SL): $0.003600
$REZ
Direction: LONG 🟢
$REZ /USDT
Entry Zone: $0.003850 – $0.003980
Take-Profit Targets:
TP 1: $0.004097
TP 2: $0.004250
TP 3: $0.004650
TP 4: $0.004950
Stop-Loss (SL): $0.003600
$REZ
2
281
·
--
Bullish
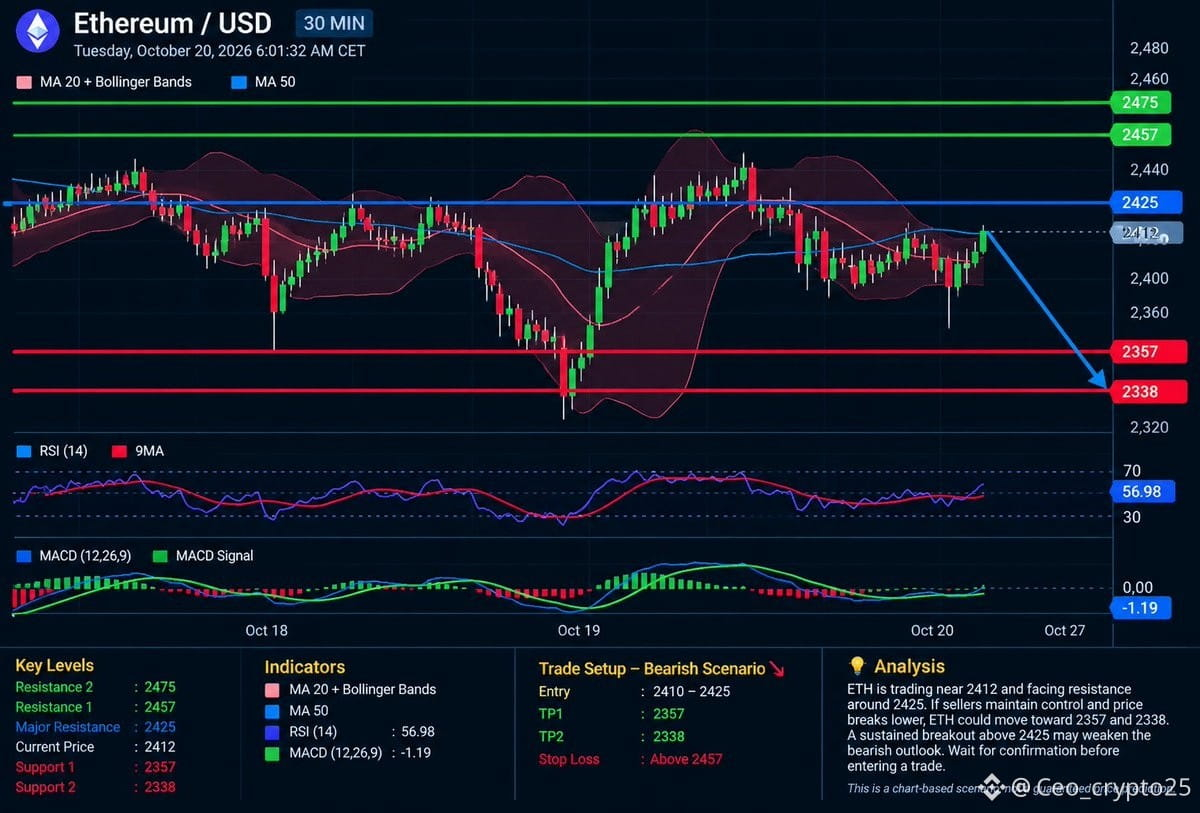
TRADE SIGNAL: $ETH /USD
Direction: SHORT 🔴
$ETH /USD
Key Levels & Strategy
Entry Zone: $2,410 – $2,425
Take-Profit Targets:
TP 1: $2,357
TP 2: $2,338
Stop-Loss: $2,457
$ETH
[Click Here To VOTE for Rising Star](https://app.binance.com/uni-qr/cact26user/626?uc=app_square_share_link&us=copylink)
{future}(ETHUSDT)
TRADE SIGNAL: $ETH /USD
Direction: SHORT 🔴
$ETH /USD
Key Levels & Strategy
Entry Zone: $2,410 – $2,425
Take-Profit Targets:
TP 1: $2,357
TP 2: $2,338
Stop-Loss: $2,457
$ETH
Click Here To VOTE for Rising Star
Direction: SHORT 🔴
$ETH /USD
Key Levels & Strategy
Entry Zone: $2,410 – $2,425
Take-Profit Targets:
TP 1: $2,357
TP 2: $2,338
Stop-Loss: $2,457
$ETH
Click Here To VOTE for Rising Star
2
167
·
--
Bullish
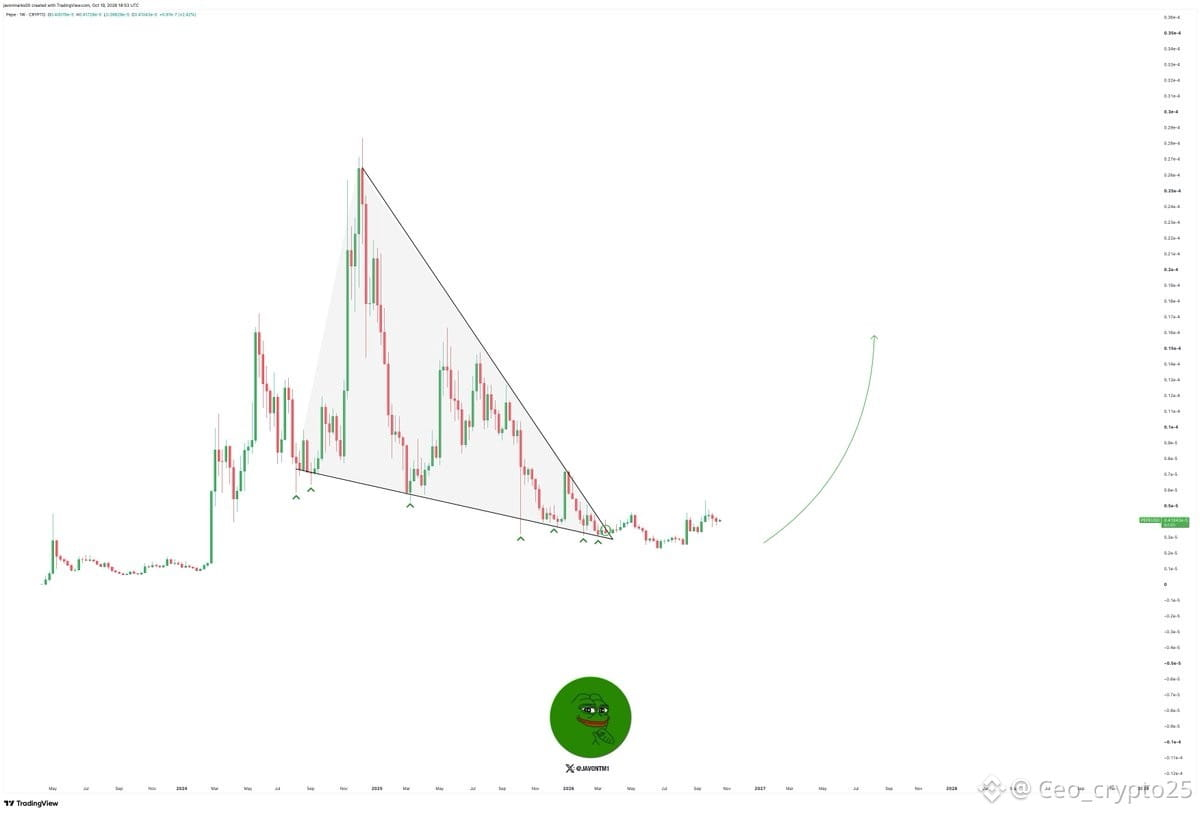
TRADE SIGNAL $PEPE /USDT
Direction: LONG 🟢
$PEPE /USDT
Technical Overview
Descending Wedge Breakout: Price completed a multi-month falling wedge pattern, breaking above the primary descending trendline resistance.
Macro Higher Lows: Following the breakout, PEPE has completed its retest of the wedge boundary and is establishing higher lows above key support.
Parabolic Projection: The macro technical pattern indicates a major multi-month expansion phase toward previous all-time highs and new resistance zones.
[Click Here To VOTE for Rising Star Awards](https://app.binance.com/uni-qr/cact26user/626?uc=app_square_share_link&us=copylink)
$PEPE
{spot}(PEPEUSDT)
TRADE SIGNAL $PEPE /USDT
Direction: LONG 🟢
$PEPE /USDT
Technical Overview
Descending Wedge Breakout: Price completed a multi-month falling wedge pattern, breaking above the primary descending trendline resistance.
Macro Higher Lows: Following the breakout, PEPE has completed its retest of the wedge boundary and is establishing higher lows above key support.
Parabolic Projection: The macro technical pattern indicates a major multi-month expansion phase toward previous all-time highs and new resistance zones.
Click Here To VOTE for Rising Star Awards
$PEPE
3
181
·
--
Bullish
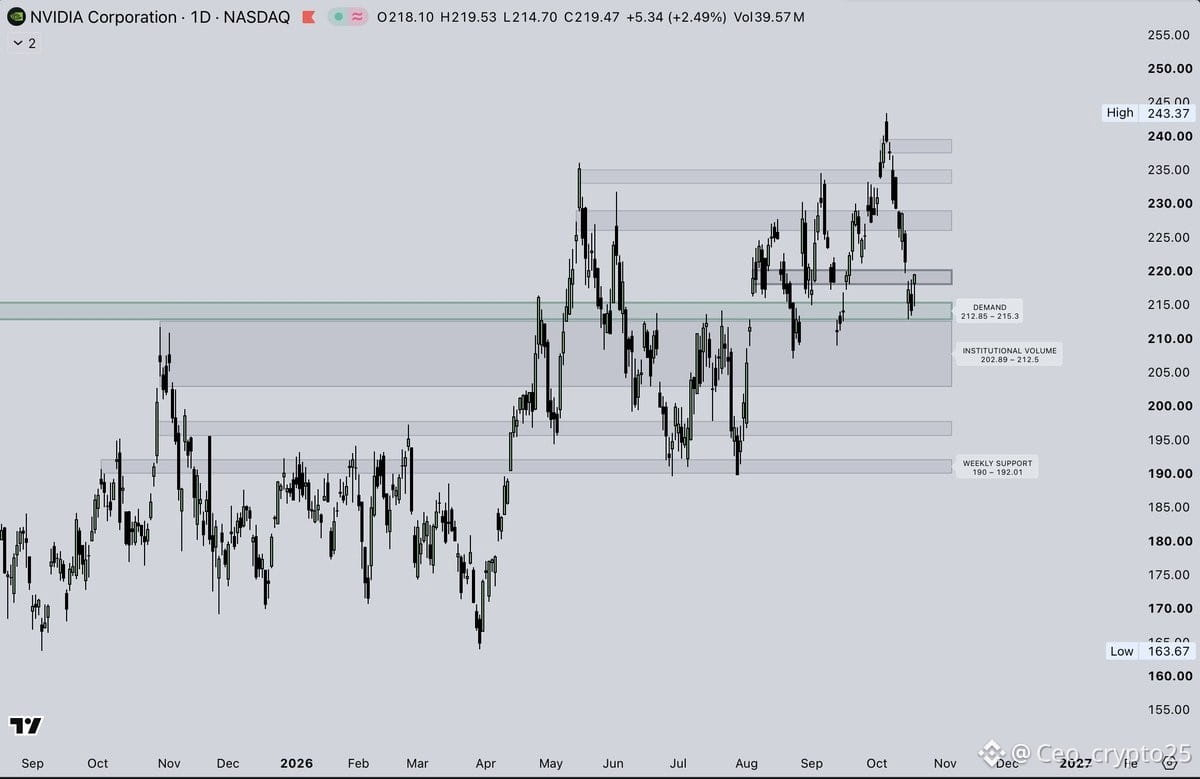
TRADE SIGNAL $NVDA
Direction: LONG 🟢
$NVDA Corporation
Entry Zone: $215.00 – $219.50
Take-Profit Targets:
TP 1: $228.00
TP 2: $234.00
TP 3: $243.37
TP 4: $250.00
Stop-Loss (SL): $202.00
$NVDA
[Click To VOTE for Rising Star](https://app.binance.com/uni-qr/cact26user/626?uc=app_square_share_link&us=copylink)
{future}(NVDAUSDT)
TRADE SIGNAL $NVDA
Direction: LONG 🟢
$NVDA Corporation
Entry Zone: $215.00 – $219.50
Take-Profit Targets:
TP 1: $228.00
TP 2: $234.00
TP 3: $243.37
TP 4: $250.00
Stop-Loss (SL): $202.00
$NVDA
Click To VOTE for Rising Star
Direction: LONG 🟢
$NVDA Corporation
Entry Zone: $215.00 – $219.50
Take-Profit Targets:
TP 1: $228.00
TP 2: $234.00
TP 3: $243.37
TP 4: $250.00
Stop-Loss (SL): $202.00
$NVDA
Click To VOTE for Rising Star
1
111
·
--
Bullish
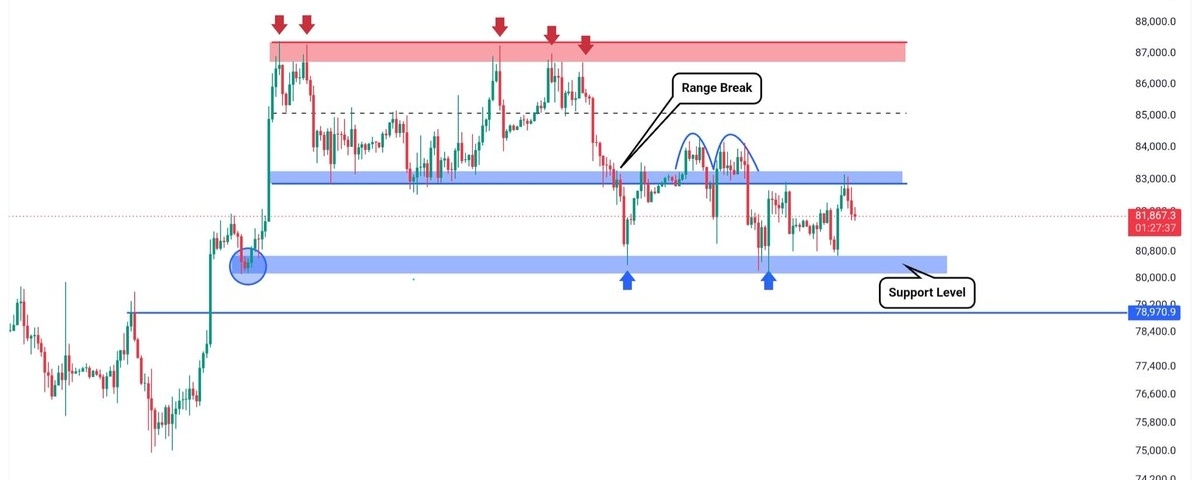
[Click To VOTE for Rising Star Awards](https://app.binance.com/uni-qr/cact26user/626?uc=app_square_share_link&us=copylink)
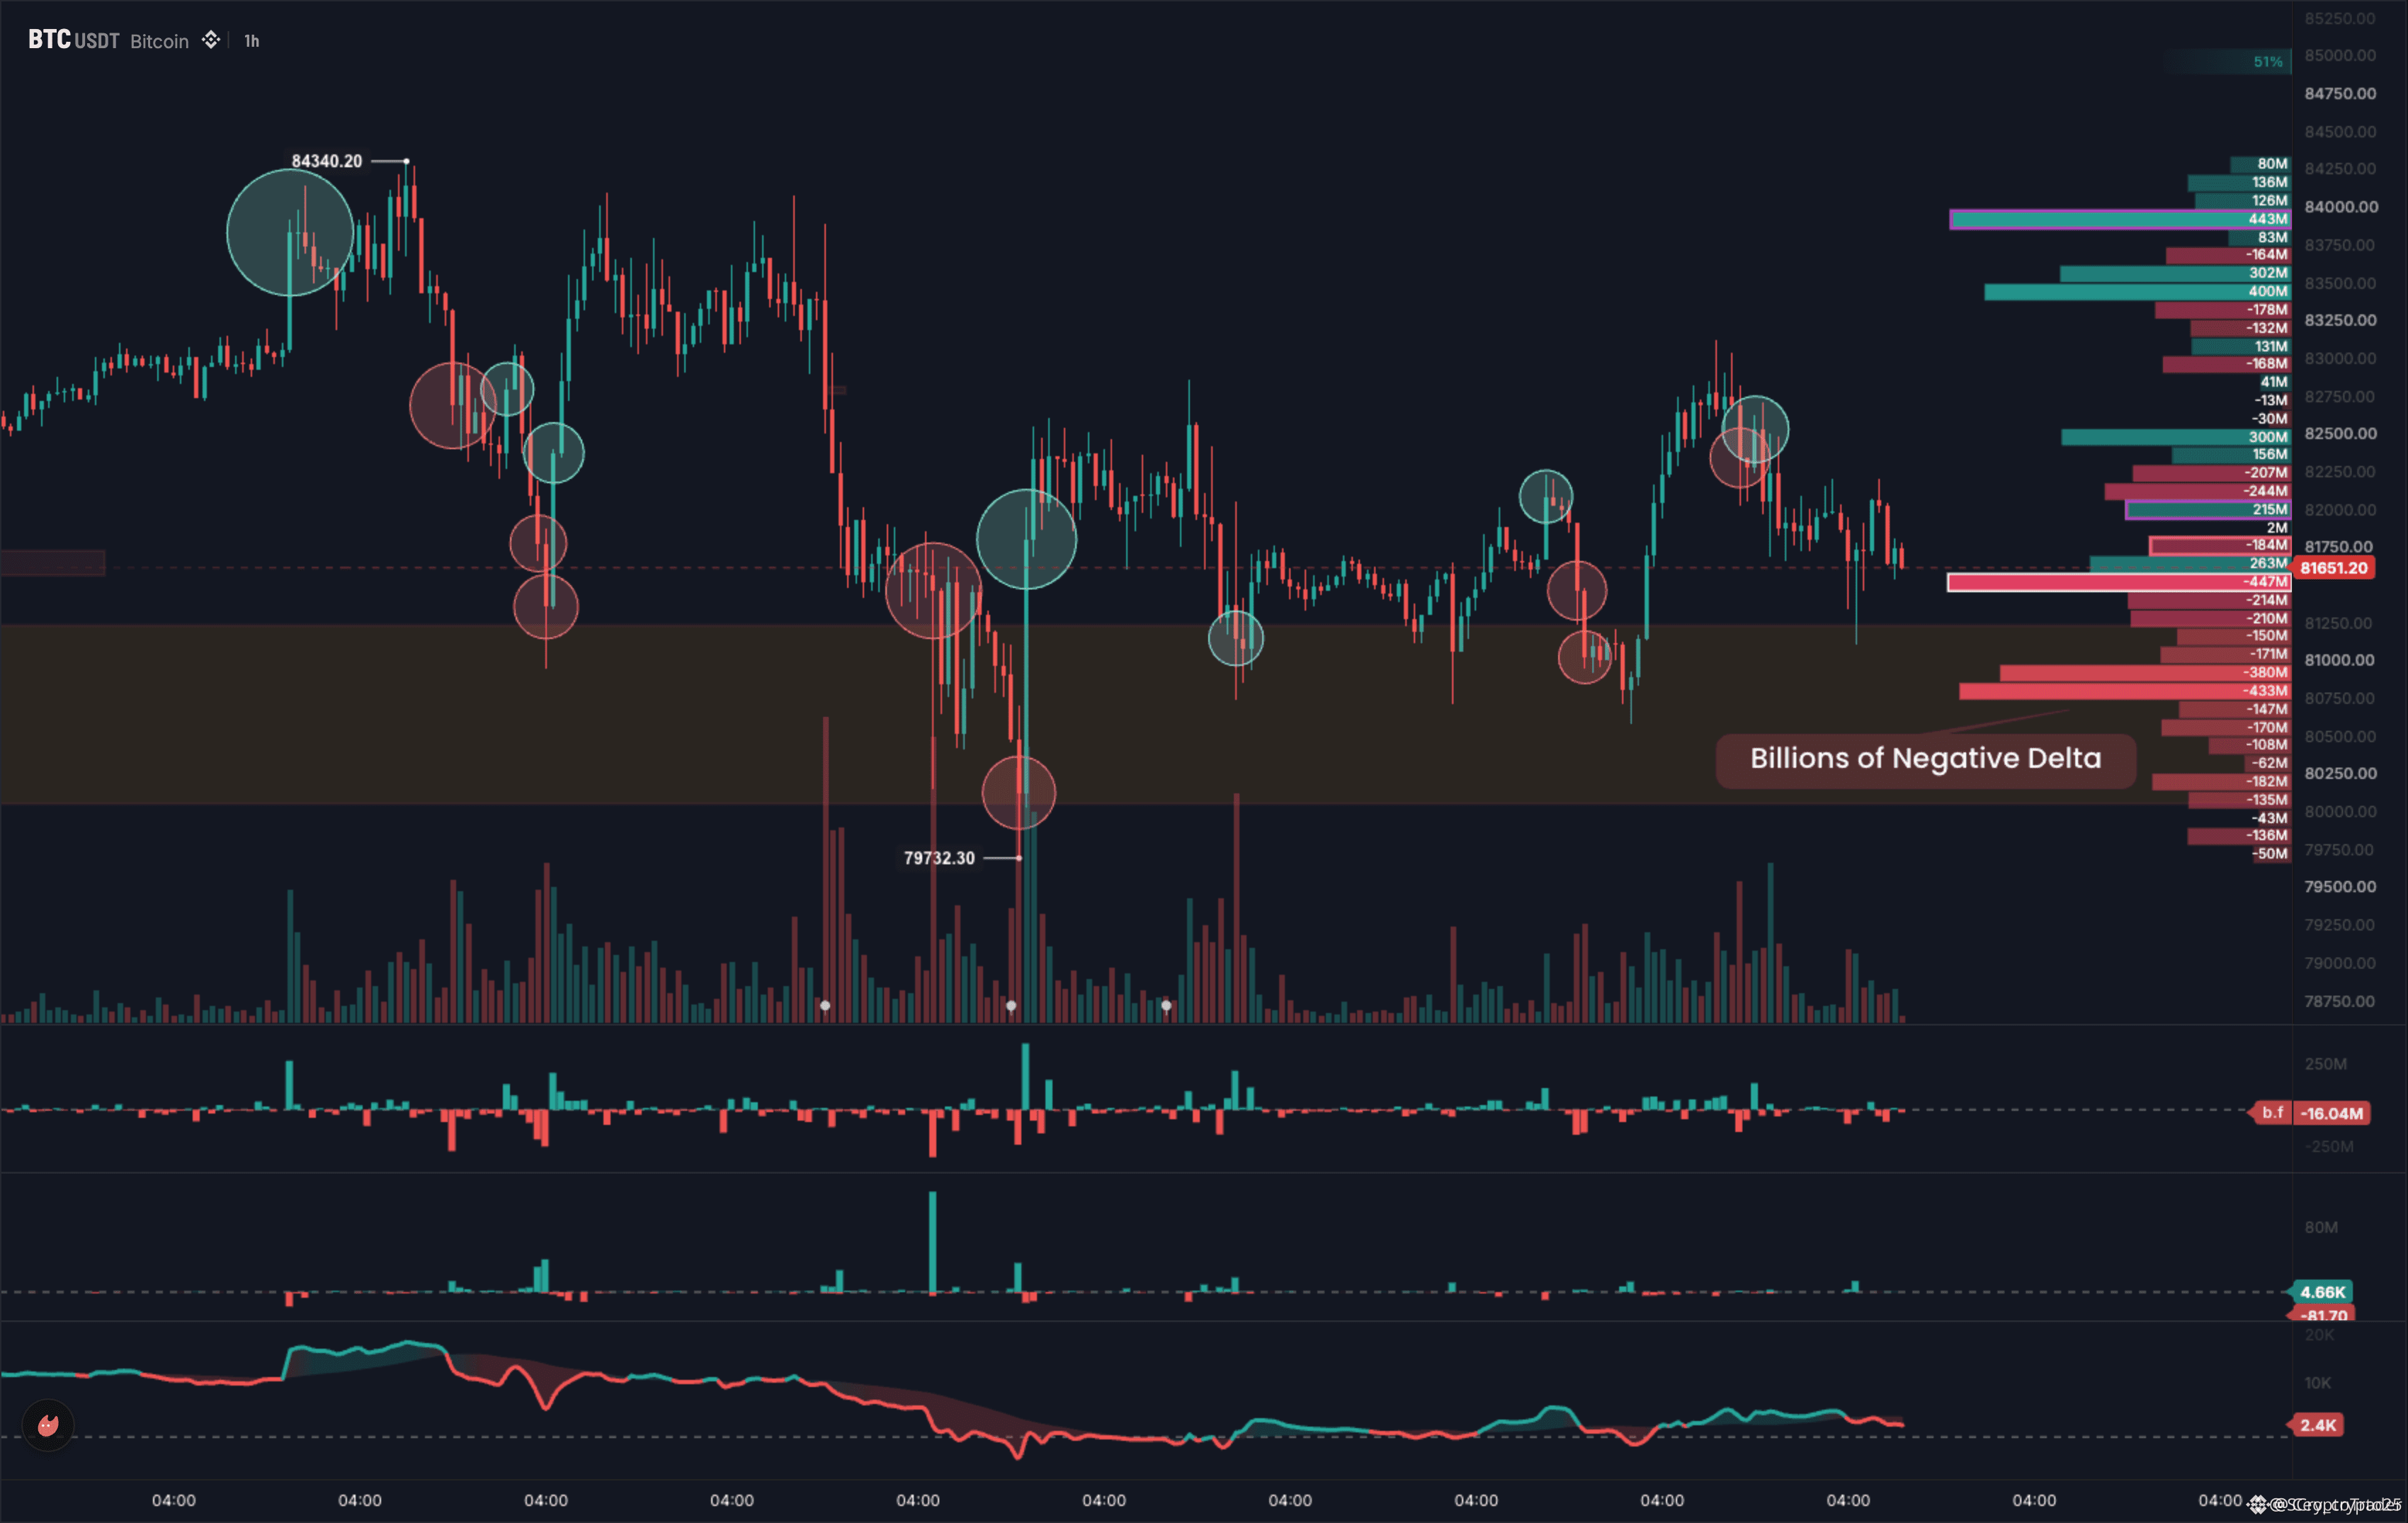
$BTC Order Flow: Price Sitting in "Billions of Negative Delta" Zone
$BTC /USDT
Direction: SHORT
Entry: 81,651.20
TP1: 81,000.00 0.8%
TP2: 79,732.30 2.4%
TP3: 78,750.00 3.6%
SL: 82,500.00
$BTC
{future}(BTCUSDT)
Click To VOTE for Rising Star Awards
$BTC Order Flow: Price Sitting in "Billions of Negative Delta" Zone
$BTC /USDT
Direction: SHORT
Entry: 81,651.20
TP1: 81,000.00 0.8%
TP2: 79,732.30 2.4%
TP3: 78,750.00 3.6%
SL: 82,500.00
$BTC
$BTC Order Flow: Price Sitting in "Billions of Negative Delta" Zone
$BTC /USDT
Direction: SHORT
Entry: 81,651.20
TP1: 81,000.00 0.8%
TP2: 79,732.30 2.4%
TP3: 78,750.00 3.6%
SL: 82,500.00
$BTC
1
110
·
--
Bullish
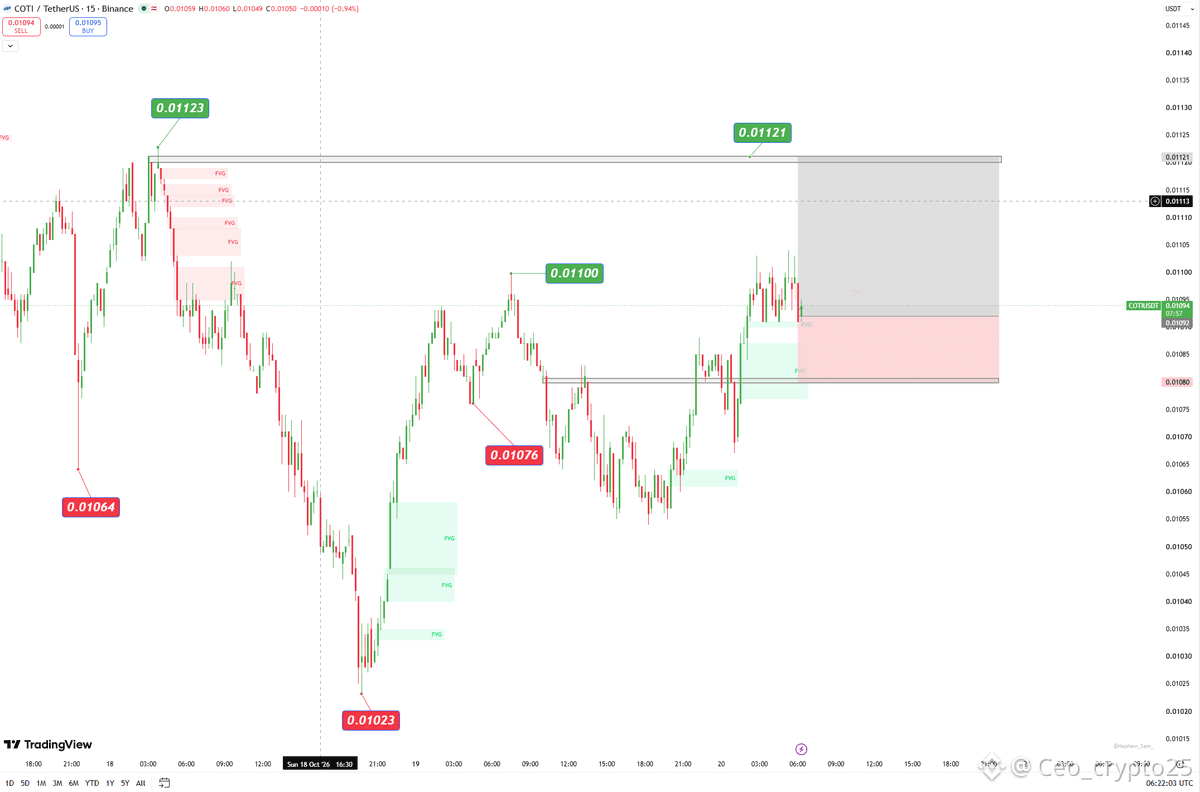
TRADE SIGNAL $COTI /USDT
Direction: LONG 🟢
$COTI /USDT
Entry Zone: $0.01085 – $0.01094
Take-Profit Targets:
TP 1: $0.01100
TP 2: $0.01113
TP 3: $0.01121
TP 4: $0.01123
Stop-Loss (SL): $0.01080
$COTI
[Vote For Rising Star Creator](https://app.binance.com/uni-qr/cact26user/626?uc=app_square_share_link&us=copylink)
{future}(COTIUSDT)
TRADE SIGNAL $COTI /USDT
Direction: LONG 🟢
$COTI /USDT
Entry Zone: $0.01085 – $0.01094
Take-Profit Targets:
TP 1: $0.01100
TP 2: $0.01113
TP 3: $0.01121
TP 4: $0.01123
Stop-Loss (SL): $0.01080
$COTI
Vote For Rising Star Creator
Direction: LONG 🟢
$COTI /USDT
Entry Zone: $0.01085 – $0.01094
Take-Profit Targets:
TP 1: $0.01100
TP 2: $0.01113
TP 3: $0.01121
TP 4: $0.01123
Stop-Loss (SL): $0.01080
$COTI
Vote For Rising Star Creator
1
206
·
--
Bullish
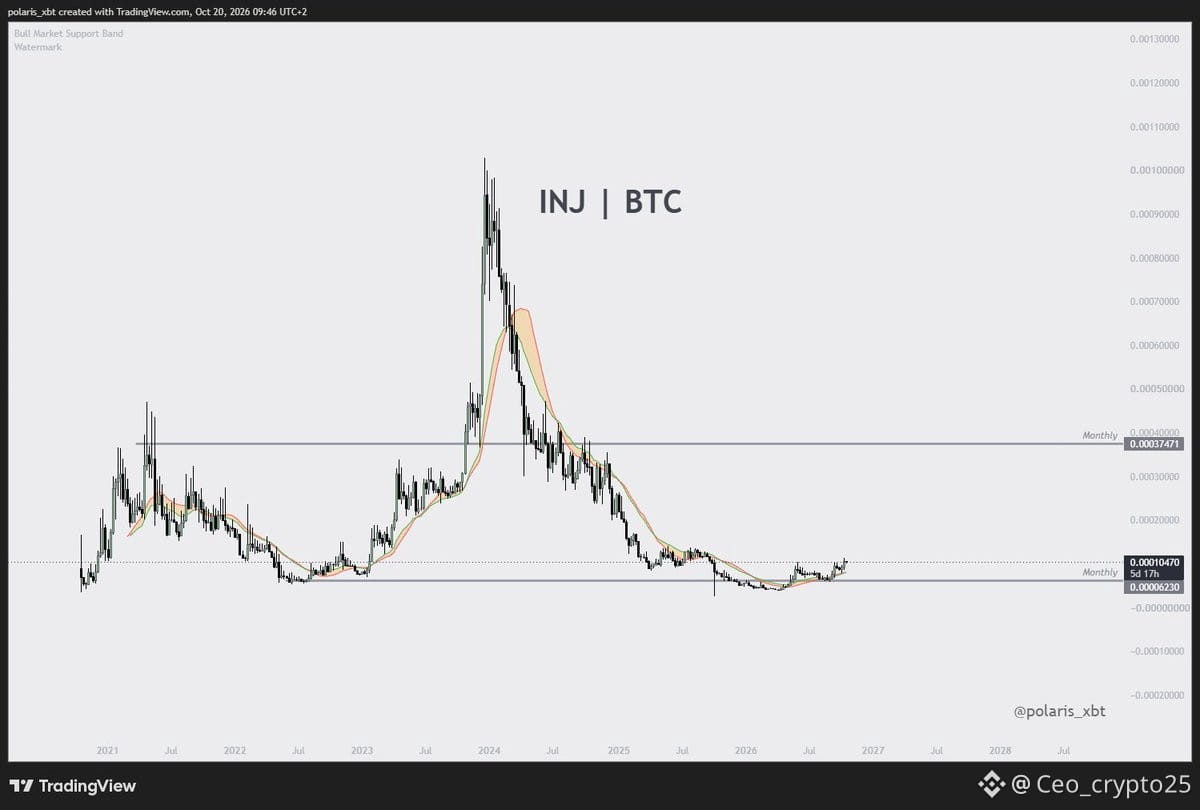
$INJ / BTC ratio chart (monthly timeframe, 2021-2028 view)
What it shows:
- INJ has been in a severe multi-year downtrend against BTC, falling from the 2023-24 cycle peak (~0.00104 high) down over 90% to current levels
- Price is now testing a key horizontal zone between 0.00006230 and 0.00010470 the same support band that held during the 2022 bear market low, making this a multi-year range floor
- Current price (0.00010470) is sitting right at the top of that historical support zone, with a small recent uptick the first sign of basing after a prolonged decline, but still well below the 0.00037471 monthly level (previous cycle structure) and nowhere near the old highs
- The Bull Market Support Band (orange/green) has flattened out near price, suggesting the long downtrend's momentum has slowed
long-term accumulation/reversal watch on the $INJ / $BTC pair rather than a trade signal it's the kind of chart used to argue INJ may be bottoming relative to BTC, not something with a 1h/4h entry-TP-SL structure.
[Click Here To VOTE For Rising Star](https://app.binance.com/uni-qr/cact26user/626?uc=app_square_share_link&us=copylink)
$INJ / BTC ratio chart (monthly timeframe, 2021-2028 view)
What it shows:
- INJ has been in a severe multi-year downtrend against BTC, falling from the 2023-24 cycle peak (~0.00104 high) down over 90% to current levels
- Price is now testing a key horizontal zone between 0.00006230 and 0.00010470 the same support band that held during the 2022 bear market low, making this a multi-year range floor
- Current price (0.00010470) is sitting right at the top of that historical support zone, with a small recent uptick the first sign of basing after a prolonged decline, but still well below the 0.00037471 monthly level (previous cycle structure) and nowhere near the old highs
- The Bull Market Support Band (orange/green) has flattened out near price, suggesting the long downtrend's momentum has slowed
long-term accumulation/reversal watch on the $INJ / $BTC pair rather than a trade signal it's the kind of chart used to argue INJ may be bottoming relative to BTC, not something with a 1h/4h entry-TP-SL structure.
Click Here To VOTE For Rising Star
1
145
·
--
Article
Bitcoin: When the King Moves, the Whole Crypto Kingdom ShakesBitcoin trades near $81,300 today, about 36% below its October 2025 record, yet it still controls roughly 60% of the entire crypto market, so almost every coin follows its lead.
Where Bitcoin stands today
Picture a football match where one player controls the ball most of the time. That player is Bitcoin (BTC). Everyone else on the pitch, from Ethereum to Solana to the smallest meme coin, reacts to what Bitcoin does.
Right now Bitcoin is quiet but tense. it near $81,300, down about 1.5% in 24 hours and about 3% in a week. Its all-time high was about $126,210, set in October 2025, so today's price sits roughly 36% below that peak. Even so, Bitcoin's market value is around $1.64 trillion, larger than all other cryptocurrencies put together (roughly $1.1 trillion between them).
[Please Vote For Me Today](https://app.binance.com/uni-qr/cact26user/626?uc=app_square_share_link&us=copylink)
There are about 20.1 million bitcoin in circulation out of a fixed maximum of 21 million. No government or bank can print more, which is a big reason many investors see it as "digital gold".
Why Bitcoin is the king: understanding dominance
Bitcoin dominance is simply Bitcoin's share of the whole crypto market. If the market is a pizza, dominance tells you how many slices Bitcoin owns.
In October 2026 that share is about 60%. it near 60.4%, with Bitcoin worth about $1.68 trillion inside a $2.78 trillion market. At the start of the month it was lower, near 58.6%, so money has been flowing back toward Bitcoin during this correction.
Three things keep Bitcoin on the throne:
• Trust and age. It is the oldest and most tested crypto, and the one big institutions are most comfortable buying.
• Scarcity. Only 21 million will ever exist, and about 20.1 million are already mined.
• ETFs. Funds that hold only Bitcoin (more on them below) send fresh money to BTC and not to altcoins.
Rule of thumb: when fear rises, people run to the "safest" crypto, Bitcoin, and dominance goes up. When confidence is high, people take more risk on altcoins and dominance usually falls.
How Bitcoin's moves hit the rest of the market
Think of the crypto market as the sea and Bitcoin as the tide. When the tide goes out, even the best boats sit lower. When it comes in, boats rise, though small boats rise and fall much harder.
This month showed it clearly. Between October 5 and October 12, Ethereum and XRP fell by a larger percentage than Bitcoin, which pushed Bitcoin's dominance up even though Bitcoin's own price was also falling. Bitcoin lost less, so its slice of the pizza grew.
Two effects to remember:
1. Direction. Most altcoins follow Bitcoin's direction. A strong Bitcoin day lifts the market, a sharp drop drags almost everything down.
2. Size. Altcoins swing harder than Bitcoin. A 5% Bitcoin move can mean 10% or more on a smaller coin, in either direction.
That is why professional traders check Bitcoin first, every morning, before looking at any other chart.
The big money: Bitcoin ETFs
A spot Bitcoin ETF is a fund you can buy through a normal stock account. The fund buys real Bitcoin and holds it for you. Since these funds launched in the US in January 2024, banks, pension funds and everyday investors can own Bitcoin without ever opening a crypto wallet.
[Vote For Best Rising Star](https://app.binance.com/uni-qr/cact26user/626?uc=app_square_share_link&us=copylink)
Bitcoin: When the King Moves, the Whole Crypto Kingdom Shakes
Bitcoin trades near $81,300 today, about 36% below its October 2025 record, yet it still controls roughly 60% of the entire crypto market, so almost every coin follows its lead.
Where Bitcoin stands today
Picture a football match where one player controls the ball most of the time. That player is Bitcoin (BTC). Everyone else on the pitch, from Ethereum to Solana to the smallest meme coin, reacts to what Bitcoin does.
Right now Bitcoin is quiet but tense. it near $81,300, down about 1.5% in 24 hours and about 3% in a week. Its all-time high was about $126,210, set in October 2025, so today's price sits roughly 36% below that peak. Even so, Bitcoin's market value is around $1.64 trillion, larger than all other cryptocurrencies put together (roughly $1.1 trillion between them).
Please Vote For Me Today
There are about 20.1 million bitcoin in circulation out of a fixed maximum of 21 million. No government or bank can print more, which is a big reason many investors see it as "digital gold".
Why Bitcoin is the king: understanding dominance
Bitcoin dominance is simply Bitcoin's share of the whole crypto market. If the market is a pizza, dominance tells you how many slices Bitcoin owns.
In October 2026 that share is about 60%. it near 60.4%, with Bitcoin worth about $1.68 trillion inside a $2.78 trillion market. At the start of the month it was lower, near 58.6%, so money has been flowing back toward Bitcoin during this correction.
Three things keep Bitcoin on the throne:
• Trust and age. It is the oldest and most tested crypto, and the one big institutions are most comfortable buying.
• Scarcity. Only 21 million will ever exist, and about 20.1 million are already mined.
• ETFs. Funds that hold only Bitcoin (more on them below) send fresh money to BTC and not to altcoins.
Rule of thumb: when fear rises, people run to the "safest" crypto, Bitcoin, and dominance goes up. When confidence is high, people take more risk on altcoins and dominance usually falls.
How Bitcoin's moves hit the rest of the market
Think of the crypto market as the sea and Bitcoin as the tide. When the tide goes out, even the best boats sit lower. When it comes in, boats rise, though small boats rise and fall much harder.
This month showed it clearly. Between October 5 and October 12, Ethereum and XRP fell by a larger percentage than Bitcoin, which pushed Bitcoin's dominance up even though Bitcoin's own price was also falling. Bitcoin lost less, so its slice of the pizza grew.
Two effects to remember:
1. Direction. Most altcoins follow Bitcoin's direction. A strong Bitcoin day lifts the market, a sharp drop drags almost everything down.
2. Size. Altcoins swing harder than Bitcoin. A 5% Bitcoin move can mean 10% or more on a smaller coin, in either direction.
That is why professional traders check Bitcoin first, every morning, before looking at any other chart.
The big money: Bitcoin ETFs
A spot Bitcoin ETF is a fund you can buy through a normal stock account. The fund buys real Bitcoin and holds it for you. Since these funds launched in the US in January 2024, banks, pension funds and everyday investors can own Bitcoin without ever opening a crypto wallet.
Vote For Best Rising Star
2
282
·
--
Bullish
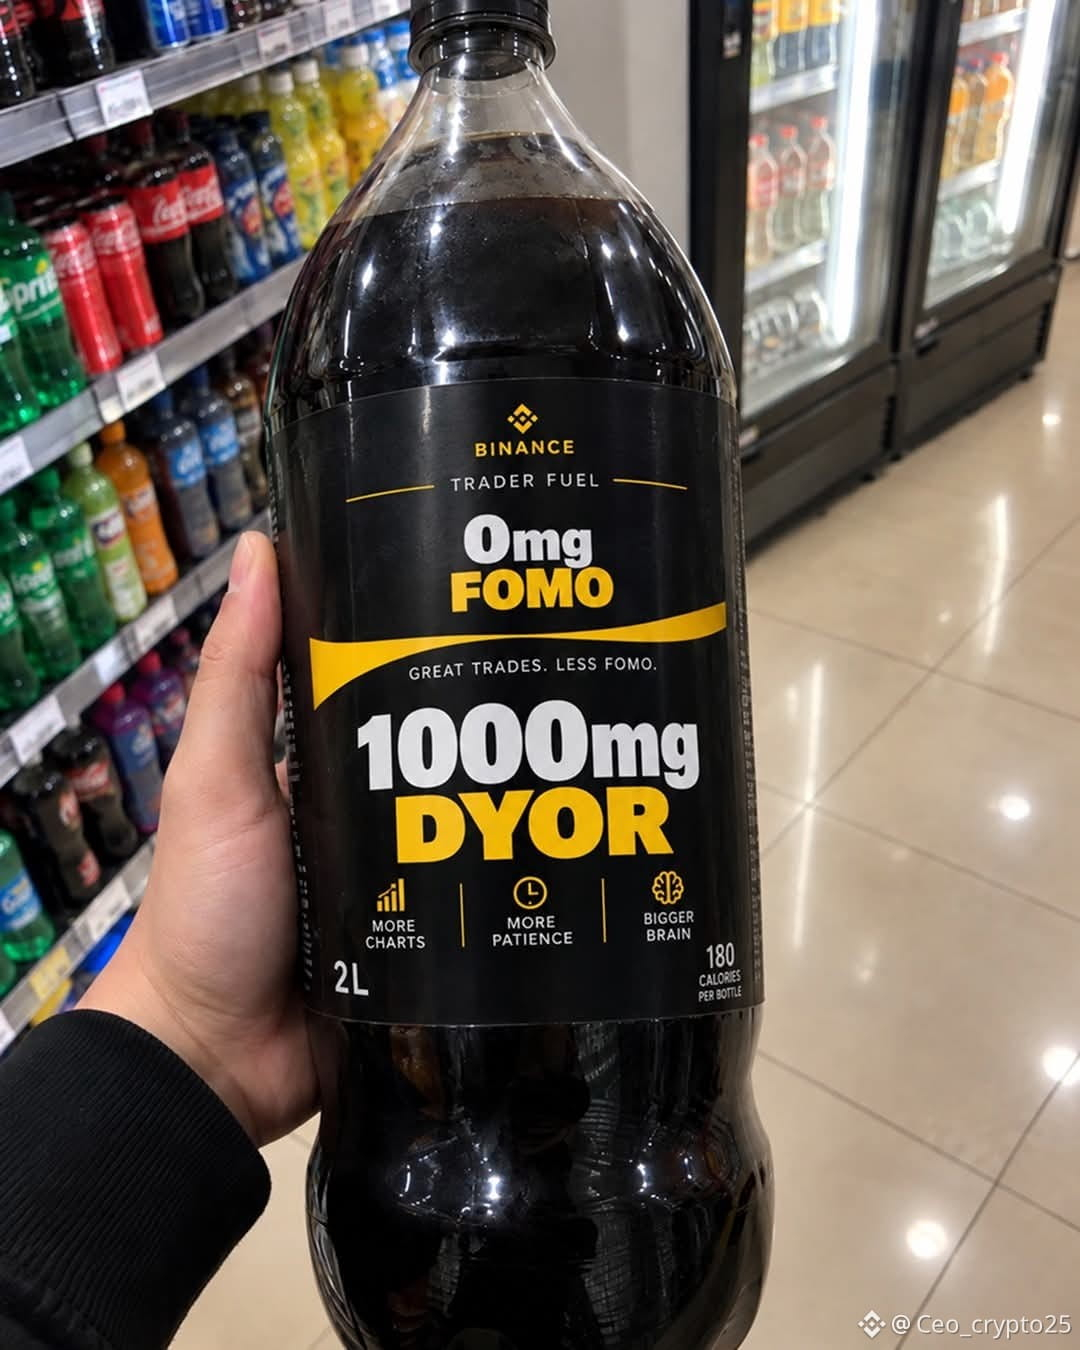
Drink Your BINANCE Ernegy...
and Let's Go Vote for Rising Star Awards
[VOTE FOR RISING STAR AWARDS](https://app.binance.com/uni-qr/cact26user/626?uc=app_square_share_link&us=copylink)
we are great Army
Drink Your BINANCE Ernegy...
and Let's Go Vote for Rising Star Awards
VOTE FOR RISING STAR AWARDS
we are great Army
and Let's Go Vote for Rising Star Awards
VOTE FOR RISING STAR AWARDS
we are great Army
1
100
·
--
Bullish
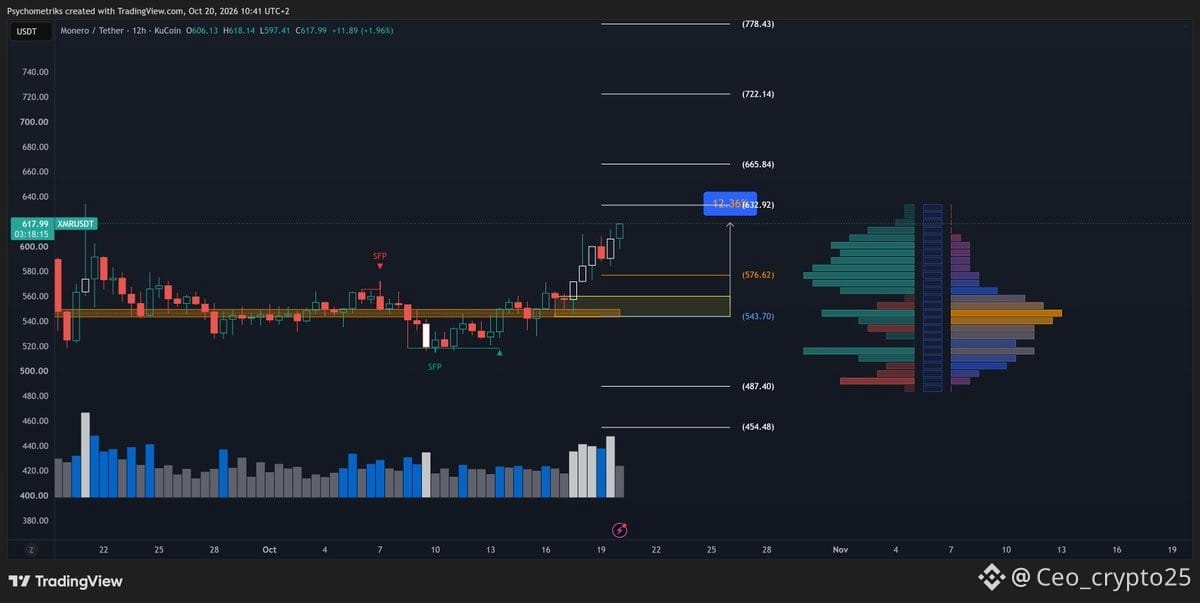
$XMR BREAKS OUT Bullish SFP Confirms the Reversal, Eyes on $665+
$XMR /USDT
Direction: LONG
Entry: 617.99
TP1: 632.92 +2.4%
TP2: 665.84 +7.7%
TP3: 722.14 +16.9%
TP4: 778.43 +26.0%
SL: 570.00
$XMR
[I Can't Win Without You](https://app.binance.com/uni-qr/cact26user/626?uc=app_square_share_link&us=copylink)
{future}(XMRUSDT)
$XMR BREAKS OUT Bullish SFP Confirms the Reversal, Eyes on $665+
$XMR /USDT
Direction: LONG
Entry: 617.99
TP1: 632.92 +2.4%
TP2: 665.84 +7.7%
TP3: 722.14 +16.9%
TP4: 778.43 +26.0%
SL: 570.00
$XMR
I Can't Win Without You
$XMR /USDT
Direction: LONG
Entry: 617.99
TP1: 632.92 +2.4%
TP2: 665.84 +7.7%
TP3: 722.14 +16.9%
TP4: 778.43 +26.0%
SL: 570.00
$XMR
I Can't Win Without You
1
181
·
--
Bullish
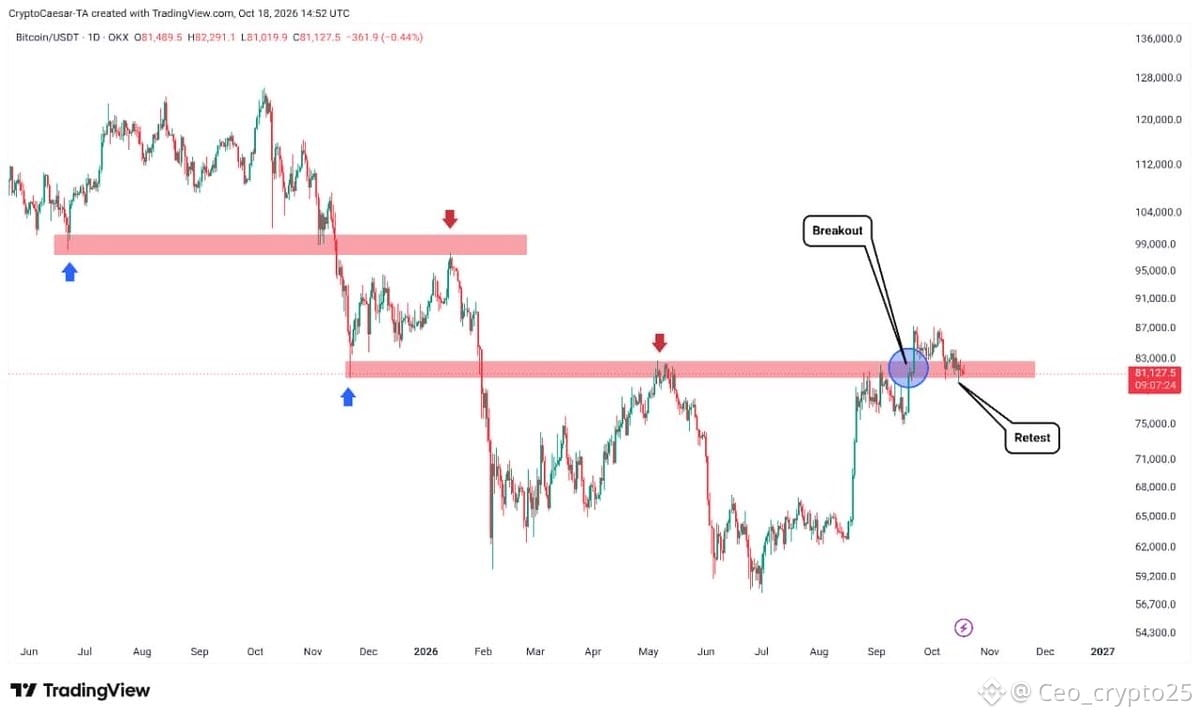
TRADE SIGNAL $BTC /USDT
Direction: SHORT 🔴
$BTC /USDT
Entry Zone: $81,800 – $82,800
Take-Profit Targets:
TP 1: $80,500
TP 2: $79,800
TP 3: $78,970
TP 4: $77,500
Stop-Loss (SL): $83,800
$BTC
[Click here To Vote For Me](https://app.binance.com/uni-qr/cact26user/626?uc=app_square_share_link&us=copylink)
{future}(BTCUSDT)
TRADE SIGNAL $BTC /USDT
Direction: SHORT 🔴
$BTC /USDT
Entry Zone: $81,800 – $82,800
Take-Profit Targets:
TP 1: $80,500
TP 2: $79,800
TP 3: $78,970
TP 4: $77,500
Stop-Loss (SL): $83,800
$BTC
Click here To Vote For Me
Direction: SHORT 🔴
$BTC /USDT
Entry Zone: $81,800 – $82,800
Take-Profit Targets:
TP 1: $80,500
TP 2: $79,800
TP 3: $78,970
TP 4: $77,500
Stop-Loss (SL): $83,800
$BTC
Click here To Vote For Me
2
326
·
--
Bullish
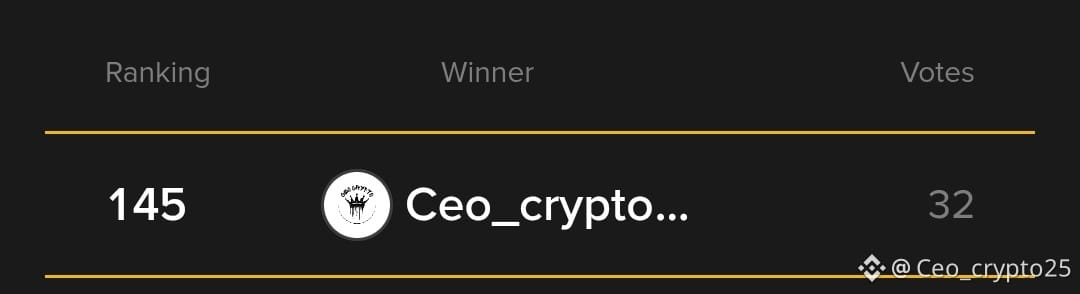
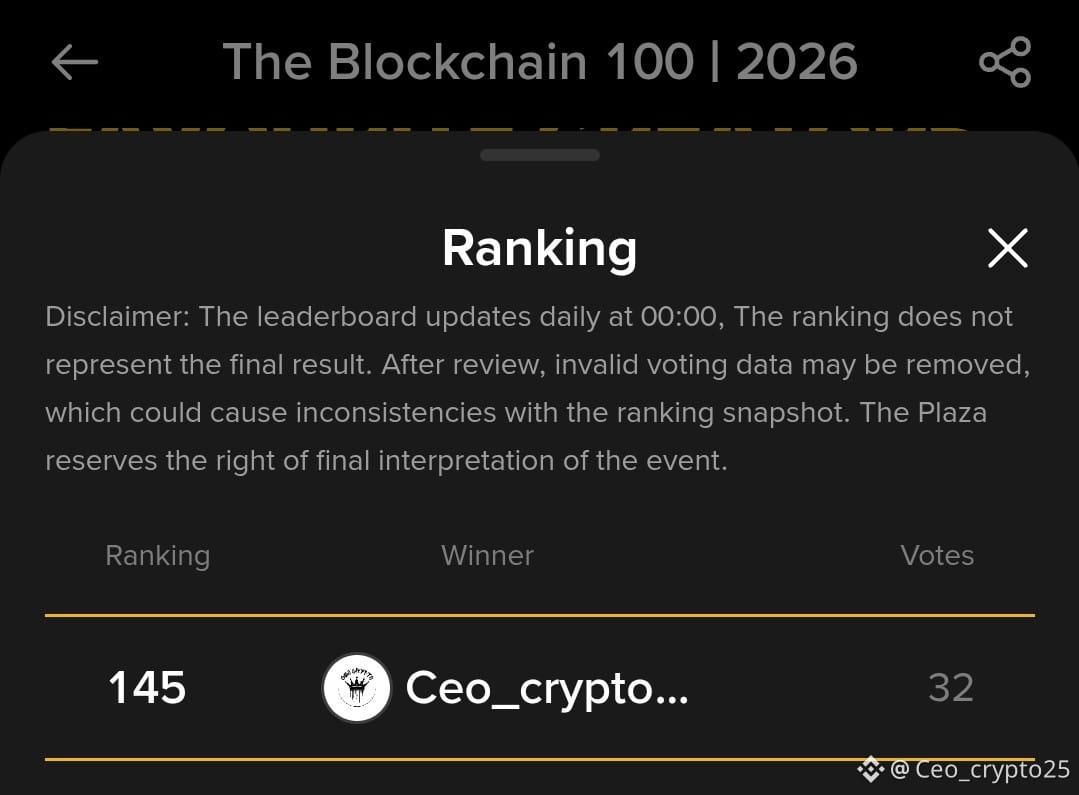
Our rank Today Is 145 and we got 32 Votes.
While Our Number Is 64.5k followers.
I can't Do it Alone Please [VOTE Now](https://app.binance.com/uni-qr/cact26user/626?uc=app_square_share_link&us=copylink)
Let's Go Guy's
Our rank Today Is 145 and we got 32 Votes.
While Our Number Is 64.5k followers.
I can't Do it Alone Please VOTE Now
Let's Go Guy's
While Our Number Is 64.5k followers.
I can't Do it Alone Please VOTE Now
Let's Go Guy's
2
2
149
·
--
Bullish
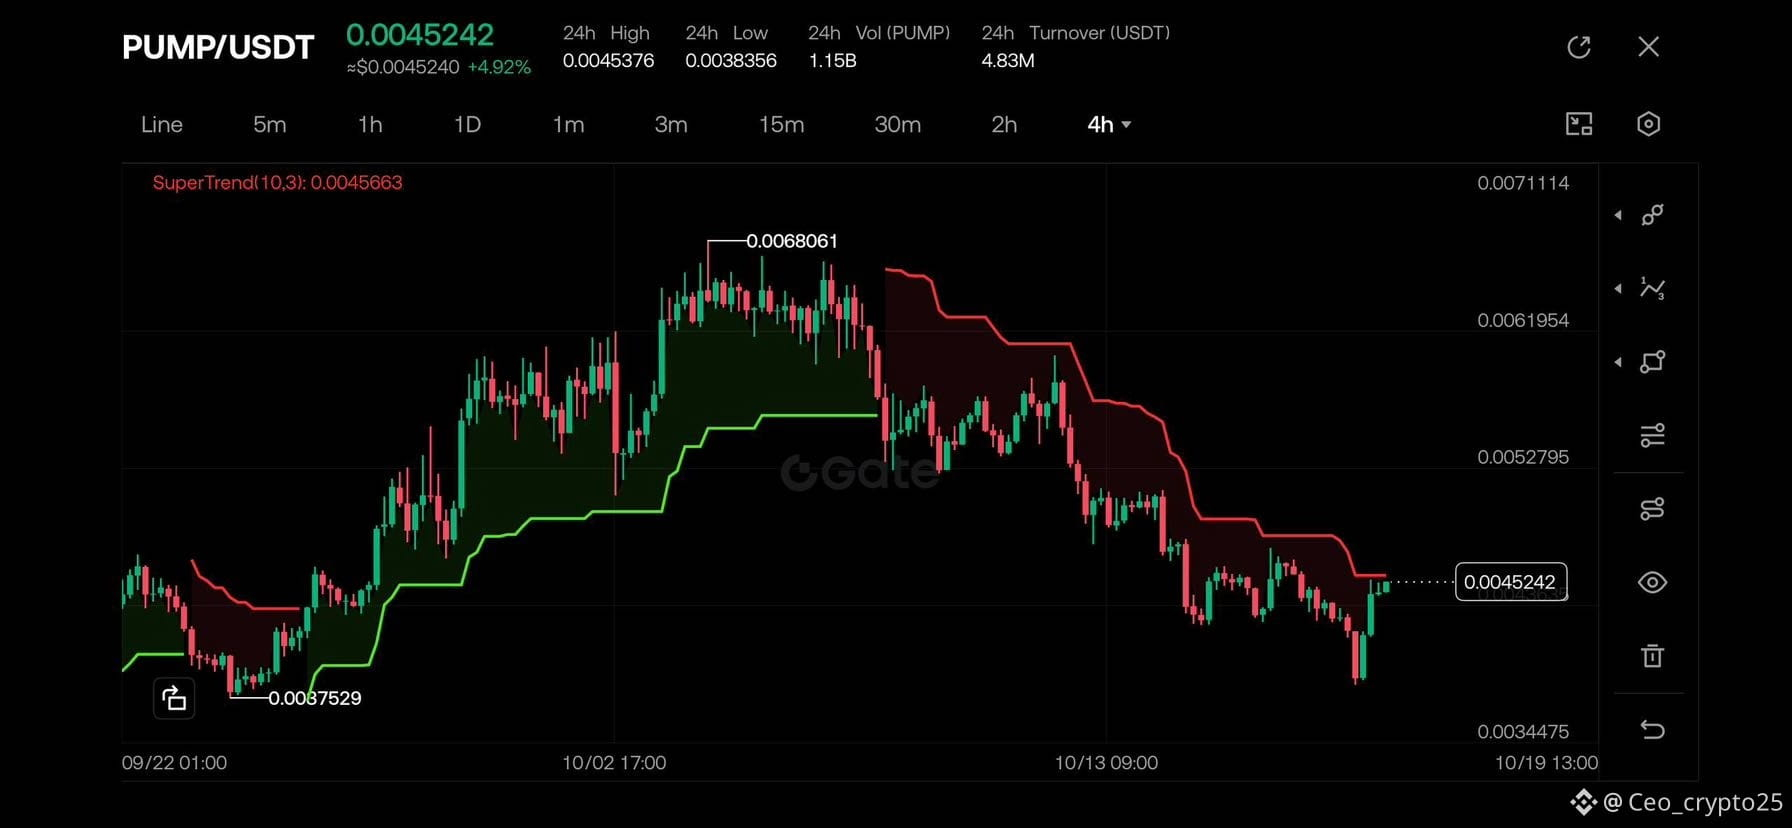
$PUMP AT THE TIPPING POINT SuperTrend Flip Could Spark the Next Move
$PUMP / $USDT
[click to VOTE](https://app.binance.com/uni-qr/cact26user/626?uc=app_square_share_link&us=copylink)
Direction: LONG
Entry: 0.0045242
TP1: 0.0052795 +16.7%
TP2: 0.0061954 +36.9%
TP3: 0.0068061 +50.4%
SL: 0.0038356
Chart Structure:
- PUMP ran hard from 0.0038 to a high of 0.0068, then rolled into a clean downtrend, with the SuperTrend(10,3) flipping red at the top and tracking the decline step by step
- Price has now based out and is pressing directly against the SuperTrend line (0.0045663) this is the exact pivot where the indicator would flip from red to green
- Up +4.92% on the day with a visible bounce off the recent low, showing the first real push back into the trend line after a sustained slide
- This is a classic SuperTrend reclaim setup: strength shown, but not yet confirmed a clean 4h close above the line is what turns this from a watch into a confirmed signal
$PUMP
{future}(PUMPUSDT)
$PUMP AT THE TIPPING POINT SuperTrend Flip Could Spark the Next Move
$PUMP / $USDT
click to VOTE
Direction: LONG
Entry: 0.0045242
TP1: 0.0052795 +16.7%
TP2: 0.0061954 +36.9%
TP3: 0.0068061 +50.4%
SL: 0.0038356
Chart Structure:
- PUMP ran hard from 0.0038 to a high of 0.0068, then rolled into a clean downtrend, with the SuperTrend(10,3) flipping red at the top and tracking the decline step by step
- Price has now based out and is pressing directly against the SuperTrend line (0.0045663) this is the exact pivot where the indicator would flip from red to green
- Up +4.92% on the day with a visible bounce off the recent low, showing the first real push back into the trend line after a sustained slide
- This is a classic SuperTrend reclaim setup: strength shown, but not yet confirmed a clean 4h close above the line is what turns this from a watch into a confirmed signal
$PUMP
3
437
·
--
guys it's time to [vote](https://app.binance.com/uni-qr/cact26user/626?uc=app_square_share_link&us=copylink)
our ranking is too down
[Cast Your Vote Today](https://app.binance.com/uni-qr/cact26user/626?uc=app_square_share_link&us=copylink)
guys it's time to vote
our ranking is too down
Cast Your Vote Today
our ranking is too down
Cast Your Vote Today
1
107
Log in to explore more content
Join global crypto users on Binance Square
⚡️ Get latest and useful information about crypto.
💬 Trusted by the world’s largest crypto exchange.
👍 Discover real insights from verified creators.
Email / Phone number