
Box Art
1.4k Posts

Box Art
boxart.uk
Open Trade

BTC Holder
Frequent Trader
2.5 Years
4 Following
10.8K+ Followers
15.5K+ Liked
Posts
Portfolio
All
Quotes
Videos
Live
PINNED
PINNED
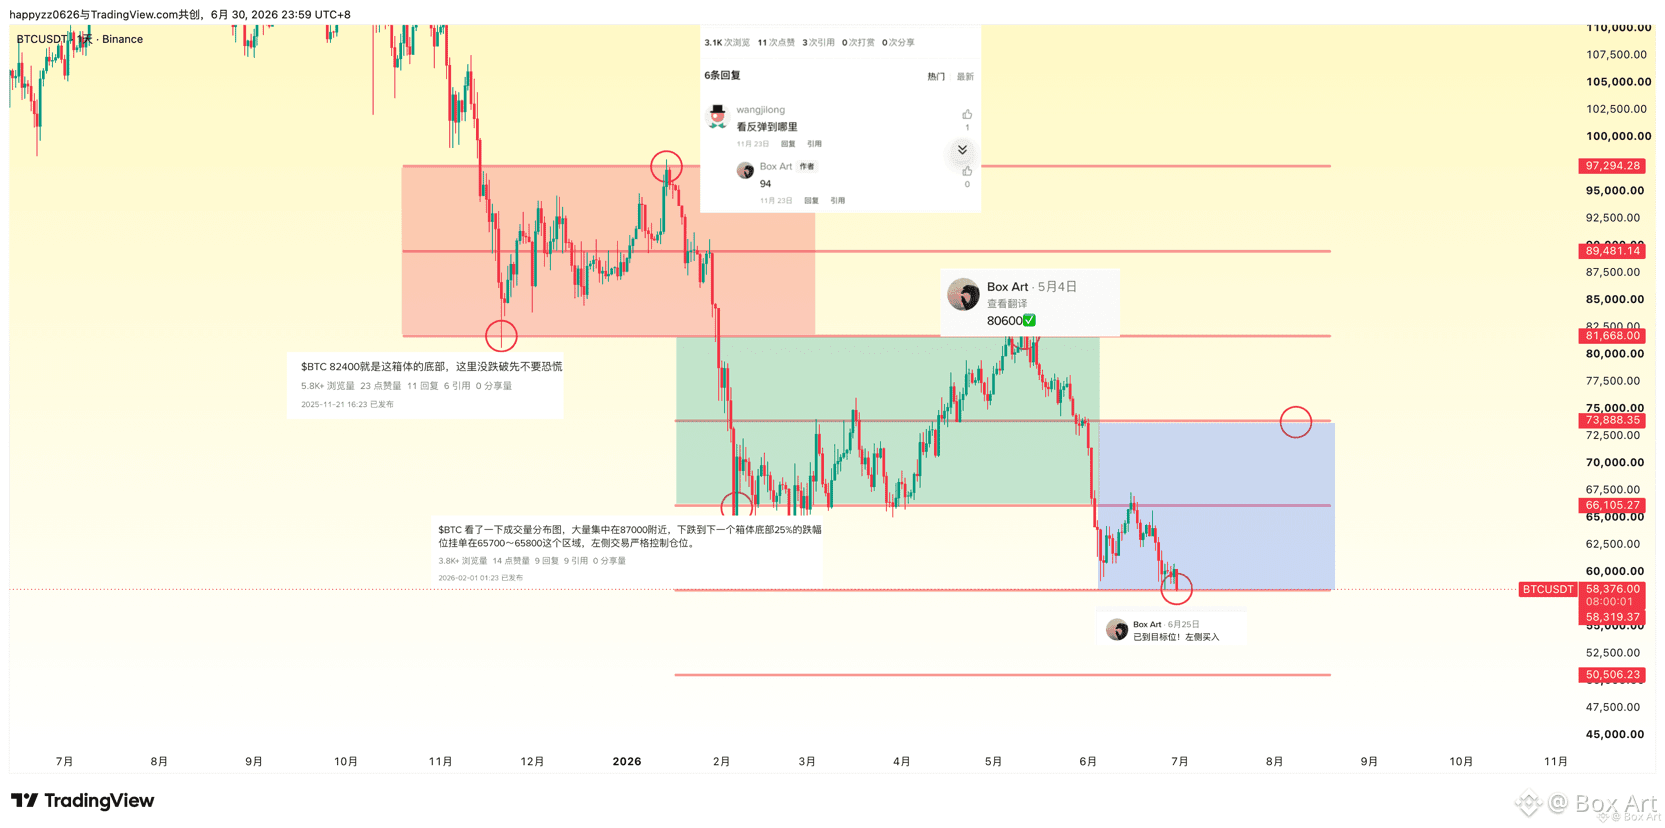
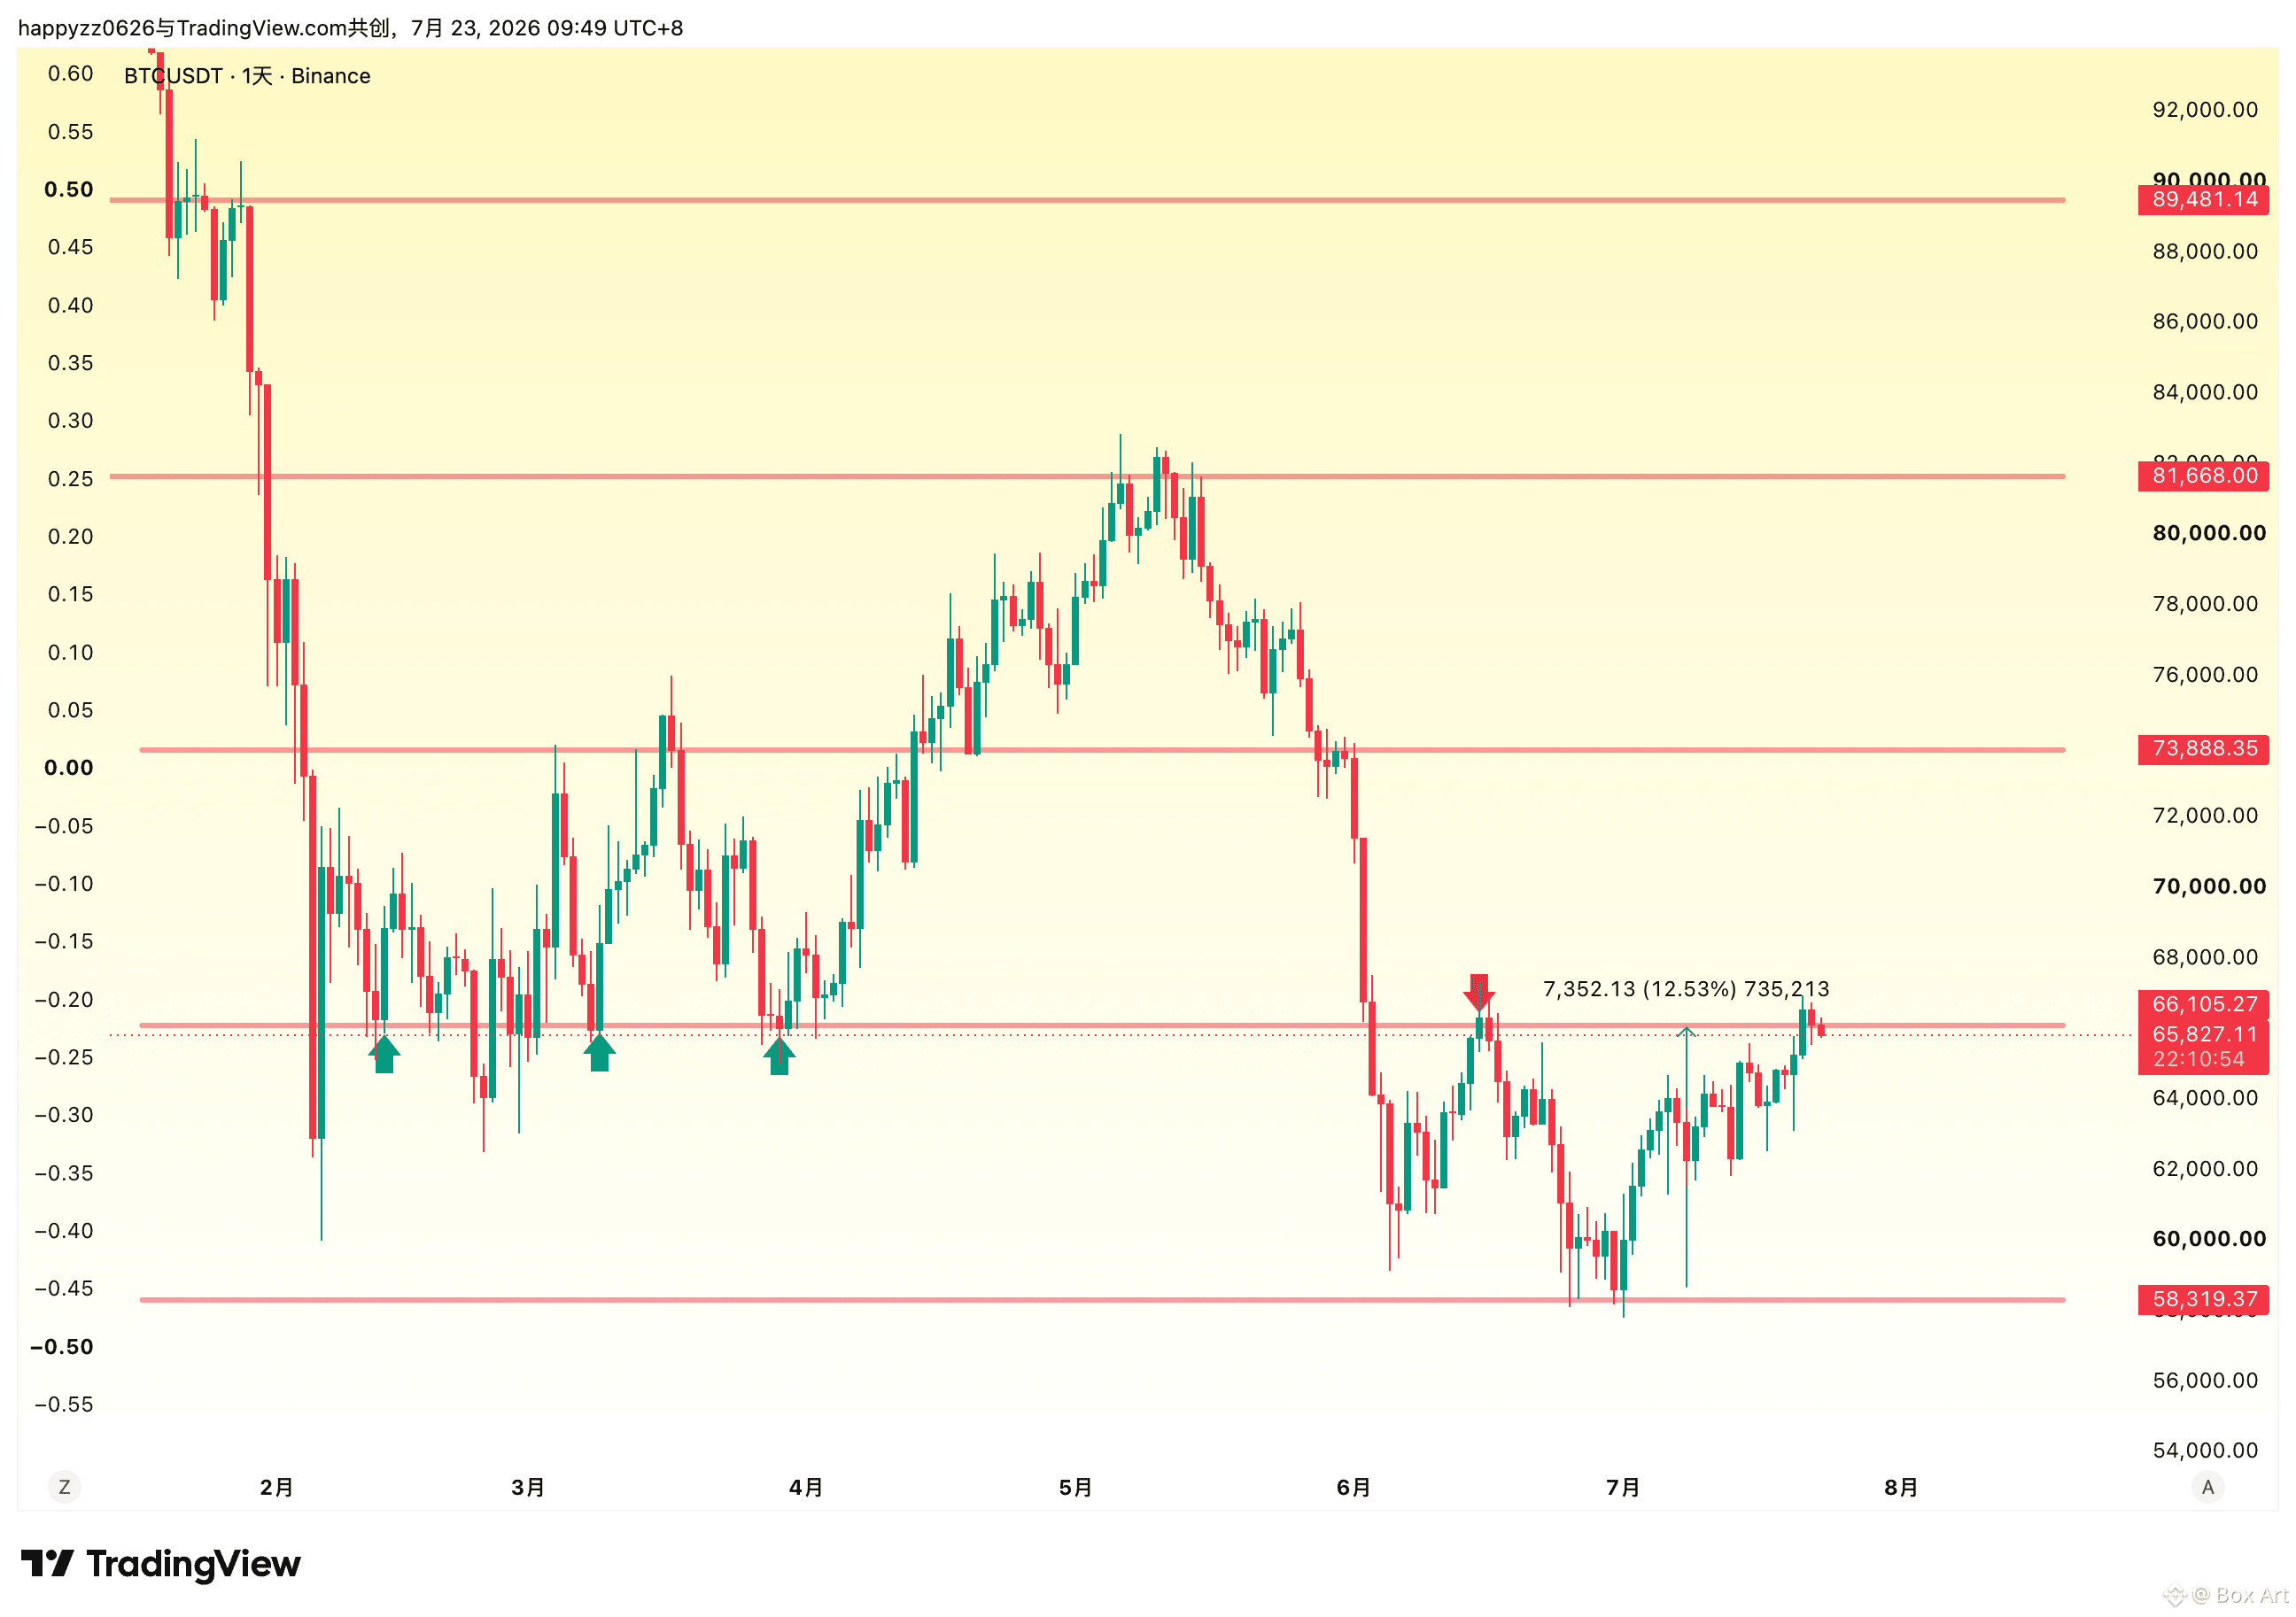
$BTC eat a whole case, 7300 dollars, refuse to make excuses after the fact, refuse to just complain because you’ve only eaten a few hundred points.
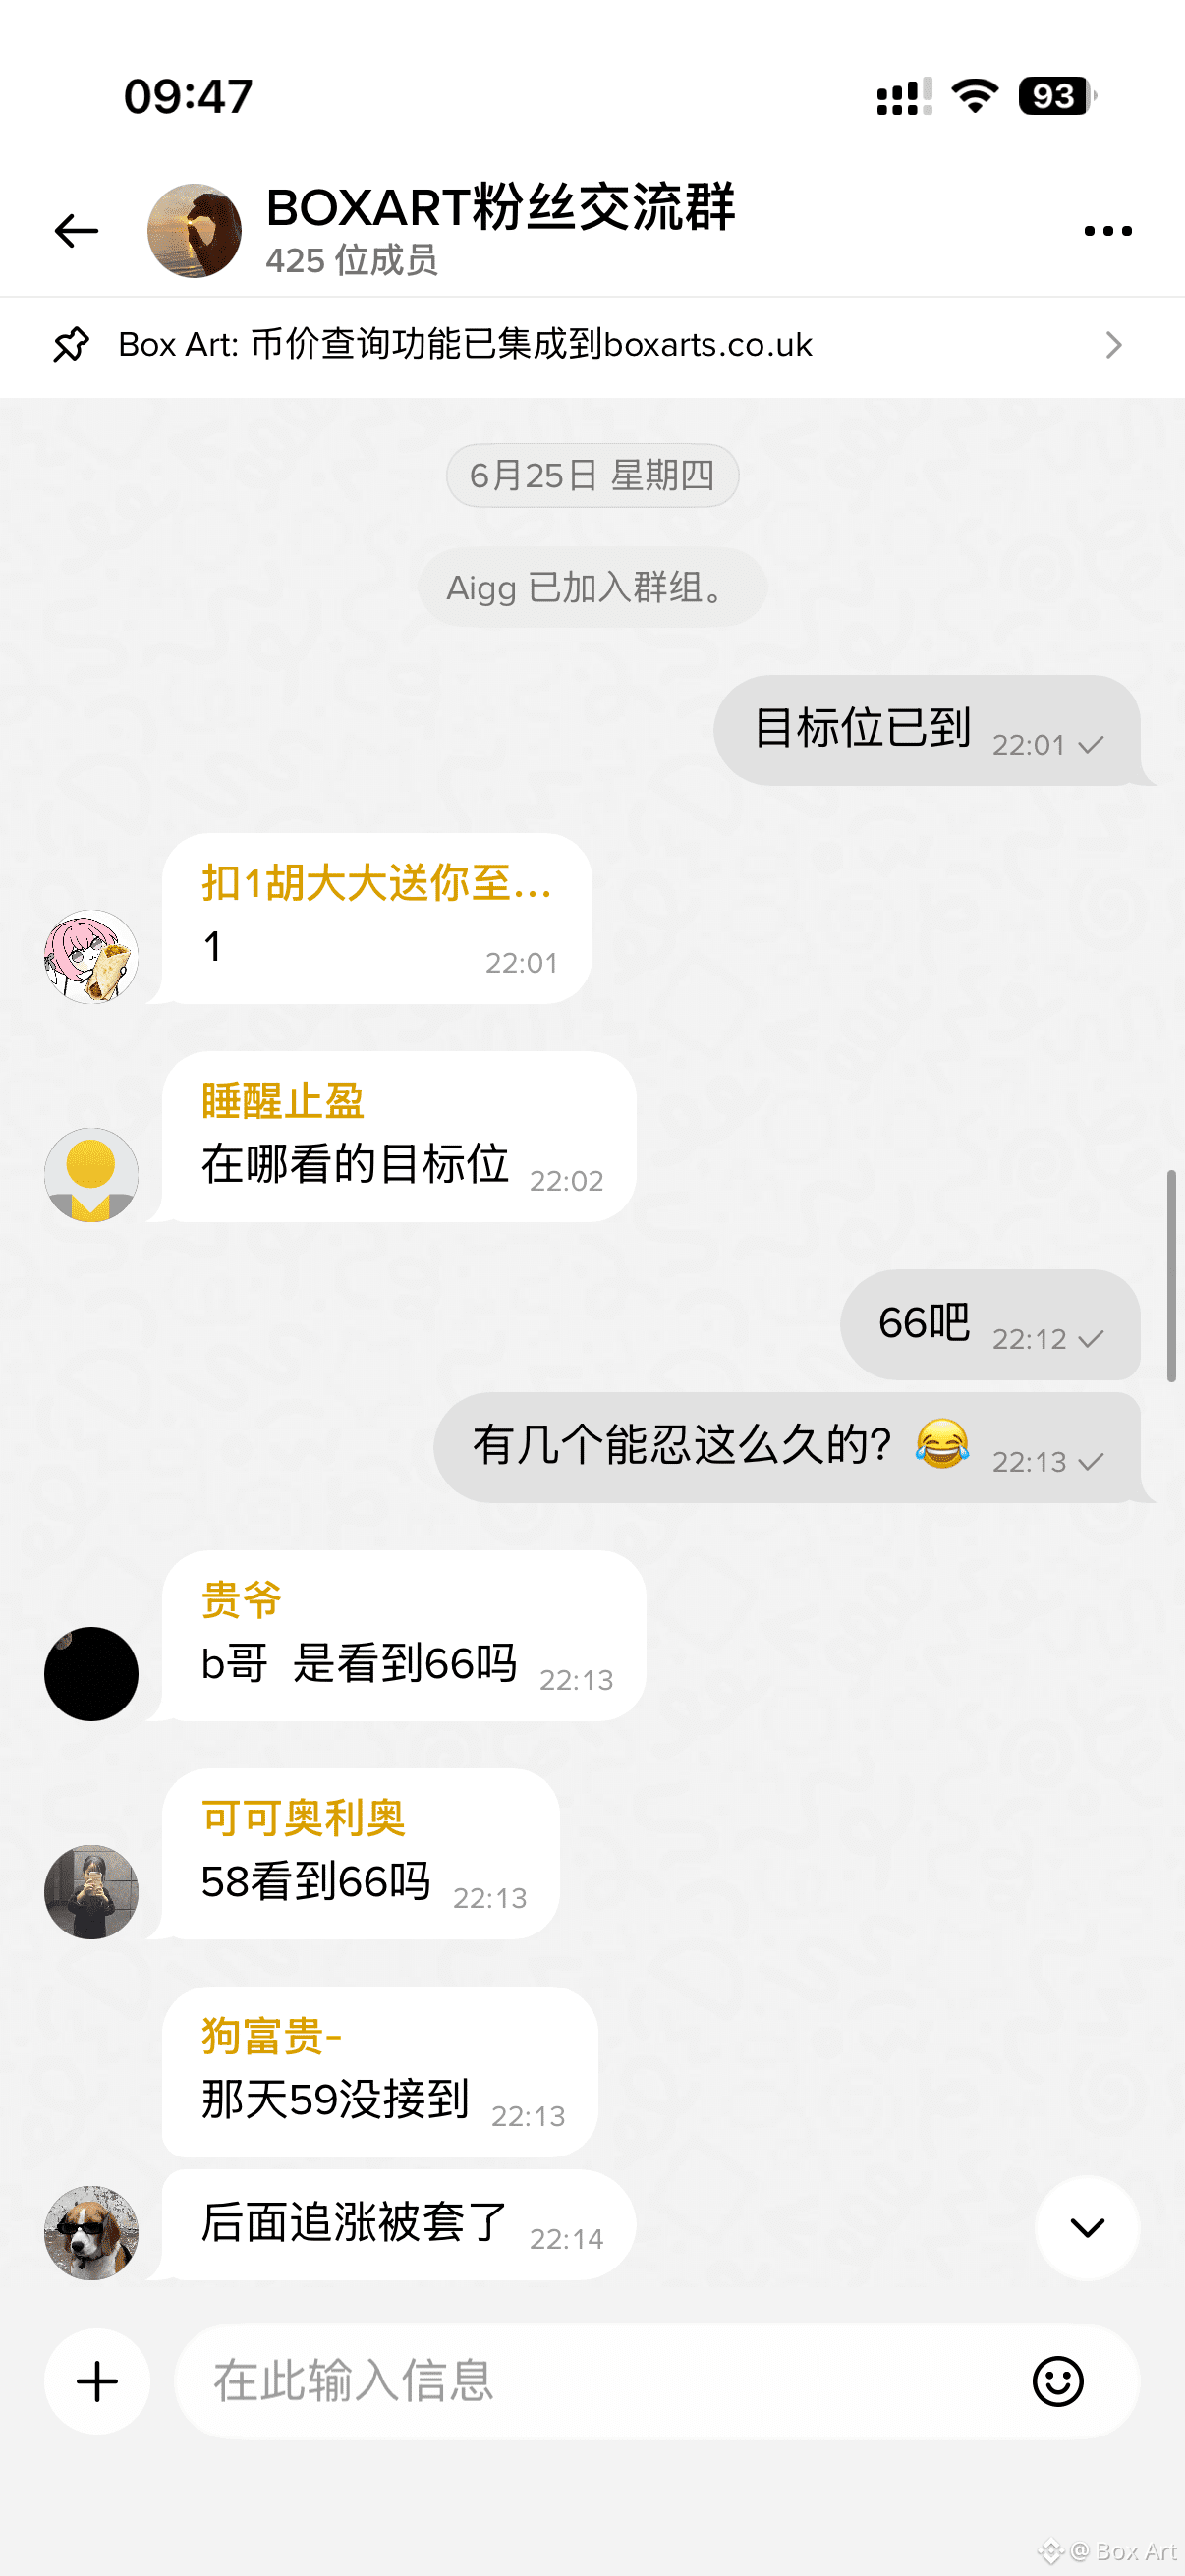
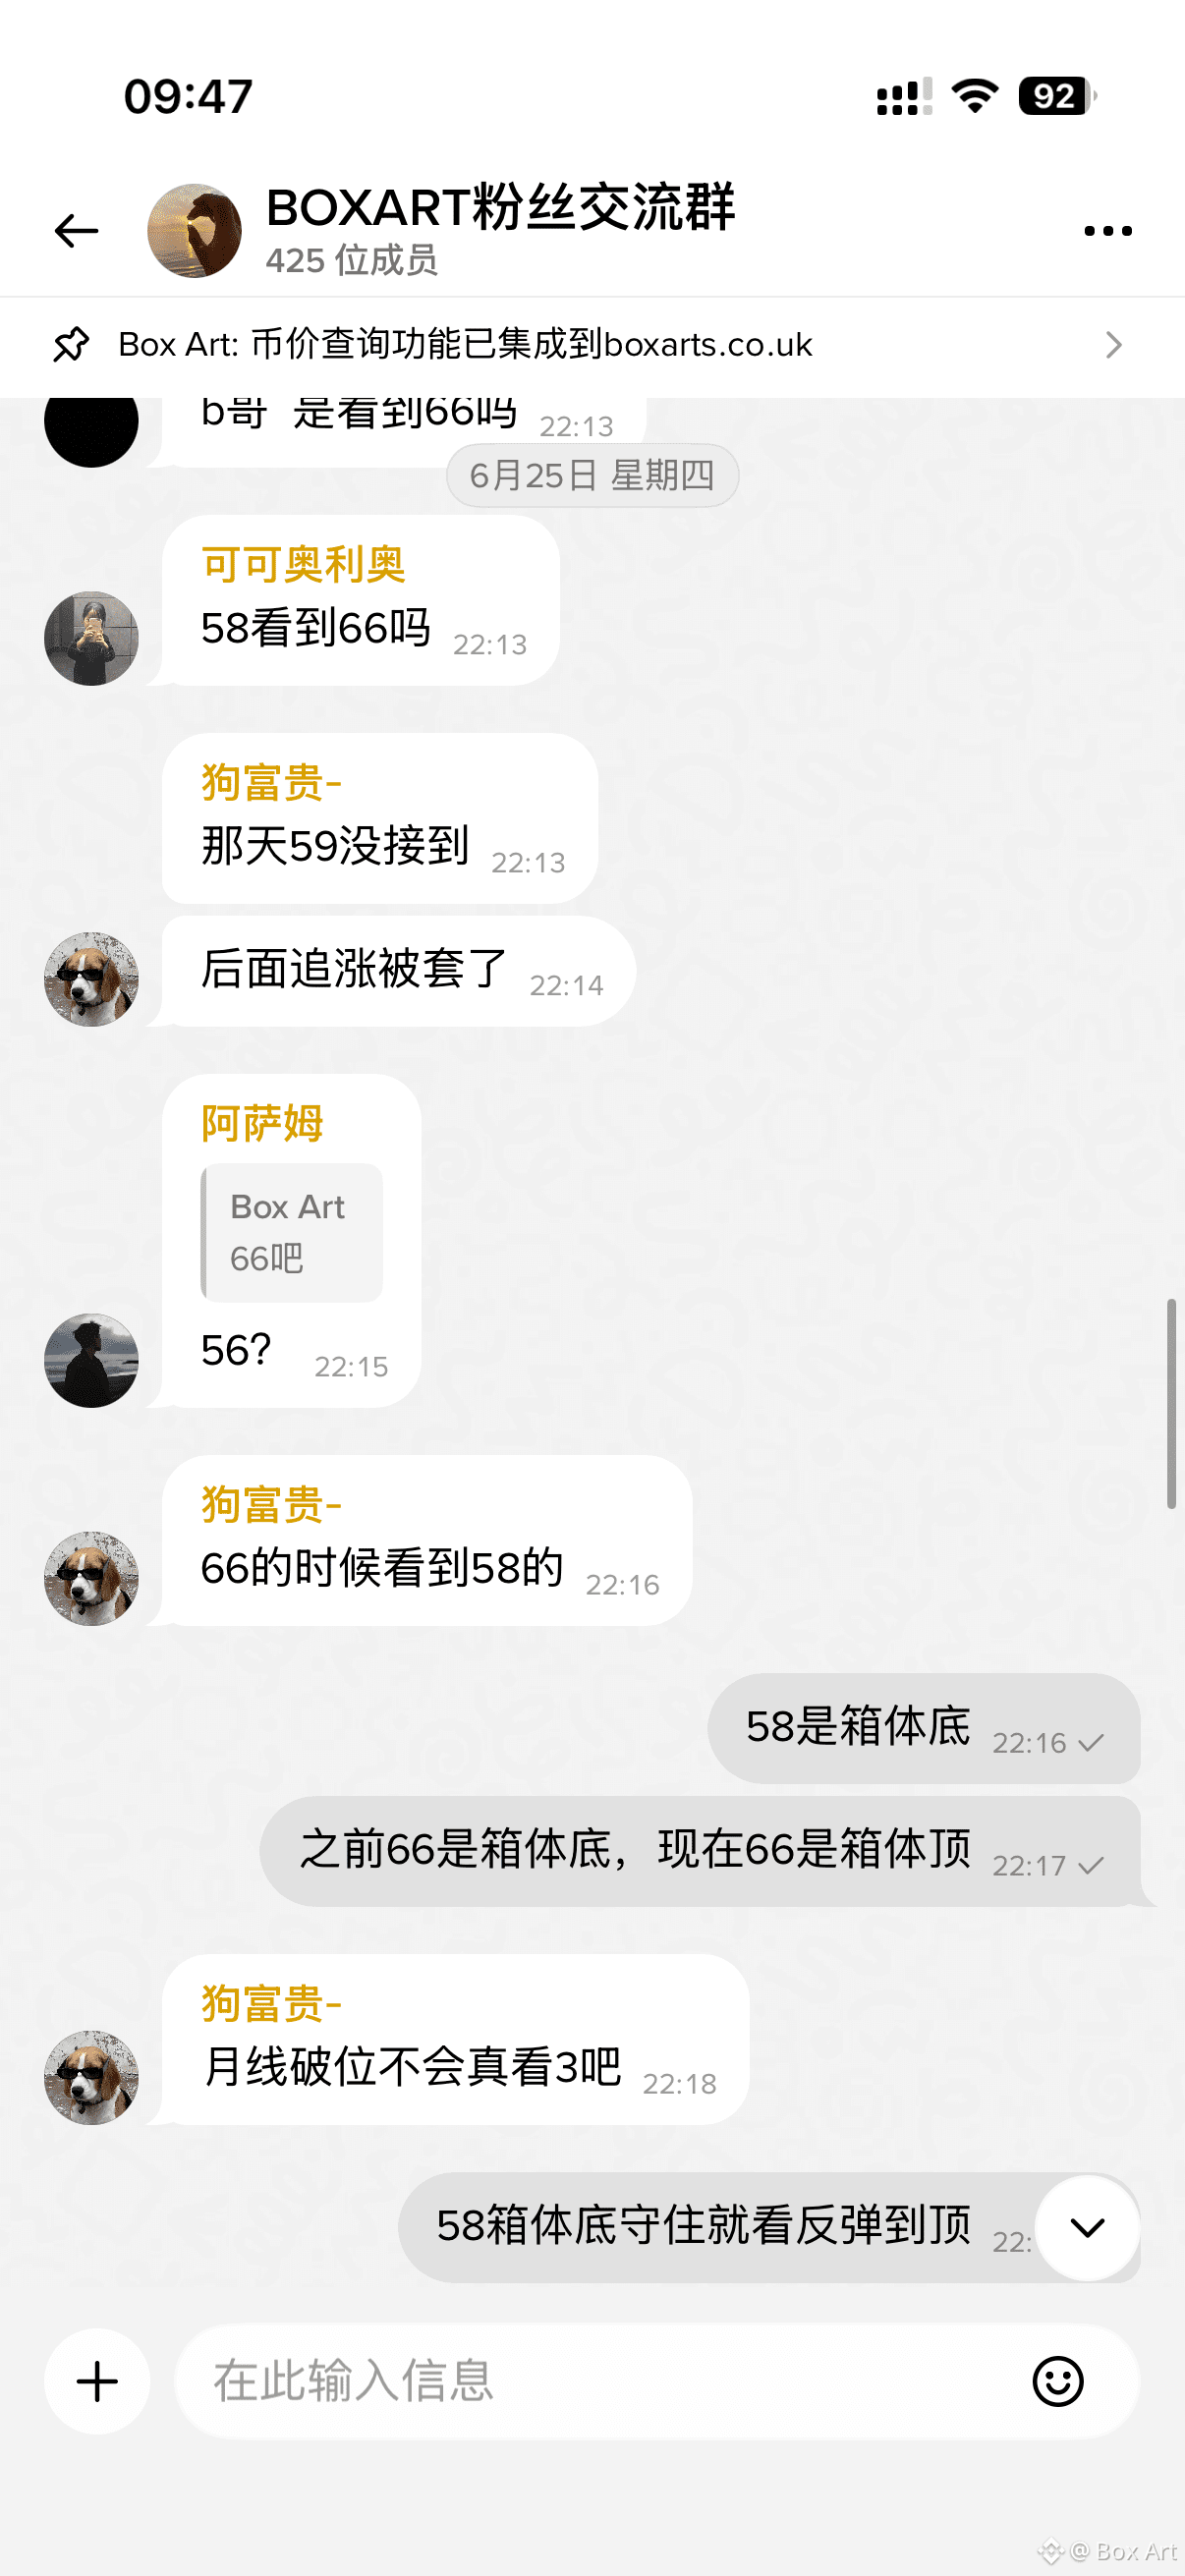
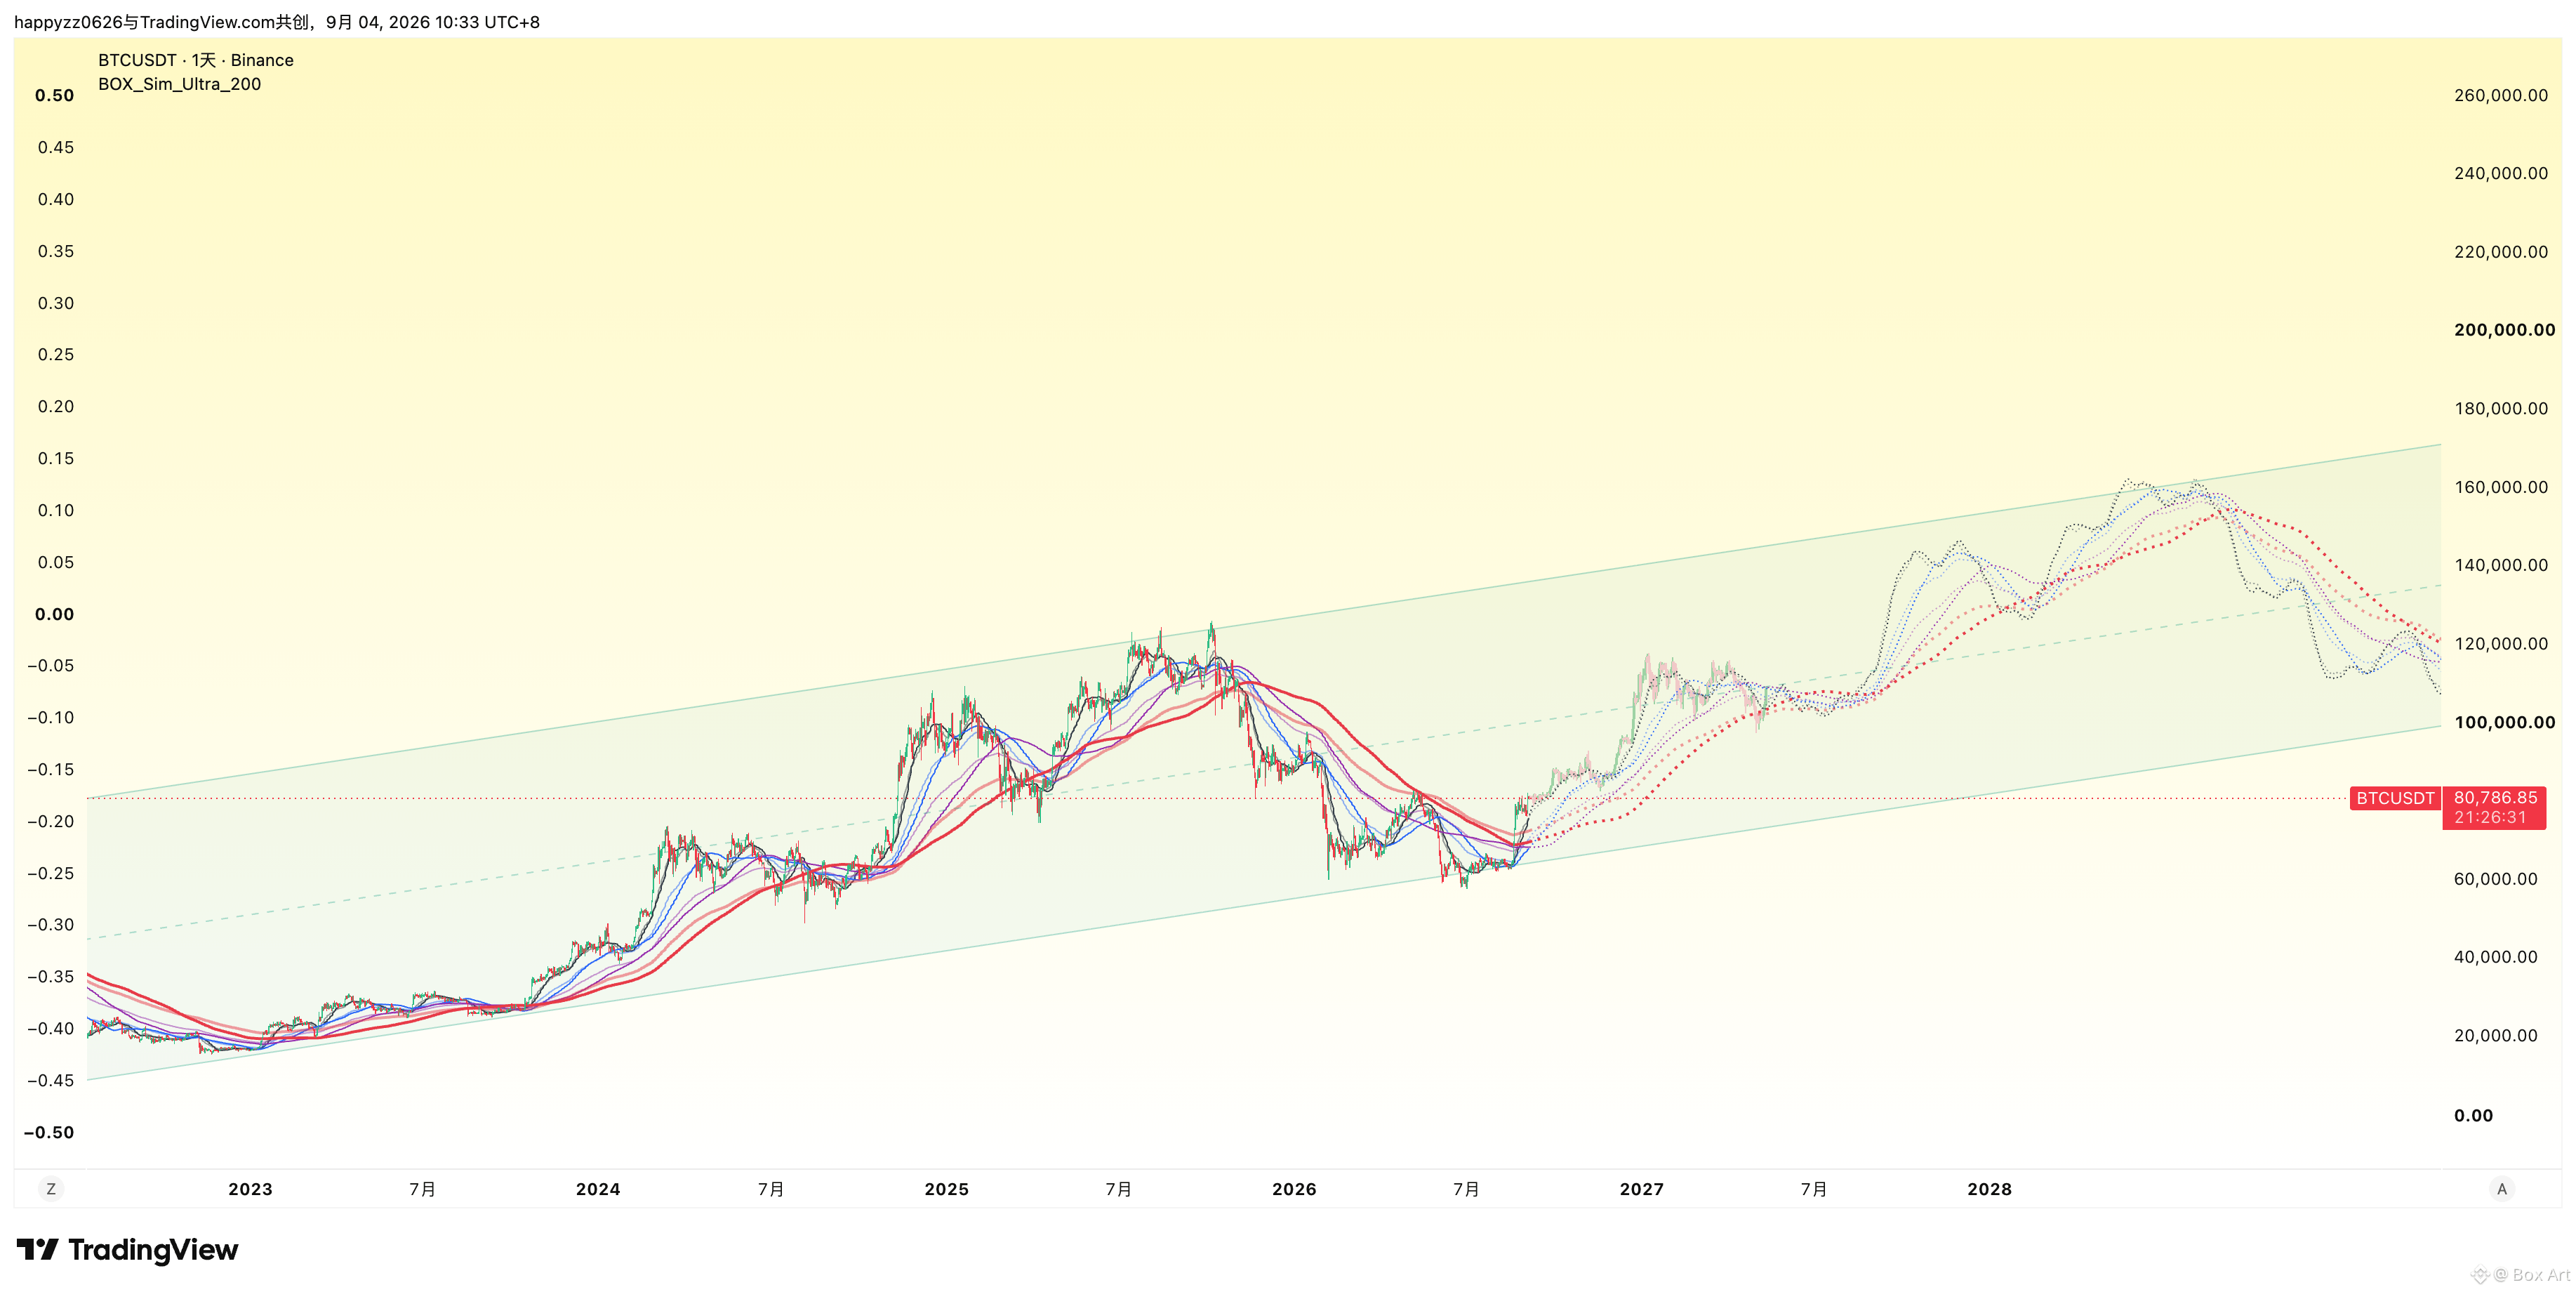
$BTC main rising-wave simulated trend, for reference only, not as a basis for placing orders. There is only one entry opportunity: when RSI is oversold, keep buying!!!!!!!!!!!
Box Art
·
--
Main surge formation—please don’t fight against it to take short positions. When the RSI is oversold, it’s the time to buy in batches.
$BTC market changes too fast like a tornado, I can't take it, there's nowhere left for me to hide, I don't want liquidation
I don't want liquidation, I don't, I don't, I don't want liquidation anymore!!!!
I don't want liquidation, I don't, I don't, I don't want liquidation anymore!!!!
Box Art
·
--
$BTC After the first four times at the daily chart level, a breakout above opens the main upswing. This time the breakout has already completed. I choose to ignore the noise at the smaller timeframes and continue holding the position, adding in batches when the RSI is oversold (at least on the 1-hour timeframe).
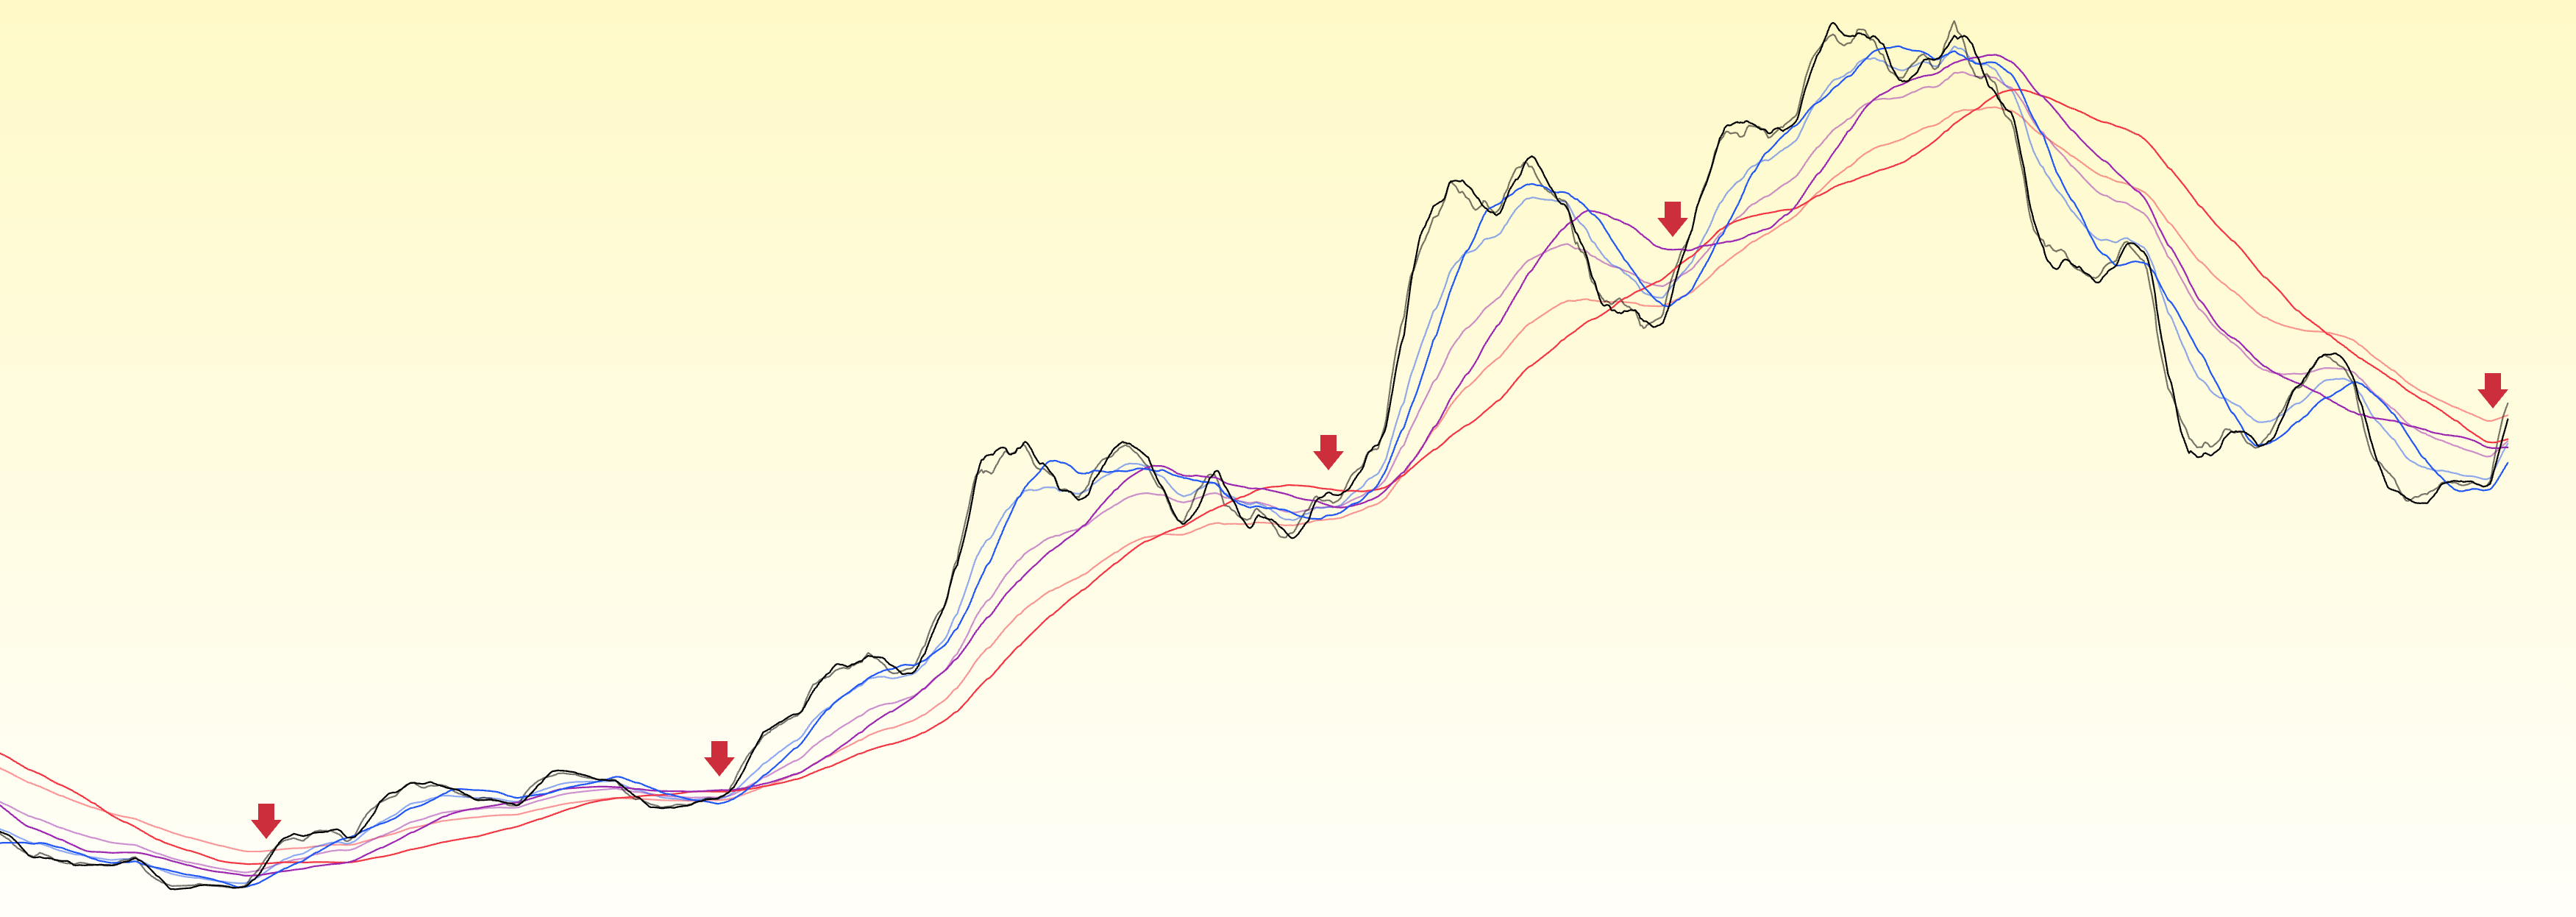
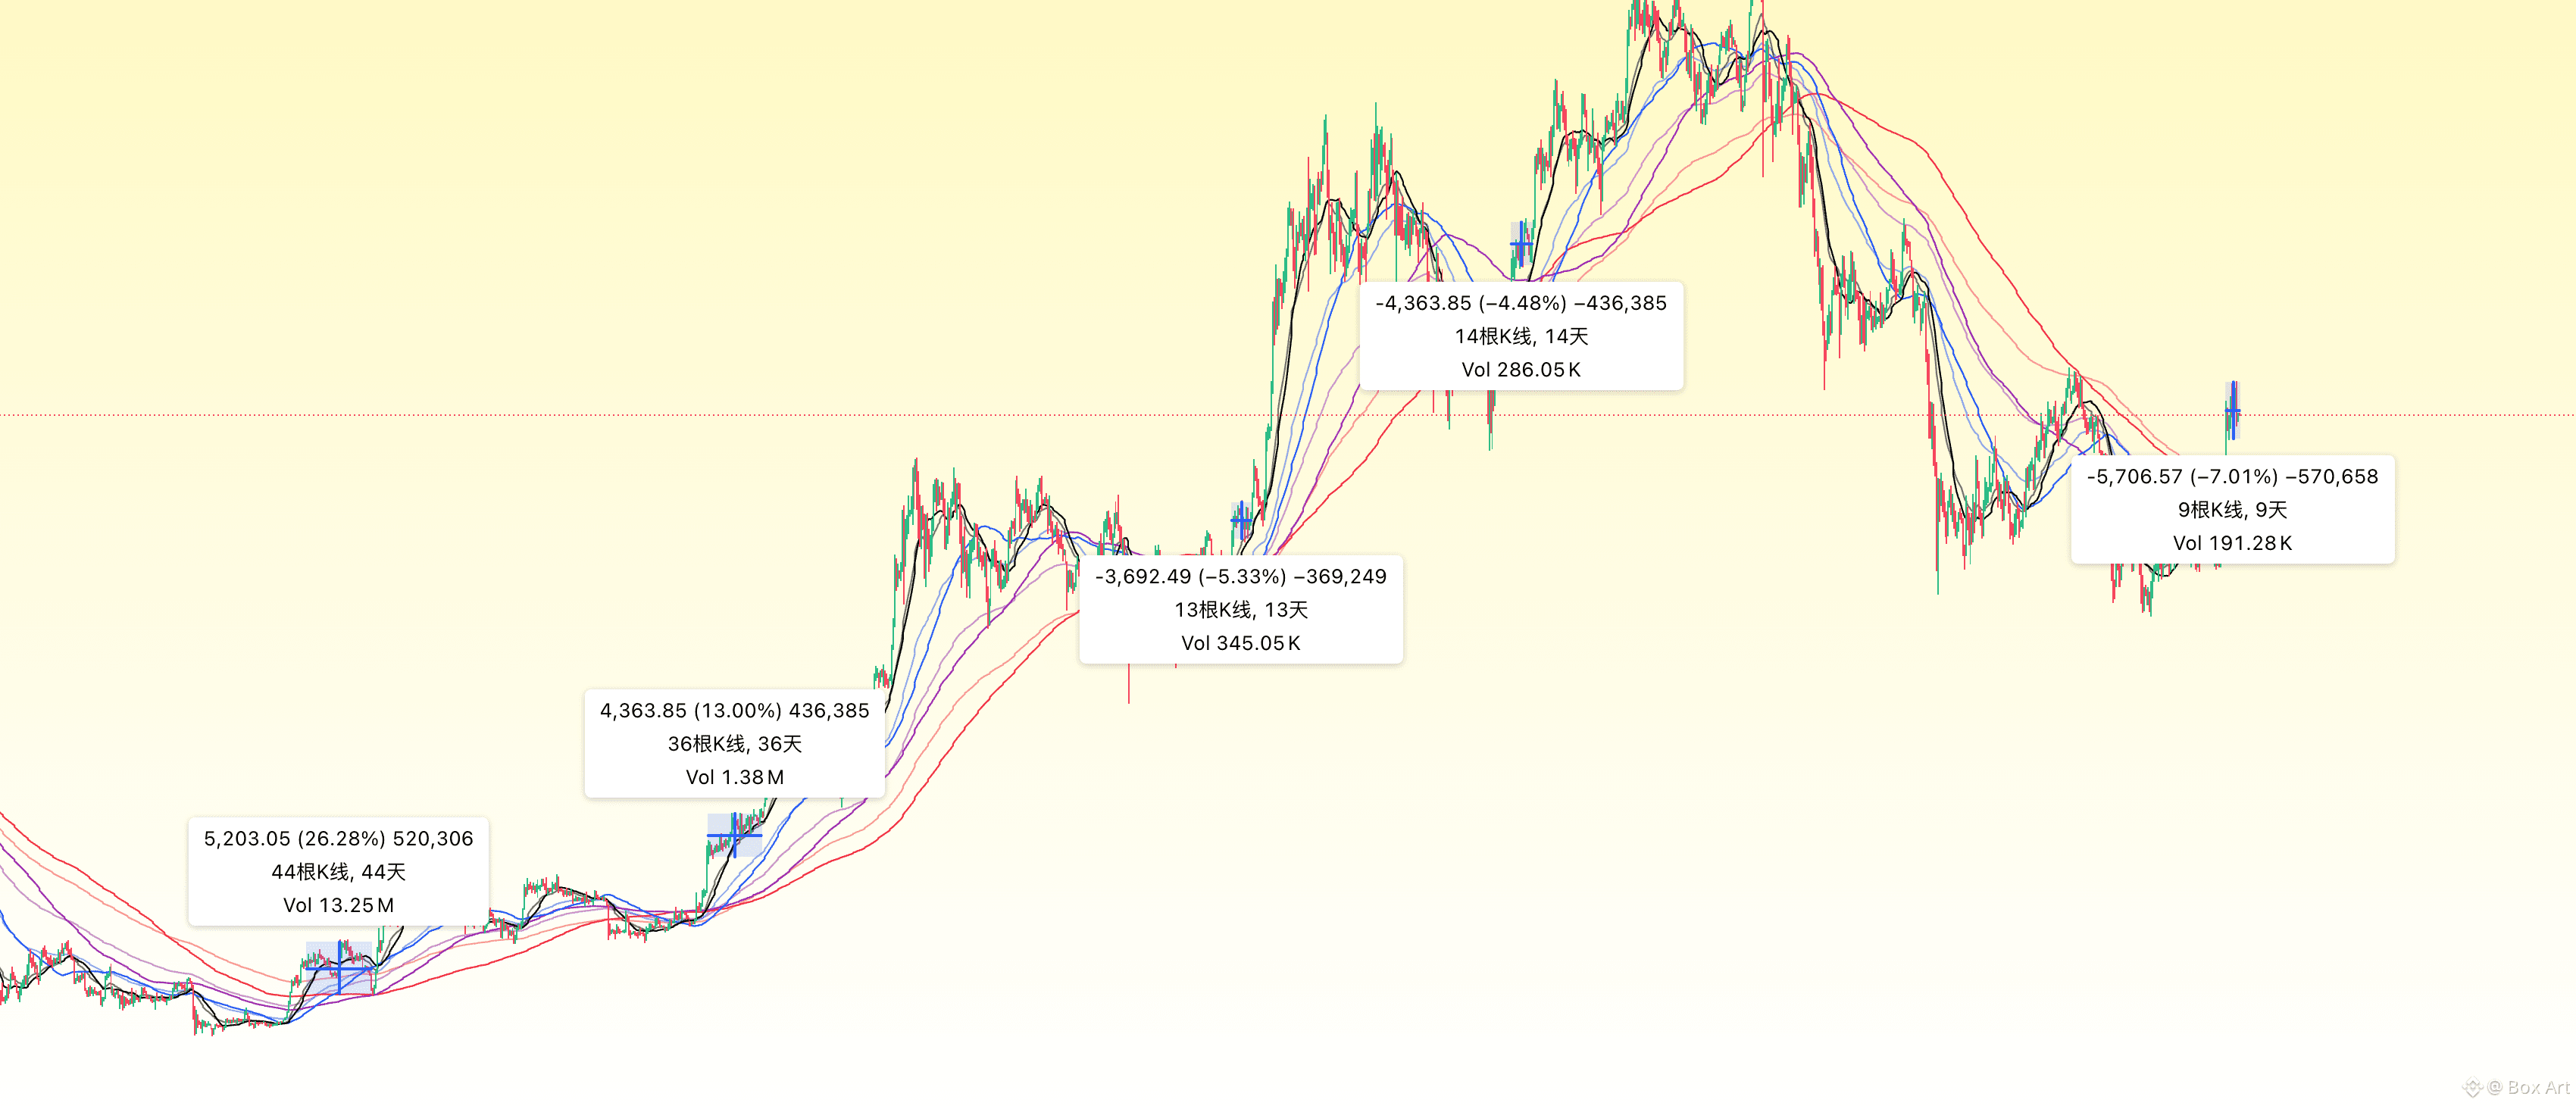
$BTC before the daily line level moving averages completely cross over, how long does it take to start the main uptrend and how big will the amplitude be? Please see the chart. There will definitely be a pullback, but how deep it will go is unpredictable. High-leverage gamblers, pay attention.
Box Art
·
--
$BTC After the first four times at the daily chart level, a breakout above opens the main upswing. This time the breakout has already completed. I choose to ignore the noise at the smaller timeframes and continue holding the position, adding in batches when the RSI is oversold (at least on the 1-hour timeframe).
$BTC After the first four times at the daily chart level, a breakout above opens the main upswing. This time the breakout has already completed. I choose to ignore the noise at the smaller timeframes and continue holding the position, adding in batches when the RSI is oversold (at least on the 1-hour timeframe).
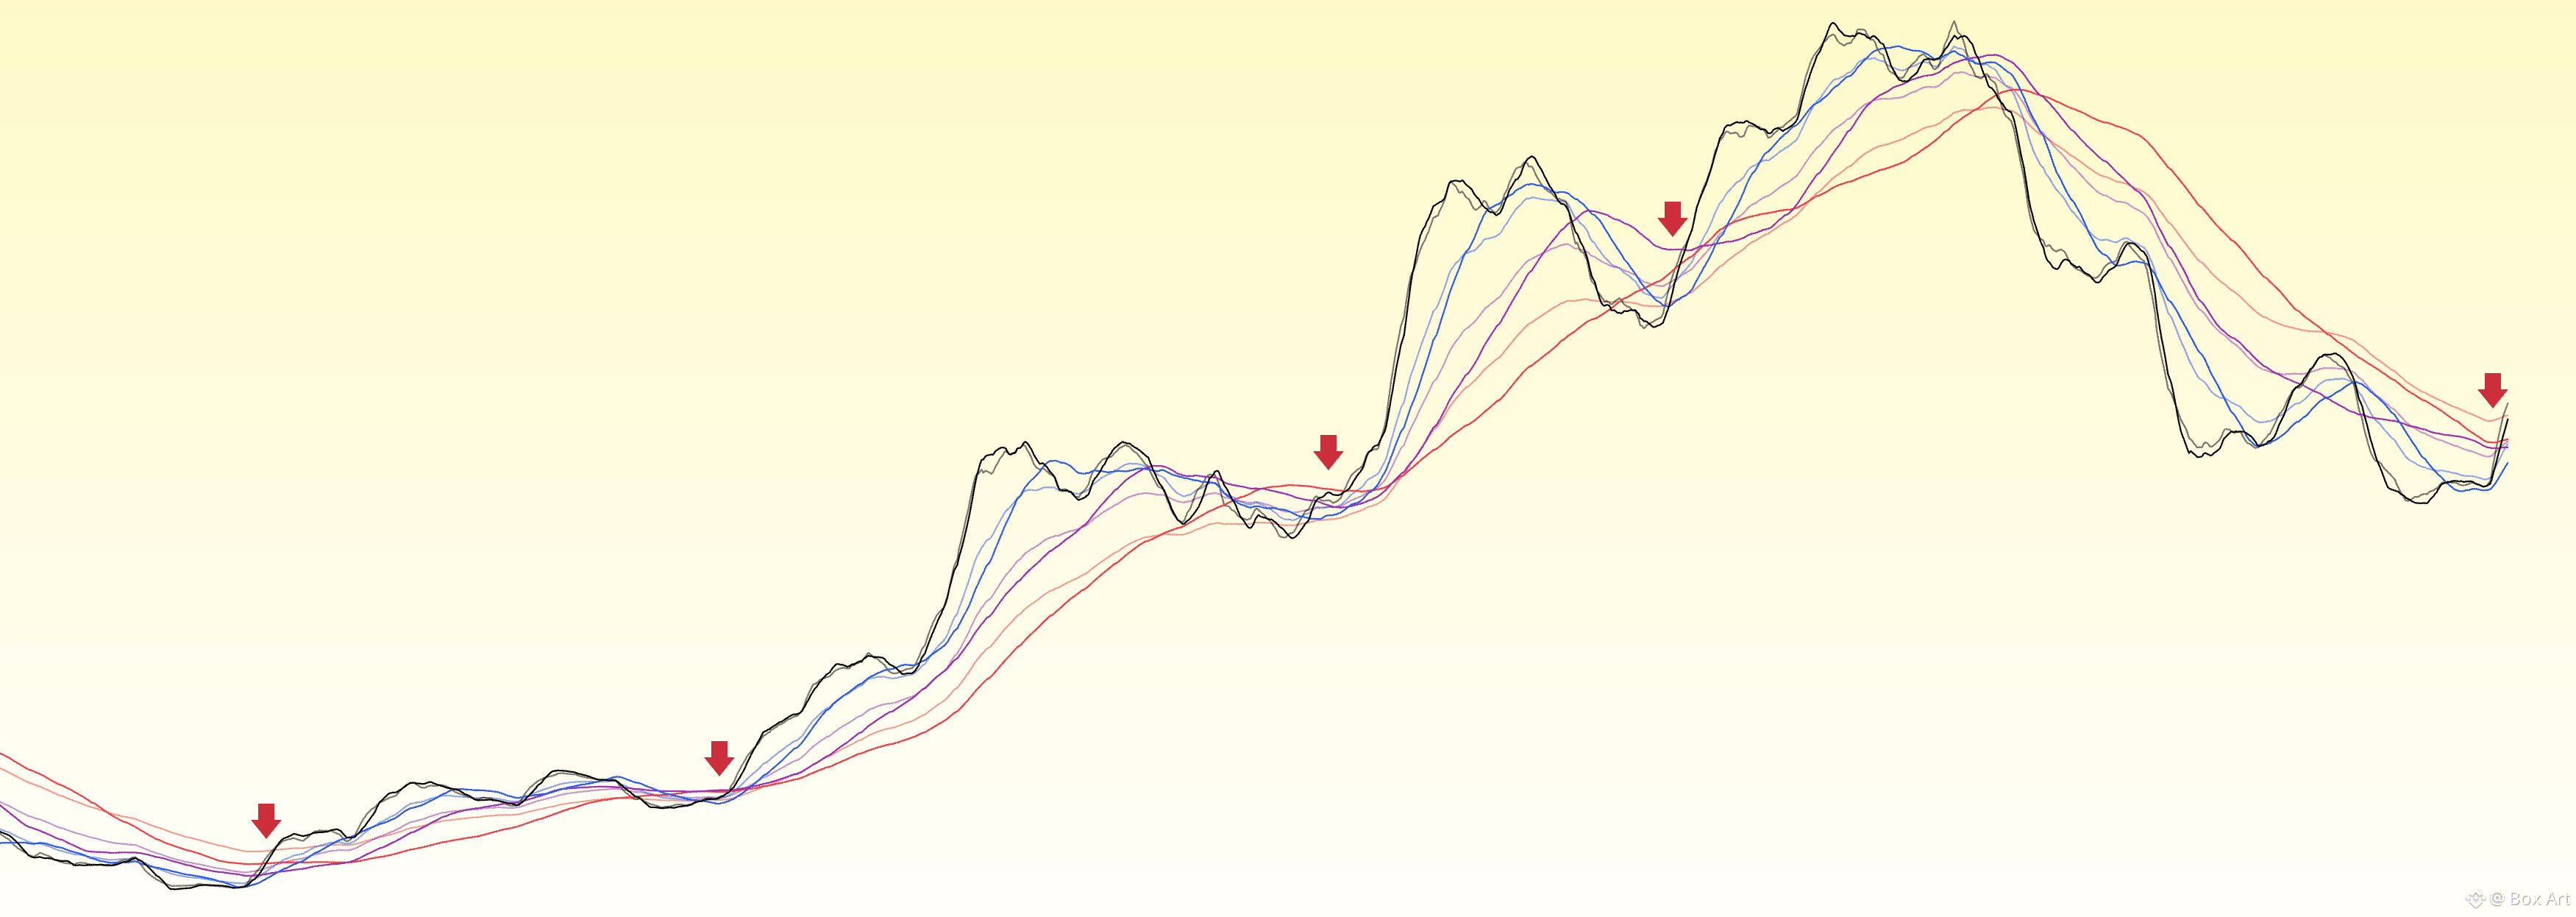
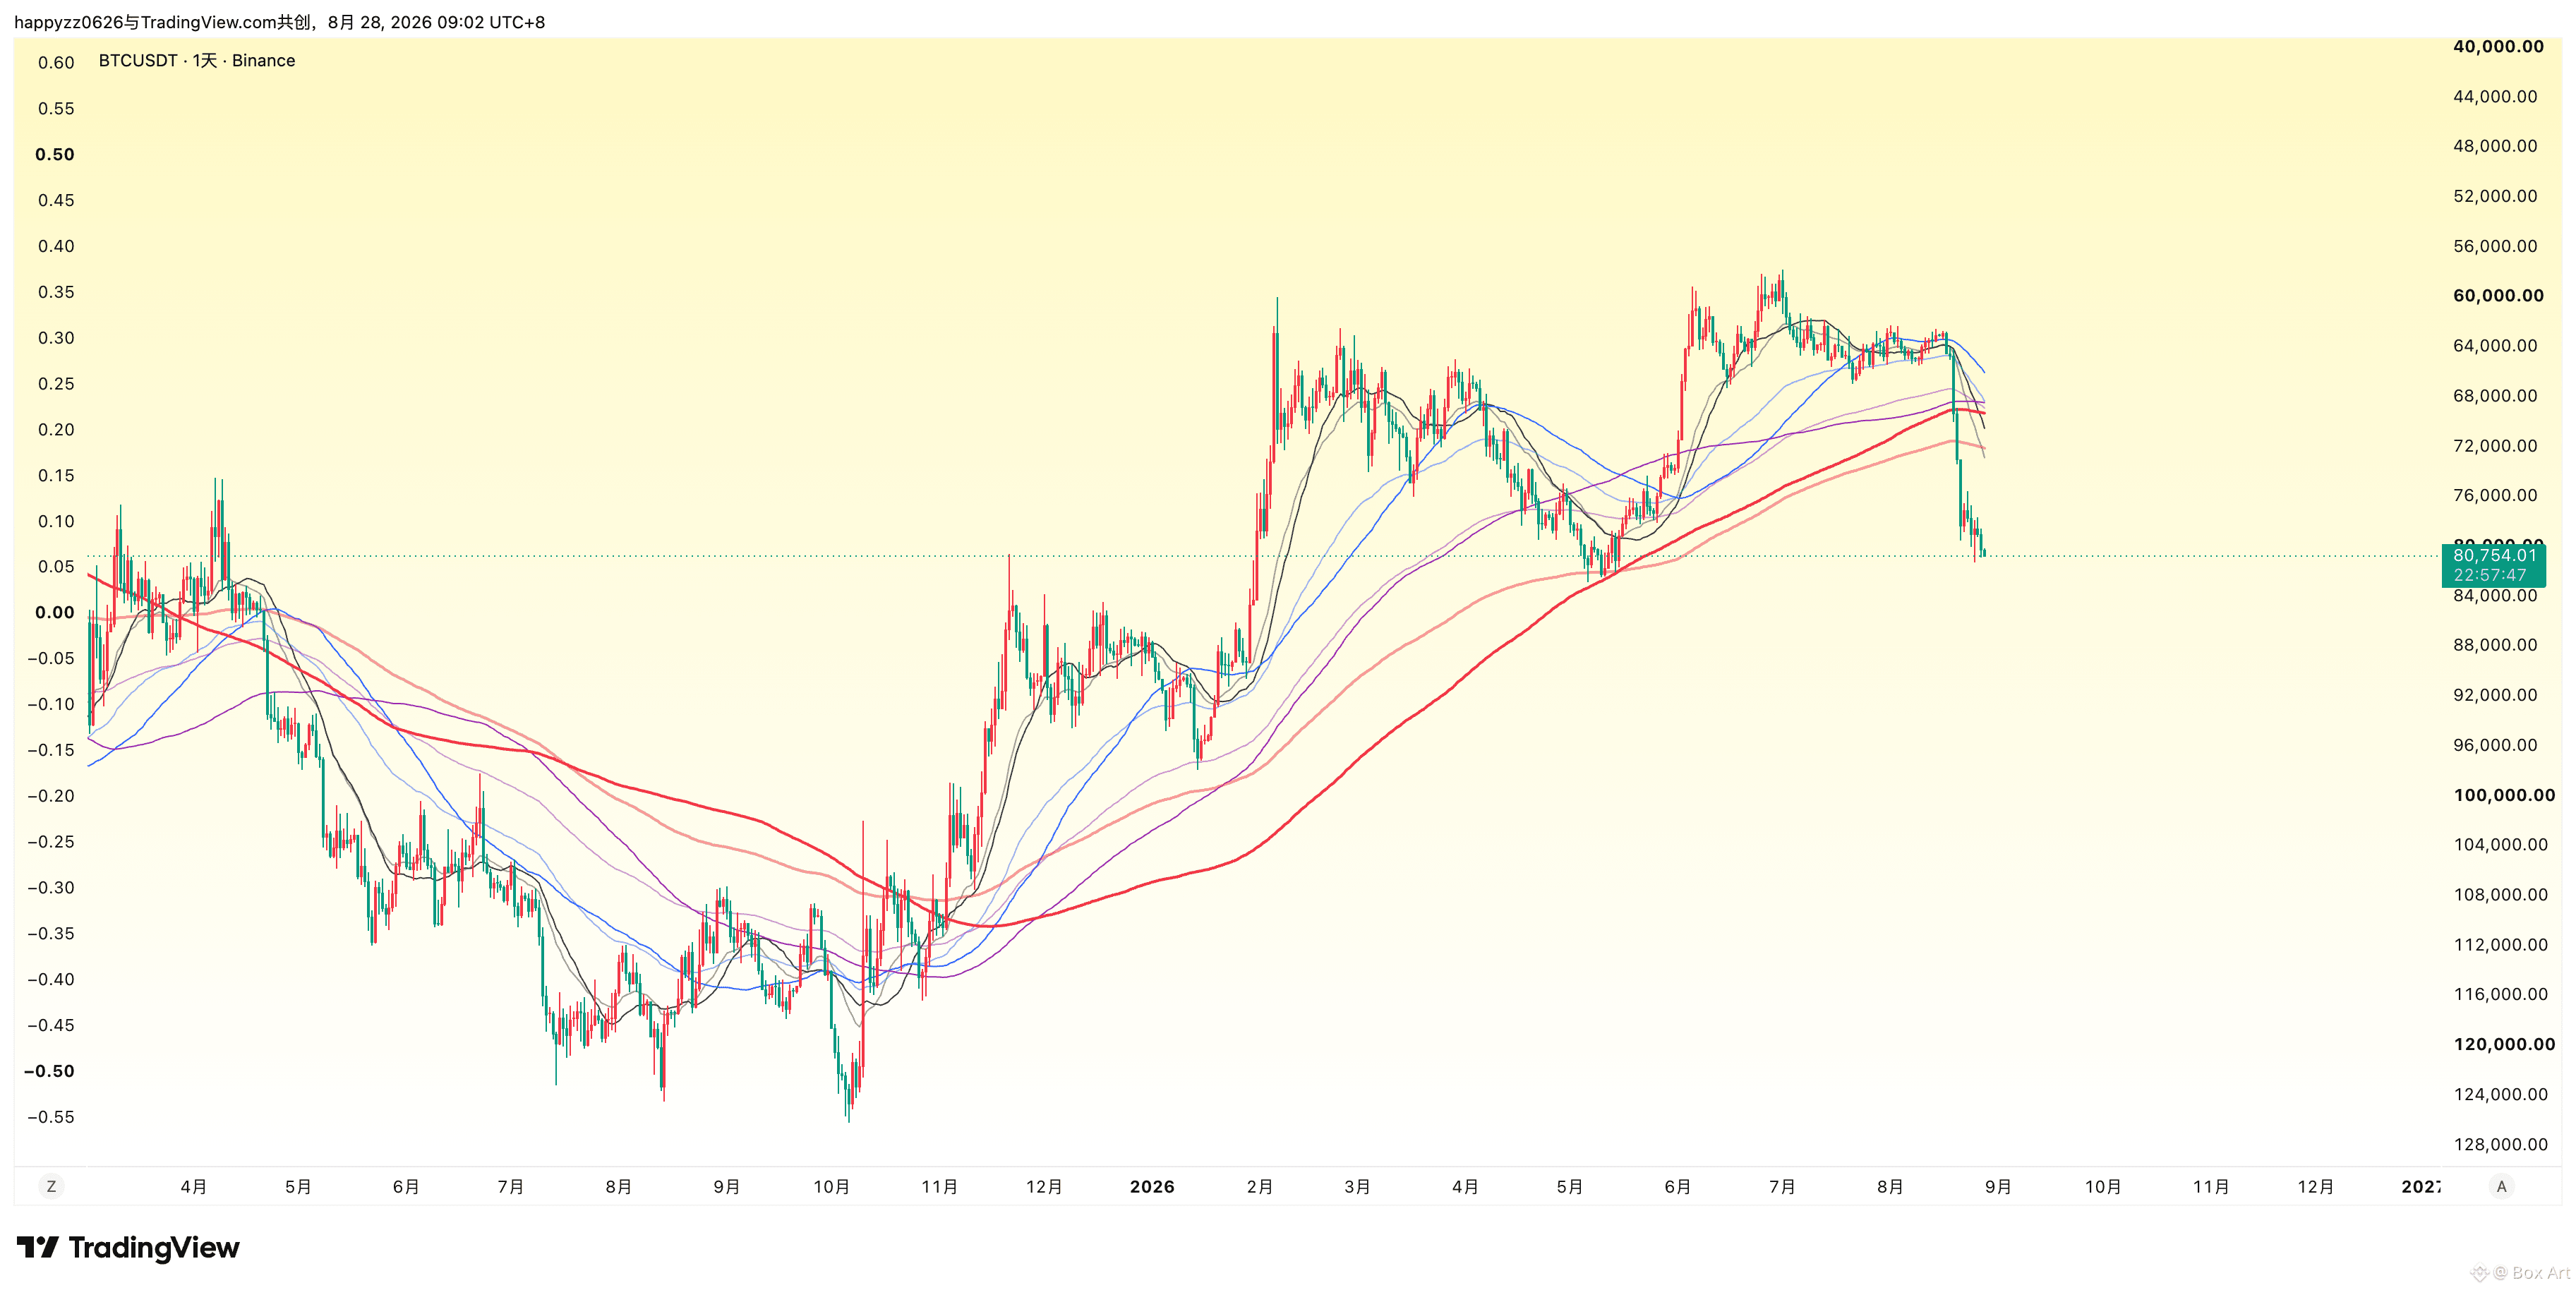
$BTC If it's you? When you see this kind of form, what would you do?
Box Art
·
--
Main surge formation—please don’t fight against it to take short positions. When the RSI is oversold, it’s the time to buy in batches.
Main surge formation—please don’t fight against it to take short positions. When the RSI is oversold, it’s the time to buy in batches.
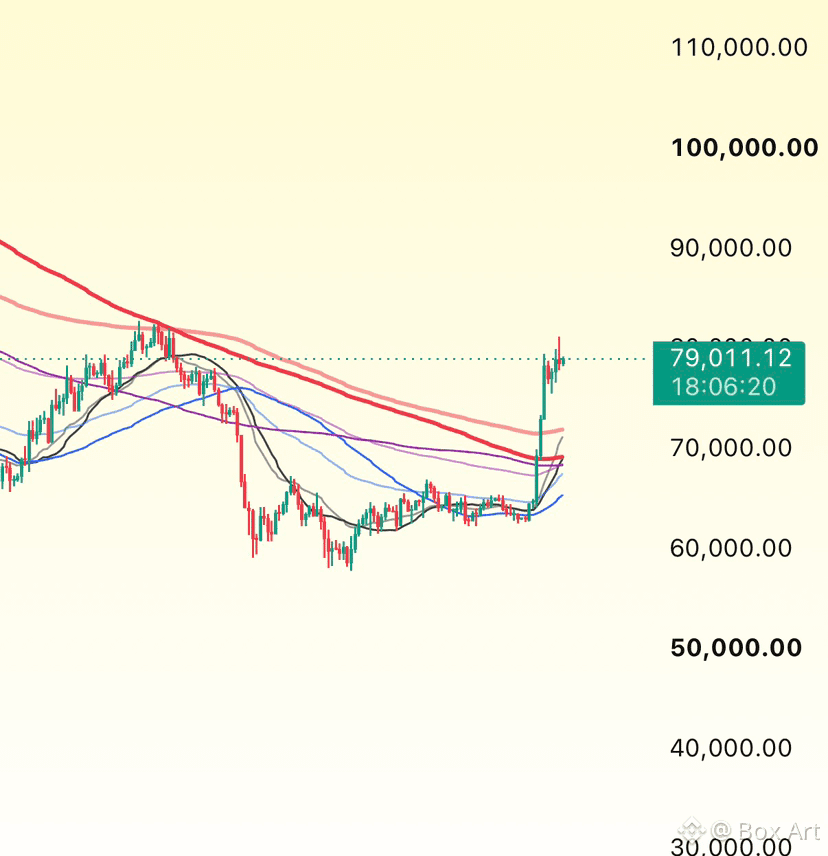
If you missed the move, don’t panic. If you didn’t catch the rhythm, this all-in indicator isn’t ready yet. Once it’s ready, I’ll let you know. Tap follow and make sure you’re paying attention—this is the last chance. Otherwise, you’ll just keep missing out; at least you won’t lose money. When you feel fear next time, be brave.
Box Art
·
--
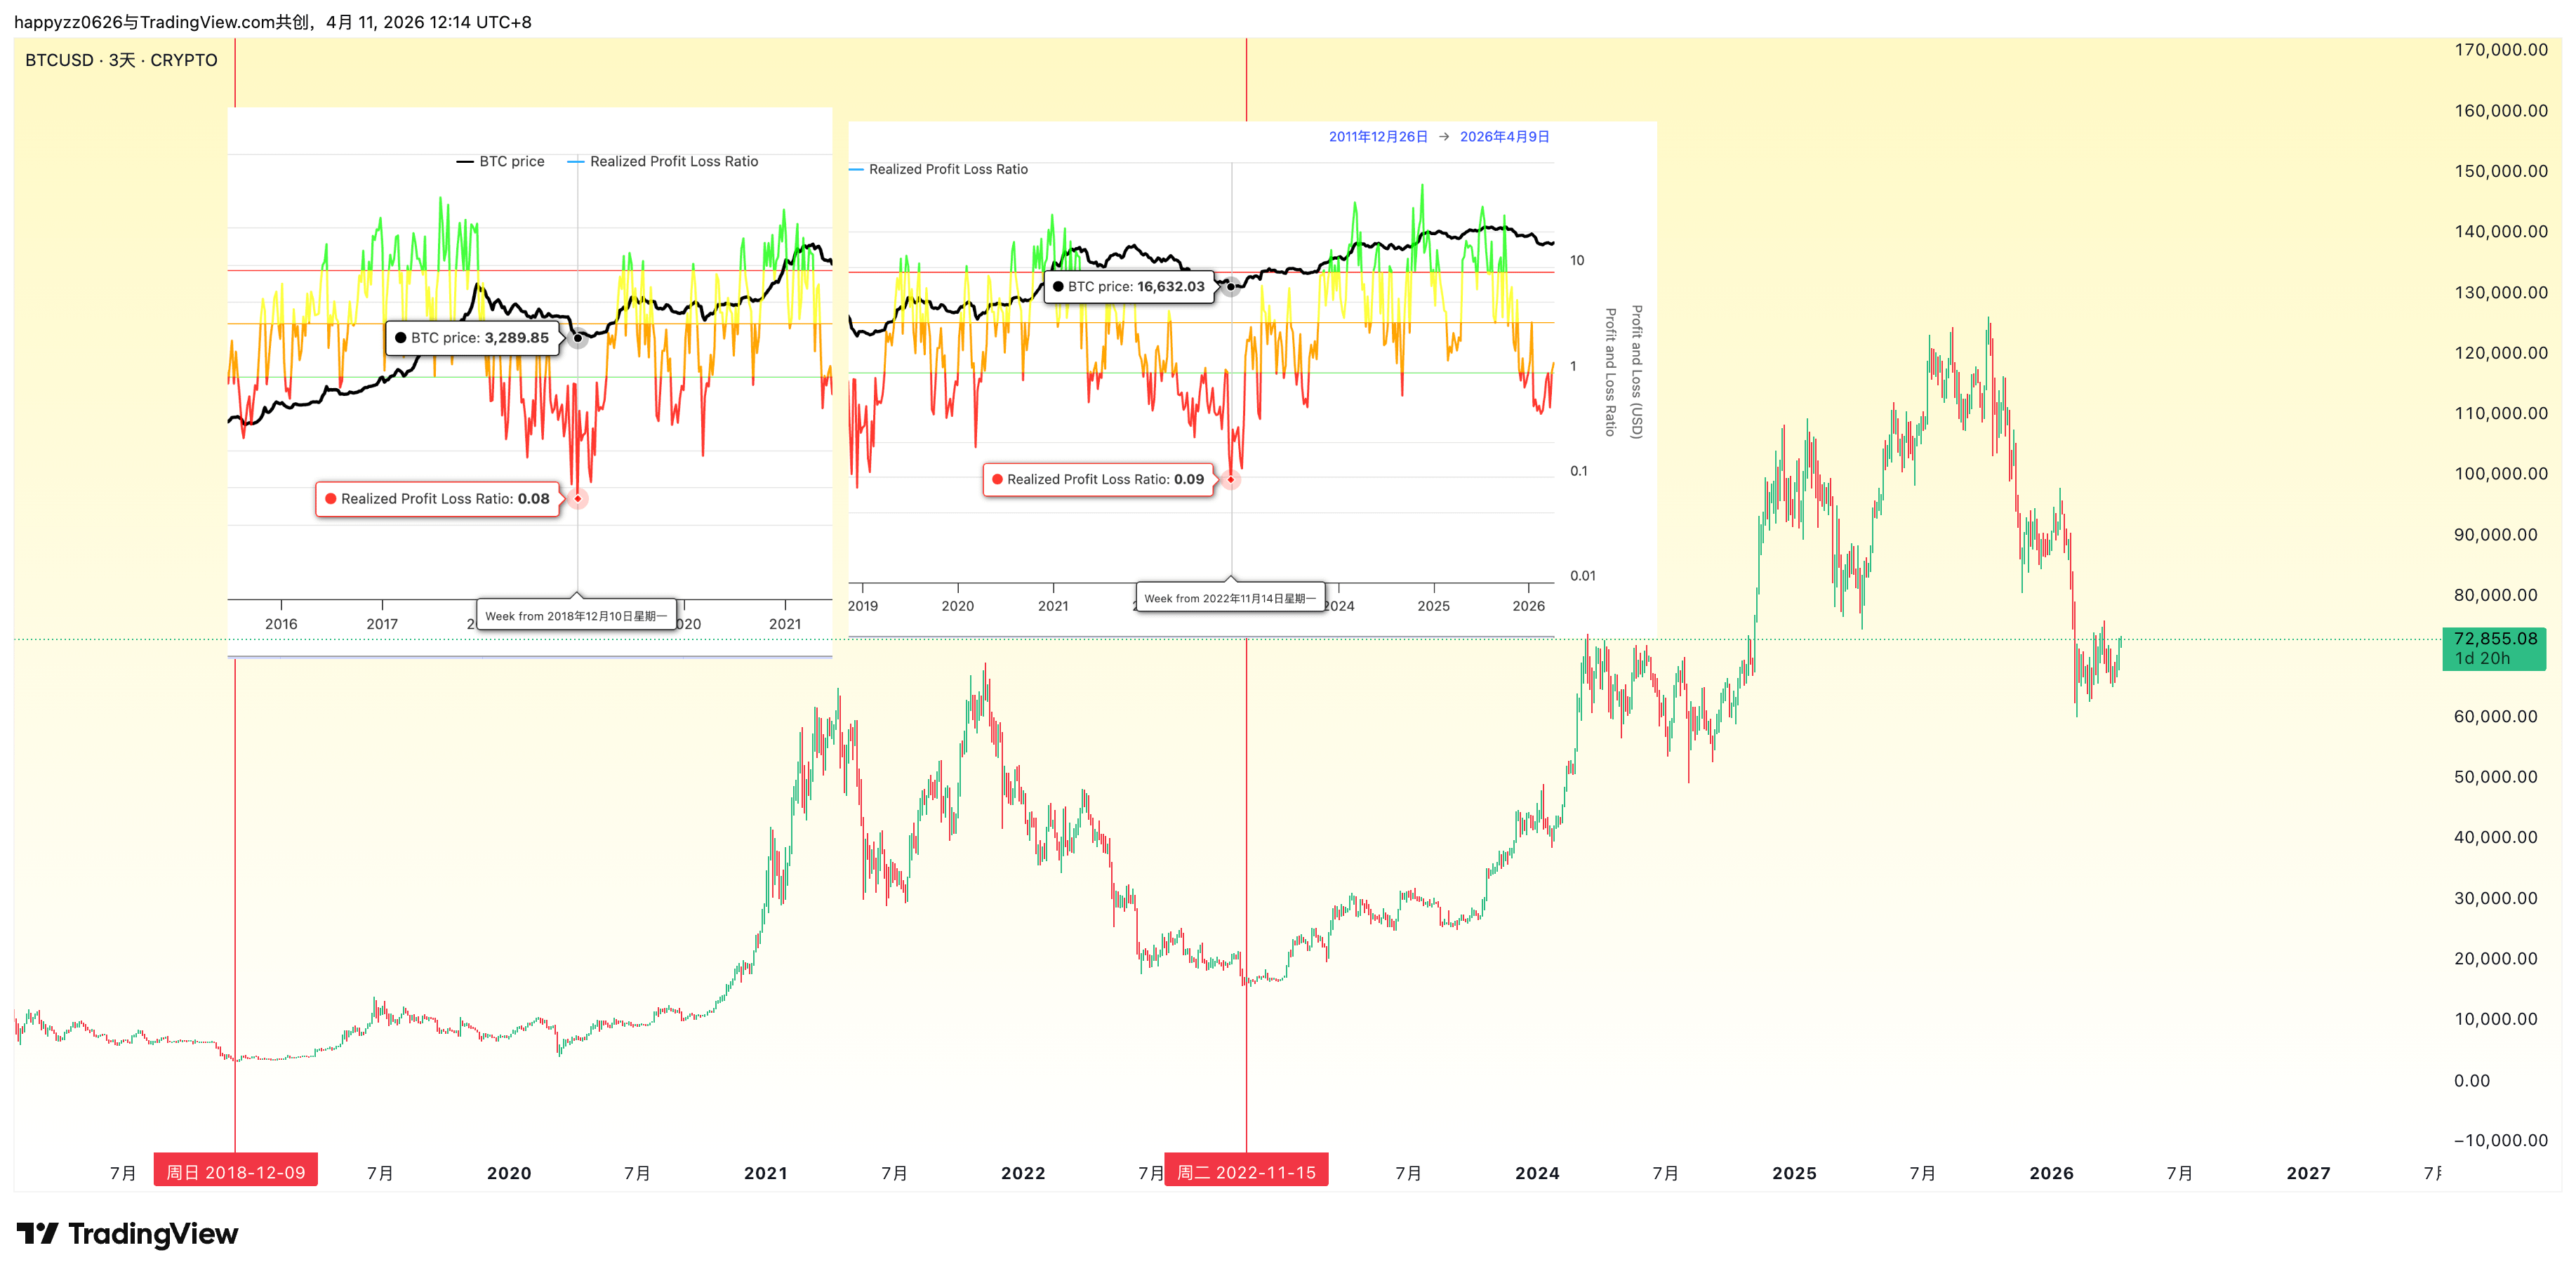
$BTC The real bottom will be when the realized profit-loss ratio of Bitcoin reaches around 0.1. I have been waiting for this position. When it is in place, I will come out and ask you to go all in. At this stage, please keep your bullets safe. The timing is uncertain, I will observe regularly, and the bottom usually provides ample time to get on board. The real bottom, no one is competing with you, not many people mention it, bottom-fishing can be very lonely.
At least give the Air Force some time to negotiate C2C? If you do things like this, who will ever C2C you in the future, big-bun?
$BTC you believe it?
Box Art
·
--
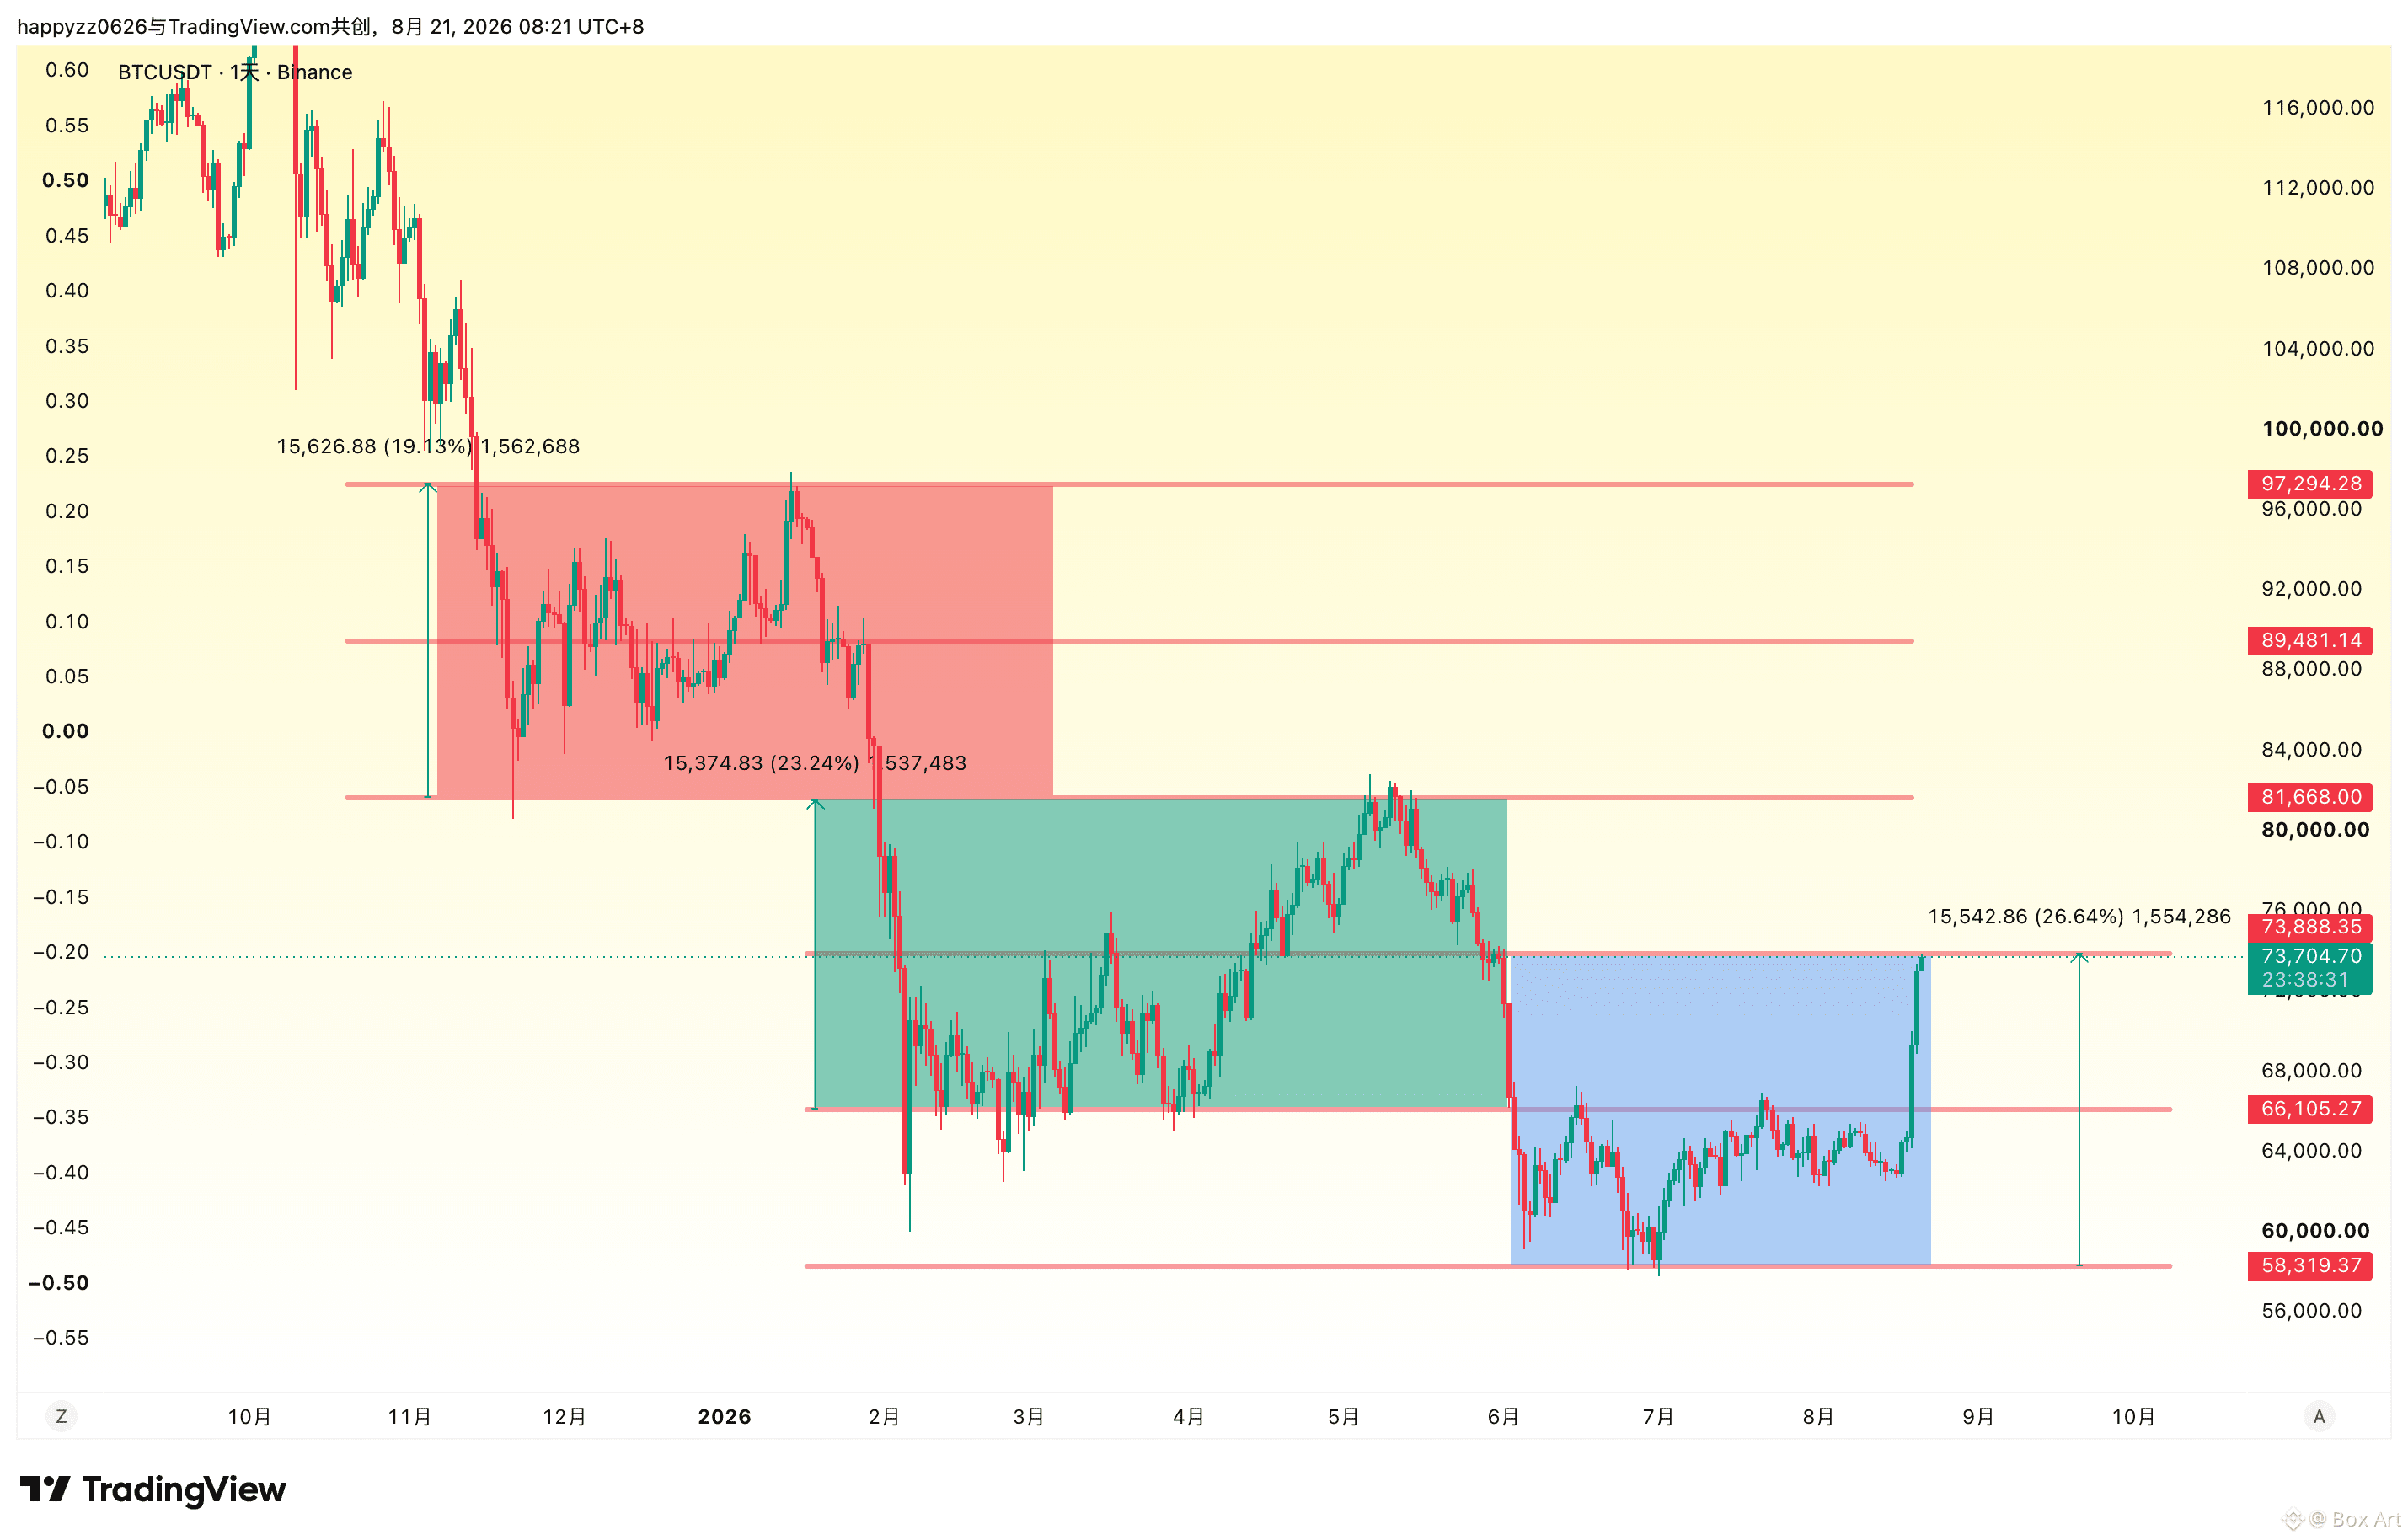
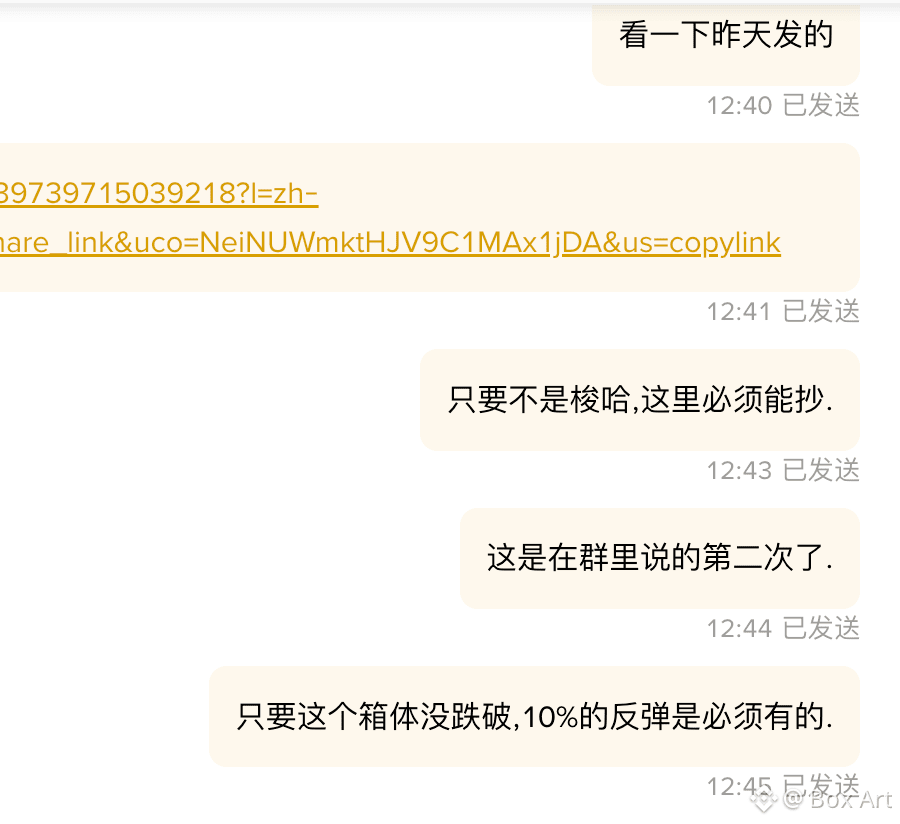
$BTC can it be tried again? Every time the rebound height is always 2 box segments—aren’t you amazed? Will this time be different? To achieve a target position holding time of 40 days or more: for contract players, when dipping into the lows on the left side, pay attention to your position sizing and stop-loss. If it blows up, don’t come looking for me. As for me, I bought spot—so I won’t move. If it breaks below my level, I’ll be even happier. I’m not fully loaded. If the rebound is 2 box segments, I’ll make a small profit; if it keeps dropping another box segment, I’ll add more to my position.
I heard you’re paying to fight anti-spam? 😅
Let me say thank you, because with you, every season feels warm.
Let me say thank you, because with you, every season feels warm.
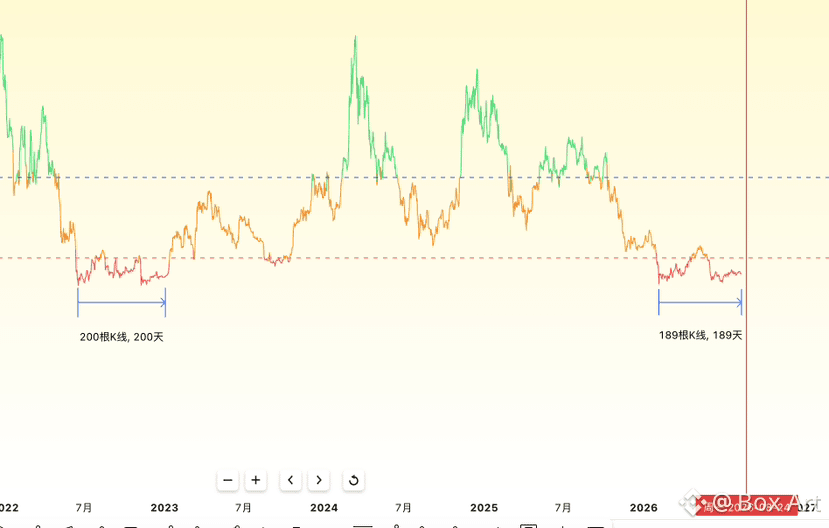
$BTC AHR indicator: After the previous round of bottoming out for 200 days, it started. This round is 5 days away from the 200-day mark.
Box Art
·
--
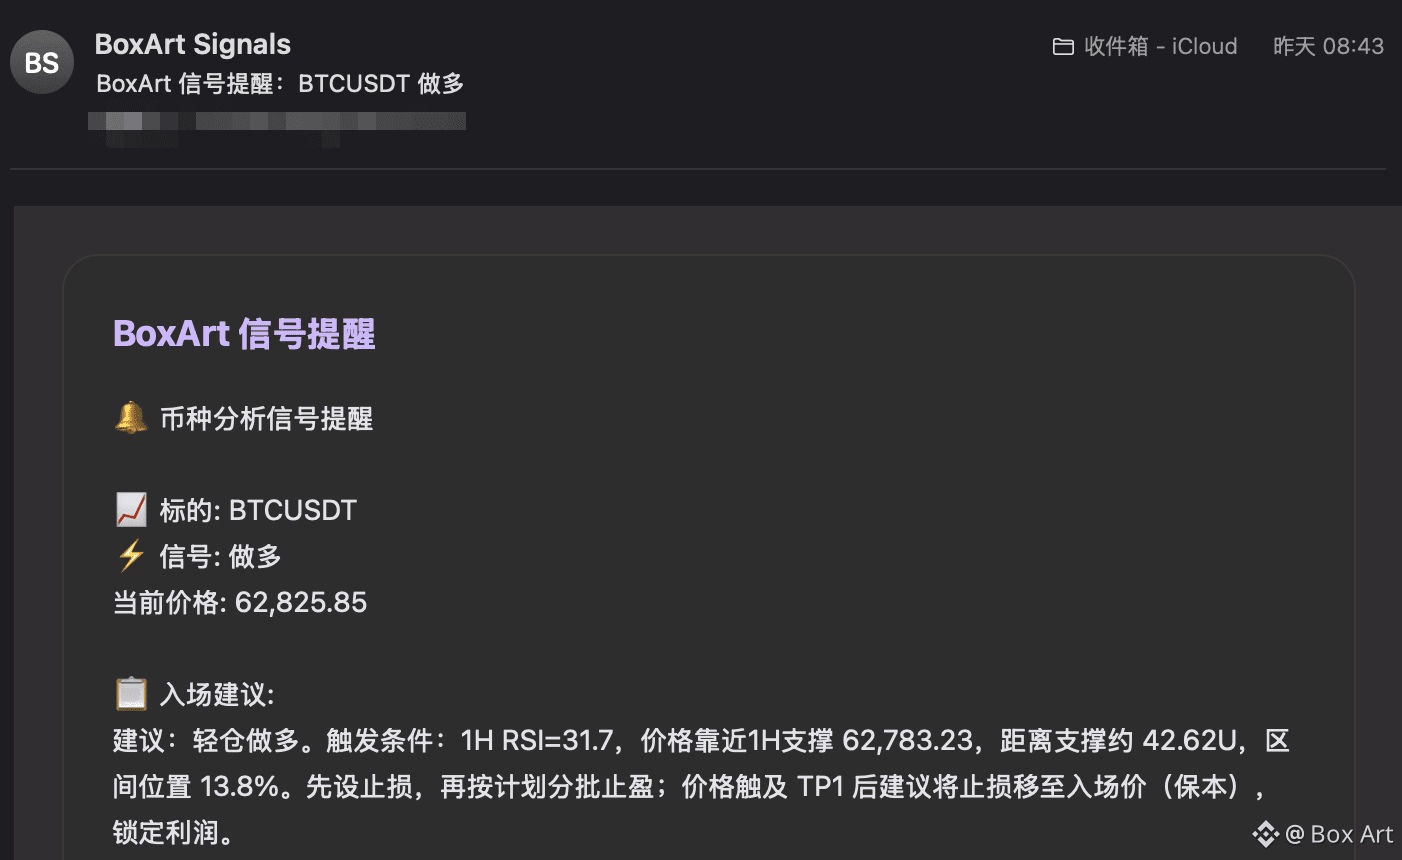
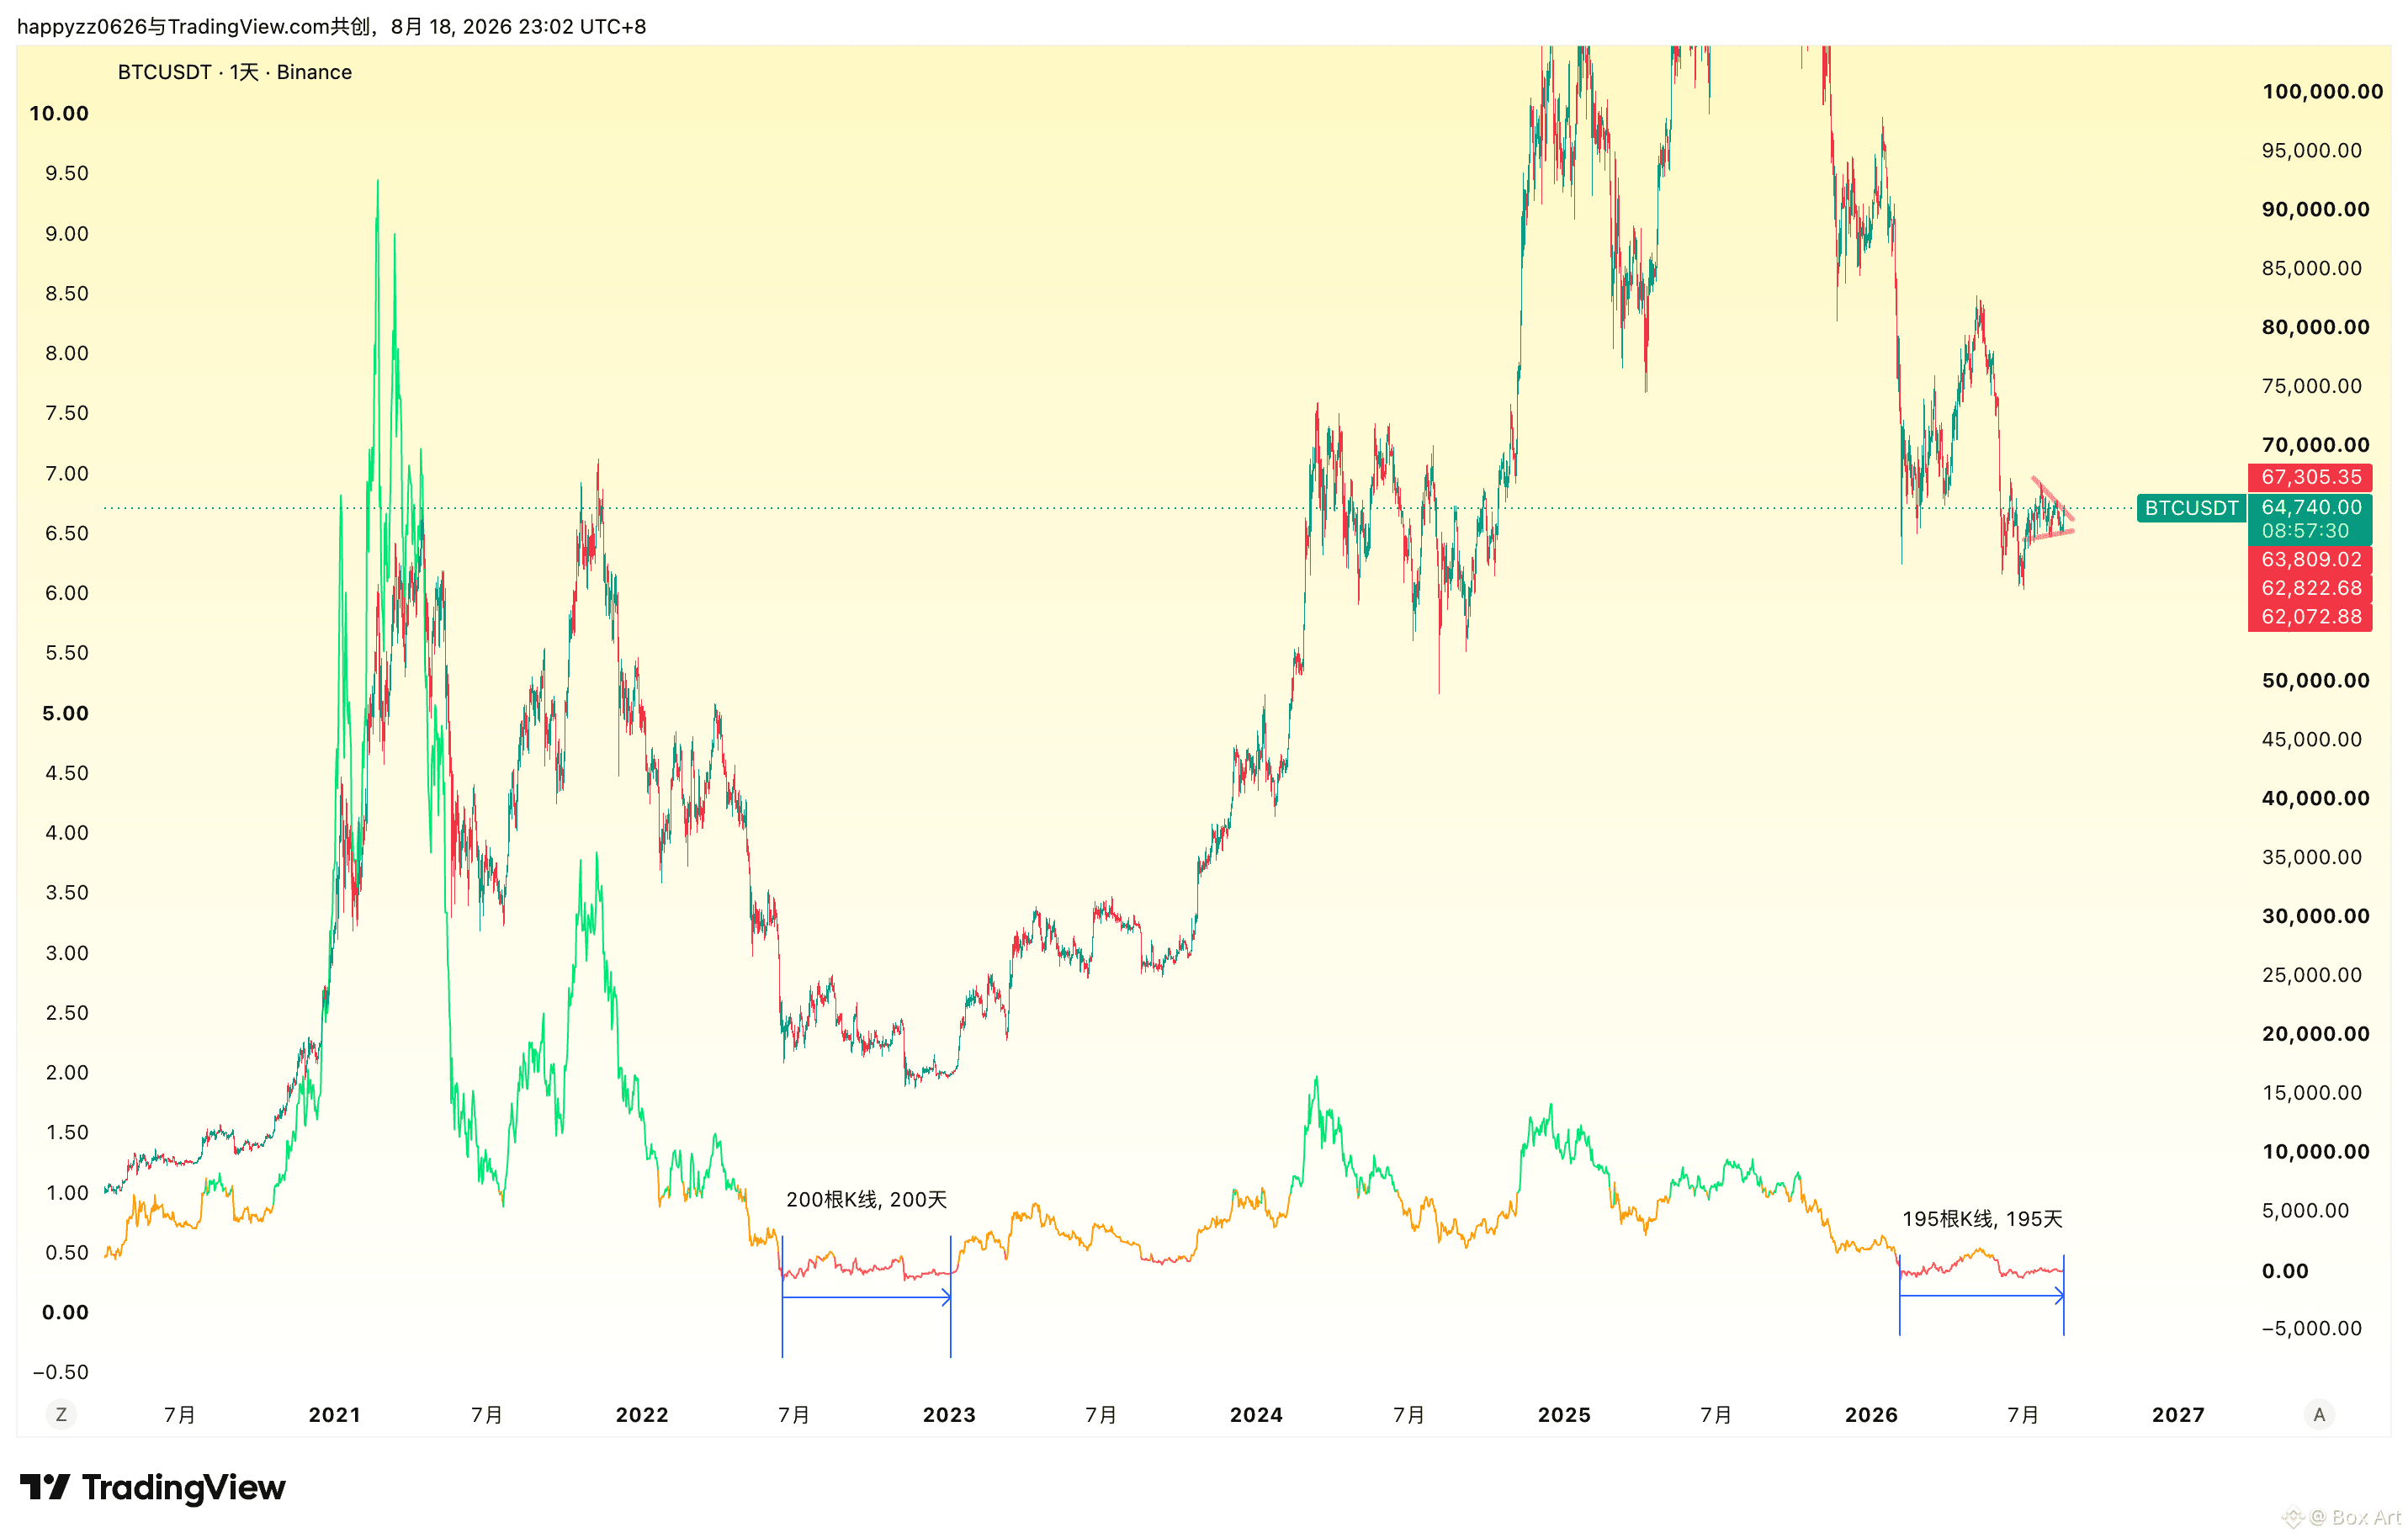
$BTC AHR indicator started after the last round of bottoming out 200 days ago. This time, there are 6 days left in the 200-day countdown. The spring has already compressed to the end, ready to unleash.
$BTC AHR indicator started after the last round of bottoming out 200 days ago. This time, there are 6 days left in the 200-day countdown. The spring has already compressed to the end, ready to unleash.
Box Art
·
--
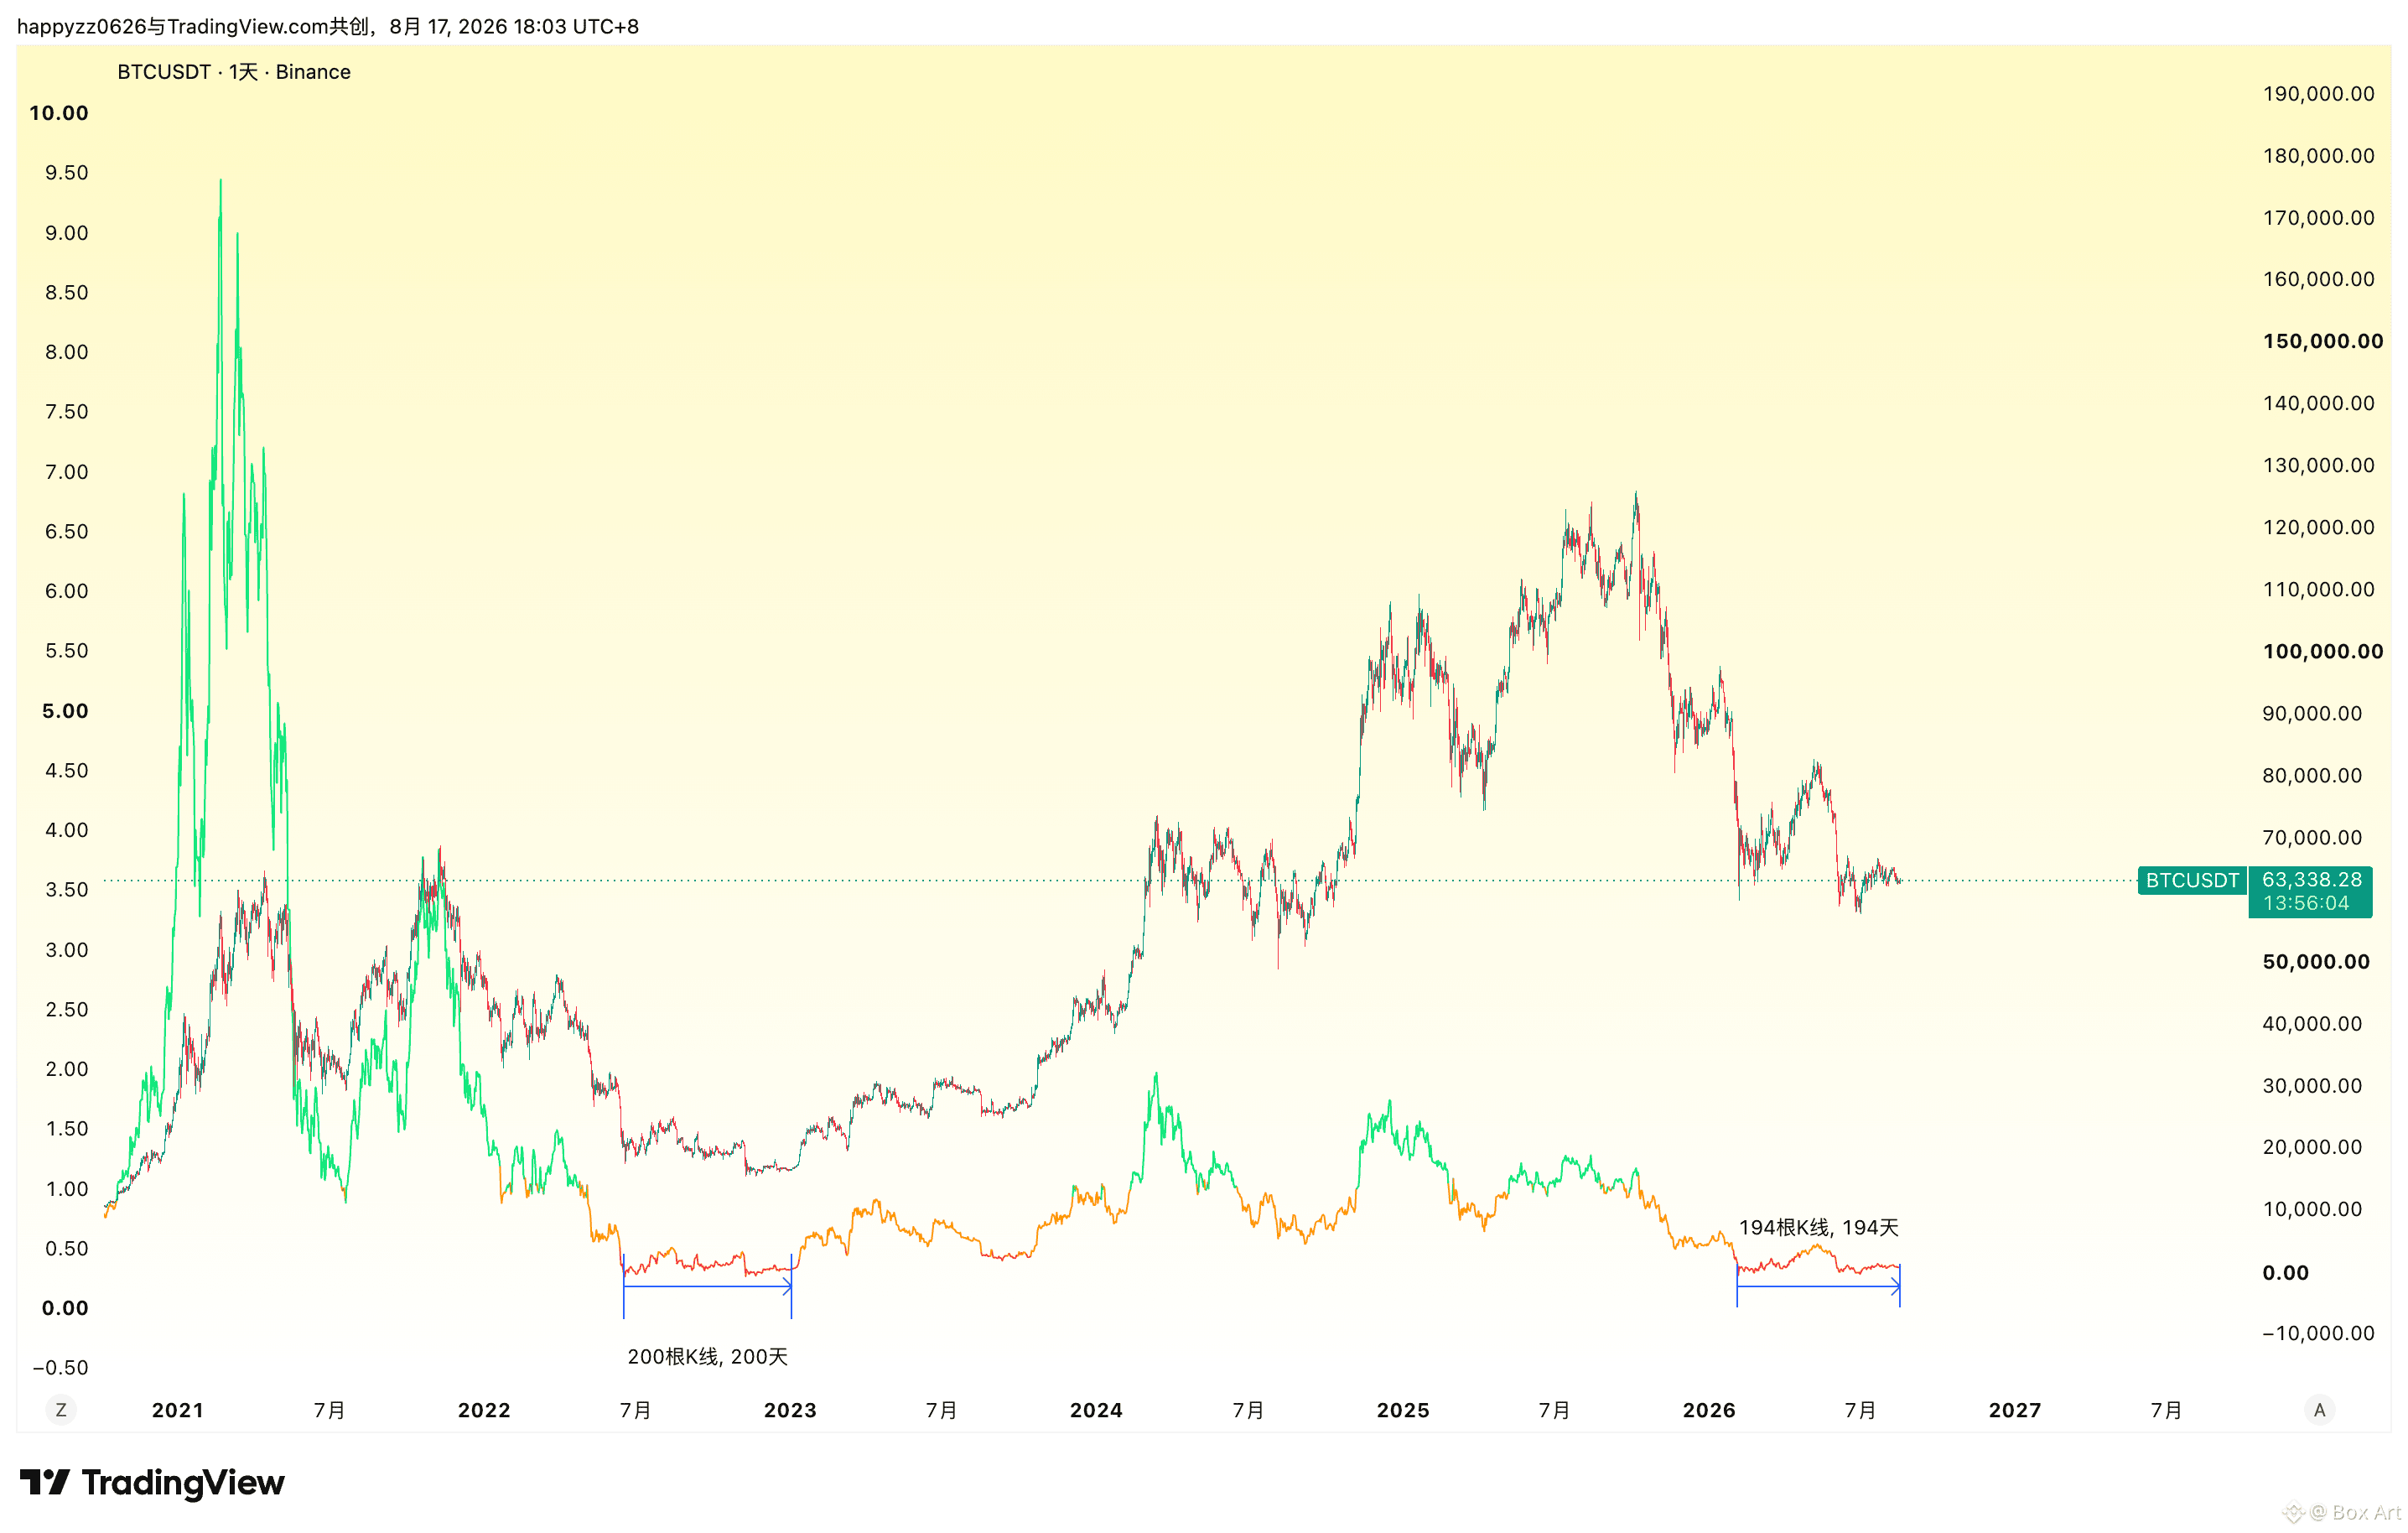
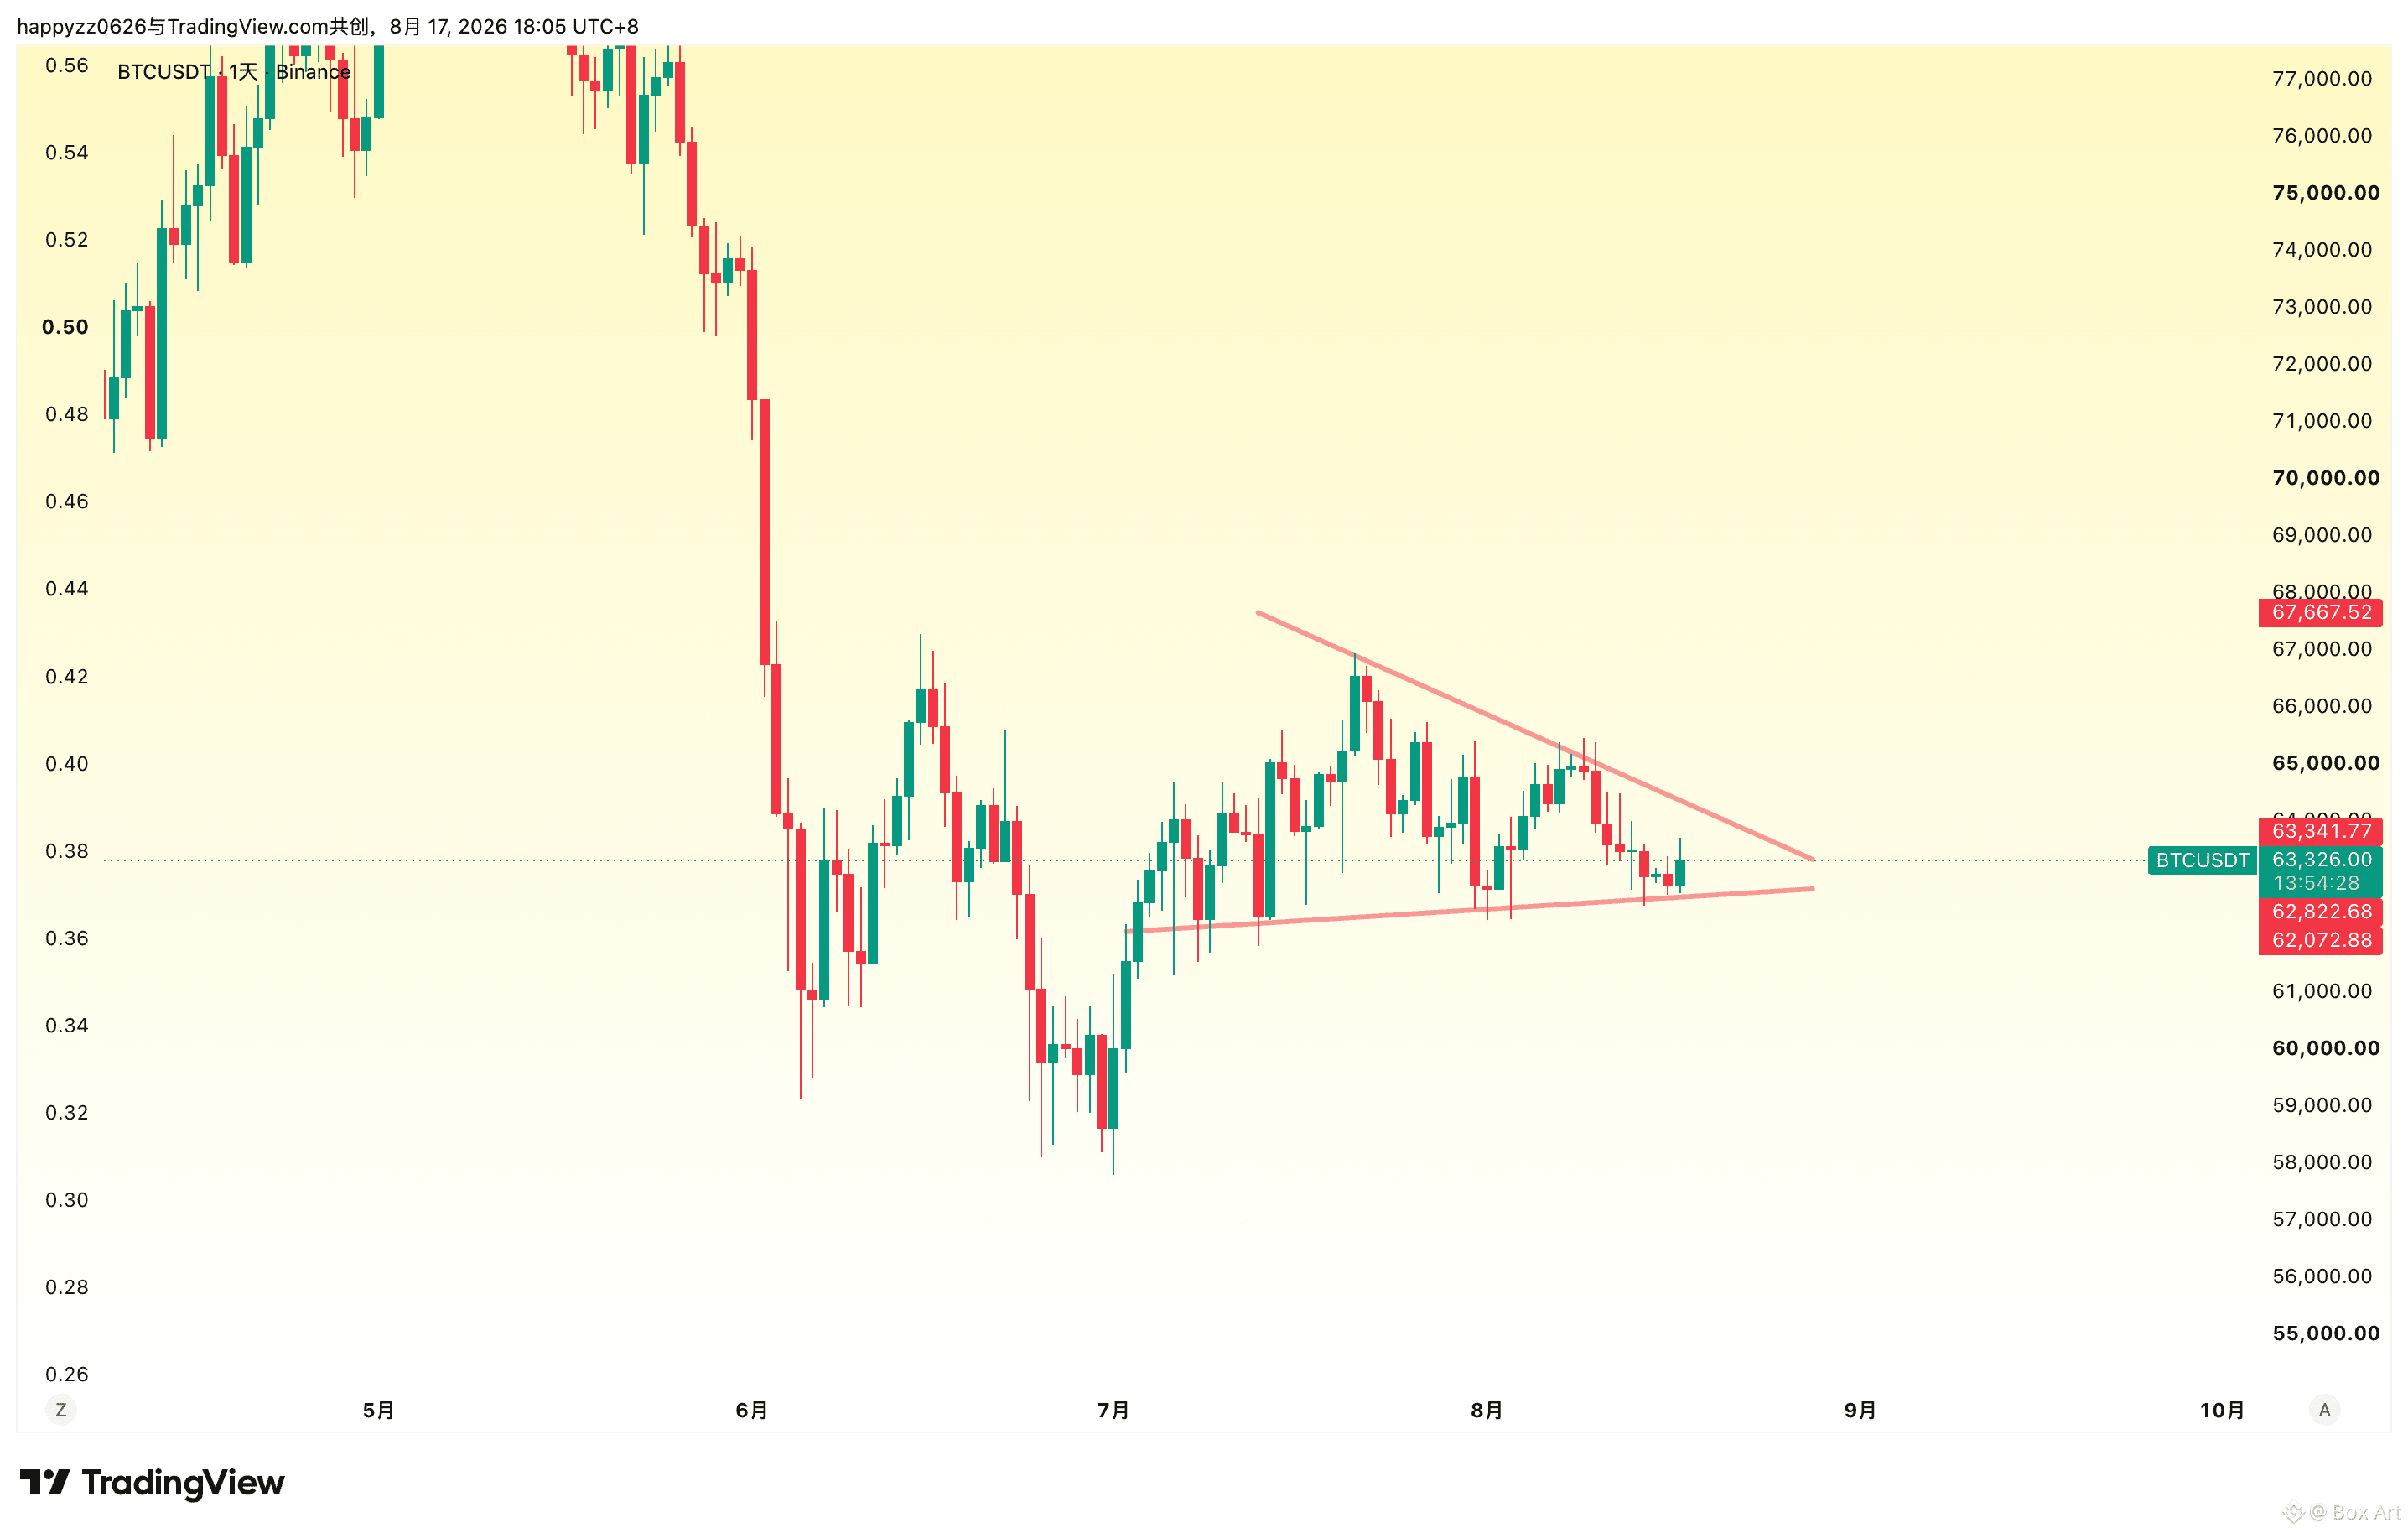
AHR999 indicator—after the previous 200-day base-building phase, it started; this time, there are 11 days left until 200 days.
AHR999 indicator—after the previous 200-day base-building phase, it started; this time, there are 11 days left until 200 days.
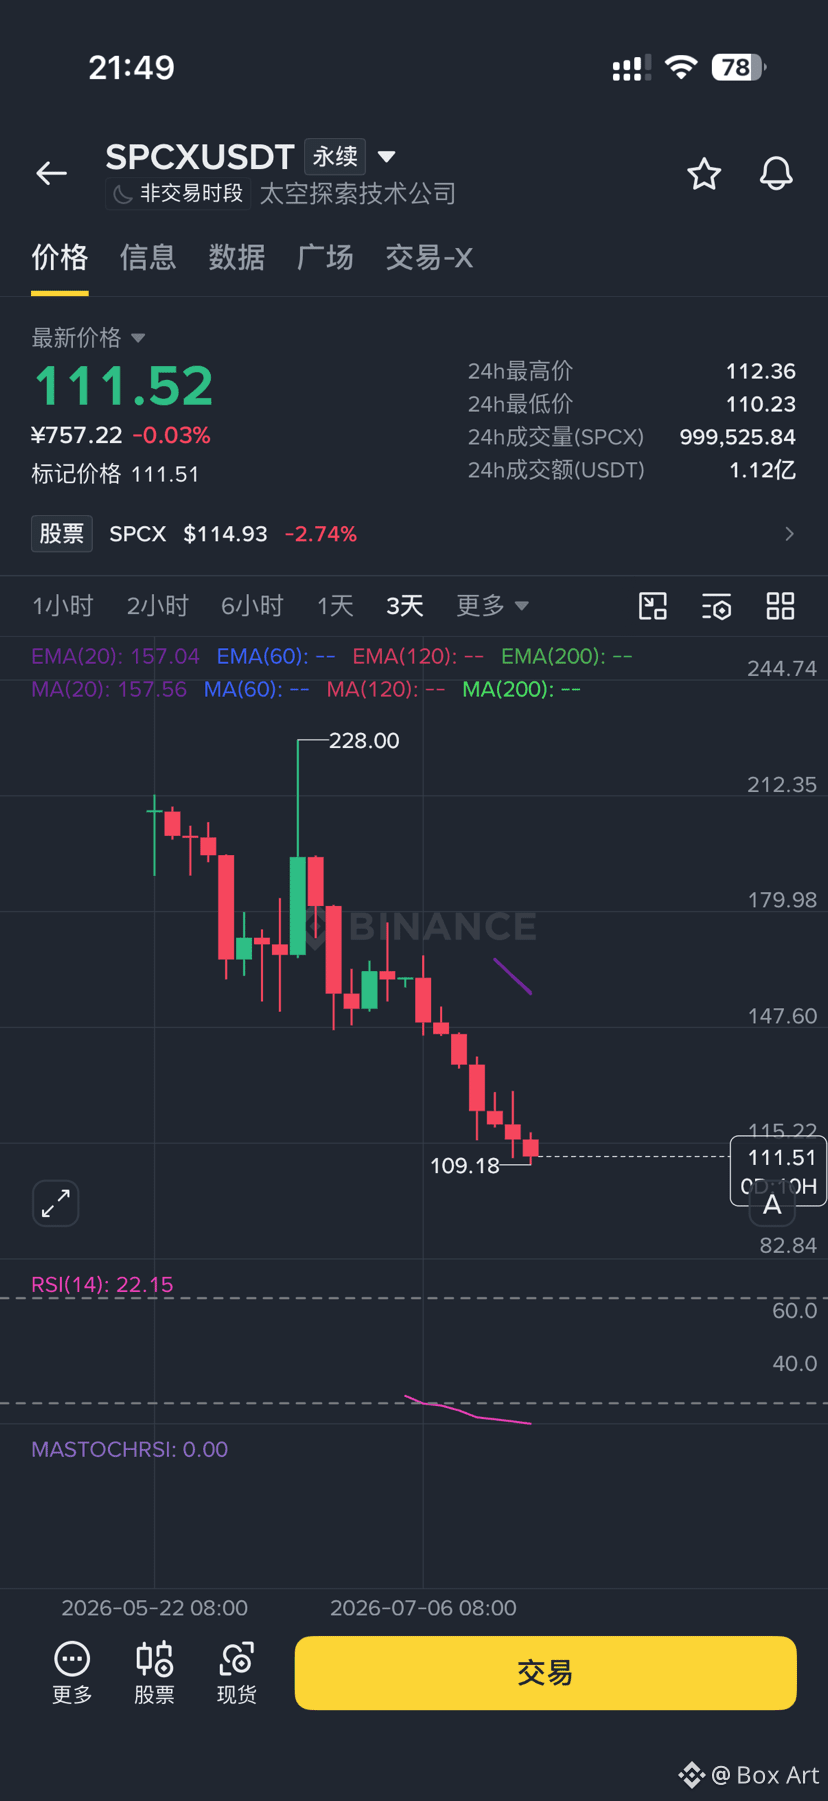
$SPCX What about the future of humanity we promised? Let’s consider entering after we’ve left the volatility range. Right now, there’s no sign that the downtrend is ending.
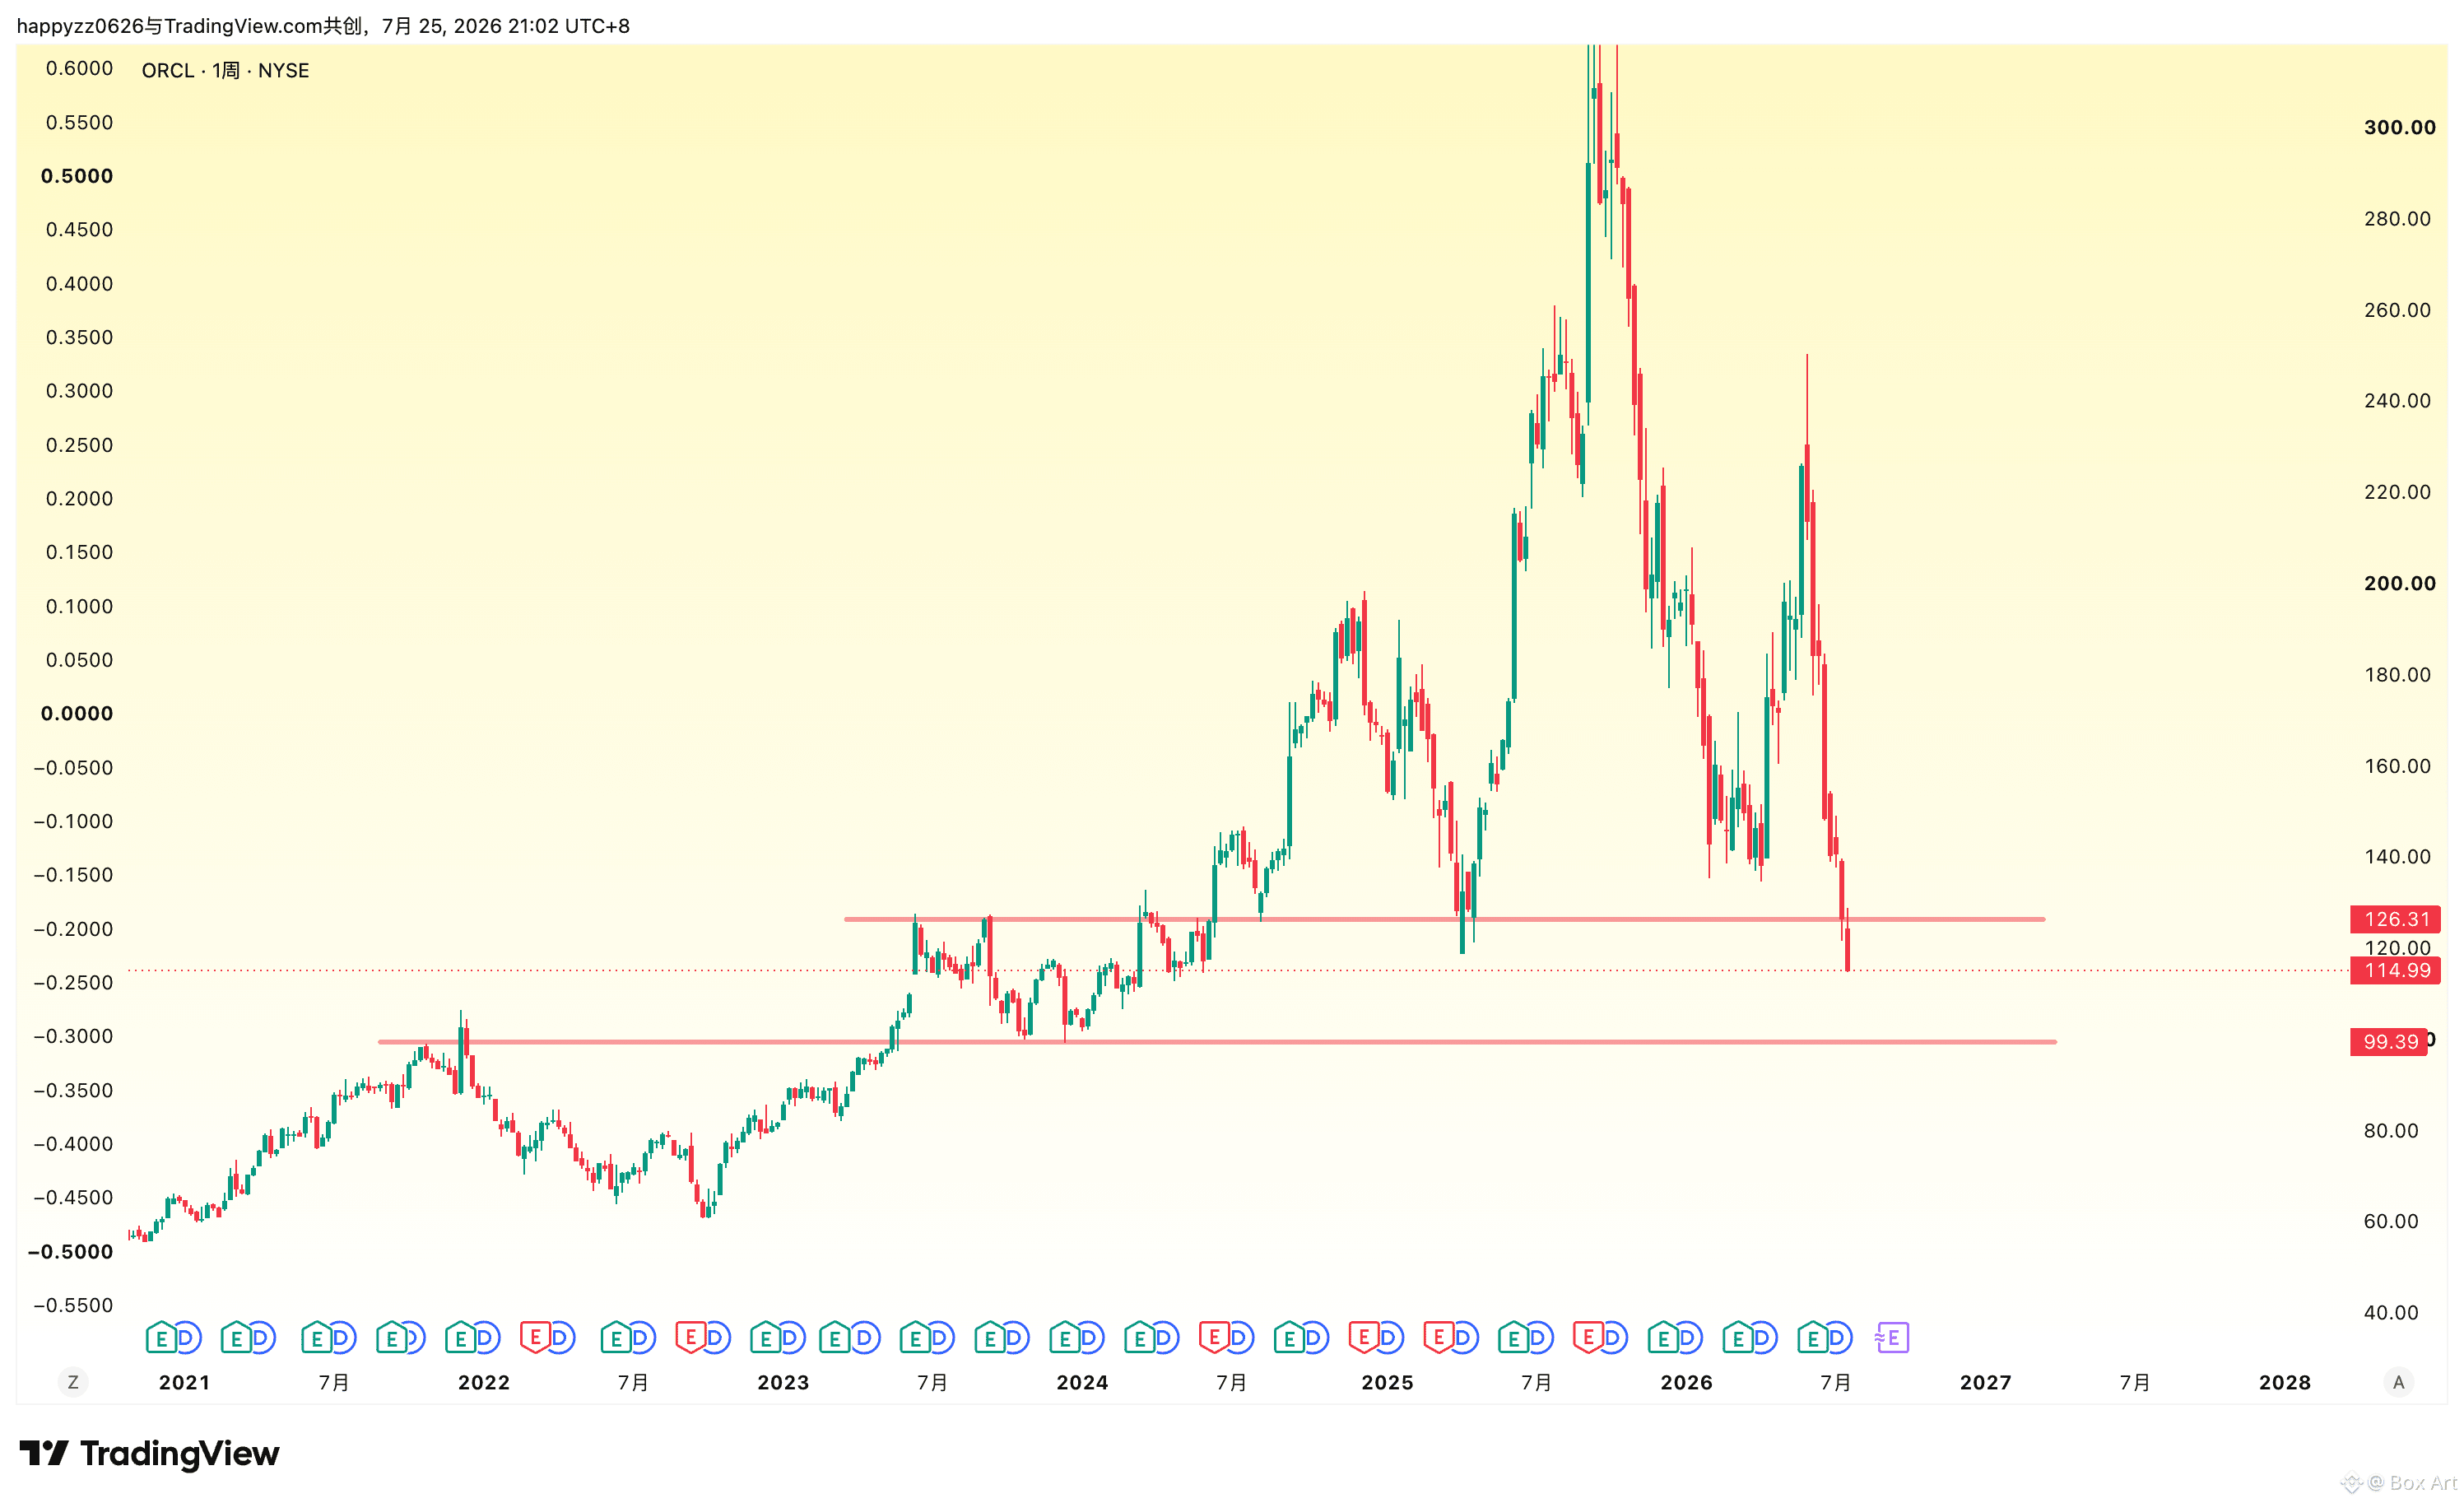
$ORCLB weekly line retraction to 126 is already impossible; that's why on the left side it's only a head depot, because you can't predict whether it will break below. The next add-on point is 99
Box Art
·
--
$ORCLon 183 Catch the bottom; 226+ tips on take-profit; this time the downside target is around 126. Support level since 2023. You can go heavy on the left side here.
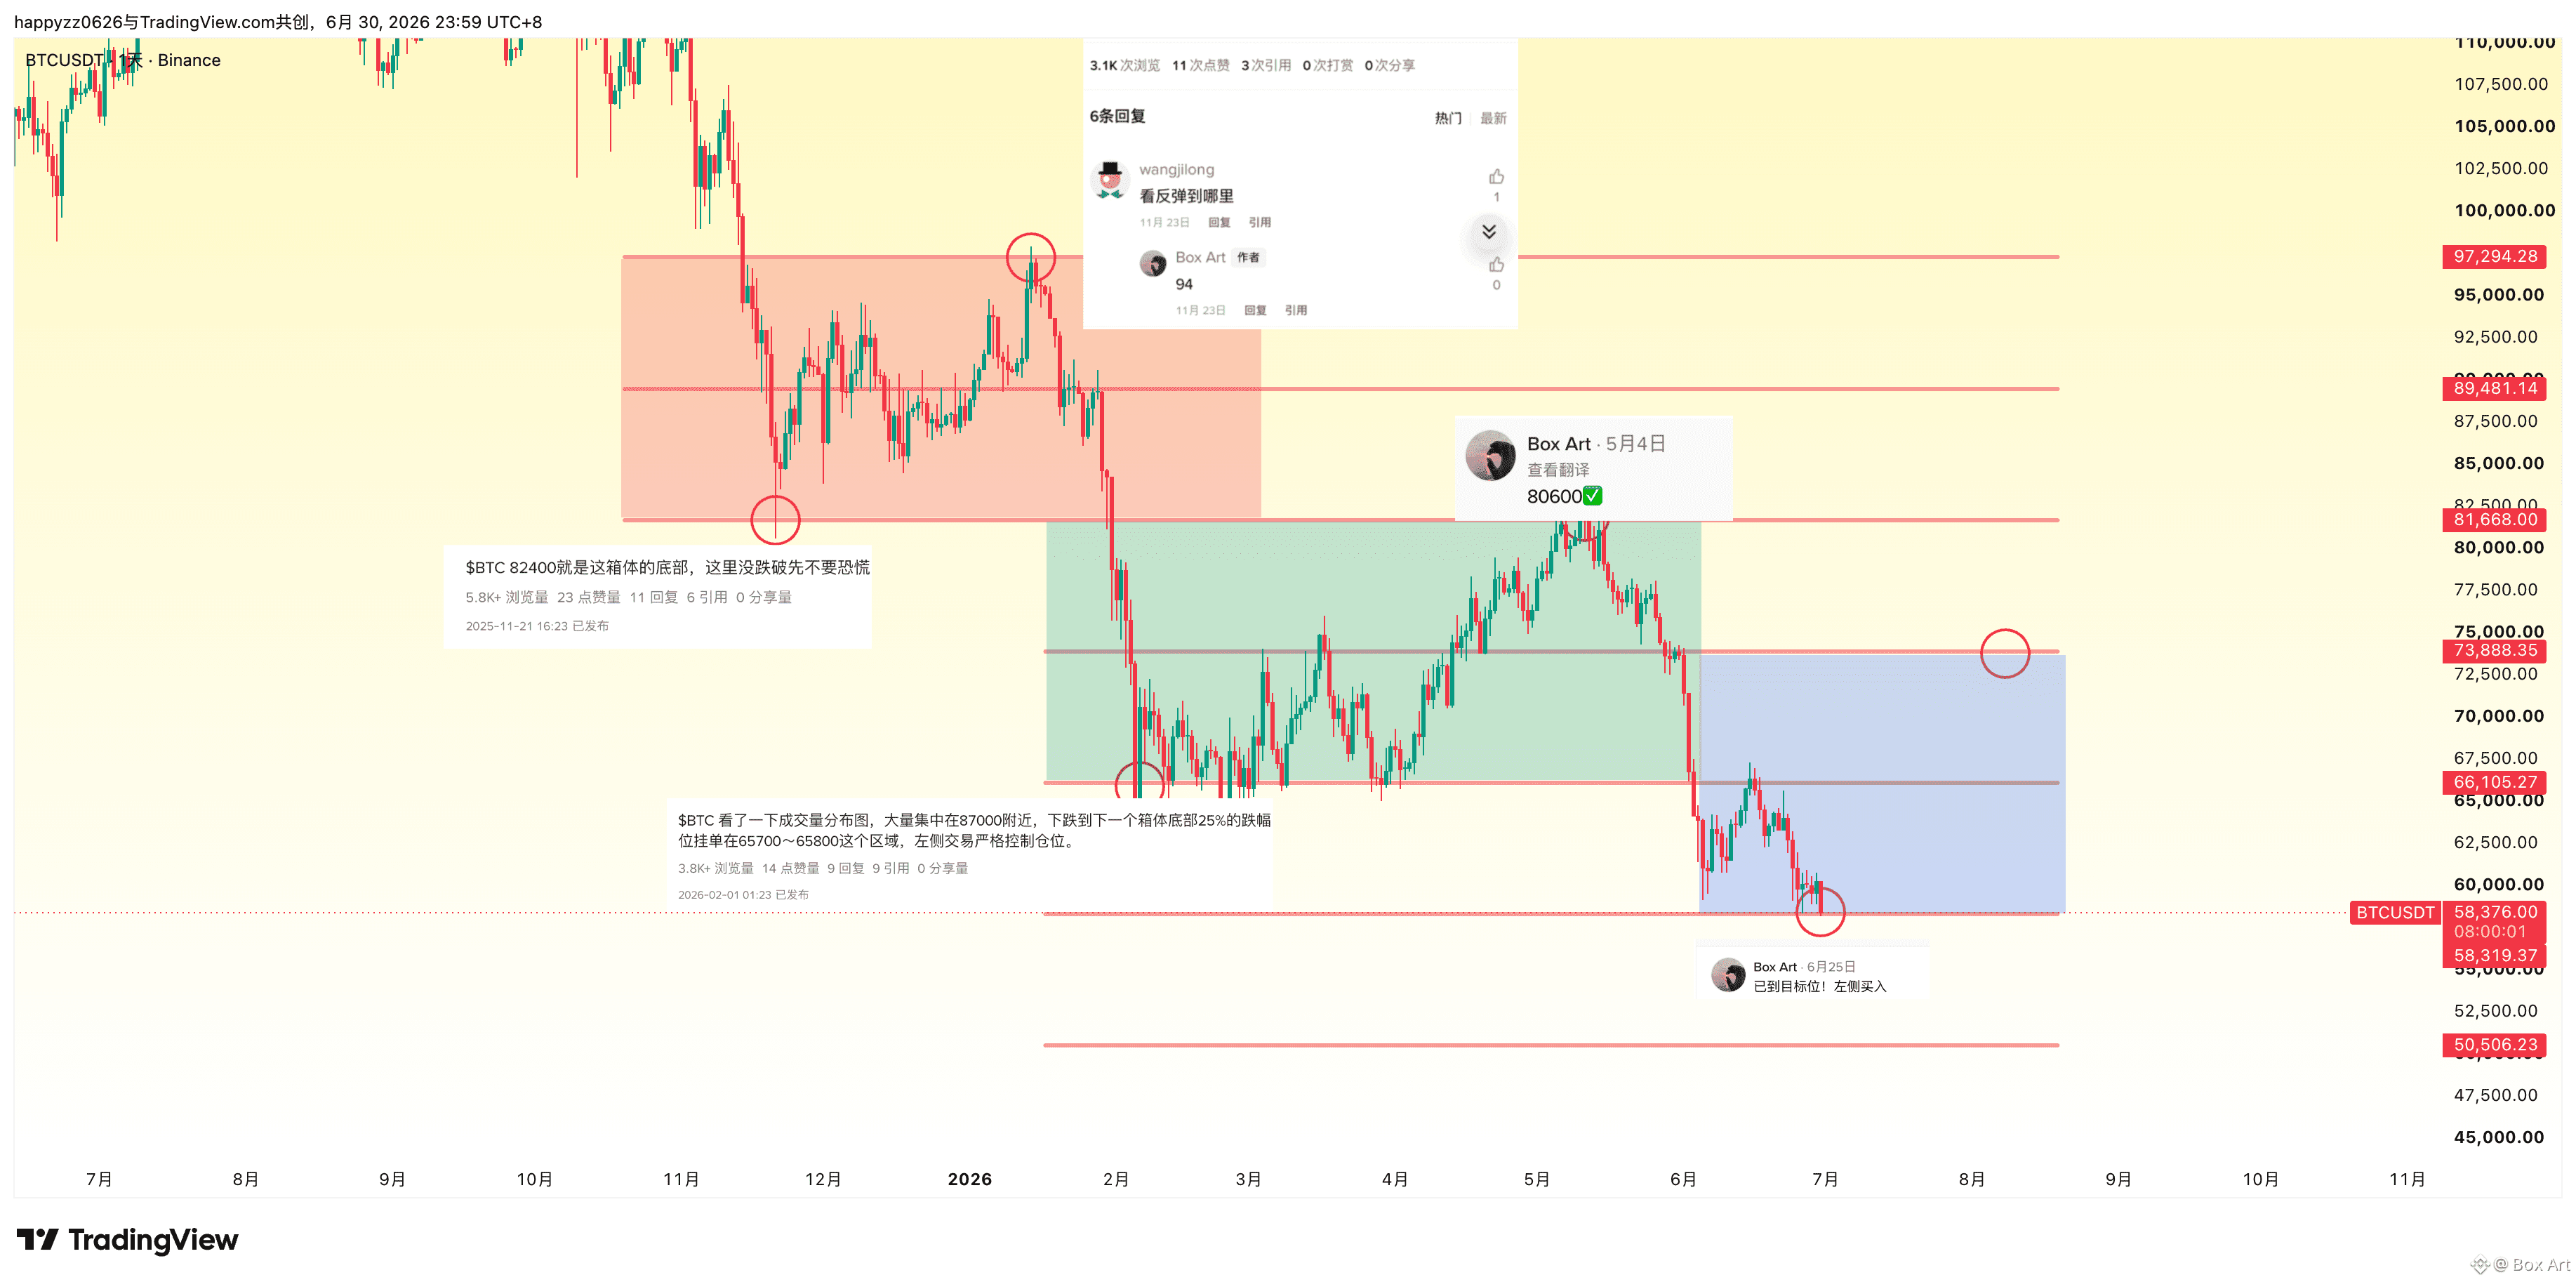
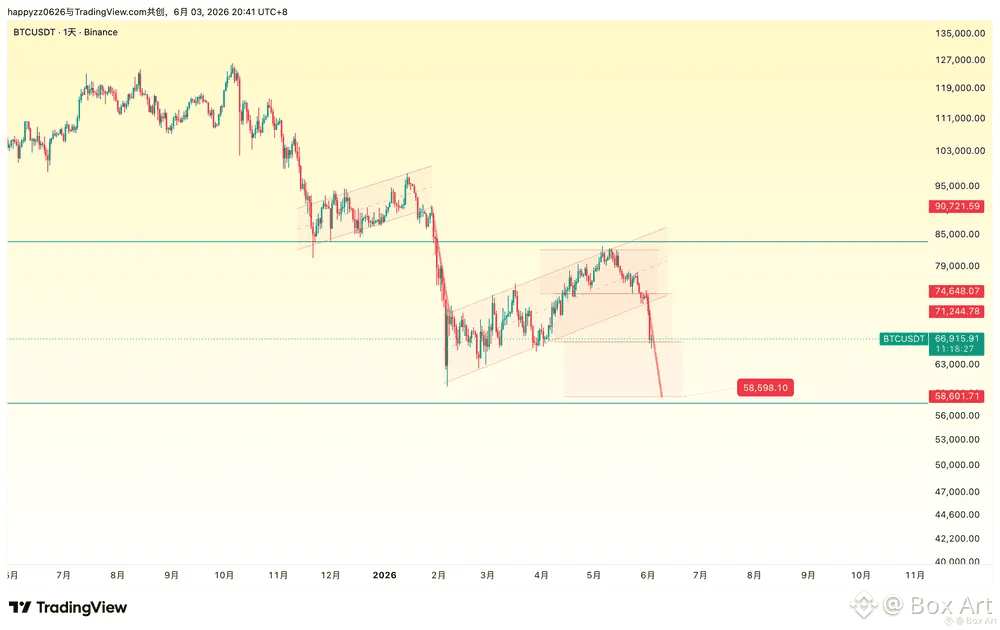
$BTC The same old picture. How did I end up copying it all the way again?....
Box Art
·
--
$BTC can it be tried again? Every time the rebound height is always 2 box segments—aren’t you amazed? Will this time be different? To achieve a target position holding time of 40 days or more: for contract players, when dipping into the lows on the left side, pay attention to your position sizing and stop-loss. If it blows up, don’t come looking for me. As for me, I bought spot—so I won’t move. If it breaks below my level, I’ll be even happier. I’m not fully loaded. If the rebound is 2 box segments, I’ll make a small profit; if it keeps dropping another box segment, I’ll add more to my position.
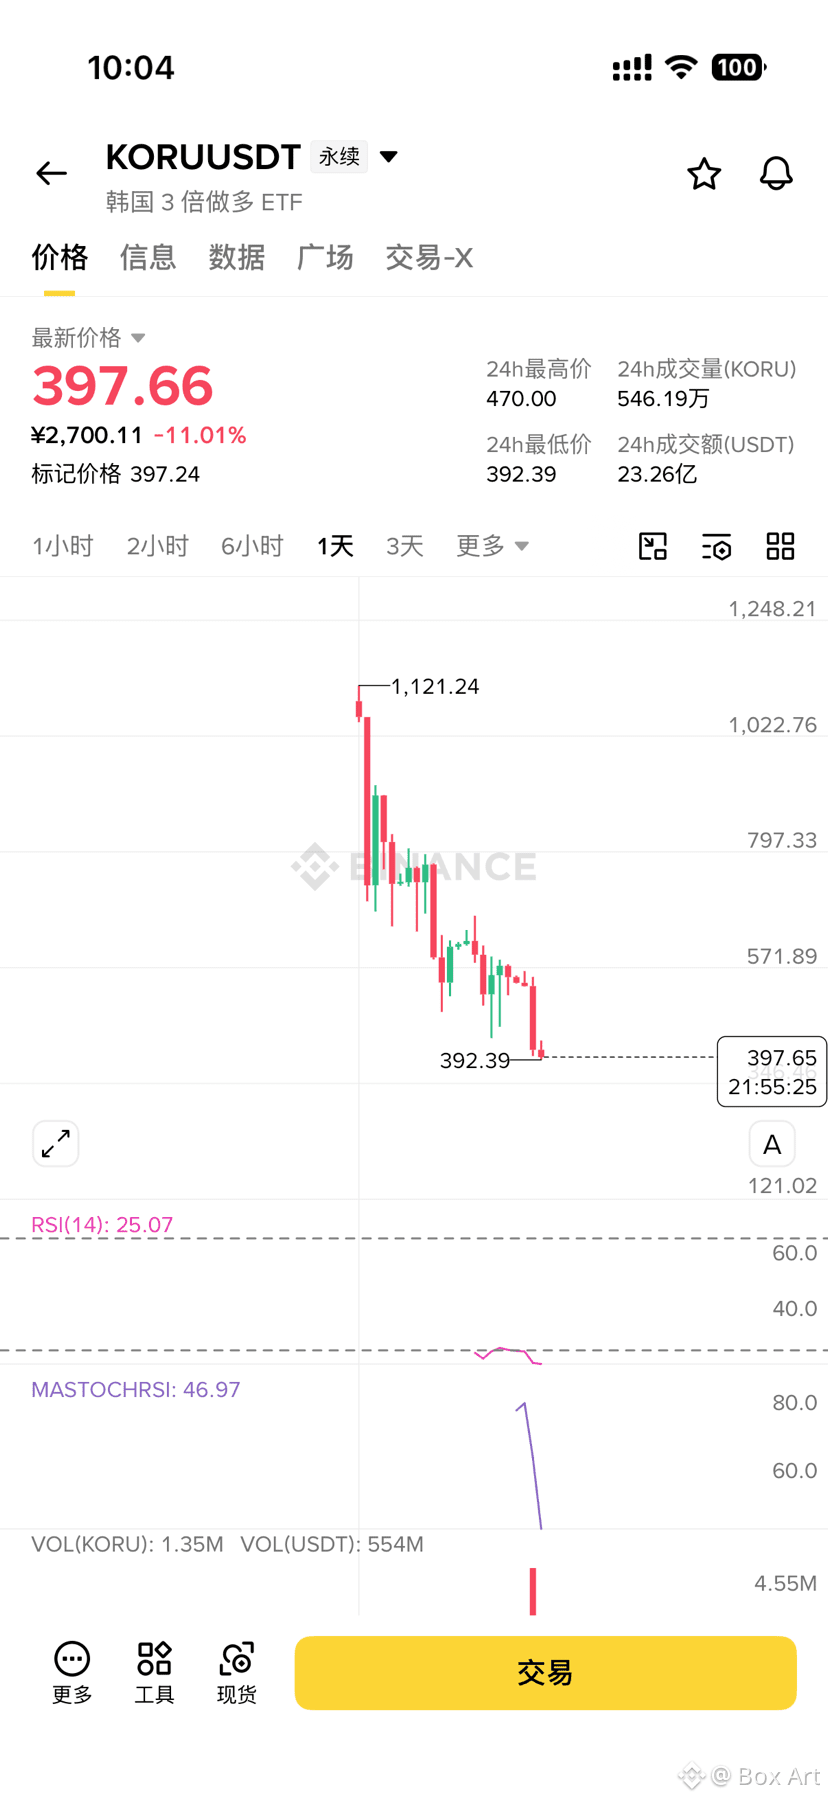
$BTC No matter if you’re right or wrong, this bottom-buying profit is already up 3,700 points. It has rebounded 7% from the bottom.
Box Art
·
--
$BTC can it be tried again? Every time the rebound height is always 2 box segments—aren’t you amazed? Will this time be different? To achieve a target position holding time of 40 days or more: for contract players, when dipping into the lows on the left side, pay attention to your position sizing and stop-loss. If it blows up, don’t come looking for me. As for me, I bought spot—so I won’t move. If it breaks below my level, I’ll be even happier. I’m not fully loaded. If the rebound is 2 box segments, I’ll make a small profit; if it keeps dropping another box segment, I’ll add more to my position.
Log in to explore more content