
加密打工人
944 Posts

加密打工人
 Square Verified
从 996 金融狗逃进 Web3 的中年危机选手
边带娃边挖链上 Alpha
每天喝咖啡看 K 线 吐槽政策
不喊单,只分享我自己会投的坑
真实人,真实亏,真实赚
合作 DM
Frequent Trader
8.4 Years
407 Following
11.1K+ Followers
1.0K+ Liked
Posts
All
Quotes
Live
I’ve just completed a new trade! Copy my investment portfolio with one click👇
加密打工人
Close Position
USELESSUSDT
PNL(USDT)
+13.40
Close Price
0.23424939
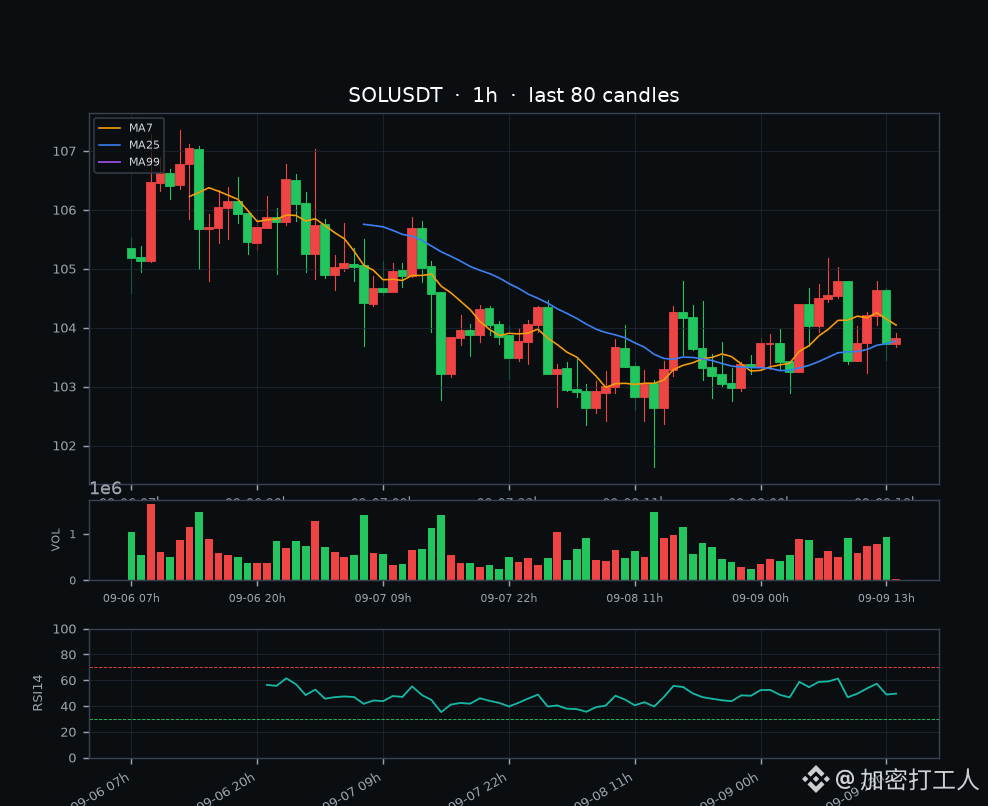
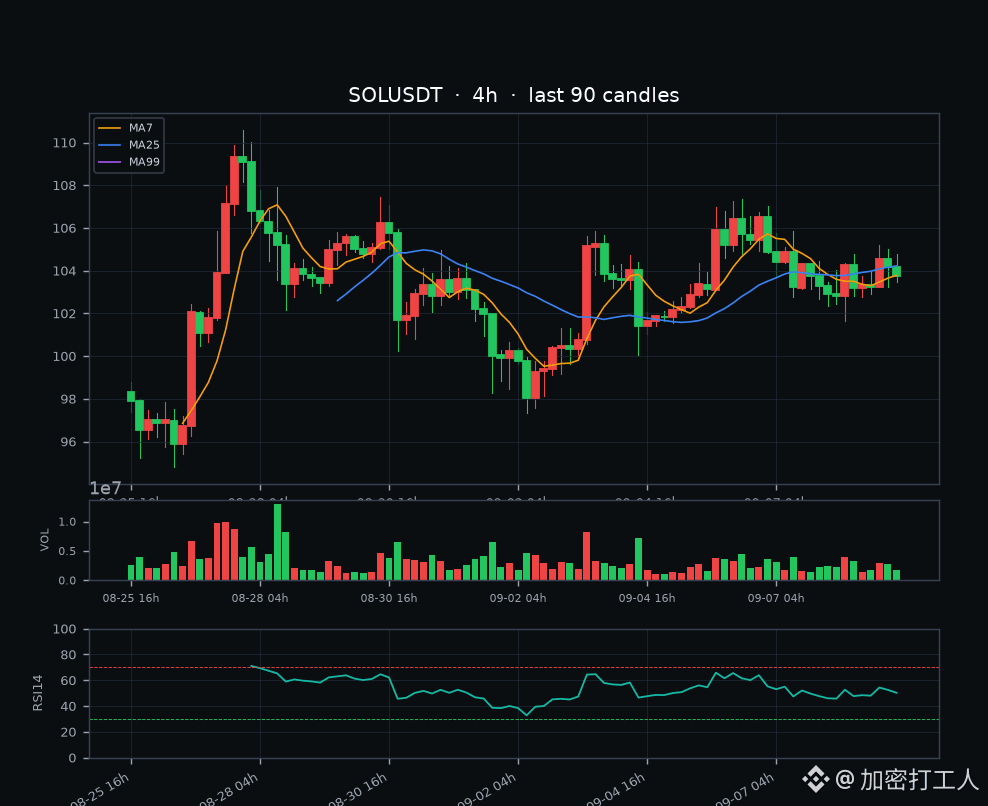
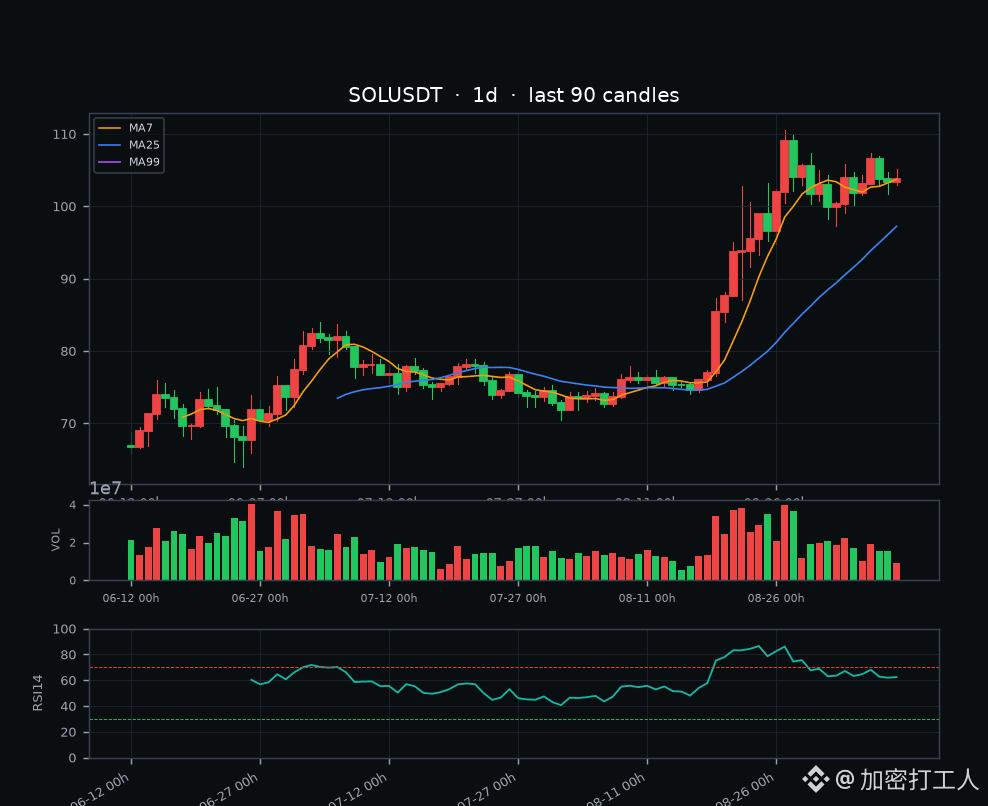
$SOL Current price 103.87, 24h +1.20%, trading volume about $1.63 billion (contracts)
Good evening. After SOL was dumped to 101.6 yesterday, it started rebounding today. Now it’s at 103.87. The intraday range is 102.37–105.19. It’s ended with a small bullish candle.
This leg came down from the 110 top. That drop to 101.6 was basically the point where shorts had finished releasing. Today it hasn’t broken further; instead it held steady above 102. That counts as the first signal of a bottoming attempt.
📊 Technicals
The smaller timeframe is repairing, but it hasn’t cleared the hurdle yet. On the 1-hour chart, 103.87 is below MA7 (104.05) but above MA25 (103.78) and MA50 (103.66). The moving averages are tightly twisted together—classic consolidation. RSI is hovering around 50 without moving decisively, and MACD’s red histogram has just barely flipped positive (histogram +0.01), suggesting buyers are probing but with limited strength.
The 4-hour chart is more critical: price is above MA50 (102.90) and above MA7 (103.80), but it’s being capped by MA25 (104.22). The MACD histogram is still green at -0.06, indicating this rebound is still a “bounce within a down move,” not a full reversal. The daily chart isn’t broken: 103.85 is far above MA25 (97.25) and MA50 (85.98). The broader uptrend structure on the daily timeframe remains intact, but the daily MACD histogram is slightly turning green at -0.67. Since the momentum was boosted during the move from 70 to 110, it’s starting to dull—so keep an eye on that.
💧 Derivatives and sentiment
Funding rate flipped from yesterday’s -0.006% to +0.003%, turning positive again. On the perpetuals side, longs have also lifted slightly. OI is around 7.89 million SOL, roughly flat versus yesterday’s 7.98 million—no clear sign of major additional buildup. The tricky part is crowding: the global long ratio is 67.9% and the long/short ratio is 2.11, slightly higher than yesterday’s 2.01. If those long positions get targeted, it becomes fuel for downside.
The good news: the Taker buy/sell ratio moved from 0.898 back to 0.96, meaning the pressure from主动卖出 (active selling) has eased noticeably. The order book isn’t as panicky.
⛓️ On-chain and relative strength
For this leg, the on-chain real-time interface (TVL/active addresses) didn’t connect, so I won’t invent specific numbers—just look at the chart: SOL/BTC is 0.001314, -0.26% today. It’s basically flat versus BTC, but slightly weaker. In this altcoin cycle, SOL is still the stronger side against BTC overall.
📰 News
Public news sources couldn’t be pulled in real time for this leg (search interface limitations), so I won’t fabricate news. The market itself has already said everything: bottoming attempt rebound, long/short tug-of-war, and leveraged longs that are a bit crowded.
👉 My take
For the short term, it’s more like chopping and rubbing in the 102–105 range. To push higher, price first needs to hold above 104.2 (4h MA25) to attempt a retest of 105.2’s previous high. Only if it breaks above 107.4 can we start talking about regaining upside momentum. On the downside, 102.9 (4h MA50) and 102.4 (intraday low) are the first defenses. If it truly breaks below yesterday’s low at 101.6, it likely heads toward 100 and then 97.3.
My bias: as long as the daily chart hasn’t broken, the 100–103 area is still where longs are willing to buy. But with a long/short ratio of 2.11 (crowding), don’t get too excited chasing. It’s usually more comfortable to buy on pullbacks in batches than to chase. If your position is heavy, you can wait for the 104.2–105 zone to trim a bit and lock in profit.
Key levels
Support: 102.9 / 102.4 / 101.6 / 100 / 97.3
Resistance: 104.2 / 105.2 / 107.4 / 110.6
Risk warning: the global long/short ratio at 2.11 is relatively crowded. If BTC or U.S. equities weaken, a high-beta asset like SOL will likely fall faster. The daily MACD just turned slightly green—momentum is fading. For reference only and not investment advice.
$SOL $BTC #SOL #行情分析 #合约 #山寨季
Good evening. After SOL was dumped to 101.6 yesterday, it started rebounding today. Now it’s at 103.87. The intraday range is 102.37–105.19. It’s ended with a small bullish candle.
This leg came down from the 110 top. That drop to 101.6 was basically the point where shorts had finished releasing. Today it hasn’t broken further; instead it held steady above 102. That counts as the first signal of a bottoming attempt.
📊 Technicals
The smaller timeframe is repairing, but it hasn’t cleared the hurdle yet. On the 1-hour chart, 103.87 is below MA7 (104.05) but above MA25 (103.78) and MA50 (103.66). The moving averages are tightly twisted together—classic consolidation. RSI is hovering around 50 without moving decisively, and MACD’s red histogram has just barely flipped positive (histogram +0.01), suggesting buyers are probing but with limited strength.
The 4-hour chart is more critical: price is above MA50 (102.90) and above MA7 (103.80), but it’s being capped by MA25 (104.22). The MACD histogram is still green at -0.06, indicating this rebound is still a “bounce within a down move,” not a full reversal. The daily chart isn’t broken: 103.85 is far above MA25 (97.25) and MA50 (85.98). The broader uptrend structure on the daily timeframe remains intact, but the daily MACD histogram is slightly turning green at -0.67. Since the momentum was boosted during the move from 70 to 110, it’s starting to dull—so keep an eye on that.
💧 Derivatives and sentiment
Funding rate flipped from yesterday’s -0.006% to +0.003%, turning positive again. On the perpetuals side, longs have also lifted slightly. OI is around 7.89 million SOL, roughly flat versus yesterday’s 7.98 million—no clear sign of major additional buildup. The tricky part is crowding: the global long ratio is 67.9% and the long/short ratio is 2.11, slightly higher than yesterday’s 2.01. If those long positions get targeted, it becomes fuel for downside.
The good news: the Taker buy/sell ratio moved from 0.898 back to 0.96, meaning the pressure from主动卖出 (active selling) has eased noticeably. The order book isn’t as panicky.
⛓️ On-chain and relative strength
For this leg, the on-chain real-time interface (TVL/active addresses) didn’t connect, so I won’t invent specific numbers—just look at the chart: SOL/BTC is 0.001314, -0.26% today. It’s basically flat versus BTC, but slightly weaker. In this altcoin cycle, SOL is still the stronger side against BTC overall.
📰 News
Public news sources couldn’t be pulled in real time for this leg (search interface limitations), so I won’t fabricate news. The market itself has already said everything: bottoming attempt rebound, long/short tug-of-war, and leveraged longs that are a bit crowded.
👉 My take
For the short term, it’s more like chopping and rubbing in the 102–105 range. To push higher, price first needs to hold above 104.2 (4h MA25) to attempt a retest of 105.2’s previous high. Only if it breaks above 107.4 can we start talking about regaining upside momentum. On the downside, 102.9 (4h MA50) and 102.4 (intraday low) are the first defenses. If it truly breaks below yesterday’s low at 101.6, it likely heads toward 100 and then 97.3.
My bias: as long as the daily chart hasn’t broken, the 100–103 area is still where longs are willing to buy. But with a long/short ratio of 2.11 (crowding), don’t get too excited chasing. It’s usually more comfortable to buy on pullbacks in batches than to chase. If your position is heavy, you can wait for the 104.2–105 zone to trim a bit and lock in profit.
Key levels
Support: 102.9 / 102.4 / 101.6 / 100 / 97.3
Resistance: 104.2 / 105.2 / 107.4 / 110.6
Risk warning: the global long/short ratio at 2.11 is relatively crowded. If BTC or U.S. equities weaken, a high-beta asset like SOL will likely fall faster. The daily MACD just turned slightly green—momentum is fading. For reference only and not investment advice.
$SOL $BTC #SOL #行情分析 #合约 #山寨季
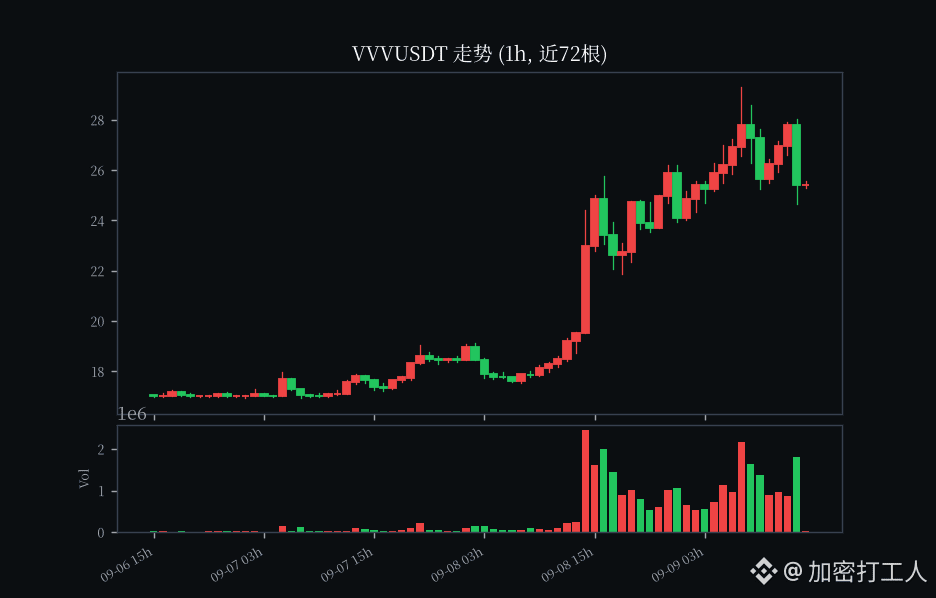
$VVV current price $25.4
In one week it surged from 15.7 to 29.3, +86% 💥 This pump is probably at its peak now
In the past 24 hours, volume is nearly 700 million dollars—volume and price are clearly diverging
That huge volume candle with a long upper wick at 29.3—bulls are already running 😏
I went short on $VVV —short first, ask questions later!
In one week it surged from 15.7 to 29.3, +86% 💥 This pump is probably at its peak now
In the past 24 hours, volume is nearly 700 million dollars—volume and price are clearly diverging
That huge volume candle with a long upper wick at 29.3—bulls are already running 😏
I went short on $VVV —short first, ask questions later!
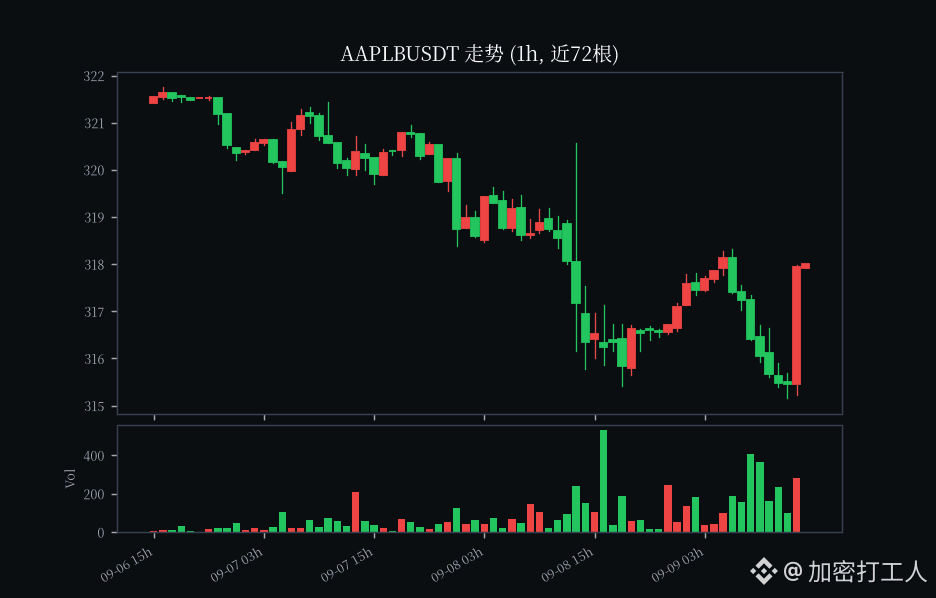
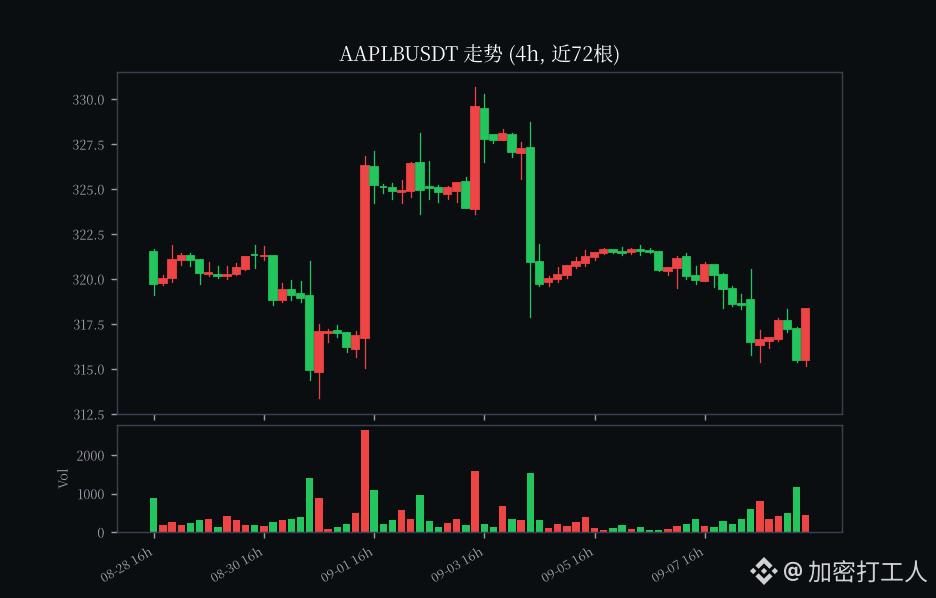
$AAPLB current price 318.0, up slightly 0.15% today, turnover around 1.22 million, and nothing much is moving.
This Apple stock has been looking steadier to me the more I watch it recently. It has been trading in a range of 315 to 318 for quite a while, without much jumping around.
My take is a bit more optimistic: its services revenue (the App Store, iCloud, and that whole stack) has been rising steadily, and it’s high-margin—so it effectively cushions the valuation; plus Apple does big share buybacks every year, which provides real support for the stock price. In the second half, the iPhone new-model cycle is coming, and sentiment usually isn’t bad.
That said, 318 isn’t exactly cheap—don’t go all-in at once.
What do you think about this stock? For reference only. US stocks can be volatile, so watch your position sizing.
$AAPLB $QQQB $MSFTB #美股 #bStocks #Technology stocks
This Apple stock has been looking steadier to me the more I watch it recently. It has been trading in a range of 315 to 318 for quite a while, without much jumping around.
My take is a bit more optimistic: its services revenue (the App Store, iCloud, and that whole stack) has been rising steadily, and it’s high-margin—so it effectively cushions the valuation; plus Apple does big share buybacks every year, which provides real support for the stock price. In the second half, the iPhone new-model cycle is coming, and sentiment usually isn’t bad.
That said, 318 isn’t exactly cheap—don’t go all-in at once.
What do you think about this stock? For reference only. US stocks can be volatile, so watch your position sizing.
$AAPLB $QQQB $MSFTB #美股 #bStocks #Technology stocks
$PENGU current price 0.00818
Evening farming strategy is here 🐧
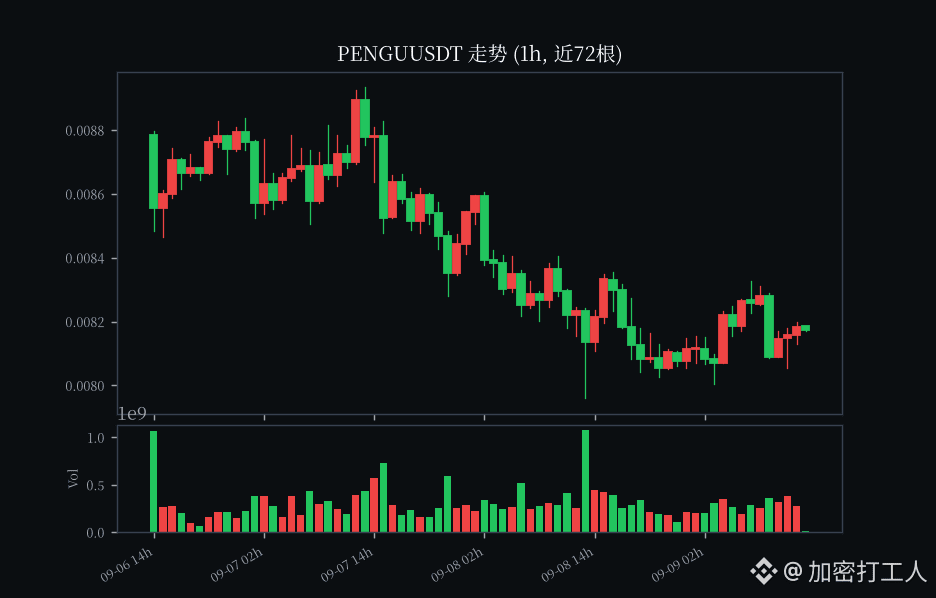
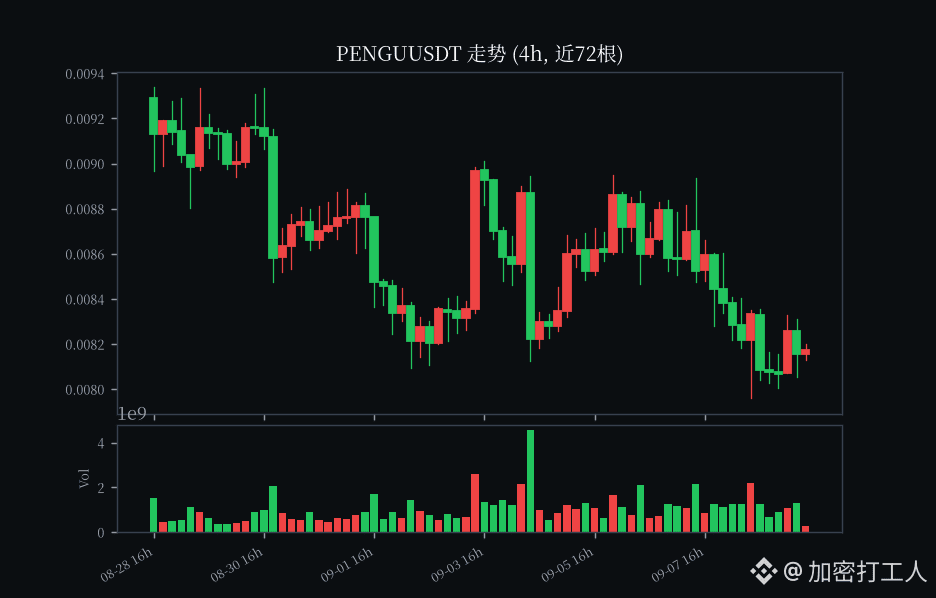
PENGU today in the Alpha sector moved steadily; in the last 24h it dipped slightly by 0.62%. Current price: 0.00818, and volume is about 9.36 million USDT. Not a blowout volume, but the liquidity is sufficient for farming—no need to force a rally, and it’s not easy to get stuck.
Here’s the farming approach:
Place bids low and “eat the depth,” don’t go all-in at once. 0.008 is a firm support in the recent range. If it doesn’t break on the pullback, accumulate in batches. Before the push toward 0.00835 near the prior high, reduce by half first—taking profit beats fantasizing.
For friends aiming to earn Alpha points, the most stable way is to keep small-sized, multiple trades each day. Don’t gamble on a one-way move.
Risk warning: Alpha small coins can be extremely volatile. Don’t let any single-coin position exceed 5% of your total funds. Set the stop-loss below 0.0078—if it breaks, exit promptly; don’t get attached.
How many Alpha points did you farm today? What strategy are you using? Drop it in the comments 👇
$PENGU $SOL #币安Alpha #刷分 #Altcoins
Evening farming strategy is here 🐧
PENGU today in the Alpha sector moved steadily; in the last 24h it dipped slightly by 0.62%. Current price: 0.00818, and volume is about 9.36 million USDT. Not a blowout volume, but the liquidity is sufficient for farming—no need to force a rally, and it’s not easy to get stuck.
Here’s the farming approach:
Place bids low and “eat the depth,” don’t go all-in at once. 0.008 is a firm support in the recent range. If it doesn’t break on the pullback, accumulate in batches. Before the push toward 0.00835 near the prior high, reduce by half first—taking profit beats fantasizing.
For friends aiming to earn Alpha points, the most stable way is to keep small-sized, multiple trades each day. Don’t gamble on a one-way move.
Risk warning: Alpha small coins can be extremely volatile. Don’t let any single-coin position exceed 5% of your total funds. Set the stop-loss below 0.0078—if it breaks, exit promptly; don’t get attached.
How many Alpha points did you farm today? What strategy are you using? Drop it in the comments 👇
$PENGU $SOL #币安Alpha #刷分 #Altcoins
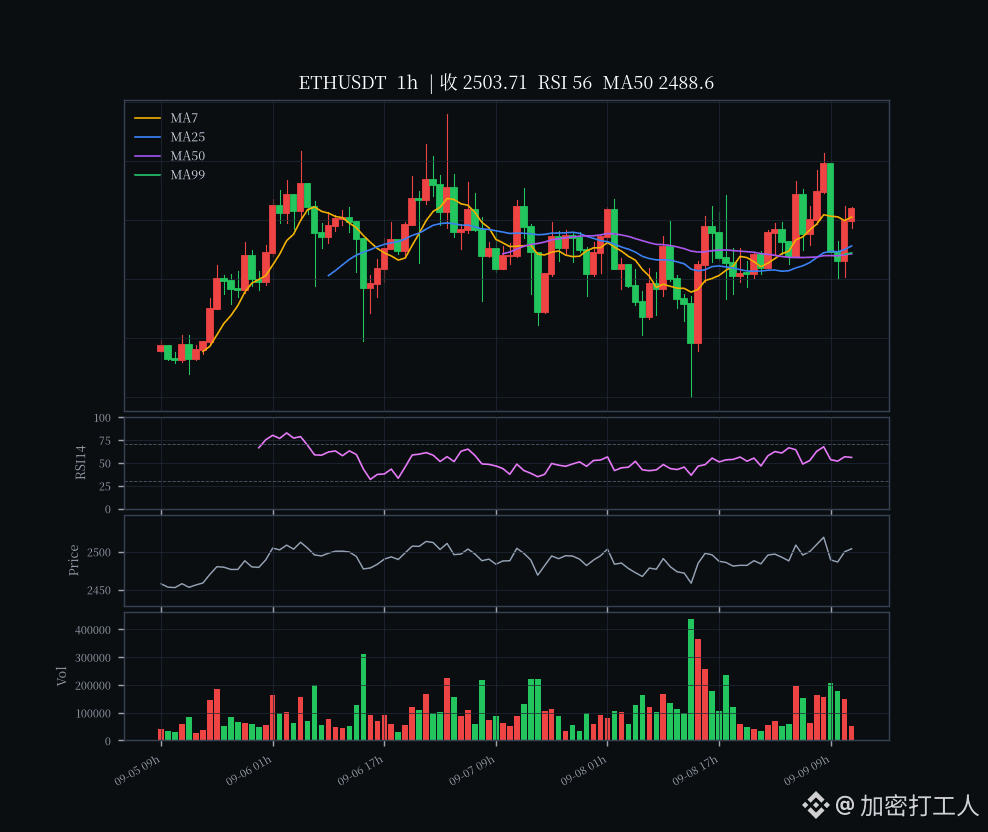
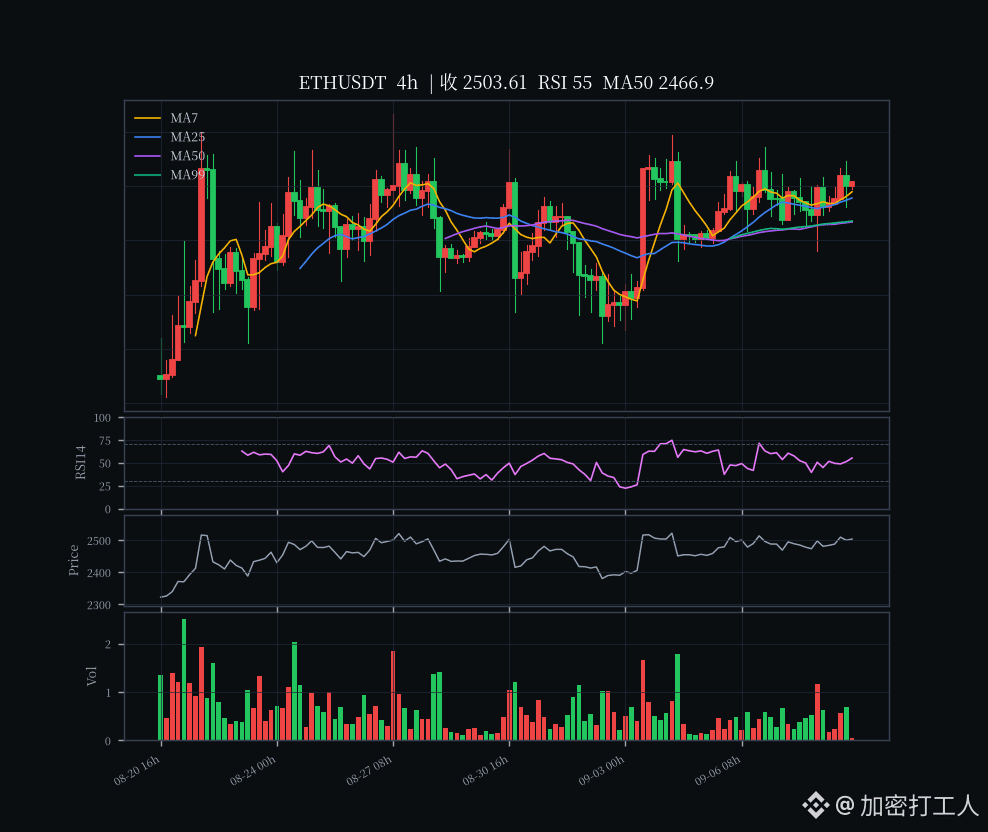
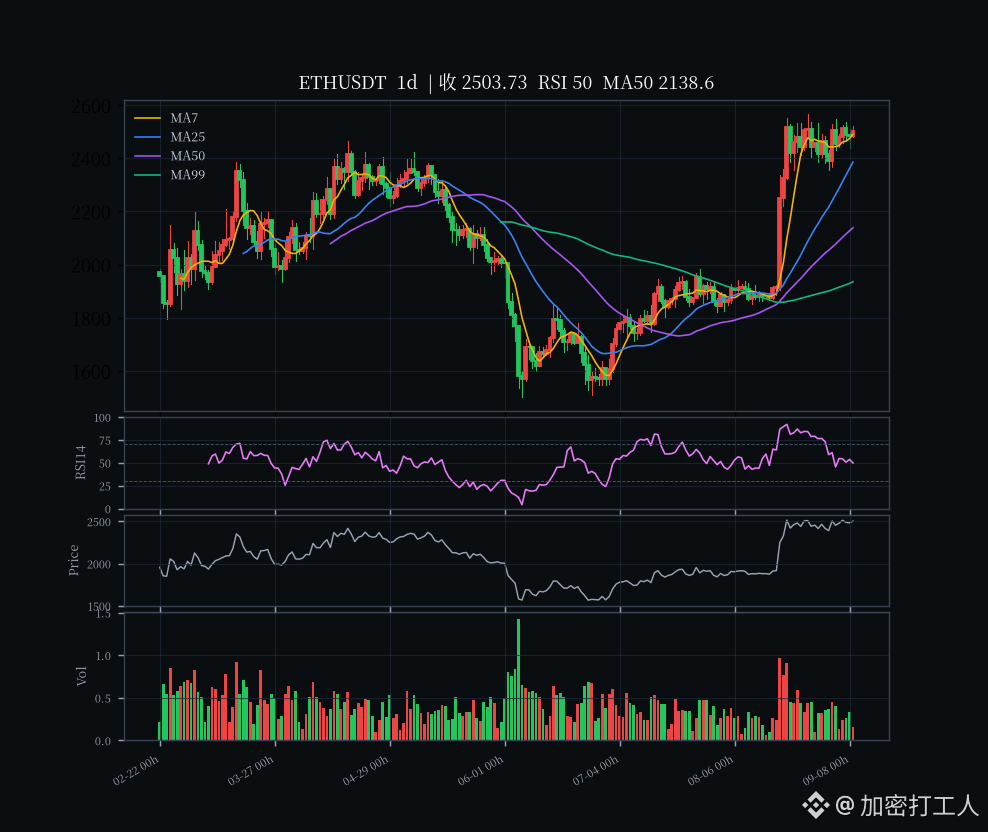
$ETH current price 2500.41, 24h +1.06%, trading volume about 8.65 billion USDT (24h perpetual quote, about 3.46 million ETH); 24h high 2522.75 / low 2440.22.
Last night I wrote that "the bearish grind up to the daily MA7 defense line, and the 4h momentum flipped again to short." Today this candle pulls that breath back. During the day the low only probed as far as 2440.22 and didn’t touch 2430—the critical line. In the afternoon it pushed all the way back to 2522 and closed at 2500.41, with 24h up 1.06%. Volume of 8.65B expanded by nearly 30% compared to last night’s 6.62B—this is "rising with volume," not "a slow drop on shrinking volume". The bid stepped in again at lower levels and absorbed the price.
The only letdown is ETH/BTC today at -0.35%. Today’s funds led BTC and took ETH along; ETH didn’t independently lead, so relative strength is a bit weak.
📊 Technicals
Across three timeframes, it’s now a "repair phase" where the daily is pressing back above MA7, the 4h momentum has flipped back to red, and the 1h is neutral to slightly bullish—exactly the swap of last night’s "4h flipped to short again."
1h close 2500.79, sitting above MA7 (2500.66) / MA25 (2491.19) / MA50 (2488.54) / MA99 (2488.90). The short moving averages have re-ordered into a bullish alignment. RSI 54.86 is neutral to mildly strong, and MACD histogram is +0.15 (dif 3.74 above dea 3.59), just flipped positive—hourly momentum has shifted from weak to steady.
4h is the real turning point tonight: close 2500.97, back above MA7 (2494.39) / MA25 (2488.90) / MA50 (2466.85) / MA99 (2467.80), pulling the moving-average structure back in place. RSI 54.43 is neutral; MACD histogram +0.56 (dif 6.68 above dea 6.12) flipped red—this is the second time momentum turns positive after last night’s -3.35 green bars. The selloff from last night has been eaten.
1d close 2500.79, holding above MA7 (2489.60) / MA25 (2385.50) / MA50 (2138.52) / MA99 (1936.00). The medium-term bulls haven’t broken. However RSI 49.54 is still neutral, and MACD histogram -15.21 (dif 102.95 below dea 118.16) remains green—cooling on the daily from 2566 has lasted five consecutive negative candles. It’s just narrower than last night’s -15.66, so the alert hasn’t been cleared.
Key levels—cut them and write them down: Resistance overhead at 2522.75 (today’s high) is immediate pressure. Only after touching that do you get close to 2536 (the 4h near-high)—that’s the real ceiling. Above 2536 you can then challenge 2566.4 (the stage iron top).
Below, 2488-2491 (the 1h/4h moving-average overlap) is the first buffer. If closes hold, you can grind between 2488-2522. 2440.22 (today’s low) is the lifeline: if it breaks, you’ll go back to 2430 (the previous low platform). If it then breaks 2385 (daily MA25), the medium-term picture will turn ugly.
💧 Derivatives & sentiment
Funding rate 1.953e-05 (8h, day change +0.0059%), close to the ground—no leverage “fever,” healthy. Open interest 2.2813M ETH (about 5.705B USDT), slightly down from last night’s 2.3208M. Price is up while OI is down, which suggests this move is more about short covering than longs wildly adding—this rebound looks more like "borrowing strength" than "active offense."
Net long is still the old Thunder: global long/short ratio 2.4329 (long 70.87%), same vibe as the past few days—retail net longs remain crowded. Top trader positioning ratio 1.6074 (long 61.65%), cleaner than the past couple days. Taker buy/sell ratio 1.2118: active buys are leading (true flow net buys). This aligns with "rising with volume."
ETH/BTC -0.35%: relative strength is negative today—funds didn’t pick ETH.
📰 News
The real-time news/search channel won’t be usable tonight—exact figures like ETF net inflow on the day, staking rate, and Gas were not obtained, so I won’t fabricate numbers. On the chart, I didn’t see a hard ETH-specific bomb. The defense at 2440 and bounce toward 2500 looks more like technical repair: "second confirmation of the 2430-2440 platform + 4h momentum refill," not a fundamental-bad-news that has fully unwound.
No major macro data tonight; sentiment follows price.
👉 My view
I read tonight as: after the 2430-2440 platform holds for the second time, the pullback repairs and the 4h momentum flips back to red—exactly the opposite of last night’s "second flip to short."
Stepping back above the cluster of short MAs at 2500, 4h MACD flipping red, and volume expanding—this repair on the short-term is real. But I won’t chase longs above 2500: daily MACD is still green, and the iron top at 2566 plus the overhead resistances at 2536/2522 are sitting right on top. Also, price is up while OI is down, and ETH/BTC is negative—rebound conviction isn’t strong.
For holders: set a stop-loss at/below 2440.22 (today’s low). If it breaks, recognize short-term weakness and step out first—especially with global net longs crowded at 70.87%; if 2430 fails, this batch of leveraged longs becomes the liquidation fuse. If you’re not in yet, don’t chase at 2500; wait for two signals:
1) either it puts volume behind a reclaimed 2522 and doesn’t look back,
2) or after a pullback, if it doesn’t break and stabilizes in the 2488-2491 MA overlap zone, then consider entering with a light position.
On the bigger structure, the long setup on daily MA’s is intact (MA50 at 2138 is far below). But with the double top at 2566 and consecutive green daily MACD bars, this area should be treated as a rebound setup first—not a full reversal rampage. Keep position size small and wait for confirmation: daily MACD turning red and a valid breakout above 2566—then the trend can be considered to have restarted.
Risk warning: ETH is volatile and leverage positions are dense; needle-like wicks during rebounds and liquidity risks are higher than with BTC. Funding rate/long-short ratios are just for the current snapshot and can change anytime.
For reference only; not investment advice.
$ETH $BTC $SOL #ETH #行情分析 #合约 #Ethereum
Last night I wrote that "the bearish grind up to the daily MA7 defense line, and the 4h momentum flipped again to short." Today this candle pulls that breath back. During the day the low only probed as far as 2440.22 and didn’t touch 2430—the critical line. In the afternoon it pushed all the way back to 2522 and closed at 2500.41, with 24h up 1.06%. Volume of 8.65B expanded by nearly 30% compared to last night’s 6.62B—this is "rising with volume," not "a slow drop on shrinking volume". The bid stepped in again at lower levels and absorbed the price.
The only letdown is ETH/BTC today at -0.35%. Today’s funds led BTC and took ETH along; ETH didn’t independently lead, so relative strength is a bit weak.
📊 Technicals
Across three timeframes, it’s now a "repair phase" where the daily is pressing back above MA7, the 4h momentum has flipped back to red, and the 1h is neutral to slightly bullish—exactly the swap of last night’s "4h flipped to short again."
1h close 2500.79, sitting above MA7 (2500.66) / MA25 (2491.19) / MA50 (2488.54) / MA99 (2488.90). The short moving averages have re-ordered into a bullish alignment. RSI 54.86 is neutral to mildly strong, and MACD histogram is +0.15 (dif 3.74 above dea 3.59), just flipped positive—hourly momentum has shifted from weak to steady.
4h is the real turning point tonight: close 2500.97, back above MA7 (2494.39) / MA25 (2488.90) / MA50 (2466.85) / MA99 (2467.80), pulling the moving-average structure back in place. RSI 54.43 is neutral; MACD histogram +0.56 (dif 6.68 above dea 6.12) flipped red—this is the second time momentum turns positive after last night’s -3.35 green bars. The selloff from last night has been eaten.
1d close 2500.79, holding above MA7 (2489.60) / MA25 (2385.50) / MA50 (2138.52) / MA99 (1936.00). The medium-term bulls haven’t broken. However RSI 49.54 is still neutral, and MACD histogram -15.21 (dif 102.95 below dea 118.16) remains green—cooling on the daily from 2566 has lasted five consecutive negative candles. It’s just narrower than last night’s -15.66, so the alert hasn’t been cleared.
Key levels—cut them and write them down: Resistance overhead at 2522.75 (today’s high) is immediate pressure. Only after touching that do you get close to 2536 (the 4h near-high)—that’s the real ceiling. Above 2536 you can then challenge 2566.4 (the stage iron top).
Below, 2488-2491 (the 1h/4h moving-average overlap) is the first buffer. If closes hold, you can grind between 2488-2522. 2440.22 (today’s low) is the lifeline: if it breaks, you’ll go back to 2430 (the previous low platform). If it then breaks 2385 (daily MA25), the medium-term picture will turn ugly.
💧 Derivatives & sentiment
Funding rate 1.953e-05 (8h, day change +0.0059%), close to the ground—no leverage “fever,” healthy. Open interest 2.2813M ETH (about 5.705B USDT), slightly down from last night’s 2.3208M. Price is up while OI is down, which suggests this move is more about short covering than longs wildly adding—this rebound looks more like "borrowing strength" than "active offense."
Net long is still the old Thunder: global long/short ratio 2.4329 (long 70.87%), same vibe as the past few days—retail net longs remain crowded. Top trader positioning ratio 1.6074 (long 61.65%), cleaner than the past couple days. Taker buy/sell ratio 1.2118: active buys are leading (true flow net buys). This aligns with "rising with volume."
ETH/BTC -0.35%: relative strength is negative today—funds didn’t pick ETH.
📰 News
The real-time news/search channel won’t be usable tonight—exact figures like ETF net inflow on the day, staking rate, and Gas were not obtained, so I won’t fabricate numbers. On the chart, I didn’t see a hard ETH-specific bomb. The defense at 2440 and bounce toward 2500 looks more like technical repair: "second confirmation of the 2430-2440 platform + 4h momentum refill," not a fundamental-bad-news that has fully unwound.
No major macro data tonight; sentiment follows price.
👉 My view
I read tonight as: after the 2430-2440 platform holds for the second time, the pullback repairs and the 4h momentum flips back to red—exactly the opposite of last night’s "second flip to short."
Stepping back above the cluster of short MAs at 2500, 4h MACD flipping red, and volume expanding—this repair on the short-term is real. But I won’t chase longs above 2500: daily MACD is still green, and the iron top at 2566 plus the overhead resistances at 2536/2522 are sitting right on top. Also, price is up while OI is down, and ETH/BTC is negative—rebound conviction isn’t strong.
For holders: set a stop-loss at/below 2440.22 (today’s low). If it breaks, recognize short-term weakness and step out first—especially with global net longs crowded at 70.87%; if 2430 fails, this batch of leveraged longs becomes the liquidation fuse. If you’re not in yet, don’t chase at 2500; wait for two signals:
1) either it puts volume behind a reclaimed 2522 and doesn’t look back,
2) or after a pullback, if it doesn’t break and stabilizes in the 2488-2491 MA overlap zone, then consider entering with a light position.
On the bigger structure, the long setup on daily MA’s is intact (MA50 at 2138 is far below). But with the double top at 2566 and consecutive green daily MACD bars, this area should be treated as a rebound setup first—not a full reversal rampage. Keep position size small and wait for confirmation: daily MACD turning red and a valid breakout above 2566—then the trend can be considered to have restarted.
Risk warning: ETH is volatile and leverage positions are dense; needle-like wicks during rebounds and liquidity risks are higher than with BTC. Funding rate/long-short ratios are just for the current snapshot and can change anytime.
For reference only; not investment advice.
$ETH $BTC $SOL #ETH #行情分析 #合约 #Ethereum
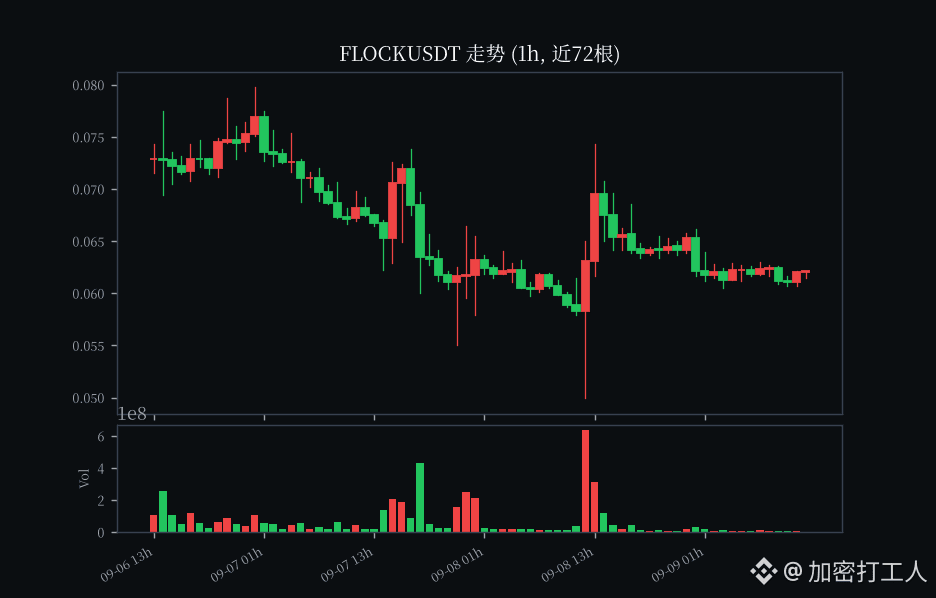
$FLOCK current price \$0.0618, a massive 77% surge in a week 🔥
From the 7-day low of 0.0338 to 0.082—2.4x in total, and the profit positions are thick enough to be scary
Now it’s pulling back 25% from the high; it’s clearly lagging, and the volume hasn’t kept up 💀
I shorted $FLOCK —going short first!
From the 7-day low of 0.0338 to 0.082—2.4x in total, and the profit positions are thick enough to be scary
Now it’s pulling back 25% from the high; it’s clearly lagging, and the volume hasn’t kept up 💀
I shorted $FLOCK —going short first!
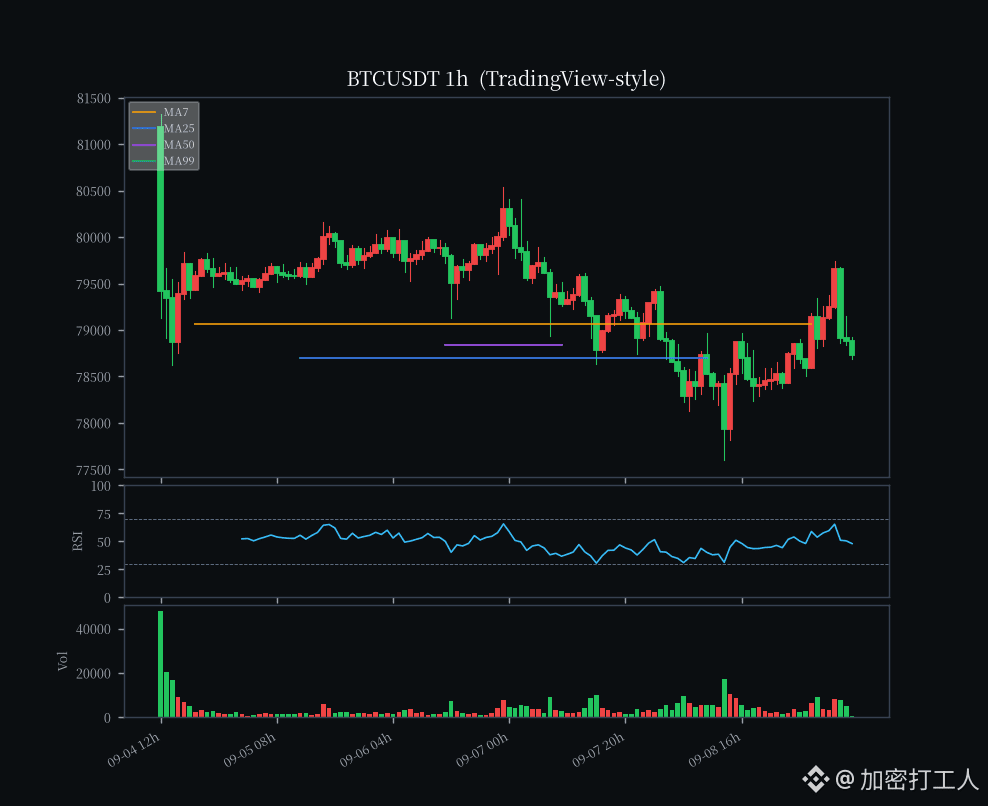
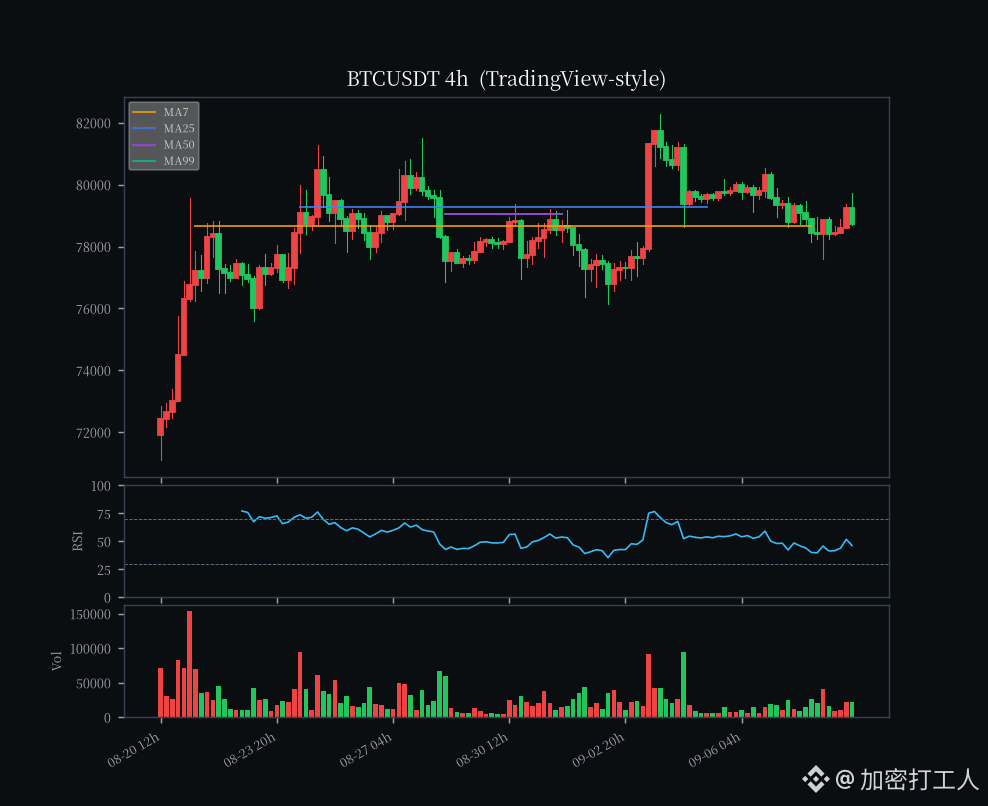
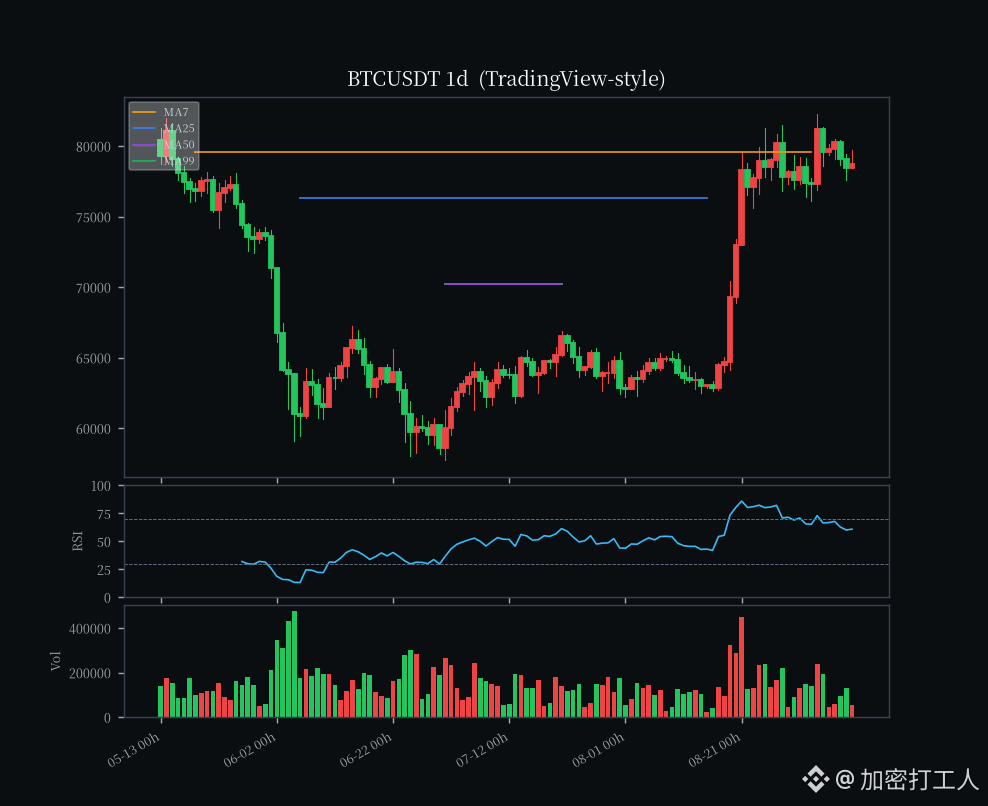
$BTC Current price 78720.8, 24h +0.276%, trading volume about 10.07B USDT (24h perpetual quote, about 127,900 BTC); 24h high 79737.3 / low 77600.1.
This week’s roller coaster has been a bit hard to stomach. On 09-03, a +5.7% candle pushed it to 82.2k. On 09-04, the rally at the highs failed to get follow-through as volume expanded but buyers didn’t hold. Then in the early hours of 09-08, a 77400 spike gave back most of the two-week gains. Today during the day, it pulled back from 78425 to 79246, and just as it tried to turn back to test 79.7k, the late-session selloff drained it again to 78720. One sentence: the 80k psychological integer level failed to be reclaimed; it’s now stuck in a tight range of 78.7k–79.3k, grinding without picking a direction. Volume is 10.07B versus yesterday’s 12.99B—this “sell-off ends with shrinking volume, and rebounds also don’t expand volume” is a typical sign of both bulls and bears watching rather than a trend starting.
📊 Technicals
The daily close is 78729, below the MA7 (79597). MA25 (76329) / MA50 (70208) / MA99 (66664) are far underneath. The medium-term bullish structure hasn’t broken, but MA7 has started to tilt downward. The daily MACD histogram is -936 (dif 2643 pressing down on dea 3111), and the green bars have been getting larger for the fourth day—cooling after the drop from 82.2k is still accelerating. The 4h close is 78738—barely above MA7 (78669), but with the MA25 (79270) / MA50 (79053) double pressure overhead, while MA99 (78843) is almost face-to-face. RSI 46.3 is neutral-to-weak. The 4h MACD histogram is -86 (dif -190 below dea -147), and the green histogram has opened—momentum from last night’s rebound has been given back today. The 1h chart is actually the most active: it closed at 78729, sitting just above MA25 (78698), with MA7 (79066) overhead acting as immediate resistance. RSI is 48, neutral. The 1h MACD histogram is +58 (dif 73 has just crossed above dea 44), the histogram has just turned green/up—there are signs of a stop-and-rebound, but volume hasn’t followed.
Key levels pinned down: 78400 on the downside (near the 20h low/today’s low area) is the first “life gate.” If it loses that, it heads toward 77800 (the early 09-08 spike zone) / 77600 (24h low). A further break below 76329 (daily MA25) would be truly ugly for the medium-term.
On the upside, MA7 1h (79066) is immediate resistance. Only when it clears 79270 (4h MA25) / 79053 (4h MA50) can the 4h weakness be considered reversed. 79737 (24h high) → 80301 (09-06 high) is the real short-term pressure. The 80k integer level is the emotion line in the sand; only a valid reclaim counts as repair.
💧 Derivatives & sentiment
Funding rate is 9.012e-05 (8h, dailyized about +0.027%). It’s slightly positive near the ground—leverage hasn’t “caught fire” and isn’t at the point of crowded chasing longs. It looks healthy. Open interest: 105.5k BTC (about 8.31B USDT). It’s slightly down from last week’s 107k, with price down and OI only微降. Bulls are gradually reducing rather than a liquidation cascade. This “de-leveraging while falling” leaves room for what comes next. The global/top trader long/short ratio and taker active buy/sell interfaces were blocked by geo today (403), so I won’t invent numbers—but judging from funding and OI, leverage conditions are moderate and not likely to have an instant chain-clearing structure.
Fear&Greed 66 (Greed), down from 70+ in the previous days, but still in the greed zone—meaning market sentiment hasn’t collapsed, only cooled from euphoria.
📰 News
The news/search channels don’t work today (web blocked). ETF net daily flows and specific on-chain figures weren’t retrievable—so I won’t fabricate numbers. On the chart, there’s no sign of BTC having a hard “fundamental bomb.” This 82.2k pullback looks more like a failed breakout followed by profit-taking from the 09-08 spike and stop-loss liquidation, not a fundamental bearish catalyst. No major macro data tonight—wait for CPI / Fed commentary later to set the direction.
👉 My view
Read it as: “range grind-the-base after the failed breakout at the 80k level.” 78720 is capped below the daily MA7; on 4h the moving averages press it; on 1h it just turned green again. In the short term it’s weak equilibrium. I’m not chasing shorts and I’m not in a hurry to buy dips: the daily MA structure is still bullish, OI is falling, funding is near the ground, and nothing is structurally broken. 78.4k–78.8k has overlapping support from the 4h MA99. However, until the 80k level is reclaimed, any rebound should be treated first as a window to reduce positions / lower leverage. If you’re in a trade, keep a stop-loss order below 77600; if it breaks and closes weak, withdraw first. If you don’t have a position, don’t buy at 78720; wait for two signals: (1) a volume-backed reclaim that stands back above 79066 (1h MA7) and doesn’t roll over; and (2) the 1h MACD red histogram opening wide to confirm a short-term long. Or (3) if it retests 78400–77800 and holds above without breaking down, then consider entering lightly. The bigger medium-term structure hasn’t broken, but the daily MACD has four straight days of green bars, and the 80k ceiling is sitting above—so treat this phase as “a box/range grind around 78.4k” and keep position sizing small.
Risk warning: BTC is highly volatile and leverage positions are dense; the spike-within-the-range and liquidity risks aren’t low. Funding/OI are only a current snapshot; interfaces for long/short ratio weren’t obtained today, and conditions can change anytime.
For reference only and does not constitute investment advice.
$BTC $ETH $SOL #BTC #行情分析 #合约 #Macroeconomics
This week’s roller coaster has been a bit hard to stomach. On 09-03, a +5.7% candle pushed it to 82.2k. On 09-04, the rally at the highs failed to get follow-through as volume expanded but buyers didn’t hold. Then in the early hours of 09-08, a 77400 spike gave back most of the two-week gains. Today during the day, it pulled back from 78425 to 79246, and just as it tried to turn back to test 79.7k, the late-session selloff drained it again to 78720. One sentence: the 80k psychological integer level failed to be reclaimed; it’s now stuck in a tight range of 78.7k–79.3k, grinding without picking a direction. Volume is 10.07B versus yesterday’s 12.99B—this “sell-off ends with shrinking volume, and rebounds also don’t expand volume” is a typical sign of both bulls and bears watching rather than a trend starting.
📊 Technicals
The daily close is 78729, below the MA7 (79597). MA25 (76329) / MA50 (70208) / MA99 (66664) are far underneath. The medium-term bullish structure hasn’t broken, but MA7 has started to tilt downward. The daily MACD histogram is -936 (dif 2643 pressing down on dea 3111), and the green bars have been getting larger for the fourth day—cooling after the drop from 82.2k is still accelerating. The 4h close is 78738—barely above MA7 (78669), but with the MA25 (79270) / MA50 (79053) double pressure overhead, while MA99 (78843) is almost face-to-face. RSI 46.3 is neutral-to-weak. The 4h MACD histogram is -86 (dif -190 below dea -147), and the green histogram has opened—momentum from last night’s rebound has been given back today. The 1h chart is actually the most active: it closed at 78729, sitting just above MA25 (78698), with MA7 (79066) overhead acting as immediate resistance. RSI is 48, neutral. The 1h MACD histogram is +58 (dif 73 has just crossed above dea 44), the histogram has just turned green/up—there are signs of a stop-and-rebound, but volume hasn’t followed.
Key levels pinned down: 78400 on the downside (near the 20h low/today’s low area) is the first “life gate.” If it loses that, it heads toward 77800 (the early 09-08 spike zone) / 77600 (24h low). A further break below 76329 (daily MA25) would be truly ugly for the medium-term.
On the upside, MA7 1h (79066) is immediate resistance. Only when it clears 79270 (4h MA25) / 79053 (4h MA50) can the 4h weakness be considered reversed. 79737 (24h high) → 80301 (09-06 high) is the real short-term pressure. The 80k integer level is the emotion line in the sand; only a valid reclaim counts as repair.
💧 Derivatives & sentiment
Funding rate is 9.012e-05 (8h, dailyized about +0.027%). It’s slightly positive near the ground—leverage hasn’t “caught fire” and isn’t at the point of crowded chasing longs. It looks healthy. Open interest: 105.5k BTC (about 8.31B USDT). It’s slightly down from last week’s 107k, with price down and OI only微降. Bulls are gradually reducing rather than a liquidation cascade. This “de-leveraging while falling” leaves room for what comes next. The global/top trader long/short ratio and taker active buy/sell interfaces were blocked by geo today (403), so I won’t invent numbers—but judging from funding and OI, leverage conditions are moderate and not likely to have an instant chain-clearing structure.
Fear&Greed 66 (Greed), down from 70+ in the previous days, but still in the greed zone—meaning market sentiment hasn’t collapsed, only cooled from euphoria.
📰 News
The news/search channels don’t work today (web blocked). ETF net daily flows and specific on-chain figures weren’t retrievable—so I won’t fabricate numbers. On the chart, there’s no sign of BTC having a hard “fundamental bomb.” This 82.2k pullback looks more like a failed breakout followed by profit-taking from the 09-08 spike and stop-loss liquidation, not a fundamental bearish catalyst. No major macro data tonight—wait for CPI / Fed commentary later to set the direction.
👉 My view
Read it as: “range grind-the-base after the failed breakout at the 80k level.” 78720 is capped below the daily MA7; on 4h the moving averages press it; on 1h it just turned green again. In the short term it’s weak equilibrium. I’m not chasing shorts and I’m not in a hurry to buy dips: the daily MA structure is still bullish, OI is falling, funding is near the ground, and nothing is structurally broken. 78.4k–78.8k has overlapping support from the 4h MA99. However, until the 80k level is reclaimed, any rebound should be treated first as a window to reduce positions / lower leverage. If you’re in a trade, keep a stop-loss order below 77600; if it breaks and closes weak, withdraw first. If you don’t have a position, don’t buy at 78720; wait for two signals: (1) a volume-backed reclaim that stands back above 79066 (1h MA7) and doesn’t roll over; and (2) the 1h MACD red histogram opening wide to confirm a short-term long. Or (3) if it retests 78400–77800 and holds above without breaking down, then consider entering lightly. The bigger medium-term structure hasn’t broken, but the daily MACD has four straight days of green bars, and the 80k ceiling is sitting above—so treat this phase as “a box/range grind around 78.4k” and keep position sizing small.
Risk warning: BTC is highly volatile and leverage positions are dense; the spike-within-the-range and liquidity risks aren’t low. Funding/OI are only a current snapshot; interfaces for long/short ratio weren’t obtained today, and conditions can change anytime.
For reference only and does not constitute investment advice.
$BTC $ETH $SOL #BTC #行情分析 #合约 #Macroeconomics
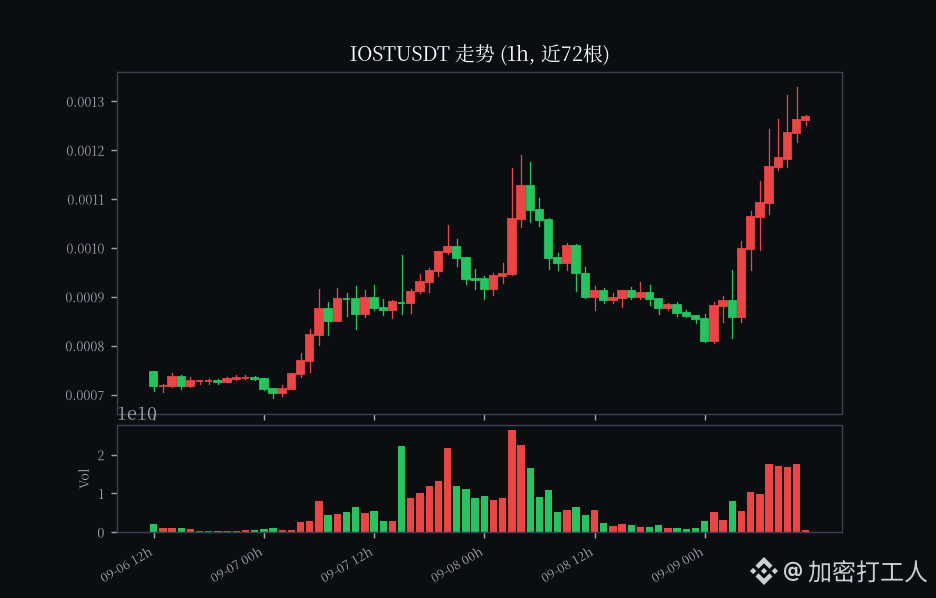
$IOST current price $0.001269, up 111% in a week 🔥
Grinding right at the 7-day high, and then the volume spike in the closing candle suddenly faded 😏
Volume-price divergence + heavy profit-taking, so if it drops, it gets wiped out in one go
I’m shorting $IOST —short first, ask later!
Grinding right at the 7-day high, and then the volume spike in the closing candle suddenly faded 😏
Volume-price divergence + heavy profit-taking, so if it drops, it gets wiped out in one go
I’m shorting $IOST —short first, ask later!
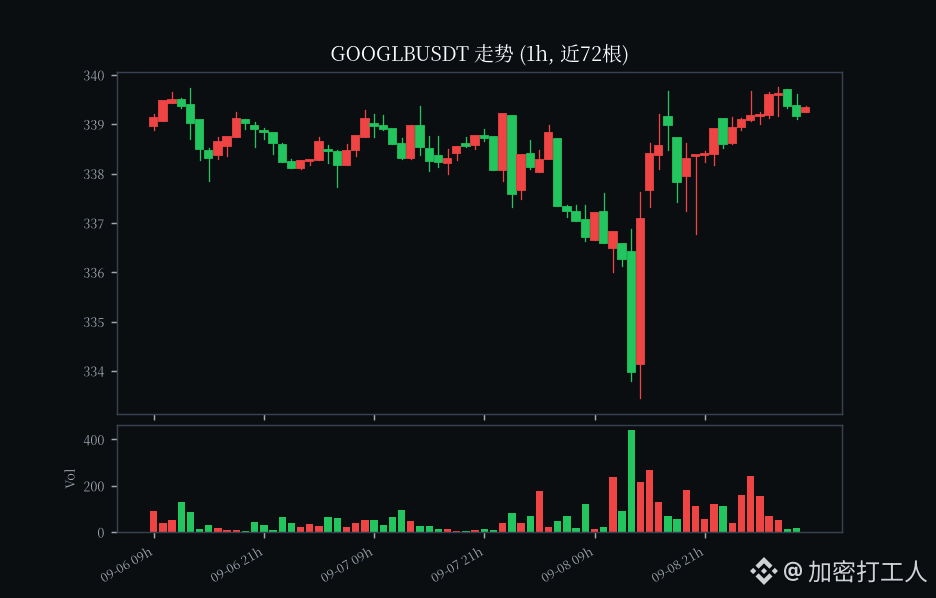
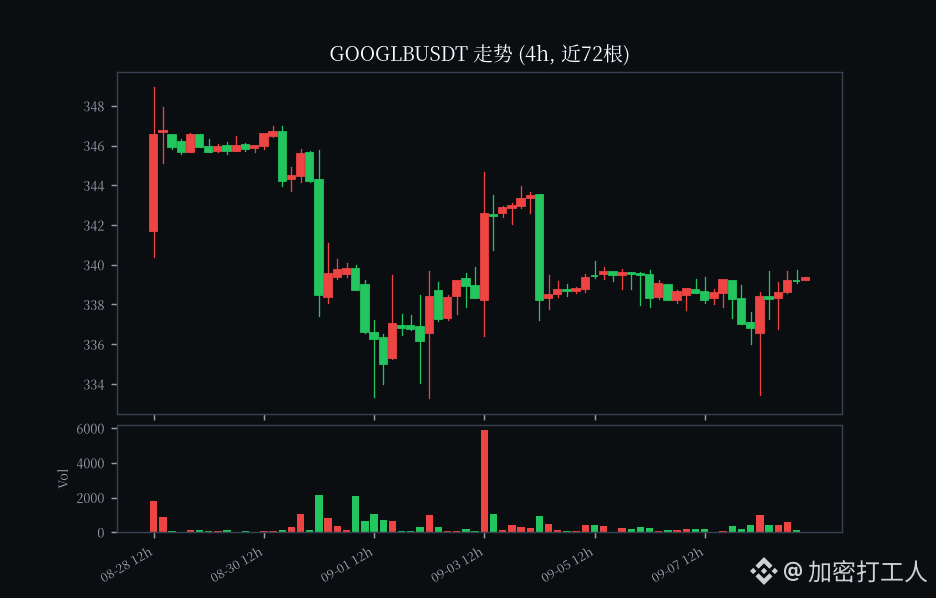
$GOOGLB current price is 339.36, up slightly today by 0.7%, with trading volume just so-so.
Honestly, I’m pretty comfortable holding this Google stock. The core search business is extremely stable. Gemini has been pushed aggressively too, and the cloud business has been continuously winning enterprise deals. Recently, all those new things—AI Overviews, video generation, and the like—have been rolling out at a fast pace. In terms of the search entry point, in the near term, there really isn’t anyone who can shake it.
It’s just that the 340 mark is a bit annoying—it didn’t break through today. The high was 339.75. Volume didn’t really expand either, so I guess it’ll keep hovering around there for another couple of days.
What do you think about this one—do you think it can reach 340? Just having a casual chat—US stocks swing a lot, so manage your position size accordingly.
$GOOGLB $MSFTB #美股 #bStocks #Technology stocks
Honestly, I’m pretty comfortable holding this Google stock. The core search business is extremely stable. Gemini has been pushed aggressively too, and the cloud business has been continuously winning enterprise deals. Recently, all those new things—AI Overviews, video generation, and the like—have been rolling out at a fast pace. In terms of the search entry point, in the near term, there really isn’t anyone who can shake it.
It’s just that the 340 mark is a bit annoying—it didn’t break through today. The high was 339.75. Volume didn’t really expand either, so I guess it’ll keep hovering around there for another couple of days.
What do you think about this one—do you think it can reach 340? Just having a casual chat—US stocks swing a lot, so manage your position size accordingly.
$GOOGLB $MSFTB #美股 #bStocks #Technology stocks
I just completed a new transaction! Copy my investment portfolio in one click👇
加密打工人
Close Position
IOSTUSDT
PNL(USDT)
-11.66
Close Price
0.00117855
$ASTER current price 0.763
In the afternoon, I’ll take everyone to break down a hot Alpha on-chain—ASTER (Aster).
Project highlights
Aster is a decentralized perpetual contract DEX on the BNB Chain (former Astherus). After recently launching on Binance Alpha, its popularity has continued to rise. It has also benefited from traffic tailwinds such as Alpha points and airdrop expectations, making it a relatively new and recognizable face in the Alpha sector during this period.
Market data
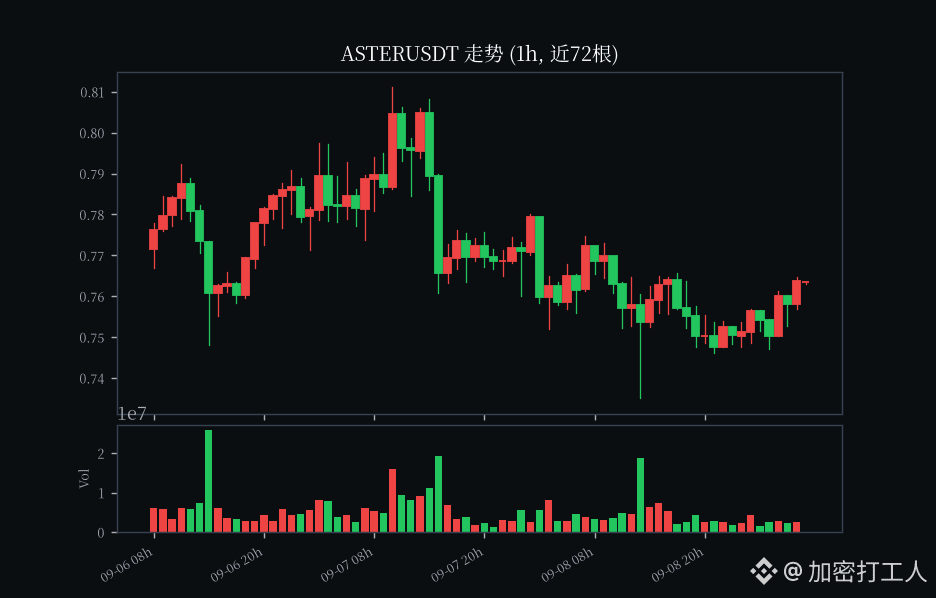
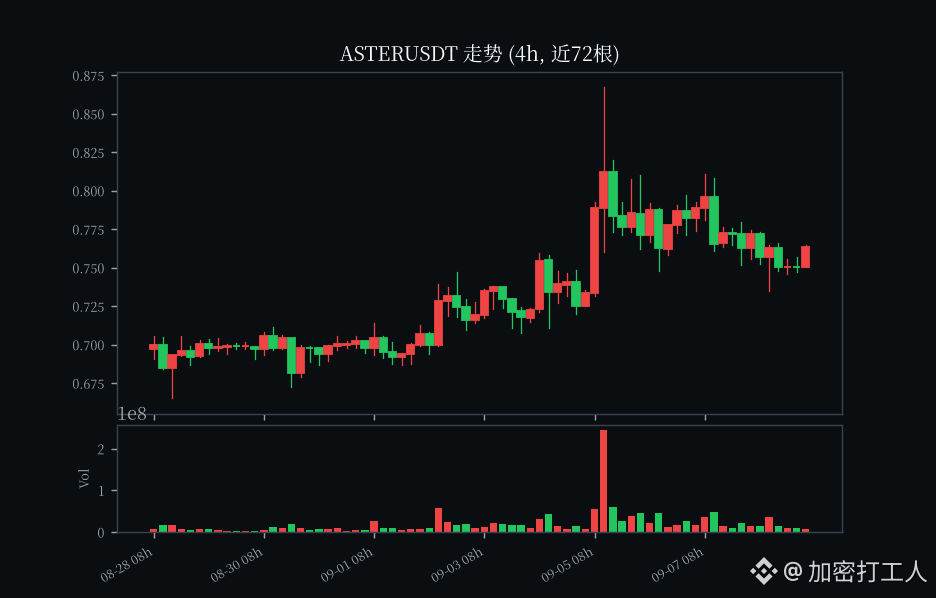
Current price is 0.763. In the past 24h, it’s up slightly by +0.13%. Trading volume is about 13.07 million USDT. The 24h high-low range is 0.735–0.775. Overall, it’s consolidating sideways with shrinking volume and stabilizing. The broader market BTC is currently around 79,000. The renewed risk appetite is clearly beneficial for it.
Opportunities
Looking at the 1h and 4h charts, price is sticking near the lower end of the range while volume is contracting—this is a typical “silent buildup” pattern. If it breaks upward and gains volume to stand above the 0.775 upper boundary, short-term upside opens up. More aggressive traders can place limit orders to set a trap near 0.735.
Risk warning
Small-cap Alpha coins are highly volatile and have thin depth. Both the news flow and the unlocking schedule can easily cause a sell-off. Don’t get carried away with position sizing; putting the stop-loss below 0.72 is safer.
$ASTER $BNB #币安Alpha #刷分 #山寨币
In the afternoon, I’ll take everyone to break down a hot Alpha on-chain—ASTER (Aster).
Project highlights
Aster is a decentralized perpetual contract DEX on the BNB Chain (former Astherus). After recently launching on Binance Alpha, its popularity has continued to rise. It has also benefited from traffic tailwinds such as Alpha points and airdrop expectations, making it a relatively new and recognizable face in the Alpha sector during this period.
Market data
Current price is 0.763. In the past 24h, it’s up slightly by +0.13%. Trading volume is about 13.07 million USDT. The 24h high-low range is 0.735–0.775. Overall, it’s consolidating sideways with shrinking volume and stabilizing. The broader market BTC is currently around 79,000. The renewed risk appetite is clearly beneficial for it.
Opportunities
Looking at the 1h and 4h charts, price is sticking near the lower end of the range while volume is contracting—this is a typical “silent buildup” pattern. If it breaks upward and gains volume to stand above the 0.775 upper boundary, short-term upside opens up. More aggressive traders can place limit orders to set a trap near 0.735.
Risk warning
Small-cap Alpha coins are highly volatile and have thin depth. Both the news flow and the unlocking schedule can easily cause a sell-off. Don’t get carried away with position sizing; putting the stop-loss below 0.72 is safer.
$ASTER $BNB #币安Alpha #刷分 #山寨币
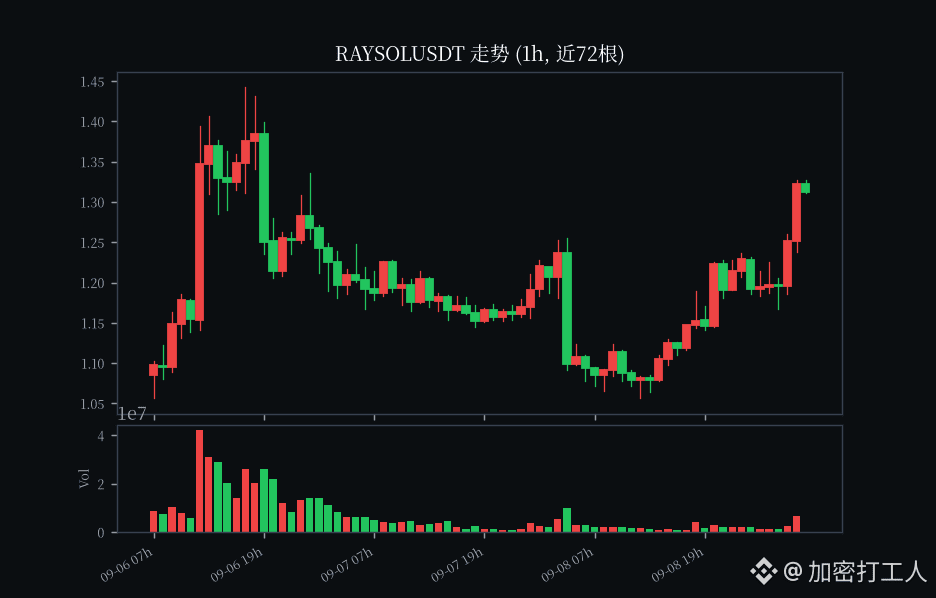
$RAYSOL current price 1.317, up 60% on a dry gain over the past week 💥
In the last 24 hours it surged again by 19%. The final two hourly candles rocketed from 1.19 straight to 1.32—single-candle volume hit 6.63 million. At the close it suddenly spiked on massive volume; anyone who knows understands this is distribution 😏
The 7-day high is 1.44 right overhead—profit-taking is heavy, scary. One take-profit sell order can crack it open.
I went short on $RAYSOL —brothers, follow this short setup 🔥
$SOL #做空 #合约 #altcoin
In the last 24 hours it surged again by 19%. The final two hourly candles rocketed from 1.19 straight to 1.32—single-candle volume hit 6.63 million. At the close it suddenly spiked on massive volume; anyone who knows understands this is distribution 😏
The 7-day high is 1.44 right overhead—profit-taking is heavy, scary. One take-profit sell order can crack it open.
I went short on $RAYSOL —brothers, follow this short setup 🔥
$SOL #做空 #合约 #altcoin
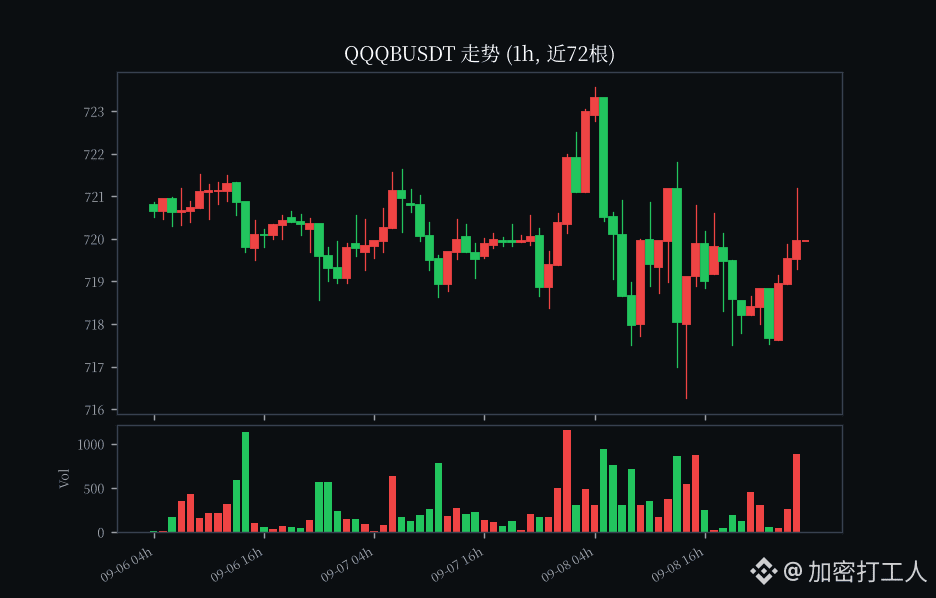
$QQQB current price 719.96
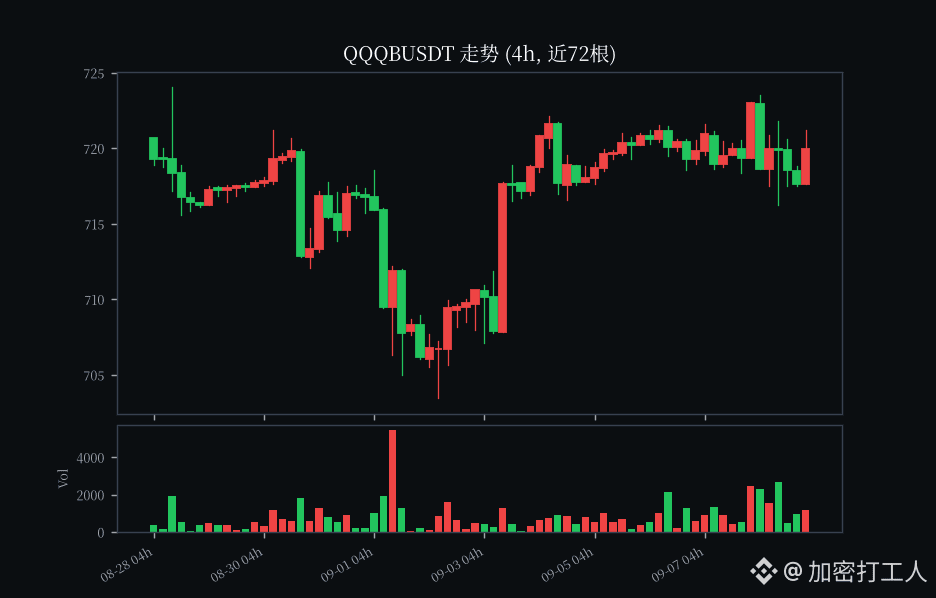
Today it basically moved sideways; over the past 24 hours it’s down 0.16%, oscillating between 716 and 723. As for the Nasdaq, I think it’s fairly stable—nothing weird happened.
Personally, I feel this stock is pretty suitable to hold without getting itchy. For one thing, expectations of rate cuts are still there; when money gets cheaper, it’s easier to tell a good story with tech stock valuations. For another, the big tech companies’ AI investment hasn’t stopped—index weights are propped up by them.
But honestly, at this price level it’s a bit annoying—neither up nor down enough. What do you think? Keep holding and doing nothing, or take some profits first?
U.S. stocks can be volatile. Manage your position sizes yourself. Above are just a couple of off-the-cuff comments for reference.
$QQQB $NVDAB #美股 #bStocks #Nasdaq
Today it basically moved sideways; over the past 24 hours it’s down 0.16%, oscillating between 716 and 723. As for the Nasdaq, I think it’s fairly stable—nothing weird happened.
Personally, I feel this stock is pretty suitable to hold without getting itchy. For one thing, expectations of rate cuts are still there; when money gets cheaper, it’s easier to tell a good story with tech stock valuations. For another, the big tech companies’ AI investment hasn’t stopped—index weights are propped up by them.
But honestly, at this price level it’s a bit annoying—neither up nor down enough. What do you think? Keep holding and doing nothing, or take some profits first?
U.S. stocks can be volatile. Manage your position sizes yourself. Above are just a couple of off-the-cuff comments for reference.
$QQQB $NVDAB #美股 #bStocks #Nasdaq
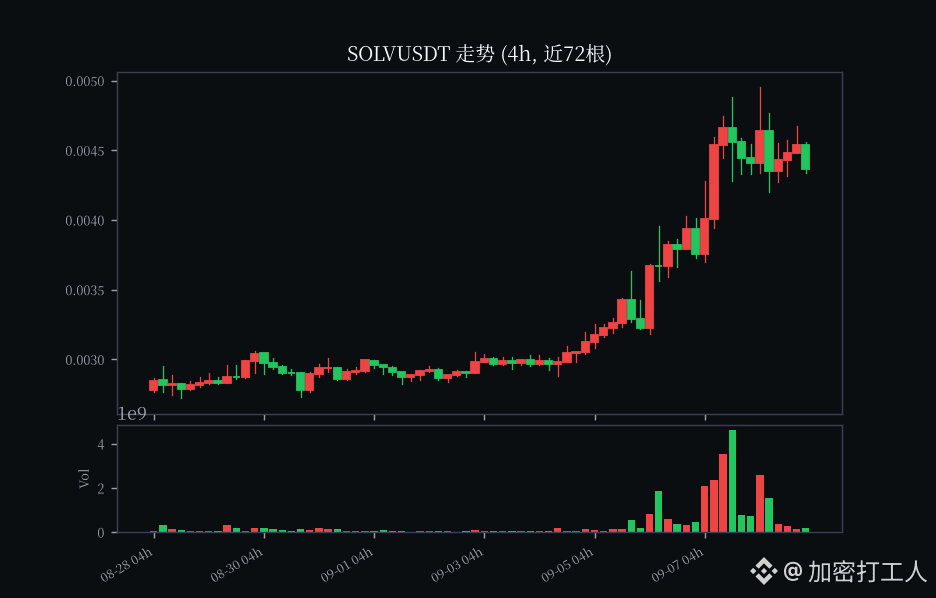
$SOLV current price 0.00436
Binance Alpha Morning Brief 🌅
Today we selected Solv Protocol (SOLV), doing the BTC interest-bearing layer play—turn BTC into an on-chain yield-bearing asset. In Alpha, this is considered a relatively steady narrative.
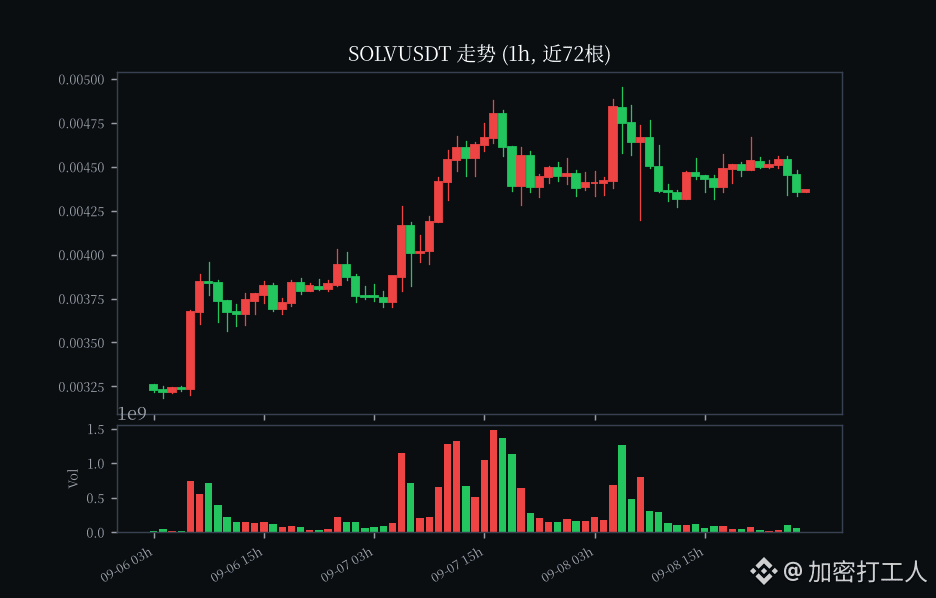
In the past 24h, it’s down slightly by 0.46%. Current price: 0.00436. Today’s high/low: 0.00495 / 0.00421, with a relatively small intraday range. 24h trading volume is about 5.4 million USDT. Volume is somewhat moderate, and the capital is still observing today.
On the 1h chart, the short-term trend is consolidating sideways at a low level. On the 4h chart, it’s in a stabilization phase after a pullback. There hasn’t been a breakout with volume yet—so for now, we’ll watch for range-bound trading.
Which coin are you primarily trading in Alpha today? Chat in the comments 👇
⚠️ Risk warning: The Alpha sector can be highly volatile and liquidity is thin. The above is for market sharing only and not investment advice—please do your own research (DYOR).
$SOLV $BTC #币安Alpha #刷分 #shanzhai coin
Binance Alpha Morning Brief 🌅
Today we selected Solv Protocol (SOLV), doing the BTC interest-bearing layer play—turn BTC into an on-chain yield-bearing asset. In Alpha, this is considered a relatively steady narrative.
In the past 24h, it’s down slightly by 0.46%. Current price: 0.00436. Today’s high/low: 0.00495 / 0.00421, with a relatively small intraday range. 24h trading volume is about 5.4 million USDT. Volume is somewhat moderate, and the capital is still observing today.
On the 1h chart, the short-term trend is consolidating sideways at a low level. On the 4h chart, it’s in a stabilization phase after a pullback. There hasn’t been a breakout with volume yet—so for now, we’ll watch for range-bound trading.
Which coin are you primarily trading in Alpha today? Chat in the comments 👇
⚠️ Risk warning: The Alpha sector can be highly volatile and liquidity is thin. The above is for market sharing only and not investment advice—please do your own research (DYOR).
$SOLV $BTC #币安Alpha #刷分 #shanzhai coin
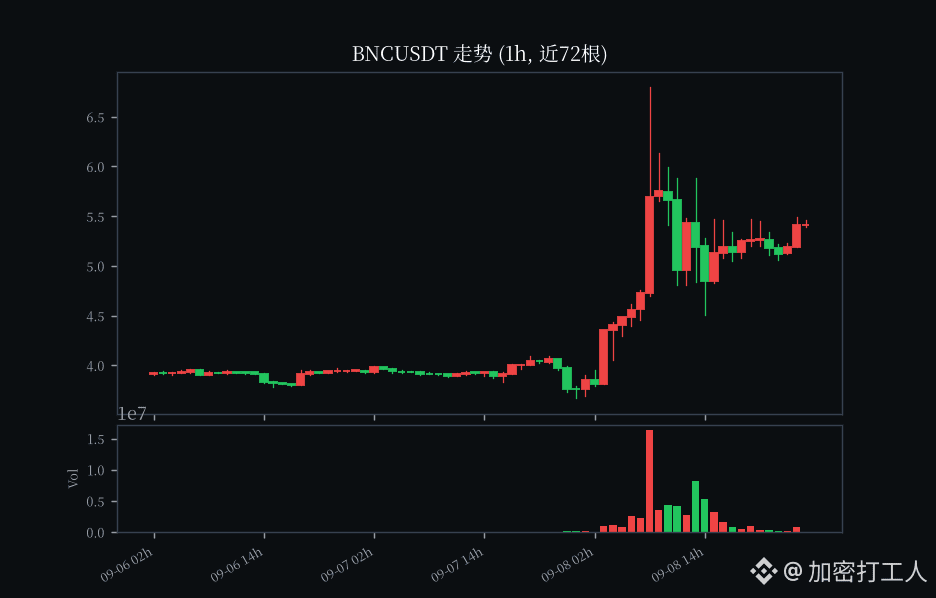
$BNC current price is $5.41, a one-week surge of 92%—jumping from 2.75 to 6.79, almost doubling 💀
It then got dumped from the high of 6.79 back to 5.4, a 20% pullback—definitely sluggish
What’s even more ruthless is the volume: 24h shows $330 million in reported volume, looking massive, but in the past few hours trading has dropped from over a million to just a few tens of thousands—bears lose heart 🔥
Profit-taking is so heavy it can smash through the floor—I’m shorting $BNC , short first as a respect ⚠️
It then got dumped from the high of 6.79 back to 5.4, a 20% pullback—definitely sluggish
What’s even more ruthless is the volume: 24h shows $330 million in reported volume, looking massive, but in the past few hours trading has dropped from over a million to just a few tens of thousands—bears lose heart 🔥
Profit-taking is so heavy it can smash through the floor—I’m shorting $BNC , short first as a respect ⚠️
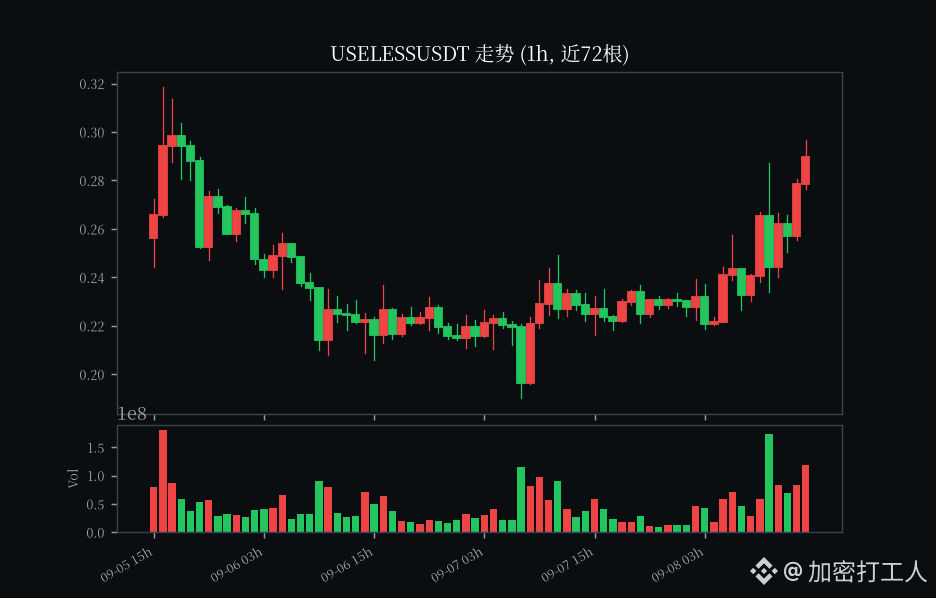
$USELESS current price 0.287; it surged +221% within a week. Today it surged again by 28%, and it's only 9% away from its 7-day high. The rally got so wild that longs were squeezed into liquidation—let’s get out of the way first. Wait until it stops being able to push further, then we’ll talk. For reference only, not investment advice.
$USELESS $BTC #做空 #合约 #altcoin
$USELESS $BTC #做空 #合约 #altcoin
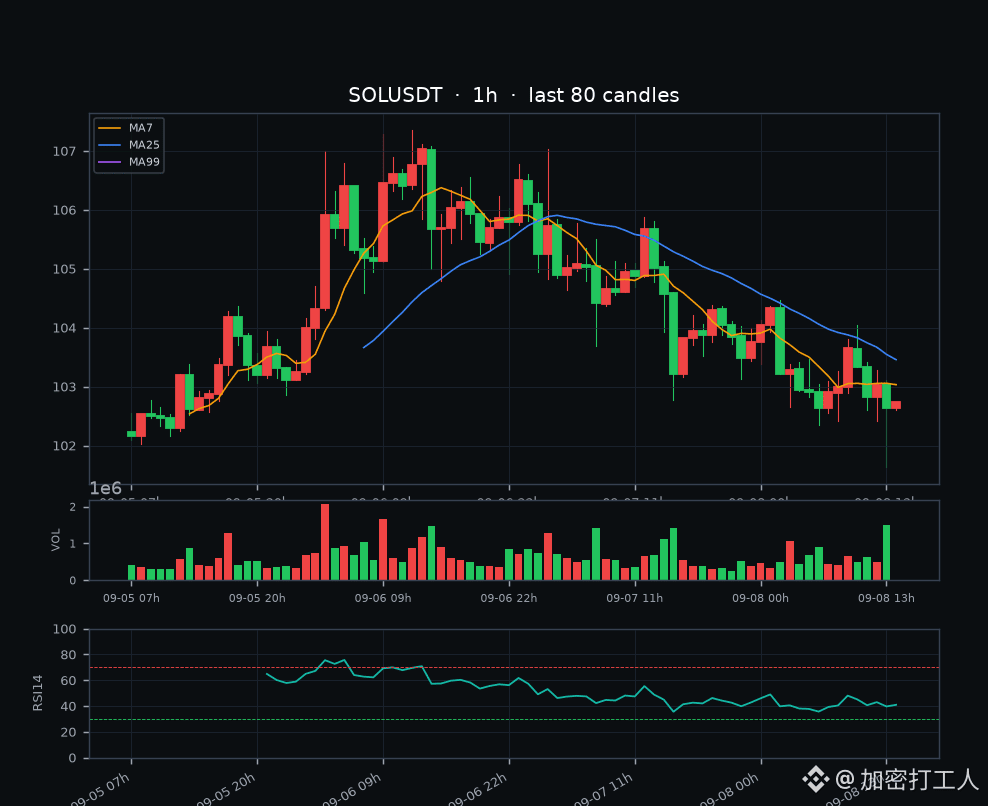
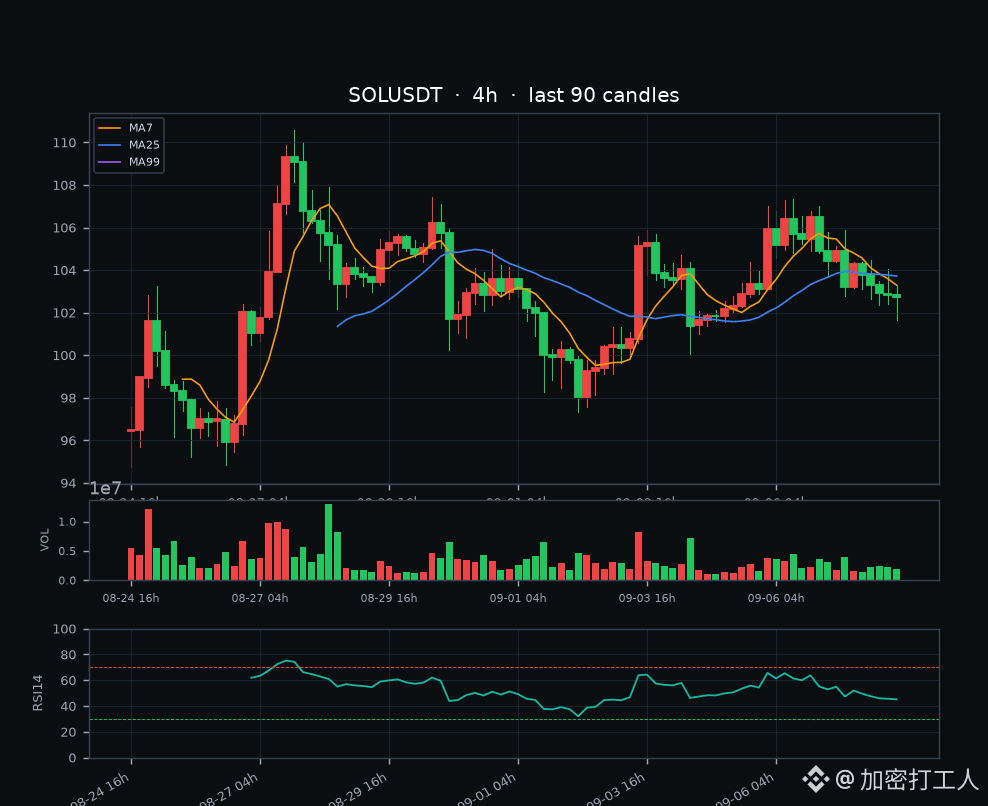
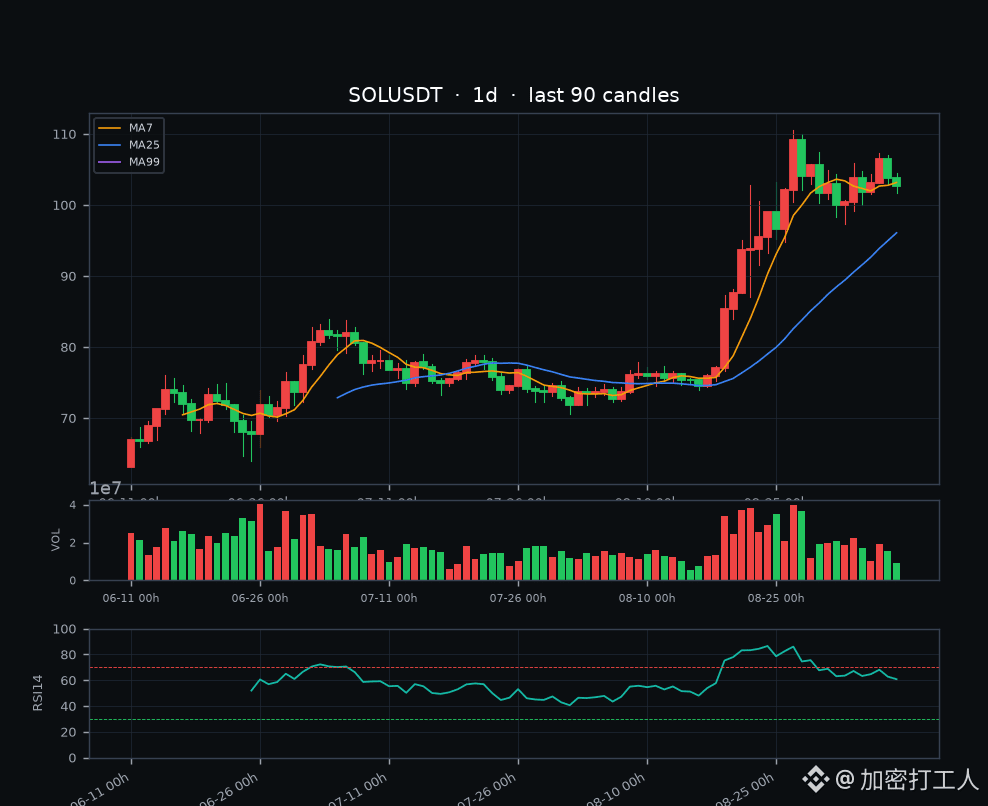
$SOL current price 102.69, 24h -2.23%, trading volume about $1.51B (contracts)
Good evening. Today SOL is following the high-level pullback playbook. Intraday, it ground down from above 105 to a low of 101.6. Now it’s hovering around 102.7. In the last 24 hours it’s down 2.2%, which is a normal profit-taking move from the big range rally of the move from 70 to 110.
📊 Technicals
The shorter-term timeframe is clearly weak. On the 1-hour chart, price has already dropped below MA7 (103.0), MA25 (103.5), and MA50 (104.5). All three moving averages are sloping downward—near term, the bears control the board. RSI is around 40: not oversold, but it’s also not showing signs of stabilization. The more important 4-hour level: price at 102.7 is right around MA50 (102.8). This is the line in the sand—if it reclaims and holds above, there’s a chance for a rebound toward 104.5–105. If it can’t hold, it may slide toward the 100 psychological level. The daily chart hasn’t broken: at 102.7, price is still far above MA25 (96.1) and MA50 (85.5), so the larger uptrend structure remains intact. However, the daily MACD histogram turned green this time—it's the first time momentum attenuation is showing after the rally from 70. Stay cautious.
💧 Derivatives & sentiment
Funding rate is -0.006%, basically neutral but slightly negative. This suggests the recent push wasn’t propped up by perpetual leverage “forcing” the price higher—it's not overheated. But watch positioning: the long/short account ratio across the network is 66.8% longs, with the ratio 2.0, which is a crowded long setup. The taker buy/sell ratio is only 0.898: active sell volume is putting pressure on active buys, and short-term bears are gaining strength. OI is about 7.98M SOL, not small.
⛓️ On-chain & relative strength
On-chain TVL is about $5.89B, slightly down from recent highs but still fairly stable in terms of network activity. SOL/BTC is -0.57% today at 0.001317—relative to BTC, SOL is a bit weaker. But within this larger trend, SOL is still the stronger side versus BTC. Market sentiment (Fear&Greed) is 69, in the greed zone—risk appetite hasn’t collapsed.
📰 News
This wave of public news sources didn’t update in real time (data-source interface is restricted), so I’ll only provide what I can confirm and won’t make up specific news. The chart itself has already made the picture clear: a high-volume pullback with crowded longs, but not to the point of mania.
👉 My take
Short-term looks like a bearish range/sideways chop. Pay attention to the two-layer support: 102.8 (4h MA50) and 101.6 (today’s low). If 101.6 breaks, it opens the path to 100 and then the 97.3 prior-low area. On the upside, 104.5–105 is the first resistance for a rebound; only after 107.4 can it be considered a return to strength. My bias: as long as the daily trend hasn’t broken, this pullback toward 96–100 looks more like a “get on board” opportunity than an escape—though longs are too crowded, so don’t go all-in at once; scale in. If you’re heavily positioned, you can trim a bit on the rebound above 104.5 to lock in profit.
Key levels
Support: 101.6 / 100 / 97.3 / 96
Resistance: 104.5 / 107.4 / 110.6
Risk warning: Longs are crowded; the daily MACD first shows green bars. If US stocks or the broader market turns weaker, SOL’s upside bounce elasticity will be larger and drawdowns may happen faster. For reference only—this is not investment advice.
$SOL $BTC #SOL #行情分析 #合约 #山寨季
Good evening. Today SOL is following the high-level pullback playbook. Intraday, it ground down from above 105 to a low of 101.6. Now it’s hovering around 102.7. In the last 24 hours it’s down 2.2%, which is a normal profit-taking move from the big range rally of the move from 70 to 110.
📊 Technicals
The shorter-term timeframe is clearly weak. On the 1-hour chart, price has already dropped below MA7 (103.0), MA25 (103.5), and MA50 (104.5). All three moving averages are sloping downward—near term, the bears control the board. RSI is around 40: not oversold, but it’s also not showing signs of stabilization. The more important 4-hour level: price at 102.7 is right around MA50 (102.8). This is the line in the sand—if it reclaims and holds above, there’s a chance for a rebound toward 104.5–105. If it can’t hold, it may slide toward the 100 psychological level. The daily chart hasn’t broken: at 102.7, price is still far above MA25 (96.1) and MA50 (85.5), so the larger uptrend structure remains intact. However, the daily MACD histogram turned green this time—it's the first time momentum attenuation is showing after the rally from 70. Stay cautious.
💧 Derivatives & sentiment
Funding rate is -0.006%, basically neutral but slightly negative. This suggests the recent push wasn’t propped up by perpetual leverage “forcing” the price higher—it's not overheated. But watch positioning: the long/short account ratio across the network is 66.8% longs, with the ratio 2.0, which is a crowded long setup. The taker buy/sell ratio is only 0.898: active sell volume is putting pressure on active buys, and short-term bears are gaining strength. OI is about 7.98M SOL, not small.
⛓️ On-chain & relative strength
On-chain TVL is about $5.89B, slightly down from recent highs but still fairly stable in terms of network activity. SOL/BTC is -0.57% today at 0.001317—relative to BTC, SOL is a bit weaker. But within this larger trend, SOL is still the stronger side versus BTC. Market sentiment (Fear&Greed) is 69, in the greed zone—risk appetite hasn’t collapsed.
📰 News
This wave of public news sources didn’t update in real time (data-source interface is restricted), so I’ll only provide what I can confirm and won’t make up specific news. The chart itself has already made the picture clear: a high-volume pullback with crowded longs, but not to the point of mania.
👉 My take
Short-term looks like a bearish range/sideways chop. Pay attention to the two-layer support: 102.8 (4h MA50) and 101.6 (today’s low). If 101.6 breaks, it opens the path to 100 and then the 97.3 prior-low area. On the upside, 104.5–105 is the first resistance for a rebound; only after 107.4 can it be considered a return to strength. My bias: as long as the daily trend hasn’t broken, this pullback toward 96–100 looks more like a “get on board” opportunity than an escape—though longs are too crowded, so don’t go all-in at once; scale in. If you’re heavily positioned, you can trim a bit on the rebound above 104.5 to lock in profit.
Key levels
Support: 101.6 / 100 / 97.3 / 96
Resistance: 104.5 / 107.4 / 110.6
Risk warning: Longs are crowded; the daily MACD first shows green bars. If US stocks or the broader market turns weaker, SOL’s upside bounce elasticity will be larger and drawdowns may happen faster. For reference only—this is not investment advice.
$SOL $BTC #SOL #行情分析 #合约 #山寨季
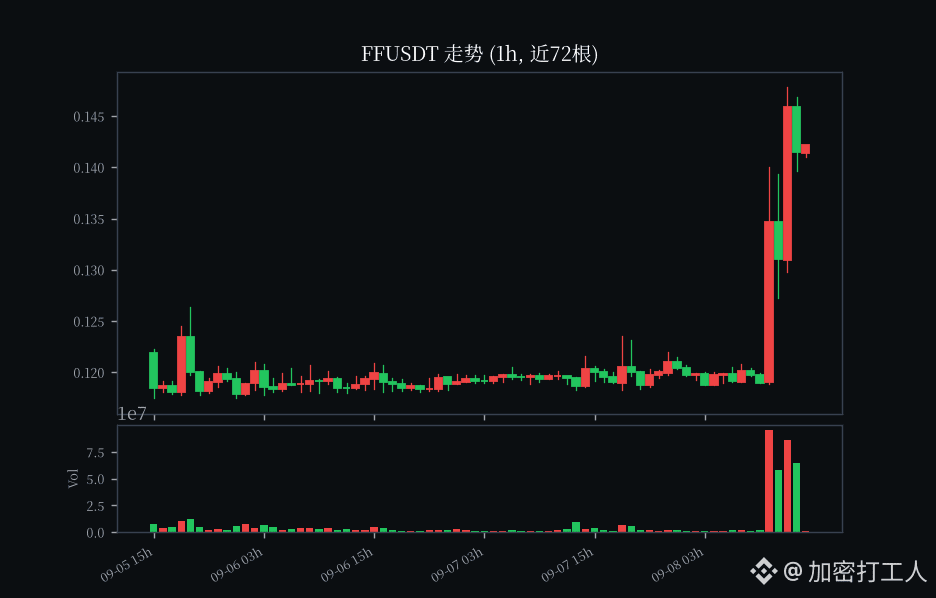
$FF current price $0.141, 24h and it surged up nearly 19% again. In a week it’s up to +64.7%. It’s just one breath away from the 7-day high of $0.148 💀
The funding rate is positive at 0.005%, but at this level it’s sitting right under the previous high, with a thick profit-taking wall that can smash people. The longs are all eating—so I’ll be the one to flip the table 😏
Straight up: I went short $FF . The volume is over $46 million in a day. The pump is being propped up purely by sentiment—once the longs start giving it back, it’s an A-letter killing. Short first, admire later. I’ll hit the sell button and let the dumping speak.
The funding rate is positive at 0.005%, but at this level it’s sitting right under the previous high, with a thick profit-taking wall that can smash people. The longs are all eating—so I’ll be the one to flip the table 😏
Straight up: I went short $FF . The volume is over $46 million in a day. The pump is being propped up purely by sentiment—once the longs start giving it back, it’s an A-letter killing. Short first, admire later. I’ll hit the sell button and let the dumping speak.
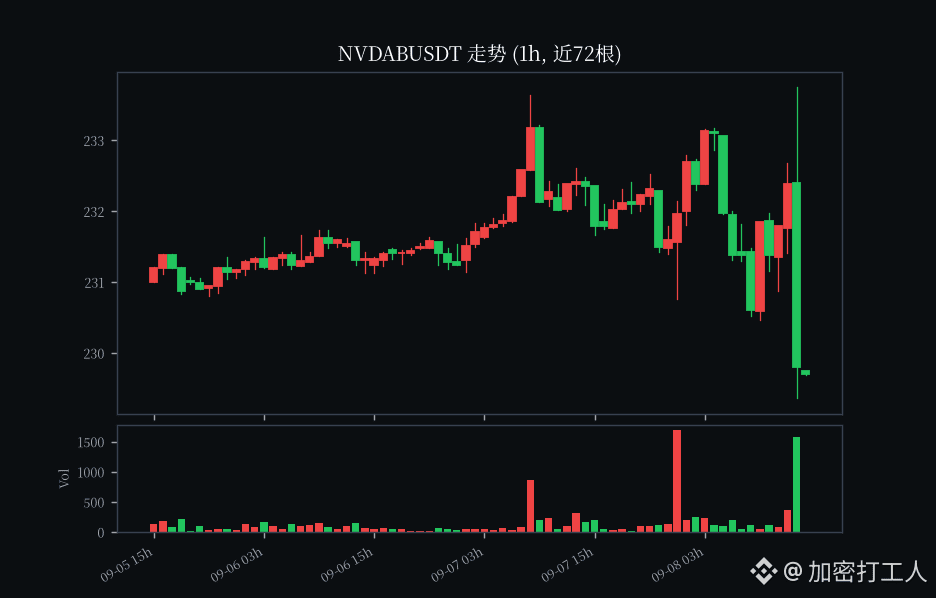
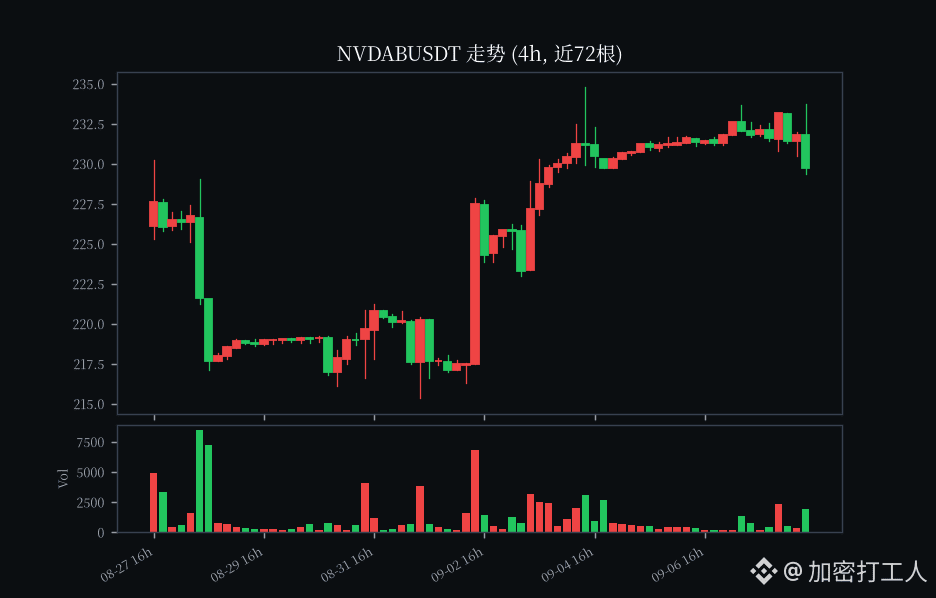
$NVDAB current price 229.69. It softened a bit today; down 1.17% over the past 24h. Trading volume is about 1.42 million, and the volume isn’t that big.
I’m a bit torn about this NVDA stock. The earlier surge pushed it up to over 233, and now it’s fallen back to hover around 230. I really can’t tell whether I should add more now or wait.
The reasons I’m still willing to hold are only two. First, on the AI side, capital expenditures haven’t shown a turnaround yet. A few cloud companies are still doing everything they can to stock up on chips—NV’s chips are still the most appealing. Second, once Blackwell production ramps up, the data center side is still moving upward, and the orders still look fully booked.
At 230, calling it cheap would be misleading—not cheap at all—but as long as the trend hasn’t broken, I’ll hold and see for now. What do you think about this one? Just chatting—U.S. stocks can be volatile, so weigh your position size yourself.
$NVDAB $AVGOB #美股 #bStocks #AI stocks
I’m a bit torn about this NVDA stock. The earlier surge pushed it up to over 233, and now it’s fallen back to hover around 230. I really can’t tell whether I should add more now or wait.
The reasons I’m still willing to hold are only two. First, on the AI side, capital expenditures haven’t shown a turnaround yet. A few cloud companies are still doing everything they can to stock up on chips—NV’s chips are still the most appealing. Second, once Blackwell production ramps up, the data center side is still moving upward, and the orders still look fully booked.
At 230, calling it cheap would be misleading—not cheap at all—but as long as the trend hasn’t broken, I’ll hold and see for now. What do you think about this one? Just chatting—U.S. stocks can be volatile, so weigh your position size yourself.
$NVDAB $AVGOB #美股 #bStocks #AI stocks
Log in to explore more content